The response time of a monitor is the amount of time it takes for pixels to switch from one color to another. Although this doesn't sound like it has a big effect when put that way, it greatly impacts your experience using the monitor, especially if you're a gamer. The response time has a big impact on the motion handling of the display, as a monitor with a slow response time can look distracting when there are a ton of fast-moving objects.
We test the response time of monitors by taking a picture of a test pattern, then using a specialized tool that measures the response time for different transitions. We test it with the variable refresh rate (VRR) feature enabled, and if the monitor offers different overdrive settings, we also test those.
If you want to see our test for TVs, check our motion blur of TVs article.
What Is The Response Time?
The response time is the amount of time it takes for pixels to change from one color to the next. When there's constant movement on the screen, like in movies or games, the pixels are always changing colors, so a monitor needs to keep up with this movement. The faster the response time, the better motion looks, and a slow response time leads to smearing.
When It Matters
A quick response time is helpful for most people using their monitor, especially for gaming. It isn't as important if you're typing all day and there's less movement on the screen, but motion blur can also be noticeable while scrolling through documents or web pages. Like most things related to technology, there are trade-offs when something is too good. A fast response time can lead to stutter as the image stays on the screen for longer than expected, but this isn't so much a concern with monitors, but rather with TVs when you're watching movies.
Some monitors can also have such a quick response time that it overshoots the target color and gets too bright. This leads to inverse ghosting, which causes a white trail behind fast-moving objects, and could get distracting.
Our Tests
There are a few steps to measuring the response time of a monitor. As part of Test Bench 1.2, we now enable the monitor's variable refresh rate while measuring the response time, as this is how we expect most people to use it. First, we play a test video with a fast-moving object and take a picture of it. We then use a special tool connected to a PC that measures the response time while displaying different shades of gray as they transition from one shade to another. The software we use automatically generates graphs and tables for the measurements of the different transitions.
We repeat this process with the different overdrive settings that the monitor has to offer, and we use our recommended overdrive setting as the final results while also publishing the other results in the text. If the monitor can't use the overdrive settings at the same time as VRR, then we just use the results with VRR enabled, as that's how most gamers will use it. We also measure the response time at the monitor's max refresh rate, at 120Hz, and at 60Hz. This gives us an idea of how it handles motion with high-frame content versus a lower one.
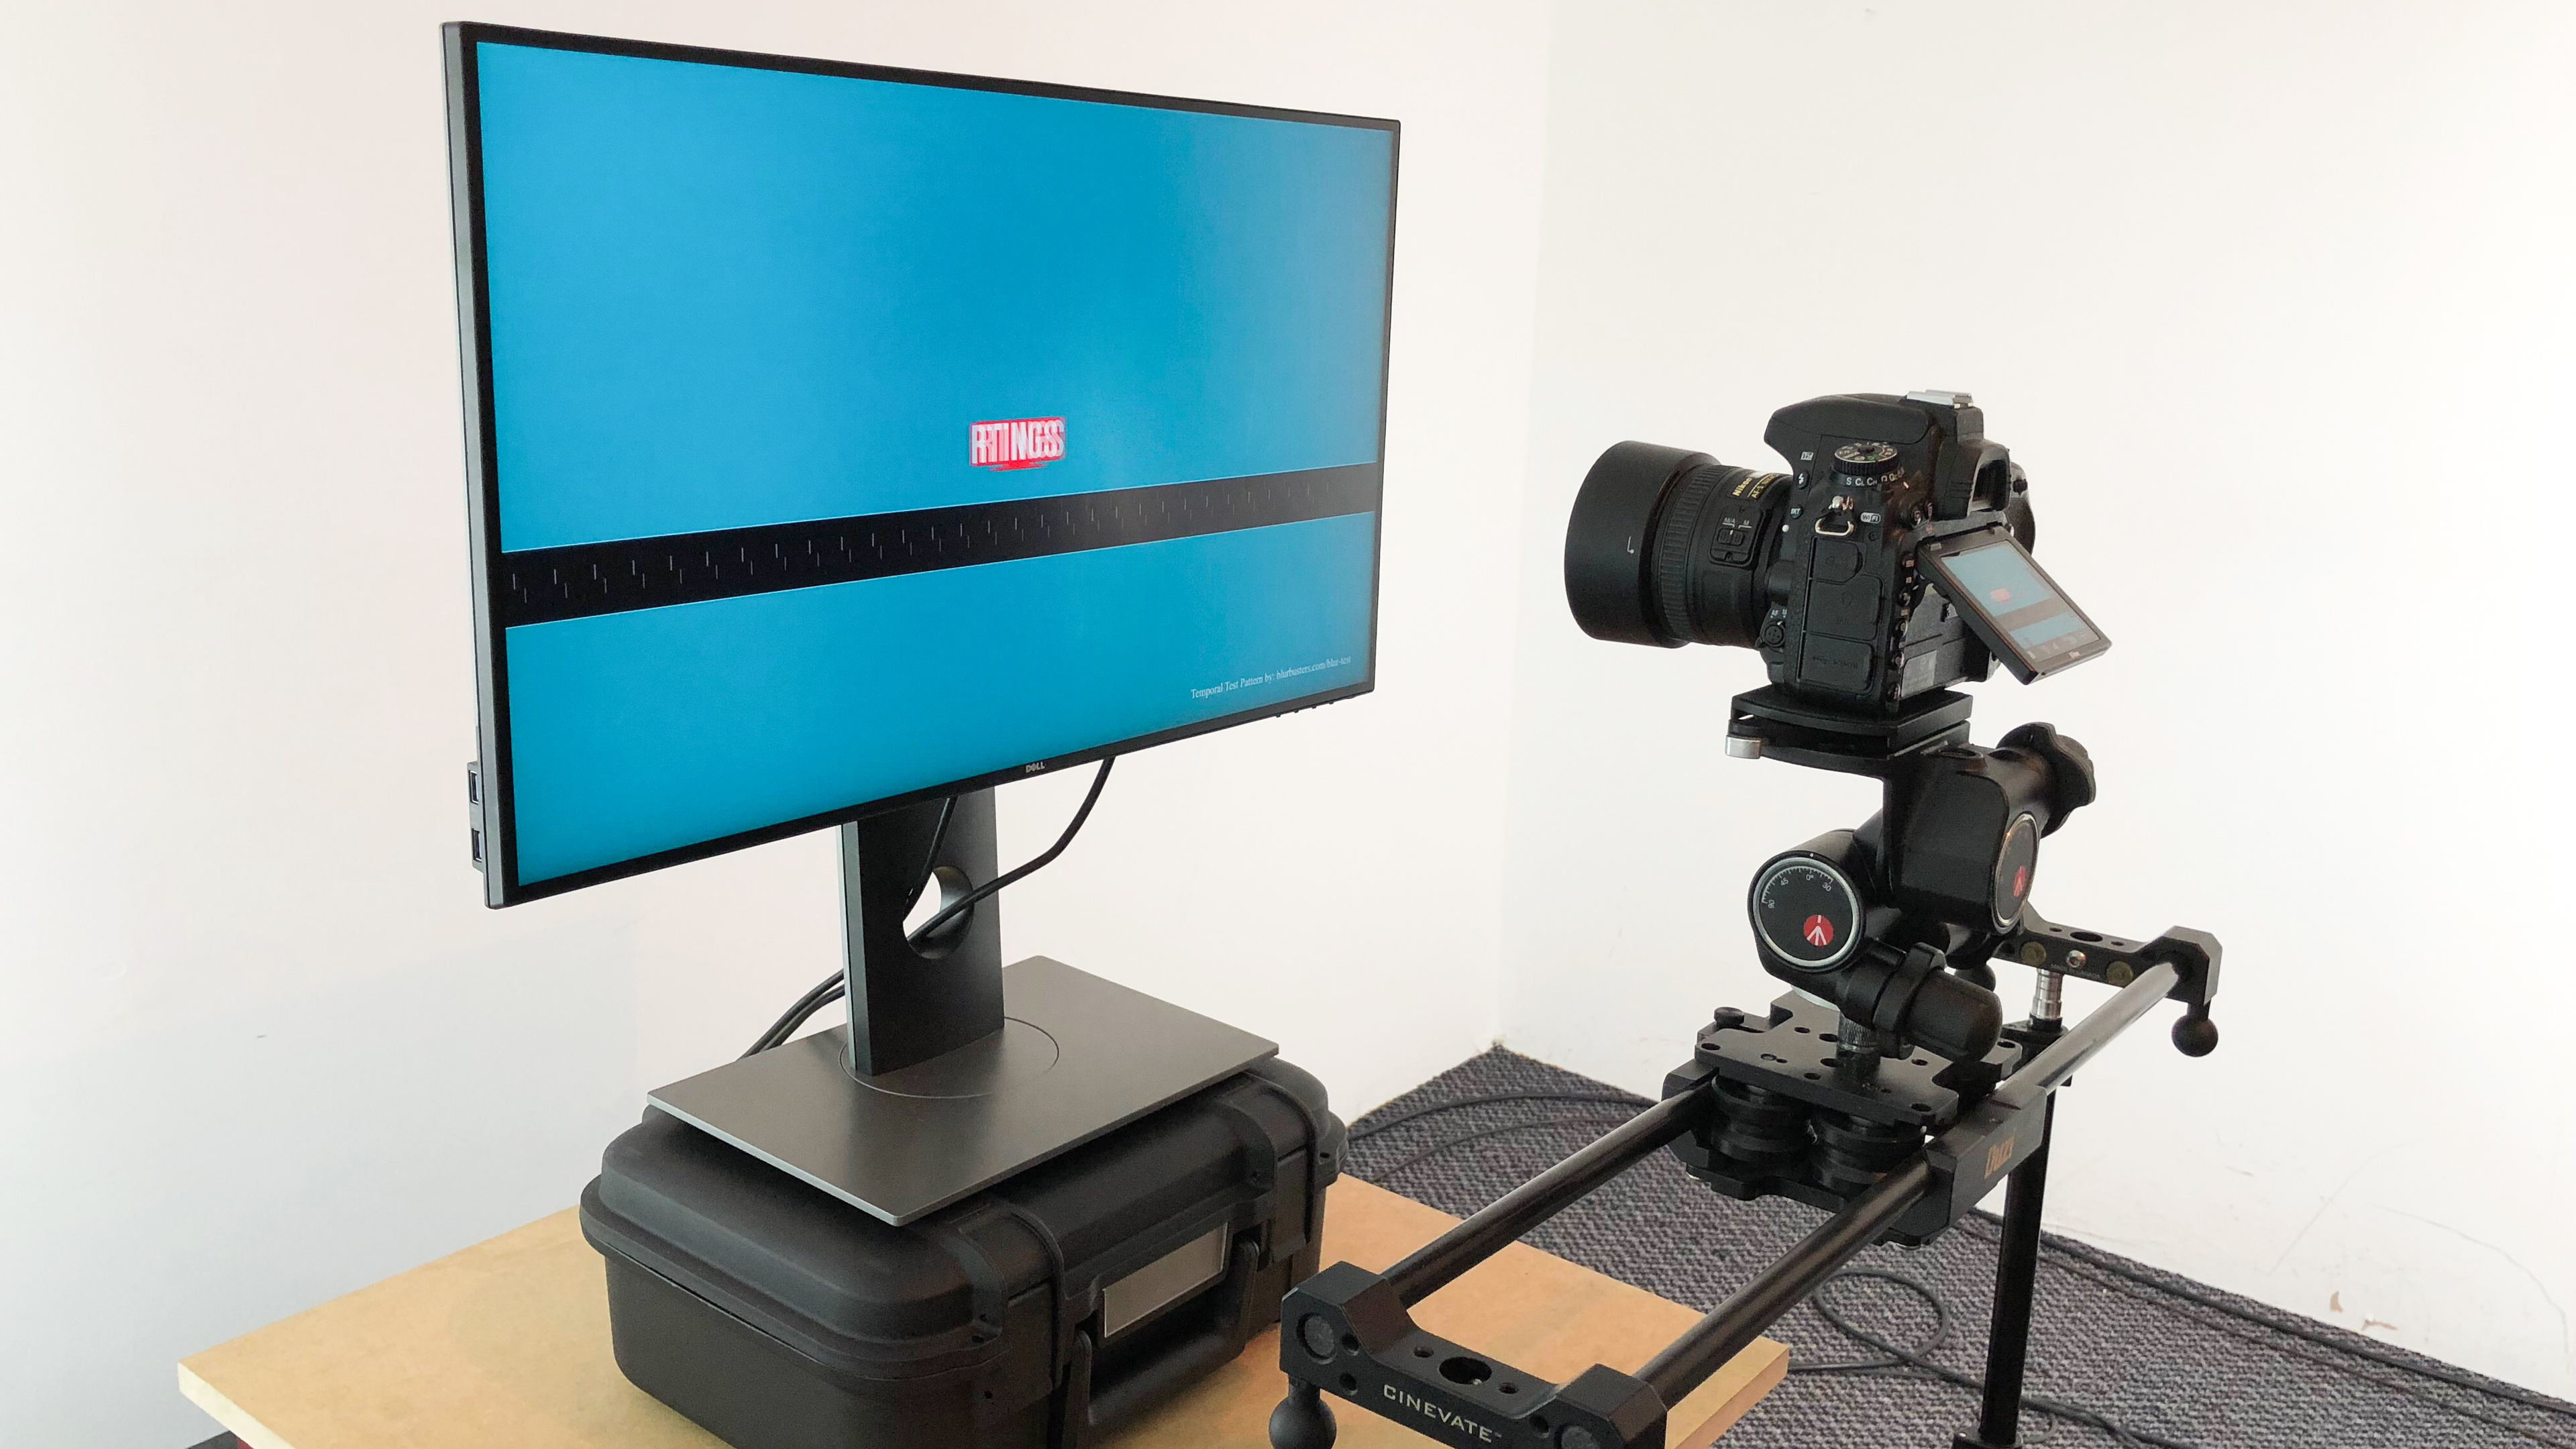 Motion blur picture setup
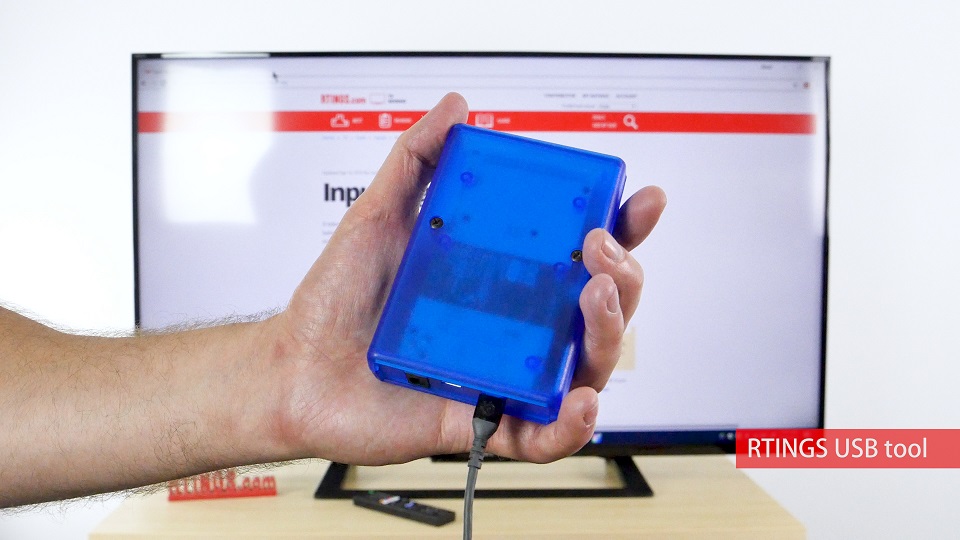 Response time tool
Motion Blur Picture
To accurately capture the appearance of motion blur, we use the pursuit camera test methodology developed by Mark Rejhon of Blur Busters. It consists of a test pattern moving transversally and a camera placed on a rail that sits parallel to the screen.
While physically tracking the test pattern with the camera, the logo moves at a speed of 960 pixels per second, and we take a picture at a shutter speed of 1/15th of a second. Part of the methodology is a validation system that uses a series of temporal tick marks positioned below the logo. This technique helps create consistent and representative pictures of the blur created by the monitor.
Below you can see what the motion blur photo looks like with a monitor with great motion handling versus one with bad motion handling. You can see that the one on the right has noticeable black smearing behind the fast-moving object, which you'll see during regular use.
 Incredible motion handling - Gigabyte AORUS FO48U OLED
 Bad motion handling - Samsung C27G5
Response Time Tables
The second part of our response time test is measuring the actual response time and publishing the tables. These tables are based on data produced by our own multipurpose tool, which uses an array of photodiodes and an Arduino Due connected to our test computer via USB. To test for response time, we display a series of gray slides on the monitor and place our tool in the middle of the display. While the sequence of grey slides appears on-screen, the tool continuously captures the light intensity coming from the display. It allows us to calculate the time it takes for the pixels to transition from displaying one shade to another.
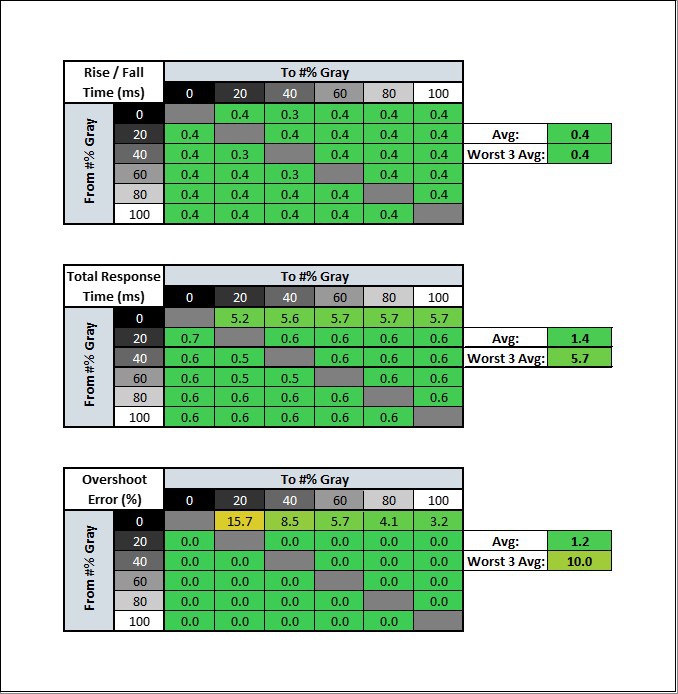
The gray slides range from 0% (black) to 100% (white), with the 20%, 40%, 60%, and 80% slides in between. We measure the response time of each transition, first from darker slides to brighter slides (i.e., 0% to 20%), then all the transitions from brighter to darker (i.e., 20% to 0%). The published tables only include the dark-to-light transitions because these are more important and show any overshoot, but you can also see the bright-to-dark transitions in the published charts.
As you can see in the tables below, it starts with each of the gray values in the left column, and it transitions to the specified value in the top row to measure the rise/fall, response time, and overshoot error for each. The software calculates an average of each of the results to get the final result, and it measures an average of the worst three results. Luckily, these tables are easy to read as they're color-coded, so you know what's good and what's bad. You can see below that the monitor on the left has a much better response time solely based on the fact that the tables are greener than the monitor on the right.
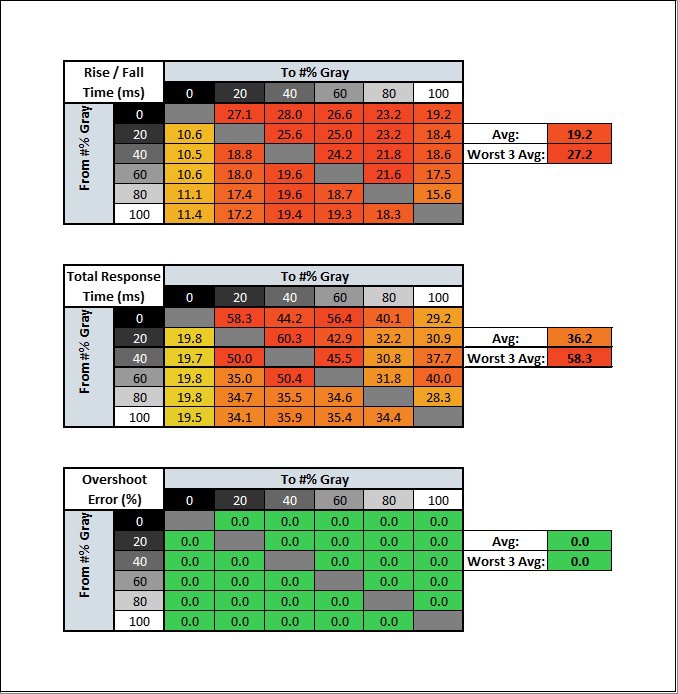 Response Time Table - Lepow Z1 Gamut (Bad)
Although we only publish the response time charts in the text, you can see what they look like for the Dell here and for the Lepow here. These show the backlight intensity during each transition, and it's a scientific way to show how the monitor handles transitions. They're a bit harder to read, but the blue line along the x-axis represents the backlight, and you can see it moving up and down to reach its target.
Below are examples of the charts with the 0-20% and the 0-40% transitions with the Dell and Lepow monitors.
 Response Time Table - Lepow Z1 Gamut (Bad)
Rise/Fall Time
The rise/fall time tells us the response time from 10% into the transition until 90% of the transition. For example, if the screen is transitioning from pure black (0%) to pure white (100%), it's measuring the time it takes to go from 10% gray to 90% gray. The same concept is applied even if it's going from 60% to 80%; it's measuring from 62% to 78%. This response time is good when there are incomplete transitions, like when an object transitions from one color to the next so fast that it doesn't have time to make a full transition. In the tables above, the rise/fall time is represented in the top table, and you can see that the software automatically calculates the total average of all the transitions, which gives us our final result.
Total Response Time
The total response time is the total amount of time it takes for the monitor to make a full transition. The total response time is the time it takes to reach from 2% to 98% of its target, as a 2% leniency is given to adjust for potential noise in the data. This number is also important for motion handling, but it's more important than the rise/fall time for slower-paced games because colors have the opportunity to make a full transition. This is represented by the middle table, and once again, we show the average on the right.
Overshoot Error
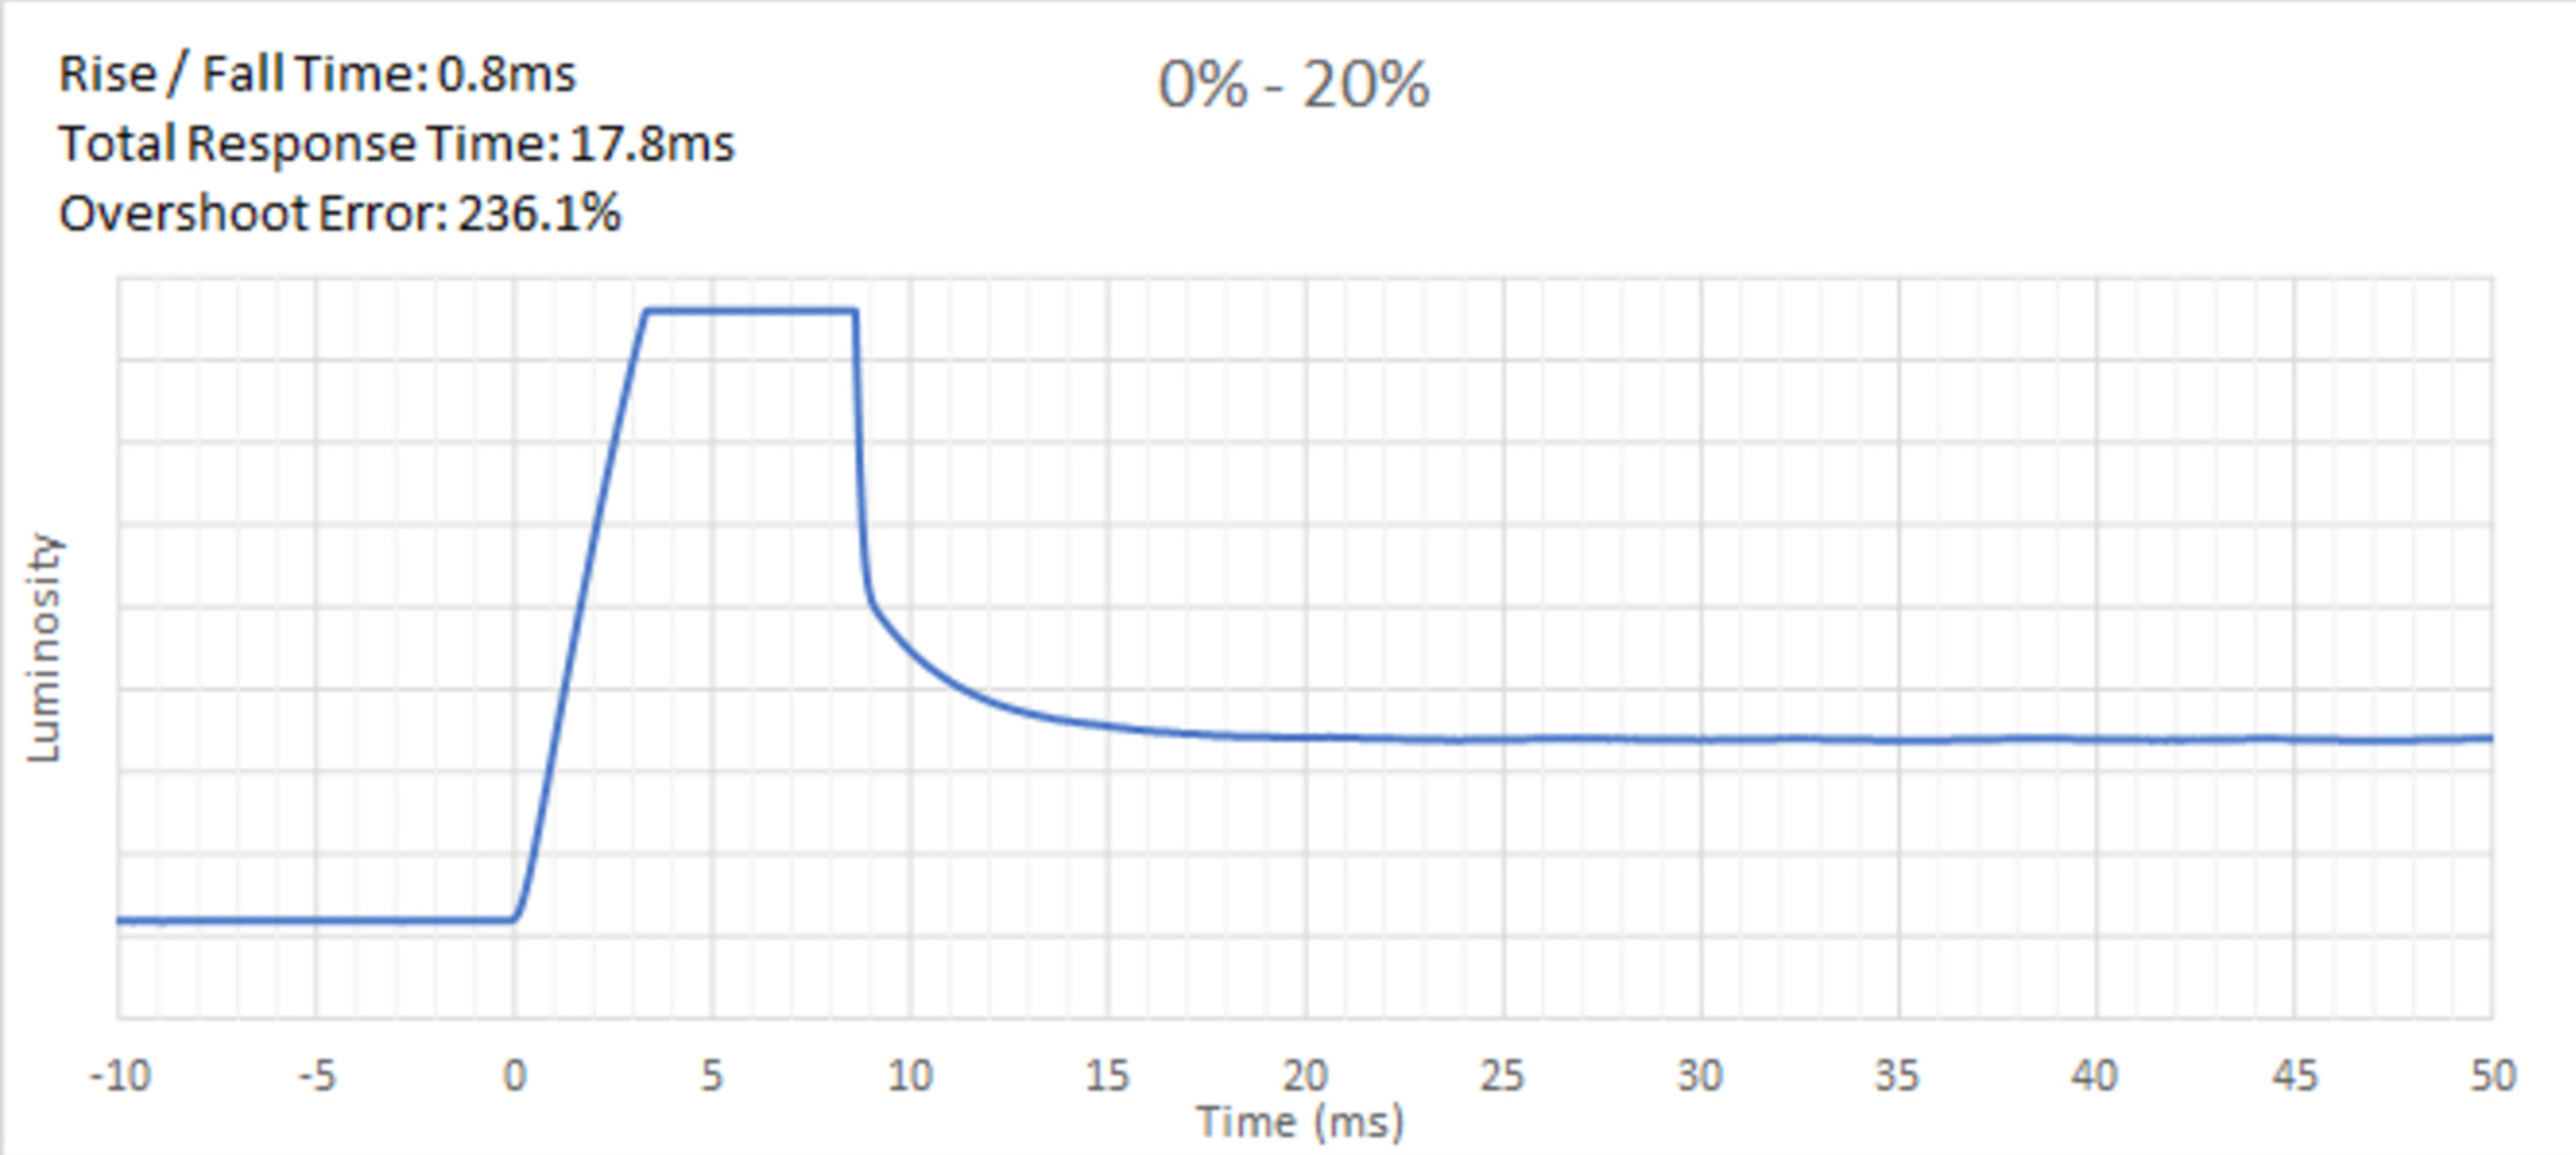
Overshoot error is the percentage of which the monitor goes past its target color, hence the name overshoot. So if the monitor has to transition from 20% to 80% gray, it overshoots if it goes past the 80% target. The percentage is a percentage of the target, not the difference, so if it goes to 85% for an 80% target, it overshoots by 6.25% and not 5%. Overshoot often happens when you set the monitor to its fastest overdrive settings because the pixels are trying to transition so quickly that they go past their target.
You can see below an example of overshoot with the ASUS ROG Strix XG27AQ. In the chart on the left, you can see that the pixel transitions way past its target, with an overshoot error of 236%. This is because it's the strongest overdrive setting for this monitor, and you see in the motion photo that the overshoot causes ghosting behind the moving object.
 Overshoot graph
 Overshoot in motion
Worst 3 Rise / Fall Time
As part of Test Bench 1.2, we now show the average measurements of the worst three transitions. It tends to be the dark transitions as monitors have more trouble going from dark to bright colors. Because of this, this number is important if your games tend to include a lot of dark scenes, so you want something that has a fast response time in dark transitions. If the worst three measurements are close to the total average, it means the monitor is consistent across different transitions. The system automatically calculates the worst three rise/fall times.
Worst 3 Total Response Time
Once again, we publish the average of the worst three total response time measurements. There's usually a greater difference between the worst three total response time measurements and its total average than with the rise/fall time. This is because when there's a slow transition, it takes even longer to reach its final state than at 90% of its transition.
Worst 3 Overshoot Error
Lastly, we show the average overshoot error for the worst three transitions. Like with the rise/fall and total response time, this measurement is representative more of dark transitions, as it's more likely a display overshoot when it's going from 0% gray to 20% than with 60% to 80%.
Recommended Overdrive Setting
As mentioned, we repeat the response time measurements with the different available overdrive settings if they're available. The overdrive settings are meant to increase the response time, but usually, that comes at the cost of overshoot, so sometimes it isn't the best choice to use the highest settings. There are different factors we consider when choosing the best one, like the total response time and overshoot, and we also look at the motion photos to compare. For example, if one setting has a faster response time than another but has more overshoot that you can notice in the photo, we'll choose the one with a slower response time but less overshoot. As with any recommendation, these are just guidelines, and you can choose any setting you prefer.
Since we test monitors with VRR enabled, some don't allow you to adjust the overdrive setting with VRR on. If that's the case, we'll put the recommended setting as VRR enabled.
Response Time At 120Hz
We repeat the same procedures and measurements that we did with the max refresh rate, but also at 120Hz. This result is important for console gaming, and it's good to know if a monitor can maintain a fast response time when the frame rate of the game drops. We also reevaluate the recommended overdrive setting at 120Hz, and sometimes the recommended overdrive setting is different at its max than at 120Hz. This means you would need to potentially change the overdrive setting if the frame rate of your game drops or if you start playing on a console.
Most monitors don't have much visual difference between the motion handling at its max refresh rate and 120Hz. You can see below what a 240Hz monitor like the Dell Alienware AW2521HF looks like at its max refresh rate and 120Hz, and you can see that there isn't much of a difference in the blur trail behind the logo.
 240Hz
240Hz 120Hz
120HzResponse Time At 60Hz
- 50.0% Rise / Fall Time
- 50.0% Total Response Time
- 25.0% Overshoot Error
- 10.0% Dark Rise / Fall Time
- 10.0% Dark Total Response Time
- 5.0% Dark Overshoot Error
We also repeat the process at 60Hz. It's important for console gaming with older games or if your graphics card simply can't keep up with demanding frame rates. There's a bigger difference with its max refresh rate than at 120Hz, meaning the response time is generally slower, and there's more motion blur, but that's the trade-off for using a slower refresh rate.
You can see in the photos below from the ASUS ROG Swift PG279QM, whose 60Hz response time is one of the best we've tested, that motion still looks a bit more blurry than at its max refresh rate of 240Hz, and this is normal.
 Motion handling at 165Hz
 Motion handling at 60Hz
Additional Information
Persistence blur
While our motion blur test is centered around the response time, another cause of motion blur is called persistence. Essentially, the longer a frame is kept on screen before switching to the next one, the blurrier a moving object will appear on-screen. Using a monitor's backlight strobing (BFI) feature can help reduce this persistence blur, but at the end of the day, many different factors result in the motion handling, so the response time isn't the end-all factor.
Refresh rate
The screen's native refresh rate can also affect motion blur. As explained above, lower refresh rates naturally make motion look blurrier because the screen refreshes less. It's why an OLED with a near-instantaneous response time can still look blurrier than a 120Hz monitor that has a few milliseconds of average response time. While the transition time might be instant, the lower amount of "steps" for motion requires our brain to do additional compensation leads to blurrier movement. We've made a series of videos that explain the different aspects that affect motion, which you can find on our YouTube channel.
Learn more about the refresh rate
 LG 42 C2 OLED - 1.8 ms total response time
 Dell Alienware AW2521H - 6.9 ms total response time
Response Time For Different Panel Types
The type of panel the monitor affects the response time and motion handling. OLEDs are known for their near-instantaneous response time because they can turn individual pixels on and off, but that may result in some stuttering because each frame is held on for longer.
As for LED-backlit LCD monitors, the TN and IPS types are considered the best with motion handling. TN panels were the king for that for many years, but they're extremely rare now, and IPS panels are very common and still have great motion handling. VA panels normally have slower response times in dark transitions than IPS and TN panels, leading to black smearing. However, some monitors with VA panels compensate for this with the overdrive settings, which improves the dark scene performance at the cost of overshooting in bright scenes. This doesn't mean that a monitor with an IPS panel is automatically better than one with a VA panel, but generally speaking, IPS panels have better motion handling than VA panels.
Learn about the difference between IPS, VA, and TN panels
How To Get The Best Results
The response time of a monitor isn't something you can change, but there are a few settings that might help you get better results in terms of motion handling.
- In the monitor's on-screen display menu, set it to your preferred overdrive setting. You can use our recommended setting, but choose whichever looks best to you.
- Use the highest refresh rate the monitor and your graphics card can go. A higher refresh rate is better for motion handling, and while setting it higher doesn't make it have a quicker response time, it's better than playing at a lower refresh rate.
- Use your monitor's backlight strobing feature if available. While some users might be bothered by a flickering screen, this is one of the best ways to reduce persistence blur and enjoy sharper motion.
Other Notes
- Some games apply motion blur as an aesthetic effect within the game engine itself. If you dislike the look, you can generally turn it off within the game's settings.
- The response time is different from the input lag. We measure them using the same tool and grayscale slides, but we stop measuring the input lag the moment the colors start to change, and the response time is the time it takes for the colors to transition. Learn more about input lag with monitors here.
- Our response time tests are a lot more in-depth with monitors than the one with TVs, as we don't include the overshoot and rise/fall time with TVs. As such, don't compare the response time between TVs and monitors.
Conclusion
There are a few different factors that contribute to the motion handling of a monitor, and the response time is an important one. The response time is the amount of time it takes for pixels to transition from one color to the next, and a slow response time can lead to motion blur and smearing. It's also possible to have a response time that's too quick, so it overshoots its target color, creating a ghosting effect. We measure the response time using a special tool and check to see which overdrive setting is the best on a monitor, if it has one. This test is important if you're a gamer or watch movies with fast-moving objects.