This is update #8 in our weekly series of new features and improvements.
This week, we're introducing a new tool we built for testing input lag and response time. This new photodiode tool helps us measure input lag and pixel response time more efficiently. The tool can be used to measure input lag on any signal a PC can generate, including higher refresh rates like 120Hz.
We've also updated all reviews of our 2017 TVs with 1080p @ 120Hz input lag measurements.
The Old Way: Leo Bodnar Tool
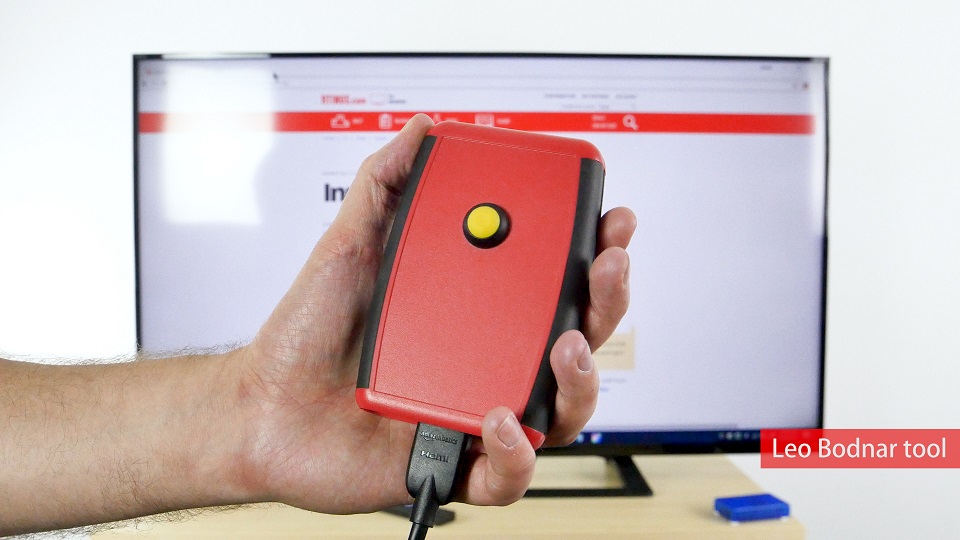
Previously, all our input lag measurements were done using the industry-standard Leo Bodnar tool. It outputs a 1080p @ 60Hz @ RGB signal via HDMI containing a flashing white square, then uses a photodiode to detect when the TV shows that white square. The input lag is measured as the difference between when the HDMI signal is sent and when the photodiode detects that the TV is showing white.
To test the input lag of 4k and HDR signals, the output of the Leo Bodnar tool is passed first through an HDFury Integral, then an HDFury Linker, before finally outputting to the TV. The HDFury Linker can perform many modifications to the video signal without adding measurable input lag, including upscaling the signal to 4k and adding HDR metadata. All our input lag tests were done using this HDFury chain, including the 1080p tests, to remain consistent.
The New Way: USB tool connected to PC
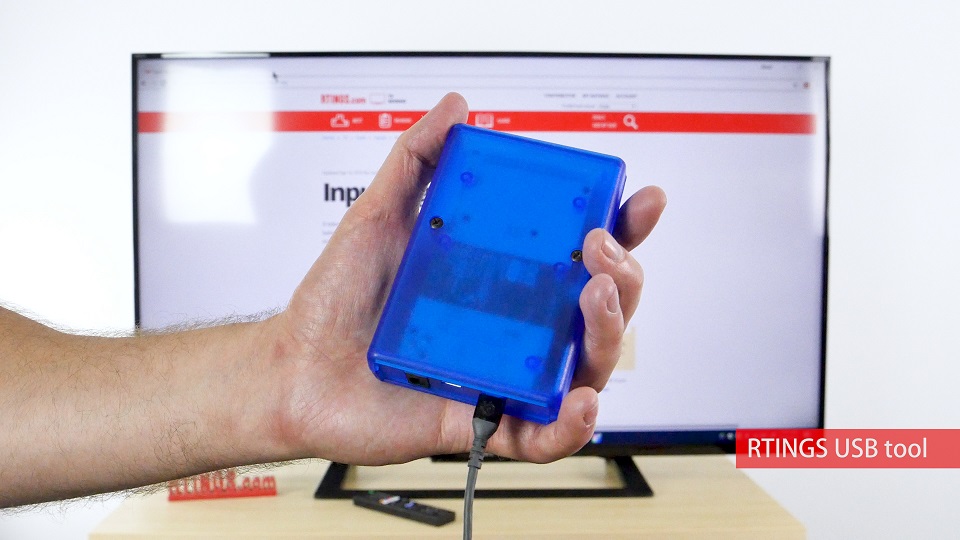
Input lag measurement with the new tool uses the same principle as the Leo Bodnar tool: the computer sends an HDMI or DisplayPort signal containing a flashing white square, and the photodiodes on the new tool detect when the TV or computer monitor shows the white square. However, using a computer to send the white square means that various kinds of signals can be sent, such as 4k and HDR (like before), but also new signals such as 120Hz and DisplayPort. This allows us to test the input lag of nearly any video signal the TV or monitor can accept.
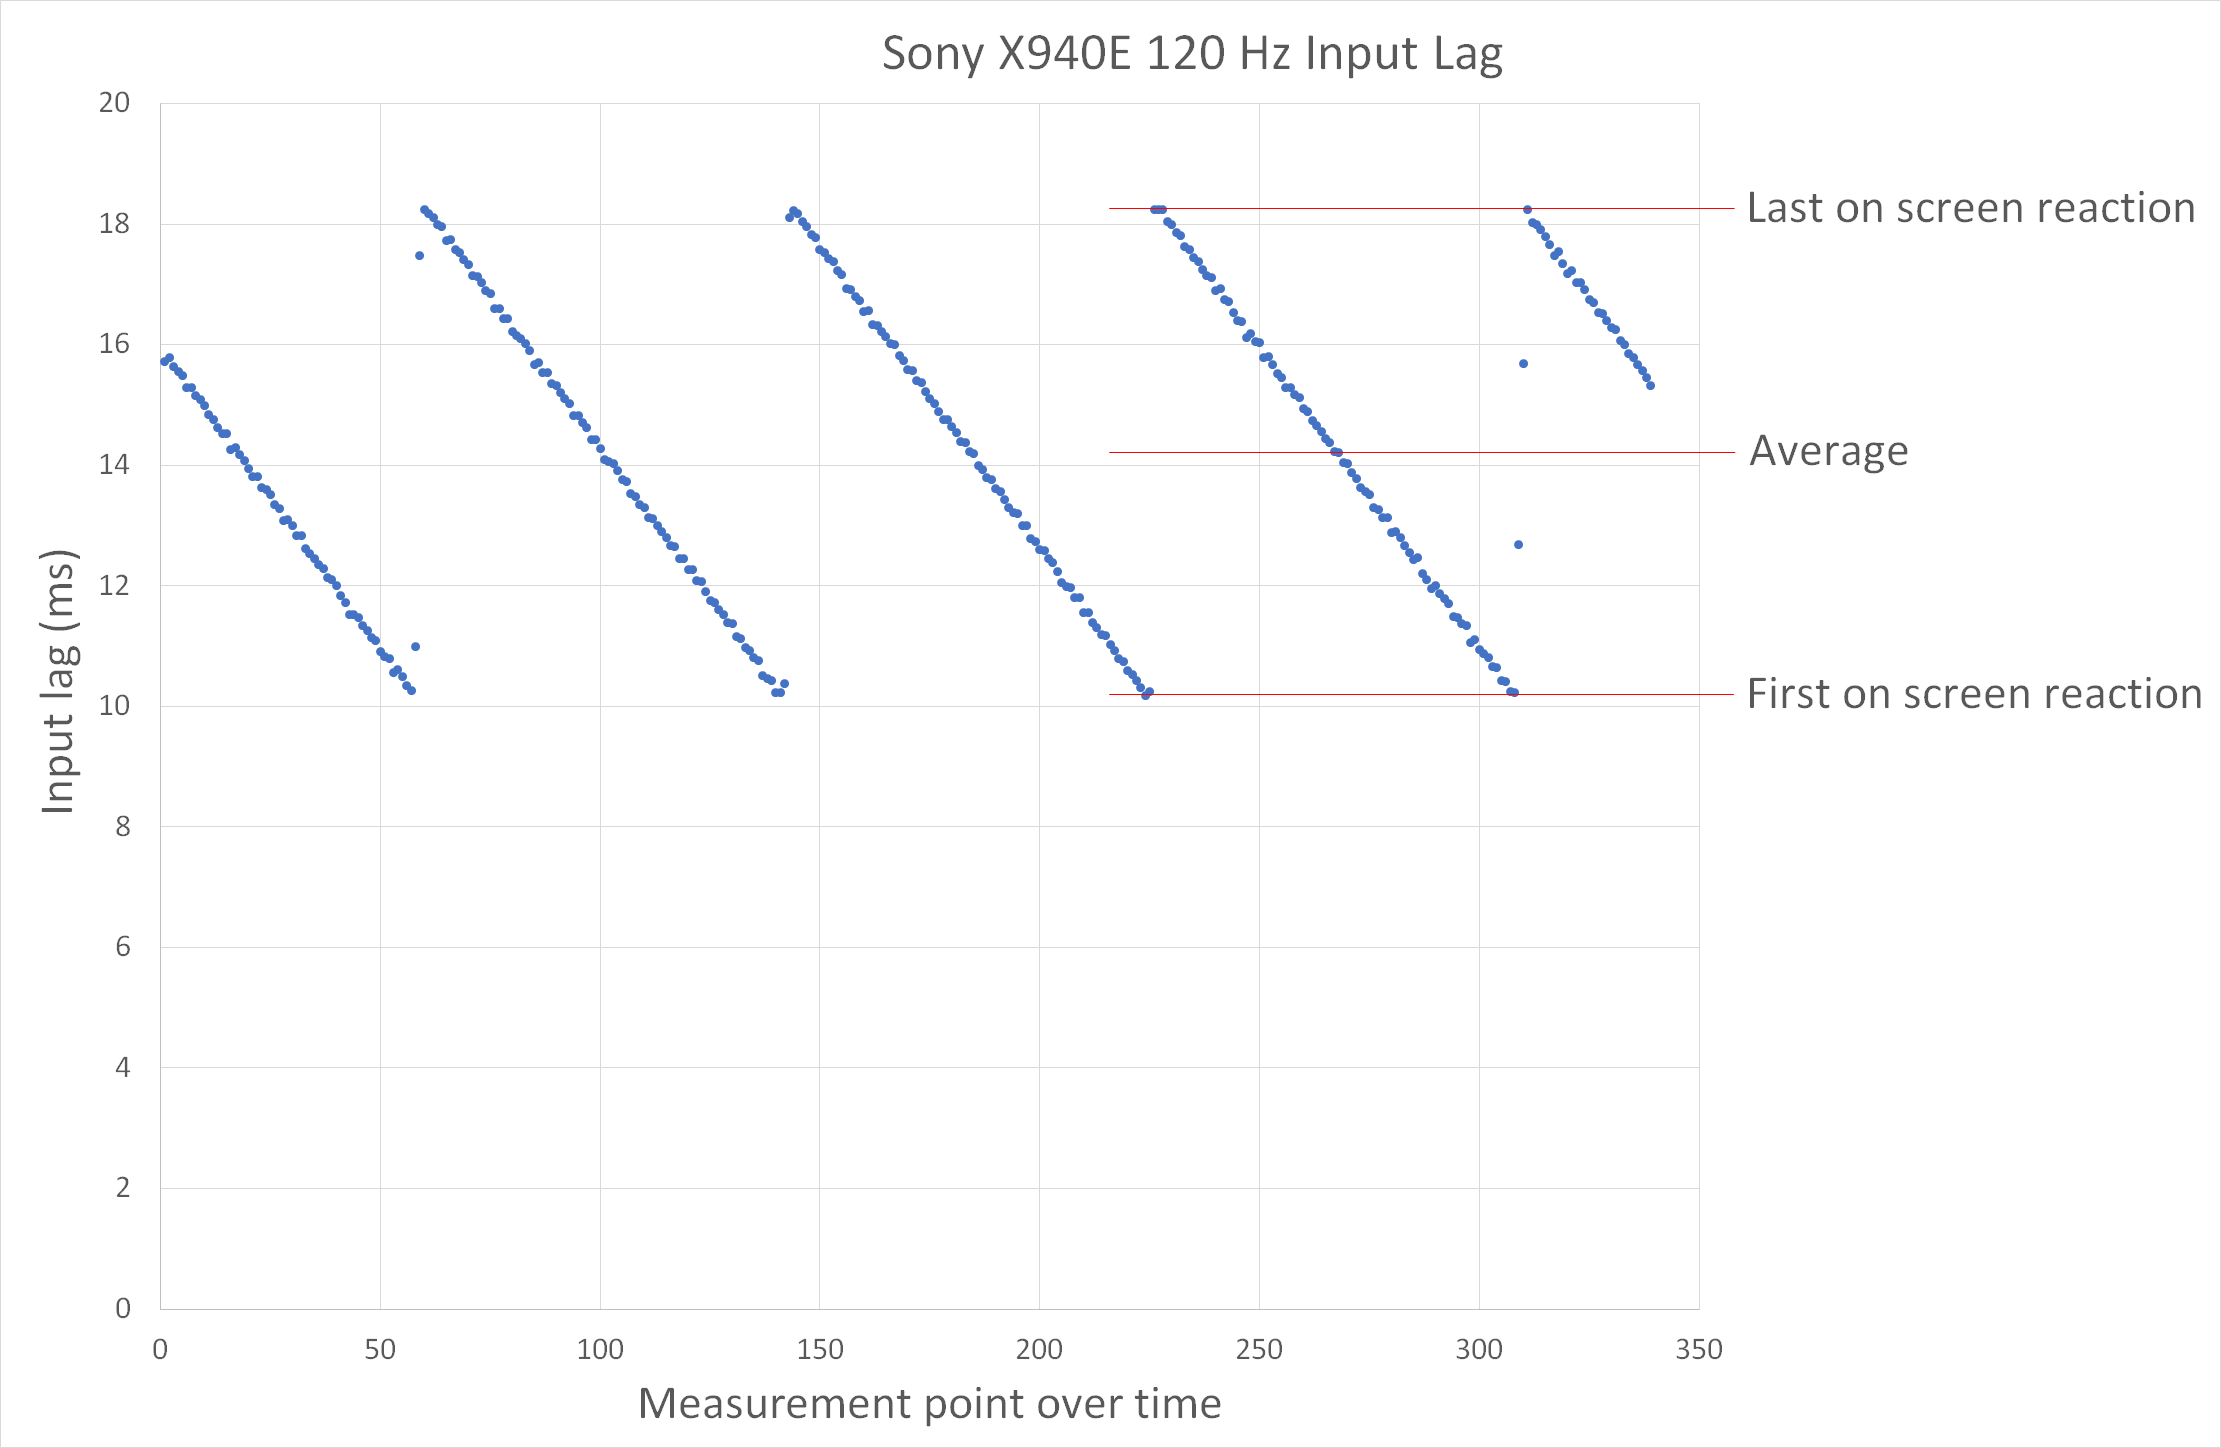
Using a computer to send the frames also allows testing with V-sync off, which allows us to measure additional things like the 'first on-screen reaction' input lag. This occurs when the display receives the white square frame when the display is currently writing to the middle of the screen, so the tool detects the white frame the instant the display receives it. This is the lowest possible input lag of the screen. To measure this, we measure the input lag of the screen at various points in its scan cycle, by doing hundreds of measurements at different intervals. The highest possible input lag is when the new frame's scan cycle starts just after the tool, so the tool doesn't see the white square until the very end of the scan cycle. The lowest input lag is when the new scan begins immediately under the tool. The number we post in our reviews is the average input lag. These numbers are analogous to the V-sync input lag at the top of the screen (best), middle of the screen (average) and bottom of the screen (worst) because with V-sync turned on, the scan always starts at the top of the screen. The Leo Bodnar tool used V-sync, so our published measurements are analogous to the Leo Bodnar tool placed at the center of the screen.
We use an OpenGL window in graphics exclusive mode to generate the black and white square frames. Normally, V-sync is forced in Windows 10 because the OS controls the graphics, but by running OpenGL in exclusive mode, the new tool's software can have full control over V-sync and other graphics features. The software can also automate much of the testing by changing resolutions and refresh rates automatically, which saves time.
With this tool, we can now also measure input lag with screens that use different kinds of technologies like G-SYNC, FreeSync, etc.
Response Time
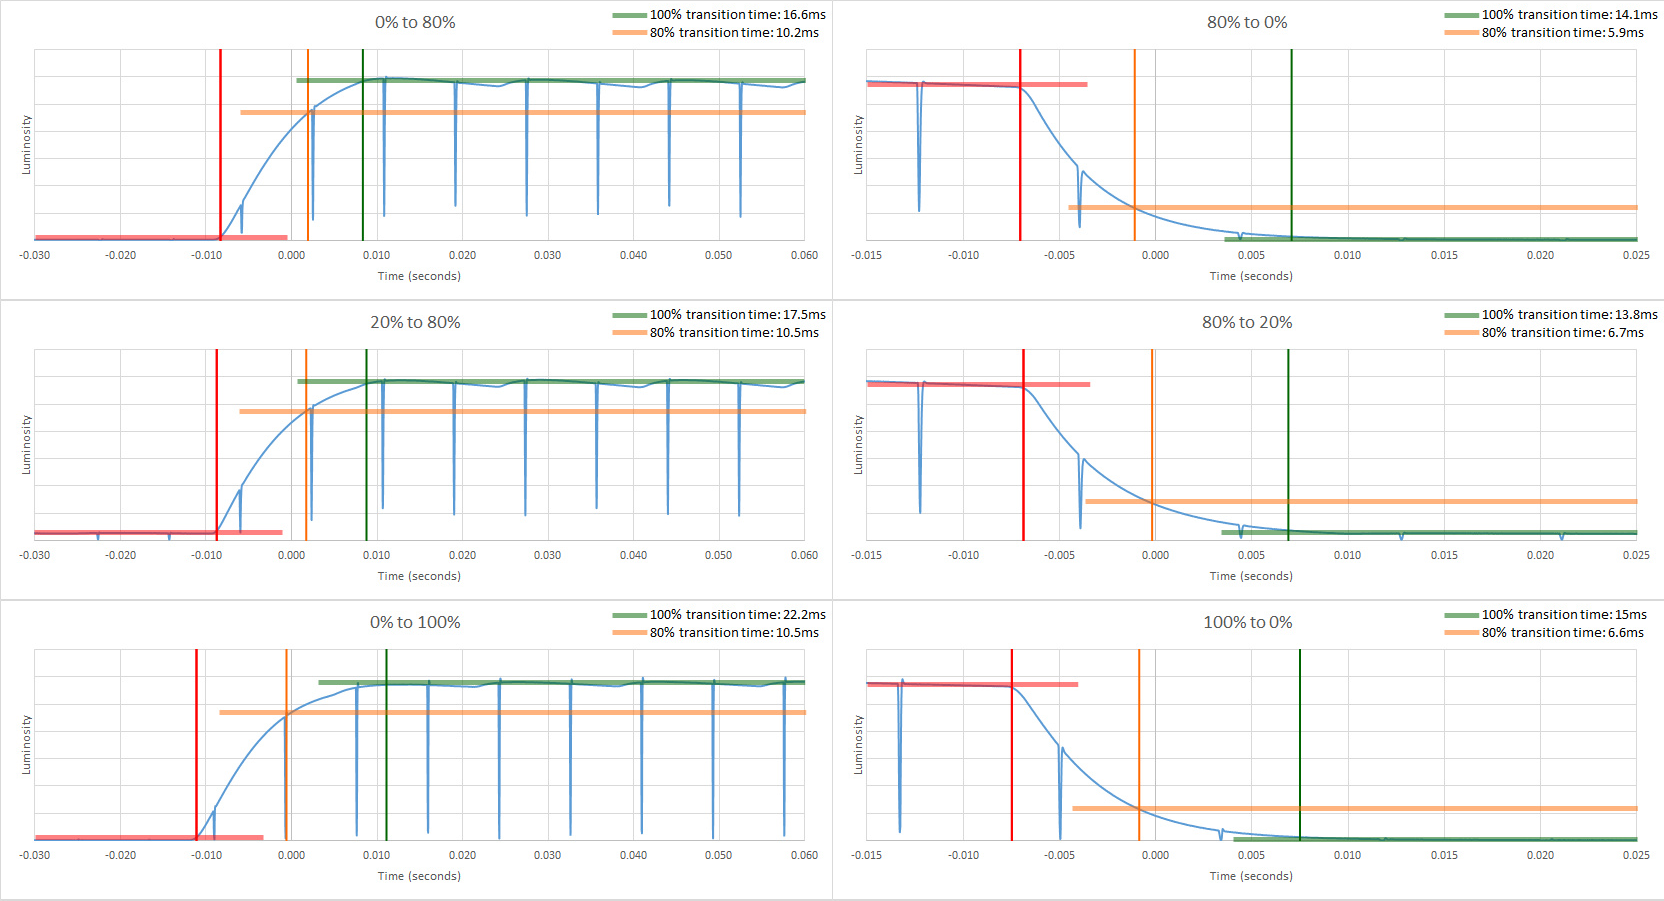
The new photodiode tool also allows us to automate our existing response time and backlight flickering tests, and improve their accuracy. Previously we used a very simple photodiode tool attached to an oscilloscope to capture the data, and we had to switch between our test slides and export the data manually. However, with the new tool, all brightness calibration, slide changes, and data logging can be automated through software. This automation saves us a lot of time during testing and reduces the possibility of error. The new tool also improves the accuracy of the measurements because the new circuit has less noise in the signal.
Conclusion
The new photodiode tool allows us to automate our input lag and response time tests, which saves time and reduces errors. It also allows us to perform many new input lag tests, such as 1080p @ 120Hz. Let us know if you have any feedback or ideas for new tests we could implement with our tool.