Introduction
Our test bench and scoring systems define how we test each product and how we convert our objective measurements into easy-to-understand scores as well as the ratings that you see at the top of each review. These complex systems are a critical part of our review process, as we aim for objective, repeatable, comparable results to help you find the best product for your needs.
What Is A Test Bench?
A test bench covers every aspect of how we review each product, and it's a critical component of our objective review process. It defines everything you see in a review, from the design photos to the list of tests that we run and the exact process we follow for each one. A test bench also defines our scoring metrics for each product category, from individual box scores up to the overall scores you see at the top of the review.
The test bench is a key component of our review process. Every product under the same test bench is tested with the exact same methodology, equipment, and setup, and although our test benches are constantly evolving (more on that later), many of our results are directly comparable even across test benches. This ensures that the results of two different products are directly comparable. Even though you can often compare results across test benches, the ability to directly compare every measurement and test results of two products on the same test bench is one of our most important tools, and without this structured methodology, that wouldn't be possible.
We'll explore this more in depth later in the article, but a test bench isn't just about tests. It also includes the scoring that goes into the final review. At an individual test level, our scoring spline system objectively converts a measurement into a score, so you can quickly understand how a product performs relative to the market and user expectations, even if you don't fully understand the measurements themselves.
 |
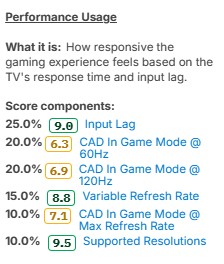 |
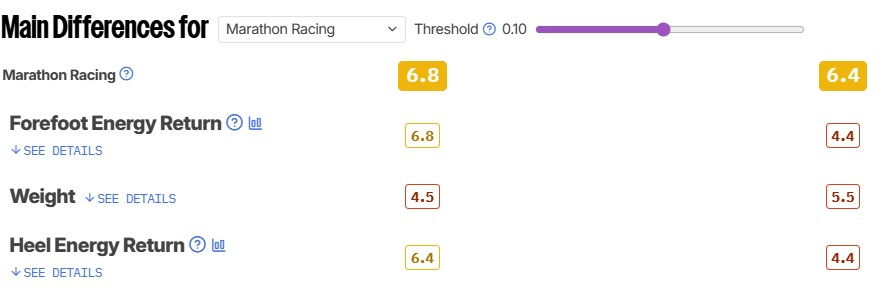
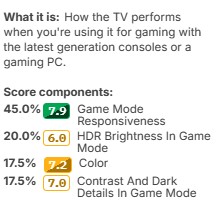
A test bench also includes performance indicators that we call ratings. There are two main types of ratings: usage ratings and performance usages. Usage ratings indicate how well a product performs for a specific use case. Performance usages instead provide a quick way to see an aggregate score for a raw performance metric. One example that illustrates these differences is the 'Game Mode Responsiveness' performance usage and the 'Gaming' rating on TV 2.2. The performance usage is made of objective measurements that any gamer cares about, and it focuses solely on the TV's raw gaming performance. The 'Gaming' rating, on the other hand, includes responsiveness and various picture quality metrics, which may not matter equally to everyone.
To construct a Rating, we first choose which tests in the review matter most for that use case. Then we assign a weight according to its importance. The value of the weights assigned to each test for each rating is based partly on our experience regarding the test and its relevance to the specific usage, but we also rely on user feedback. These scores reflect what we expect most people to care about most when considering a specific usage case, but your usage might differ. Members can also create their own ratings to match what they care about the most.
Much like our test methodology, our scoring curves and ratings are always tied to a specific test bench. This again helps ensure product comparability. As long as two products were tested with the same test bench, you know that they were scored the same way, making those scores directly comparable.
Of course, our test benches aren't a one-time thing. They change and evolve over time. As markets and technology change, we need to adjust our testing accordingly.
Identifying A Test Bench

A specific combination of tests, scores, and ratings is grouped together in a specific test bench version, which you can see at the top right of any review just under the title. This version number makes it easy for you to identify exactly how we tested a product, and it works similarly to the way most software is released. As we revise our test bench, we'll update the version number based on the scope of the update. A minor update might change only the last digit, whereas a major update might change the first digit, like when we went from version 1.8 to version 2.0 on Headphones.

Major updates, such as the 2.0 update for Headphones mentioned above, often break compatibility with older test benches. This means that, unfortunately, it's no longer possible to directly compare most scores with products on older test benches. The good news is that most individual measurements remain directly comparable, unless there's been a change to that specific test as part of the update. We don't make major changes like this lightly; we want our reviews to be comparable, so a major update usually represents a significant change in how we test things. Once we post a major update like this, any reviews on the older test bench will include a disclaimer at the top stating that you can no longer compare those results with other reviews.
Minor updates and small revisions that only change the second or third digit are designed to maintain backward compatibility. While we may add new tests or change something that wasn't available on a previous test bench, the vast majority of these reviews are still directly comparable.
Test Bench Updates
Markets change and evolve over time, and our test benches need to keep pace to ensure we're presenting you with the information you care about most. To do that, we occasionally need to update our test methodology, including our scoring curves and ratings. There are many different reasons we choose to update our testing, including:
- Emerging technologies
- Improving test coverage
- Improving the quality of an existing test
- Updating our scoring to match current market conditions
When we decide to make changes to our test methodology or scoring, we go through a process we call a test bench update. Separating these changes into a new test bench ensures that everything remains comparable. Everything tested on a specific test bench has been done using the same process.
Once we've decided on the scope of a test bench update, it goes through various stages of development, starting with test development by the R&D team. We start with a small batch of products to validate that the new test bench meets the goal for the updated tests, and that the results are repeatable and useful. The content team then updates the text to align with the new tests and scoring. Finally, this first batch is posted, and the new test bench is live.
Once the first batch has been published, we start the daunting task of updating as many products as possible to the new methodology. This almost always requires going back and retesting previously published reviews. Since we buy everything ourselves, we keep the products we review for as long as they're relevant. Unlike most reviewers, we're able to go back and retest the same unit we previously tested. This also allows us to update reviews when the manufacturer releases new firmware, so you can see how the product evolves from its initial release through its discontinuation.
We have limited resources, so unfortunately, we're not able to update everything to the next test bench. We have to limit retests to the most relevant products, so we usually don't update products that are no longer available for purchase. We're also not always able to update the text for every product, so we usually only update the most popular models that have been updated to the latest version. You may see some inconsistencies when looking over reviews that were originally tested on an older test bench.
With each new test bench, we also publish several companion articles. The exact list varies depending on the scope of the changes, but we always publish a list of changes, and you'll often find articles that explain any new tests we've added.
Scoring System
The data collected during our testing process is just one part of our reviews. Converting that data into scores and ratings is the other side, and it's a crucial part of our process. Just as with our testing methodology, our goal is to take an objective approach to scoring.
Why Do We Have Scores?
We could just have test results in our reviews, with no scores, but there are a few downsides to that approach. Understanding the core principle of a test and understanding how to interpret the individual measurements are two very different things. You might understand what input lag is, without necessarily knowing what the difference between 8ms and 16ms actually represents. One goal of our scoring system is to provide additional context in a simple, easy-to-understand format that even people without prior knowledge of a product category can understand.
Of course, simplifying a long list of tests into a single score isn't a perfect solution, either. Not everyone will agree with the weights we've assigned to each score component, and this also results in a loss of information. If you care about a specific aspect of a product, it's important to look beyond the scores and focus on the test results that matter most to you.
Scoring Philosophy
Our scores are absolute. Every product tested under the same methodology follows the same scoring structure, regardless of price or market position. This approach ensures you can directly compare the scores of any product tested on the same test bench. If a cheaper product performs better than a more expensive one, it'll score higher. This is true for both our individual test scores within each section and for the ratings that you see at the top of every review.
We don't try to spread scores out from 0 to 10, either. If the vast majority of products perform extremely well in one aspect, then they could all score highly for that test. One such example is input lag on monitors. The vast majority of monitors score extremely well on this test. While there are still minor differences between models, the reality is that almost all monitors have extremely low input lag, so you won't notice it even if you're a professional gamer.
All of our scores are a weighted average of a series of measurements. So two products could score the same in a category but perform very differently, depending on how they score in each subcomponent, but we try to avoid this as much as possible. Similarly, one product could score higher than another on a given rating but still perform worse in other aspects. That's why it's always important to look beyond the individual scores.
Converting Data To Scores
So how do we go from objective measurements to the scores that you see in the review?
 |
 |
 |
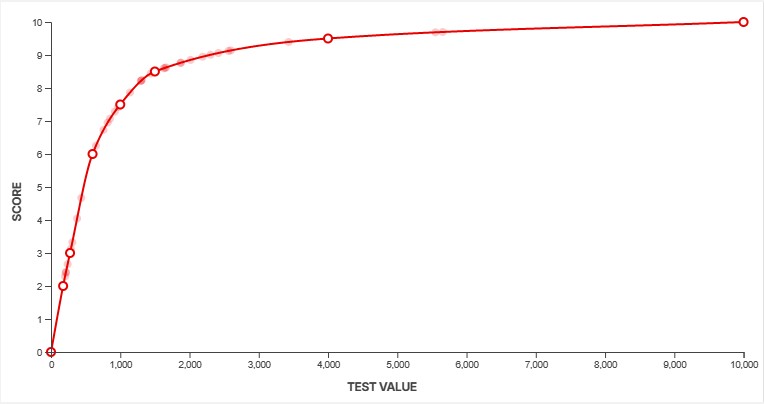
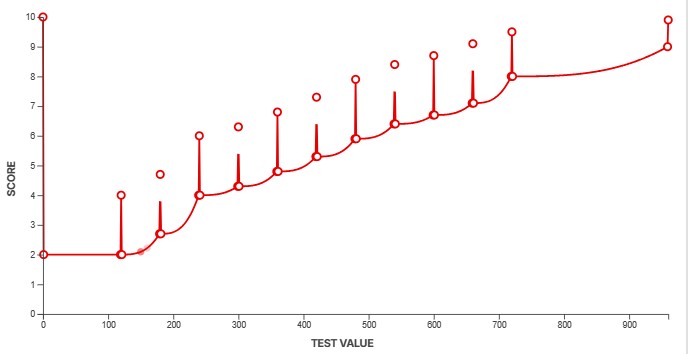
To convert our measurements into scores, we use a feature called a scoring spline. When creating a new test, we define the scoring curve at the same time to ensure our scores align with the scoring guidelines outlined above. We need to know what a good value looks like and how noticeable anything above and below that measurement would be. This defines the overall slope at certain points along the curve. For example, some aspects of a product's performance might yield diminishing returns beyond a certain point. We can adjust the curves to make sure that's accounted for. Other aspects might have a more linear slope, depending on how a change in performance impacts the end user.
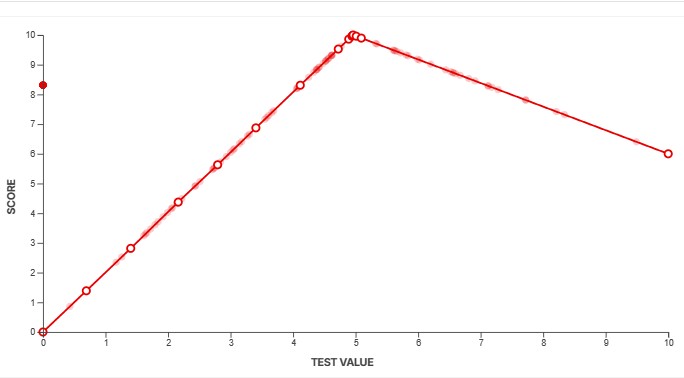
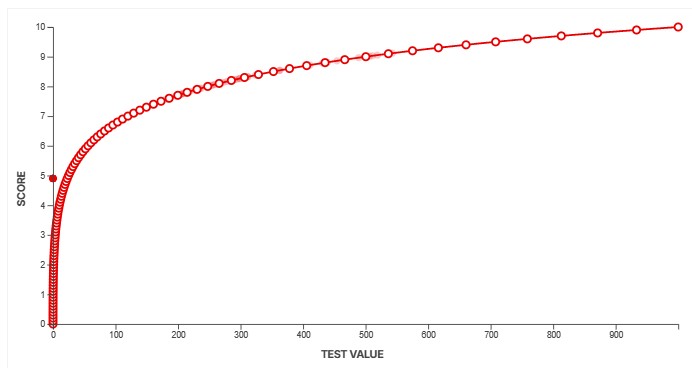
You can see three examples of scoring splines above. The system gives us a lot of flexibility to ensure our scores accurately reflect how a product performs. The example on the left shows a fairly basic, straightforward test. The score increases rapidly at first, before plateauing as the results deliver diminishing returns. The spline in the middle shows a more complicated example. Although we don't actually score this box as of TV test bench 2.1, this box shows the scoring spline for our PWM flicker frequency test. PWM flicker is slightly less noticeable when it's in multiples of 60Hz, and our spline accounts for that by granting a higher score to test results that are multiples of 60. The third example shows an example where a value near the middle is actually best, and anything higher or lower than that is objectively worse.
 |
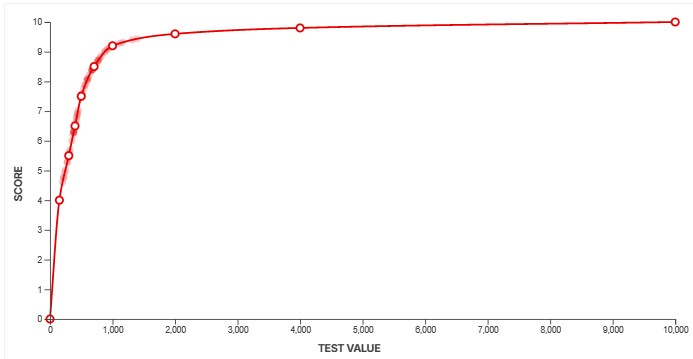 |
These are just a few examples. Across our dozens of product categories and various test benches, we've defined hundreds of similar scoring curves over the years. These curves are also updated over time to represent changing market conditions. Above, you can see the SDR Real Scene Brightness spline on our TV 1.0 test bench, released in 2015, and then again on our 2.1 test bench, released in 2025. You can see the impact of 10 years of TV development through our scoring curves. On 1.0, a "good" value was anything above about 172 nits. On 2.1, a TV would need to hit 500 nits to score the same. Our initial brightness curve gave a maximum score of 10 at 1,000 nits; on 2.1, the curve goes up to 10,000 nits.
This system ensures that our results are directly comparable across products and eliminates the possibility that subjective impressions influence our final results. It's not without its flaws, though, as looking at the scores alone reduces the amount of information presented. If you care about a particular aspect of a product's performance, it's important to look beyond the scores and read the text as well, as scoring splines like this don't always capture exceptions or odd results well.
How To Interpret The Scores
When we define our scoring splines, we target very specific score ranges for different performance levels. This makes it easier for you to read different reviews across our website, so if you see two products that both score a 6.0, for example, you know they've been rated on the same scale, making them more comparable. In our written reviews, we also try to use consistent adjectives across certain scoring ranges. There are some exceptions to this, however, as our scoring doesn't always cover every aspect of a product's performance.
Our scoring is on a fixed, linear scale from 0 to 10. The scores and color coding are designed to make it easy for you to quickly see how a product performs in a particular aspect. The scoring curves assume that you're someone who cares about a particular aspect, so if you're looking at something that scores in the yellow but you don't particularly care about that aspect, then you might not even notice it.
| Score | 0 - 5.9 | 6.0 - 7.4 | 7.5 - 10 |
|---|---|---|---|
| Description | This product performs at an unacceptable level in this test or usage if you care about this aspect. | This product is decent at best for this test or usage. Although it's not bad, if you care about this usage or test, you'll be disappointed. If you don't care, you'll likely still notice this issue, but it won't be a dealbreaker. | This product performs well in this aspect. Anything above a 9 is about as good as it gets, and it'll be difficult to notice the difference between any two products scoring that high. |
| Adjectives | When we discuss tests or products that fall into this category, we usually use adjectives like disappointing, inadequate, poor, inferior, bad, terrible, very bad, awful, etc. | When we discuss tests or products that fall into this category, we usually use adjectives like mediocre, middling, passable, adequate, not bad, unremarkable, decent, okay, alright, acceptable, satisfactory, reasonable, fair, ordinary, etc. We also use sub-par or sub-standard when the score is at the lower end of the scale. | When we discuss tests or products that fall into this category, we usually use adjectives like good, very good, great, impressive, excellent, remarkable, outstanding, etc. |
| Color | Red | Yellow | Green |
Conclusion
Our test bench and scoring systems are two critical components of our reviews. They help ensure that our reviews remain objective and comparable, so you can easily compare two (or more) products and see exactly how they stack up. This, in turn, makes it easier to make an informed buying decision.