Color volume is a representation of the number of colors a TV can display at different brightness levels. As you want a TV to display as many colors as possible, it's important to have a TV with good color volume so that when you watch content, particularly in HDR, highlights stand out the way the creator intended. There are a few factors that help a TV have a good color volume, like color gamut, brightness, and contrast.
We measure the color volume in the DCI-P3 and Rec. 2020 color spaces using a colorimeter and software that calculates the volume.
Test results
When It Matters
High Dynamic Range (HDR) content is the latest innovation to provide more color detail to film and video. It requires higher peak brightness, better contrast, and greater color reproduction than SDR content (see the differences between SDR and HDR). Color volume is a measurement of the different colors a TV displays at various brightness levels, meaning a TV with good color volume displays both dark and bright colors well, making content look more realistic. TVs with poor color volume don't show as many details.
Color volume is similar to our color gamut test because we measure them at the same time, but they tell us different things. While the color gamut test tells us which colors a TV displays, the color volume tells us at which brightness it can display them. So if we know the display shows the color red, we also want to know how dark and bright it can make it.
Our Tests
We test for color volume at the same time as the color gamut and the EOTF test that's in the HDR Brightness test. We connect our PC with an NVIDIA GTX 1060 or GTX 1660 graphics card to the TV via HDMI, and we use an HDFury Linker to send HDR signals to the TV. We then hook up our Colorimetry Research CR-100 colorimeter to the PC and set it up in front of the TV. After measuring the EOTF and the color gamut, we use CalMan 5 for Business software to measure the color volume. The software automatically measures the color volume and processes the results for us. We run this test with our most accurate settings, including after calibrating the HDR white point to 6500K.
1,000 cd/m² DCI-P3 Coverage ITP
This test evaluates how much of the DCI-P3 color space a TV can cover at different luminance levels relative to a theoretical TV with a peak brightness of 1,000 cd/m². Of the new wider color gamuts, DCI-P3 is the most common color space for HDR content, and many TVs master it well.
We already know that bright TVs should be able to produce bright colors. We want to know how much the brightness impacts the color volume, so we compare the measured color volume to an ideal TV with a peak brightness of 1,000 cd/m². The result is given as a percentage of the DCI-P3 volume in the ICtCp color space. Any parts of the measured volume which fall outside of the target volume (too bright or too saturated compared to an ideal TV reference) aren't included in the result. For example, if a TV has 90% color volume, it means it displays 90% of the colors compared to an ideal TV of the same peak brightness. This also means that no TV can exceed 100%, as anything beyond the ideal color volume is ignored.
Before test bench update 1.8, this test was done relative to a theoretically ideal TV with the same peak brightness as the TV we were testing. We changed this to show the color volume relative to an ideal TV with a peak brightness of 1,000 cd/m². This was done to give a better point of comparison between TVs. Since most TVs on the market have a peak brightness close to 1,000 cd/m², and the vast majority of HDR content is below this, it gives a better real-world comparison and better represents what you should expect when watching HDR content. A TV that performs well with this test will display bright colors that look vivid and realistic. A TV that performs poorly with this test will generally look dull and muted.
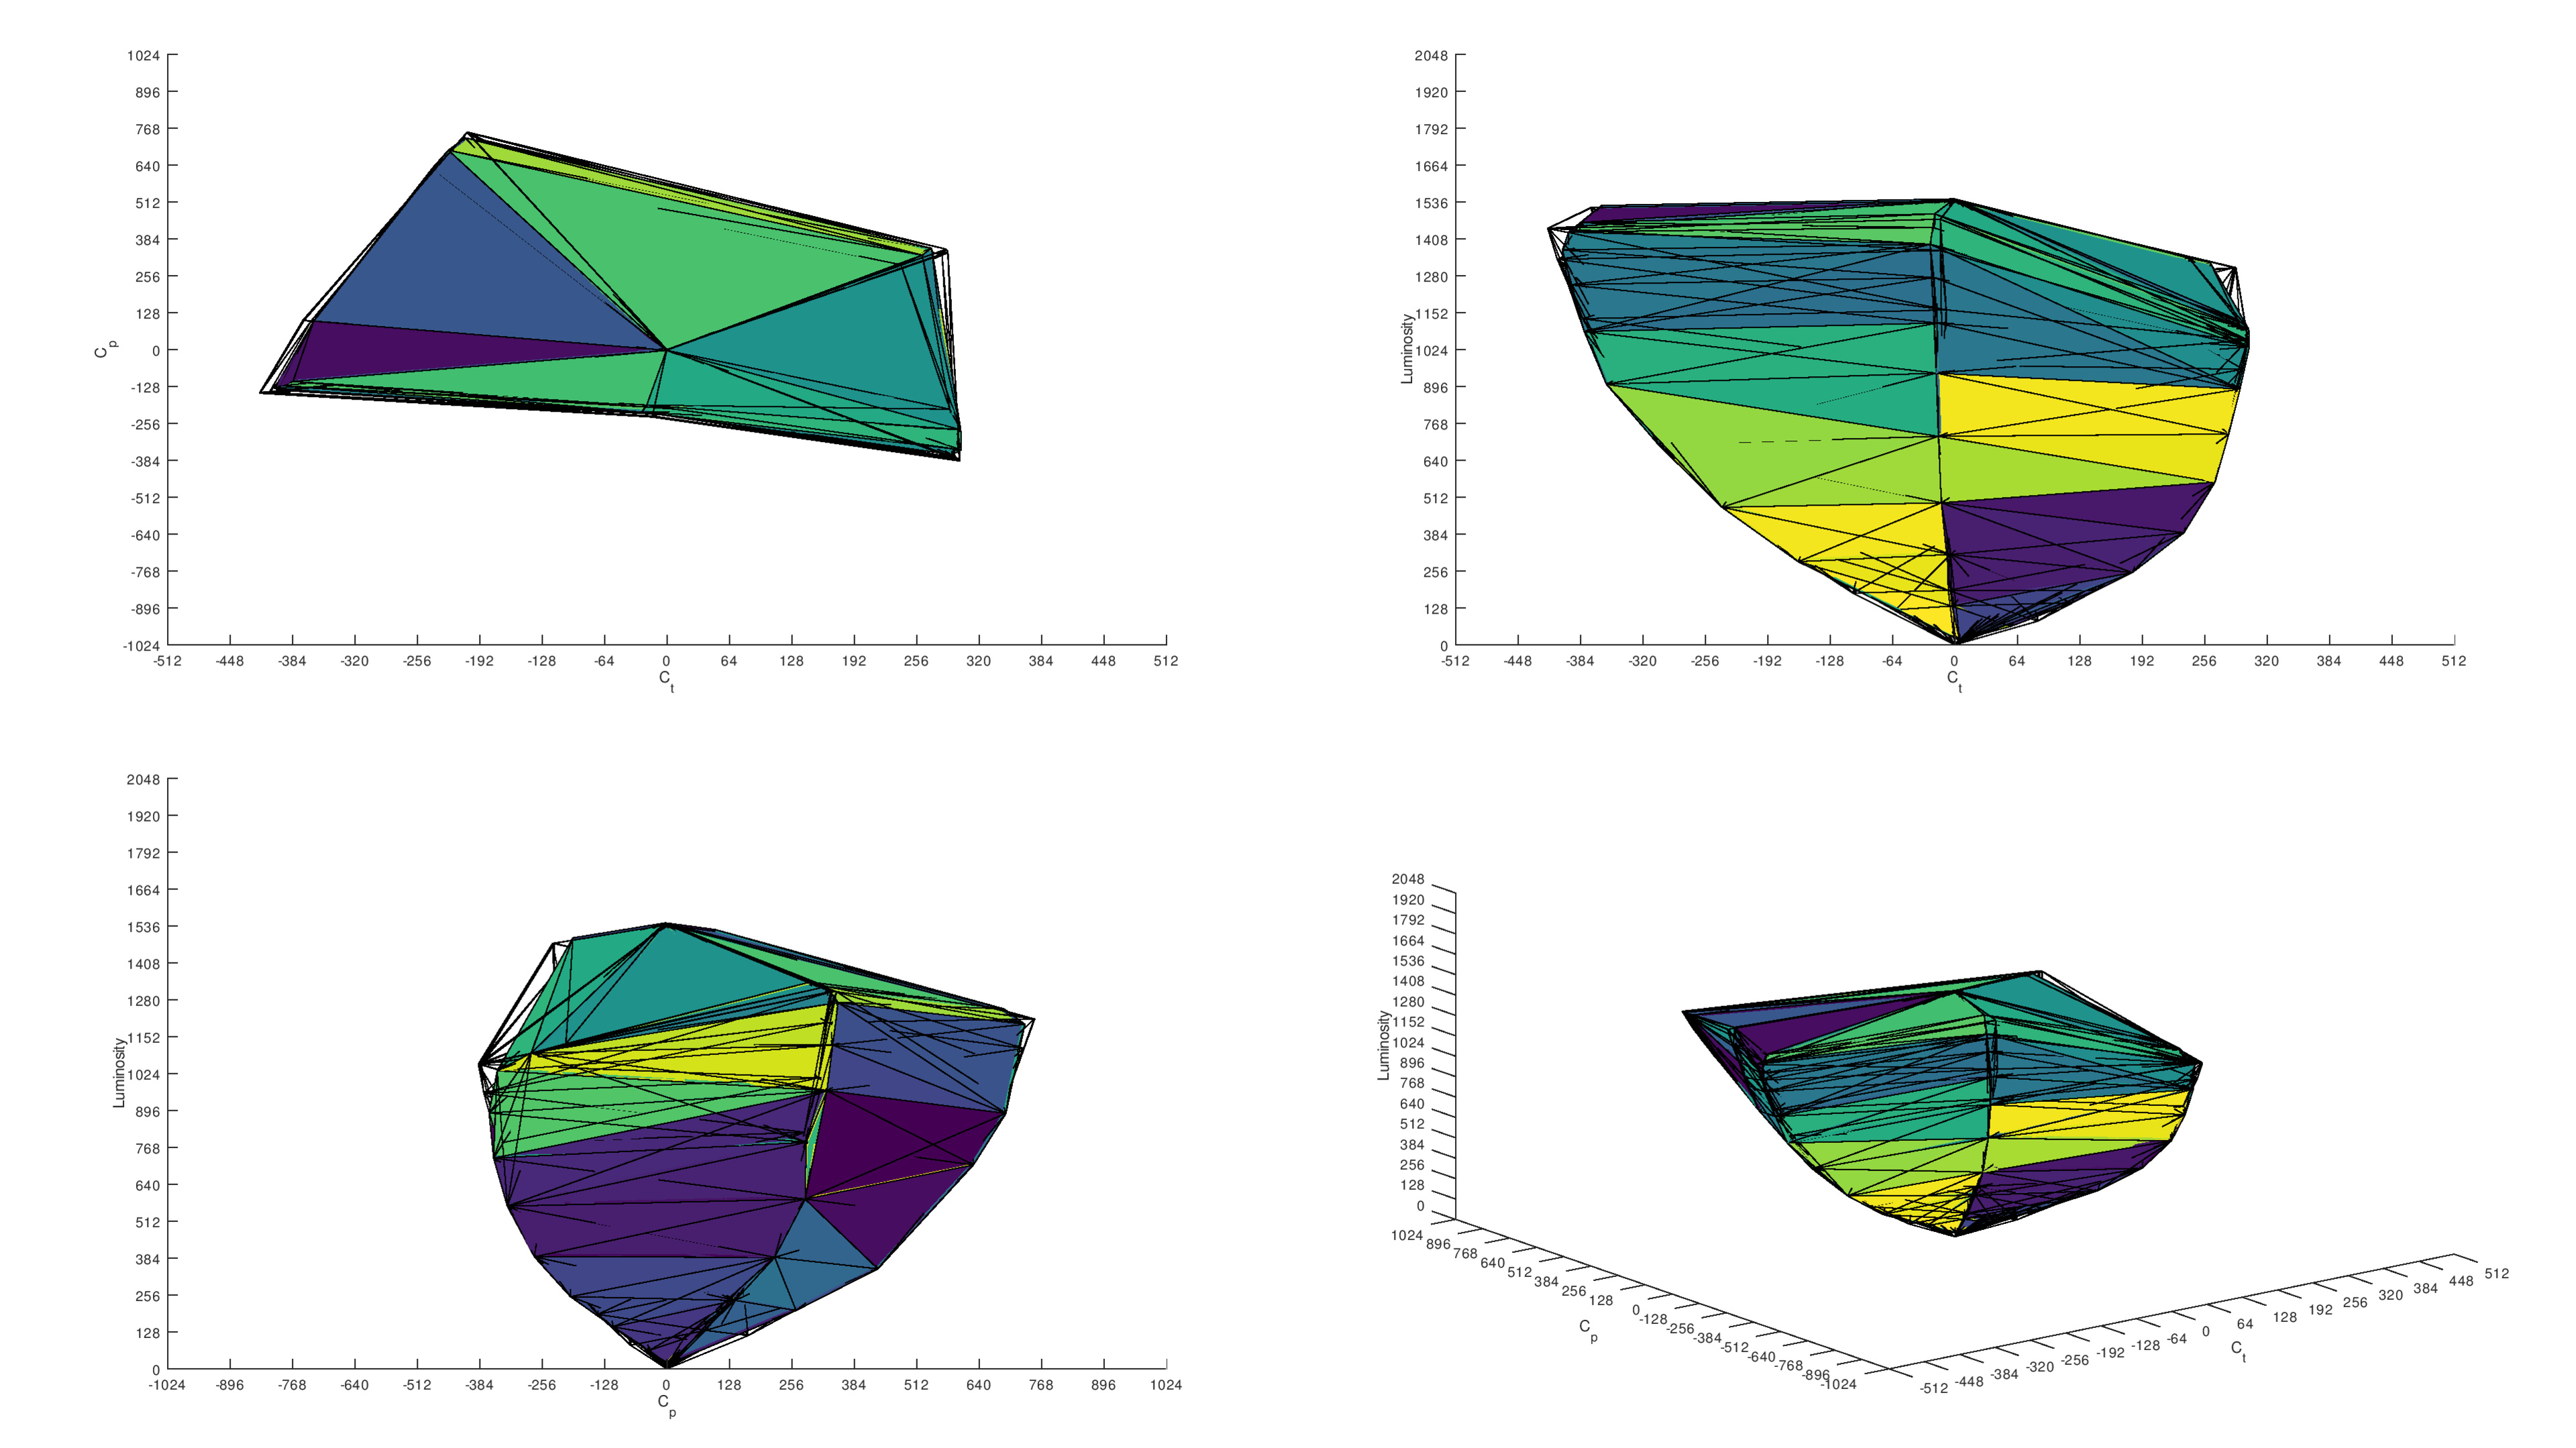
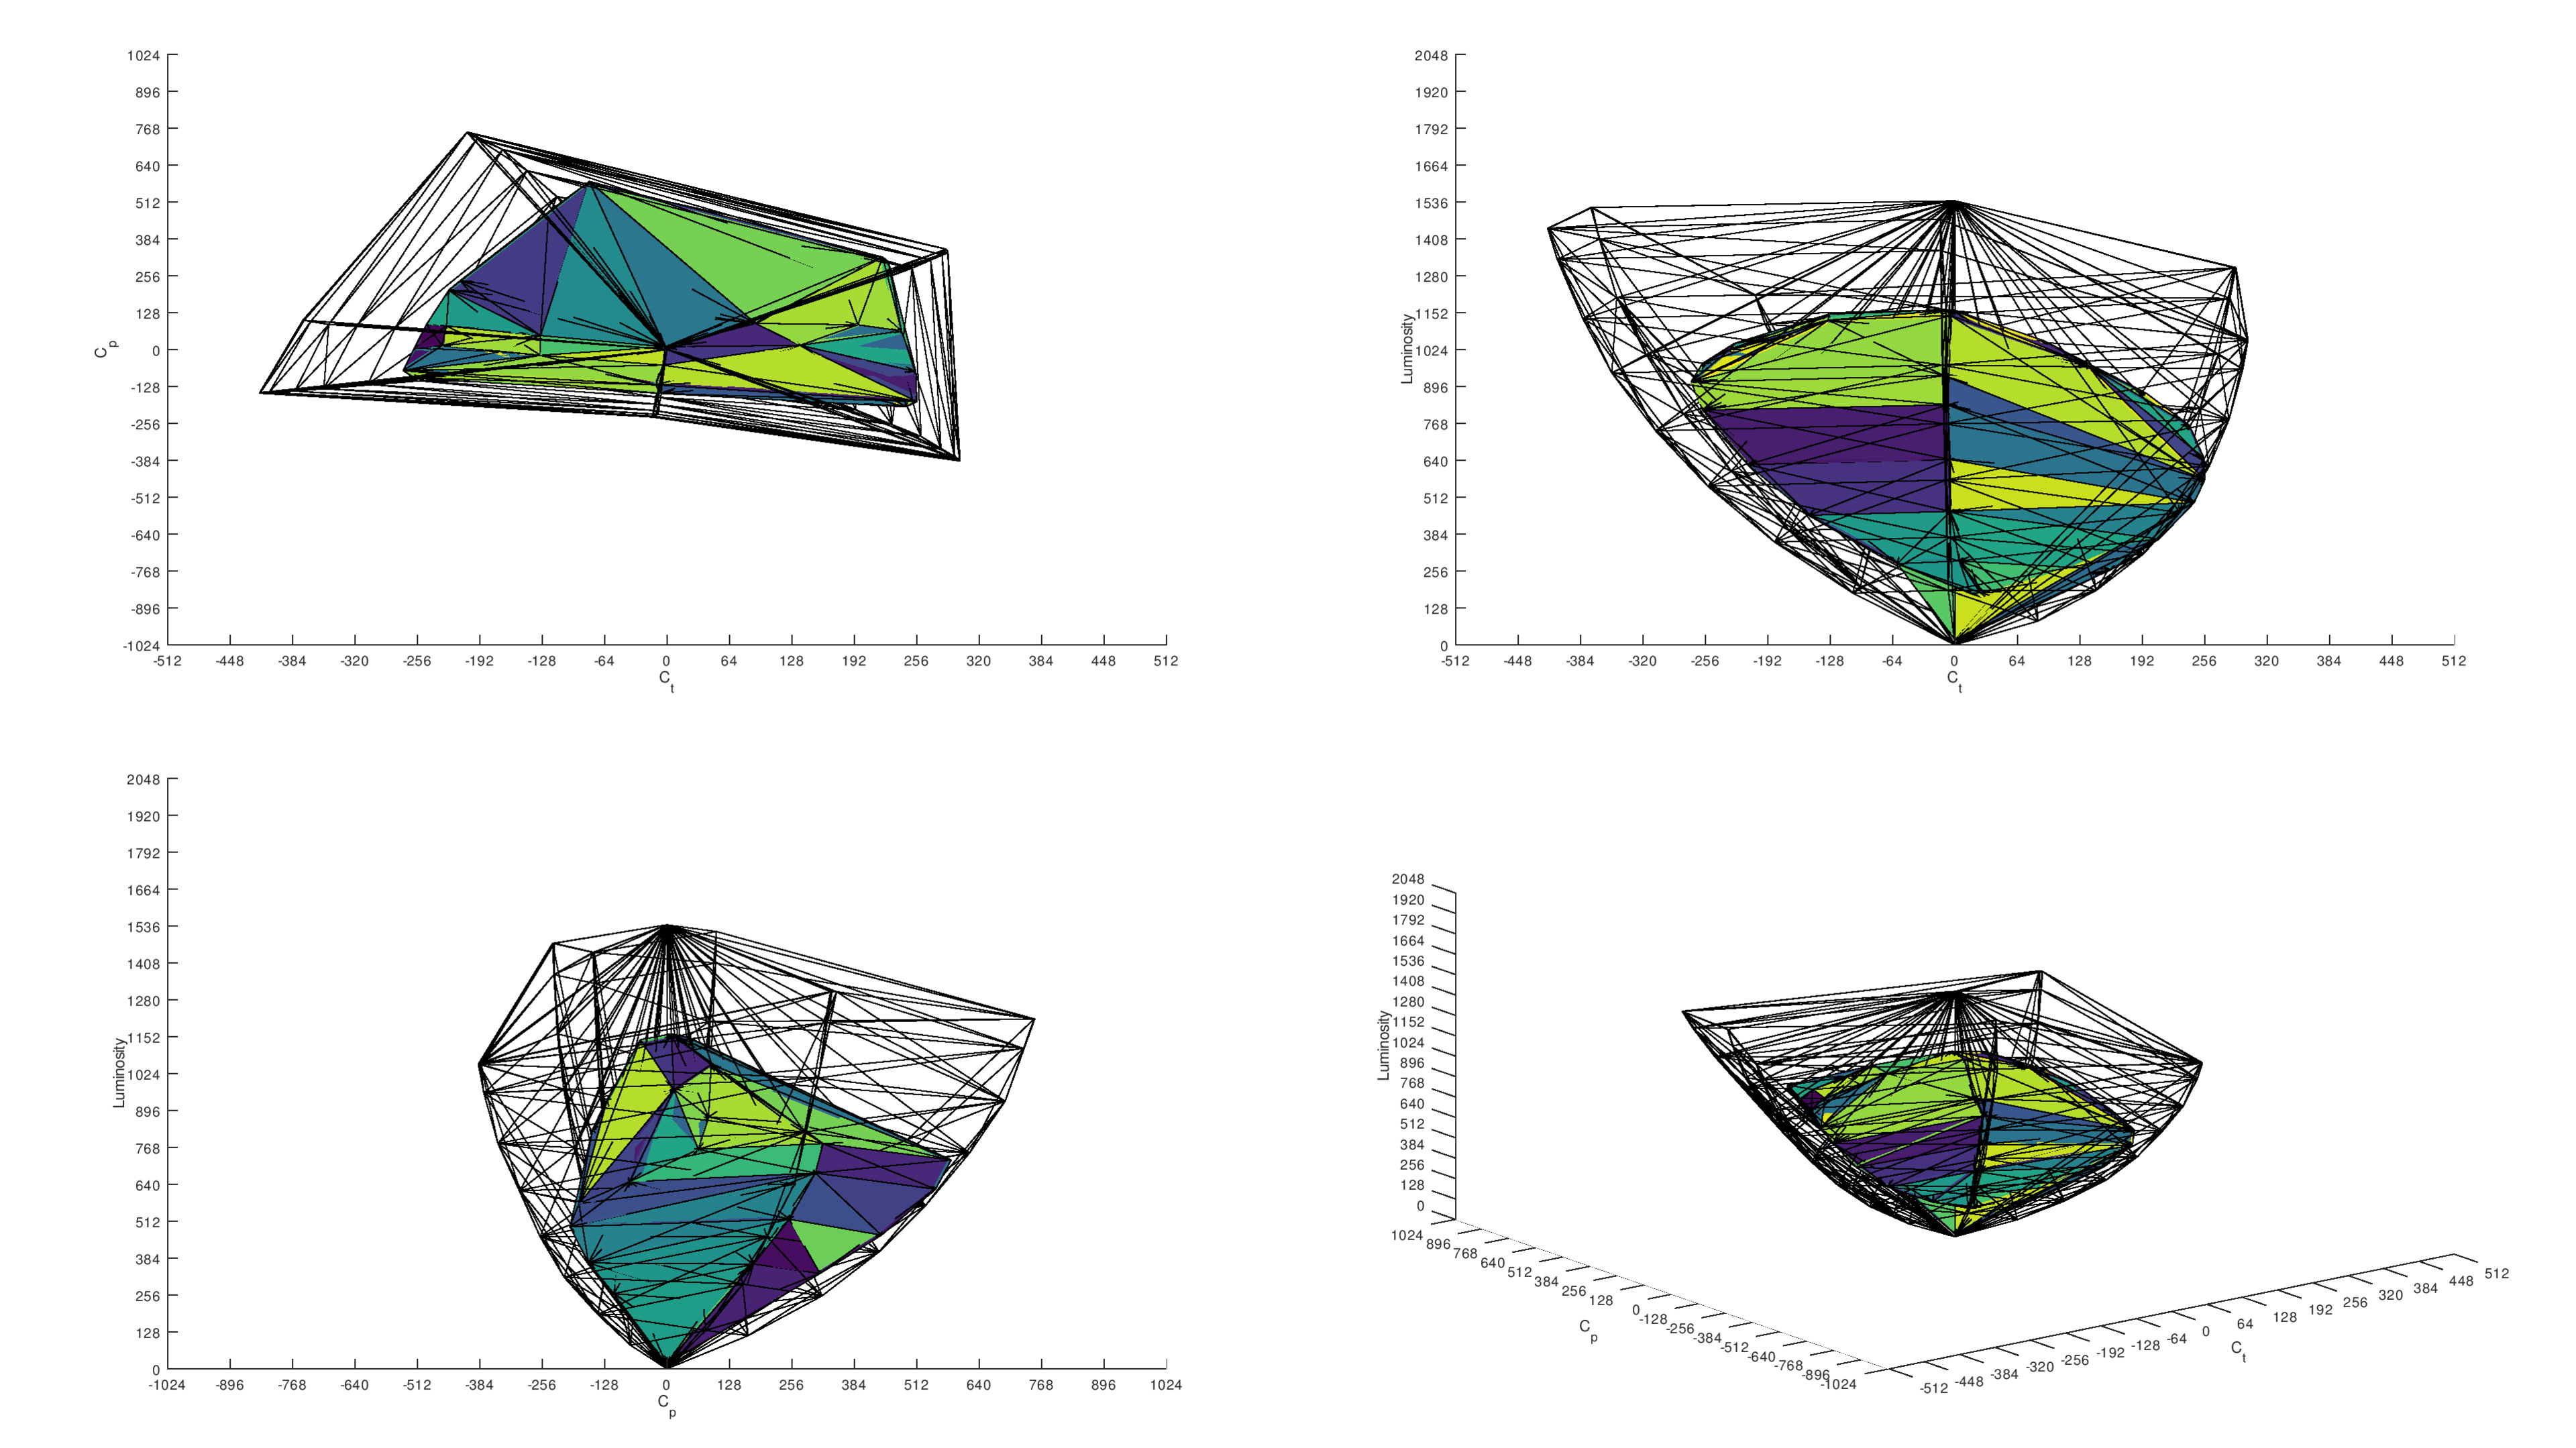
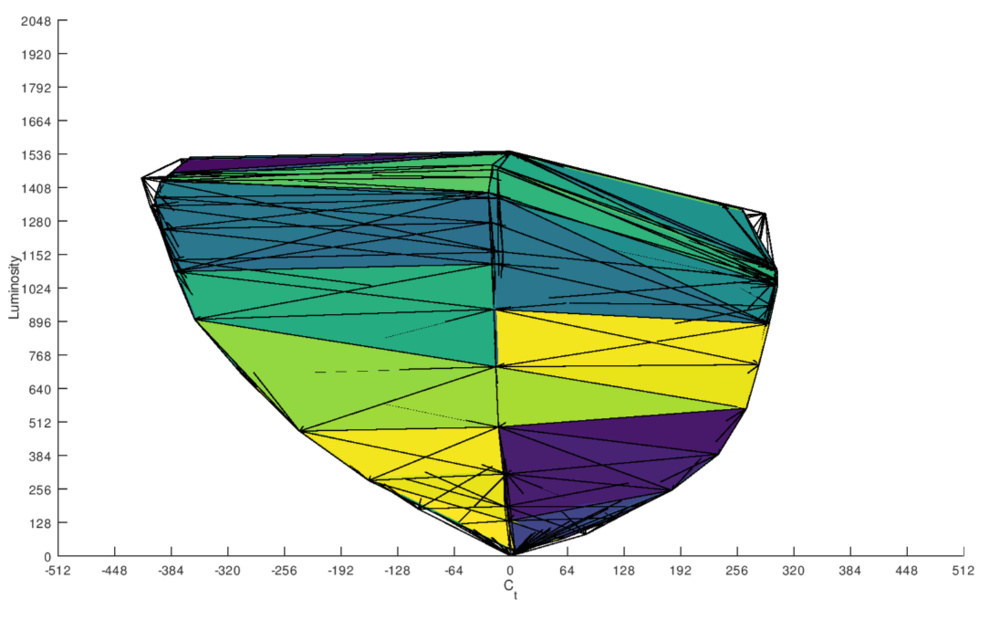
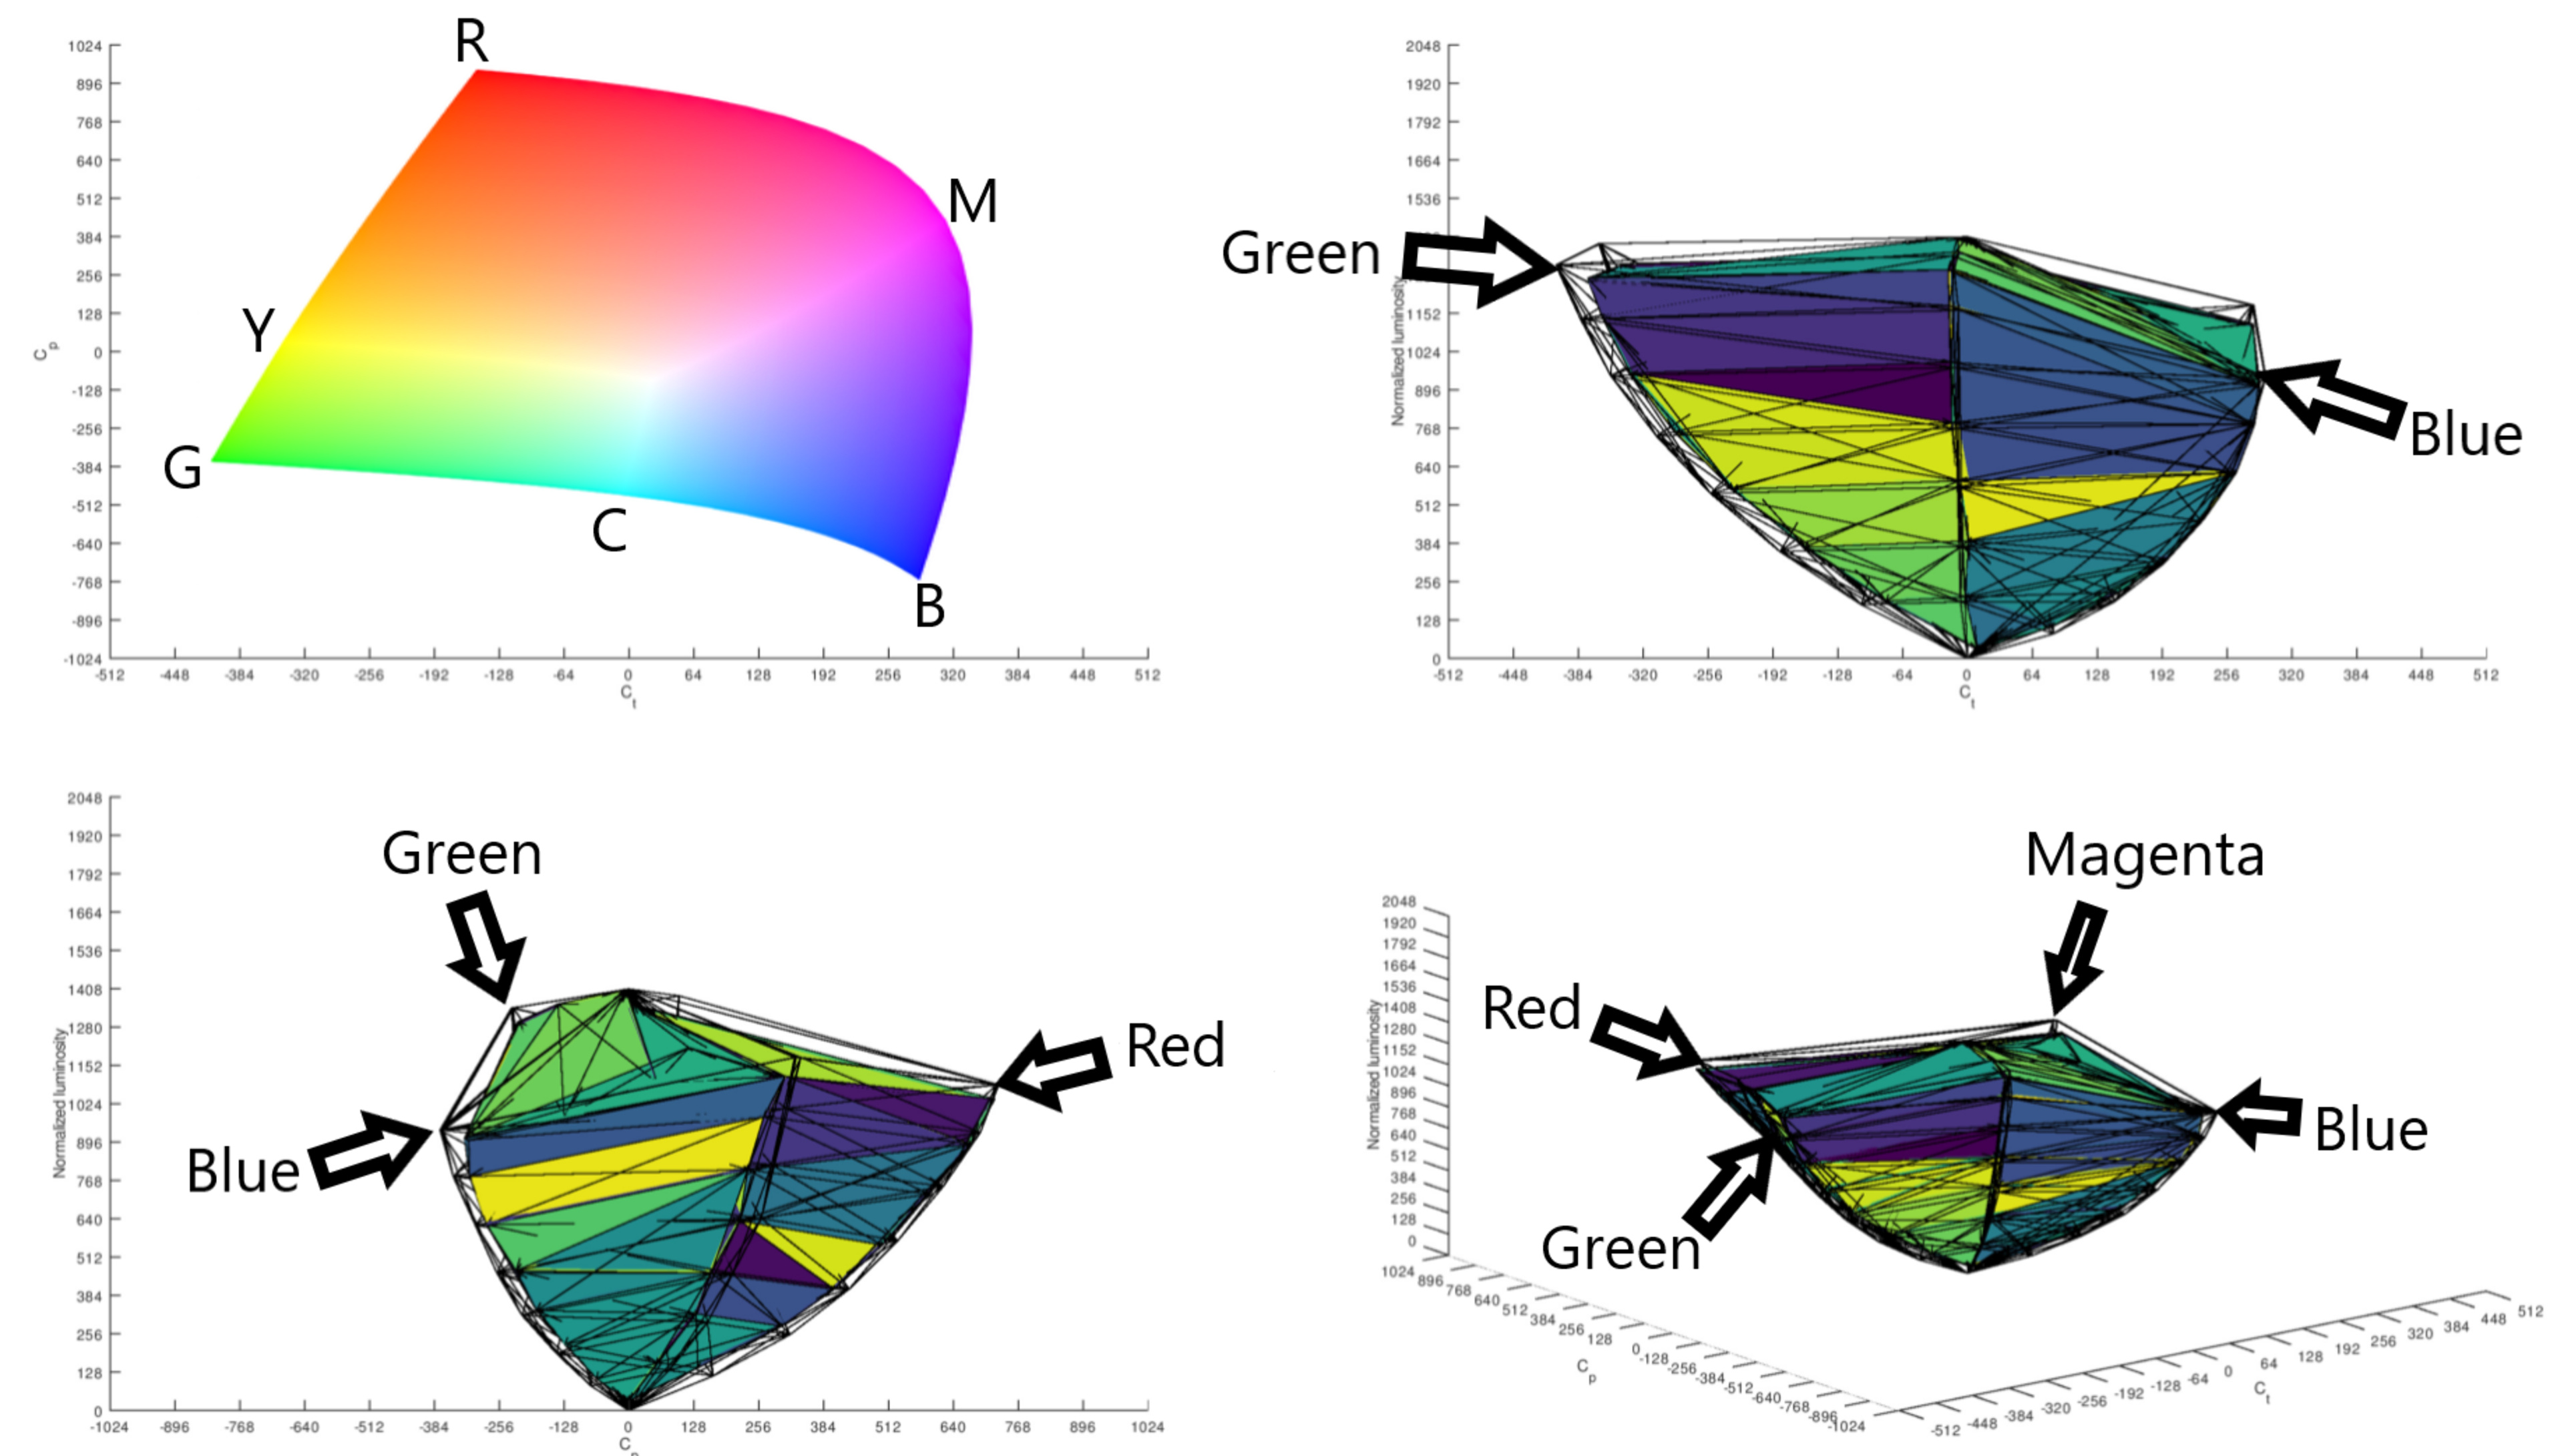 Above are two TVs: one with excellent color volume on the left and one with mediocre color volume on the right. Interpreting the graphs may be a challenge, so let's explain that first. What you're looking at is basically a 3D model, or a bubble, of colors. The picture on the top left is a top view of the bubble with the entire color gamut being represented, although you don't see it. The three other figures represent side views of the bubble; the y-axis labeled Normalized Brightness shows the bright colors on top and dark colors at the bottom. The black lines are the color volume of an ideal TV, while the colored parts are from the tested TV, so the more it fills out, the better. You can see the Samsung fills out a lot more of the bubble compared to the LG. On the right, you can see a diagram explaining where the different colors are in the bubble.
10,000 cd/m² Rec. 2020 Coverage ITP
This test evaluates the Rec. 2020 performance of a TV when compared to an ideal TV with a peak brightness of 10,000 cd/m². This test evaluates how much of the larger Rec. 2020 color space a TV can cover at different luminosity levels. It's performed using the same method as the DCI-P3 test described above but targets the Rec. 2020 primary and secondary colors. The result is given as a percentage of the Rec. 2020 volume, which an ideal TV would cover at the measured brightness level.
Since the Rec. 2020 color space is wider than the DCI-P3 color space, it's rare for TVs to have good color volume with Rec. 2020.
 Rec. 2020 coverage: 51.7%
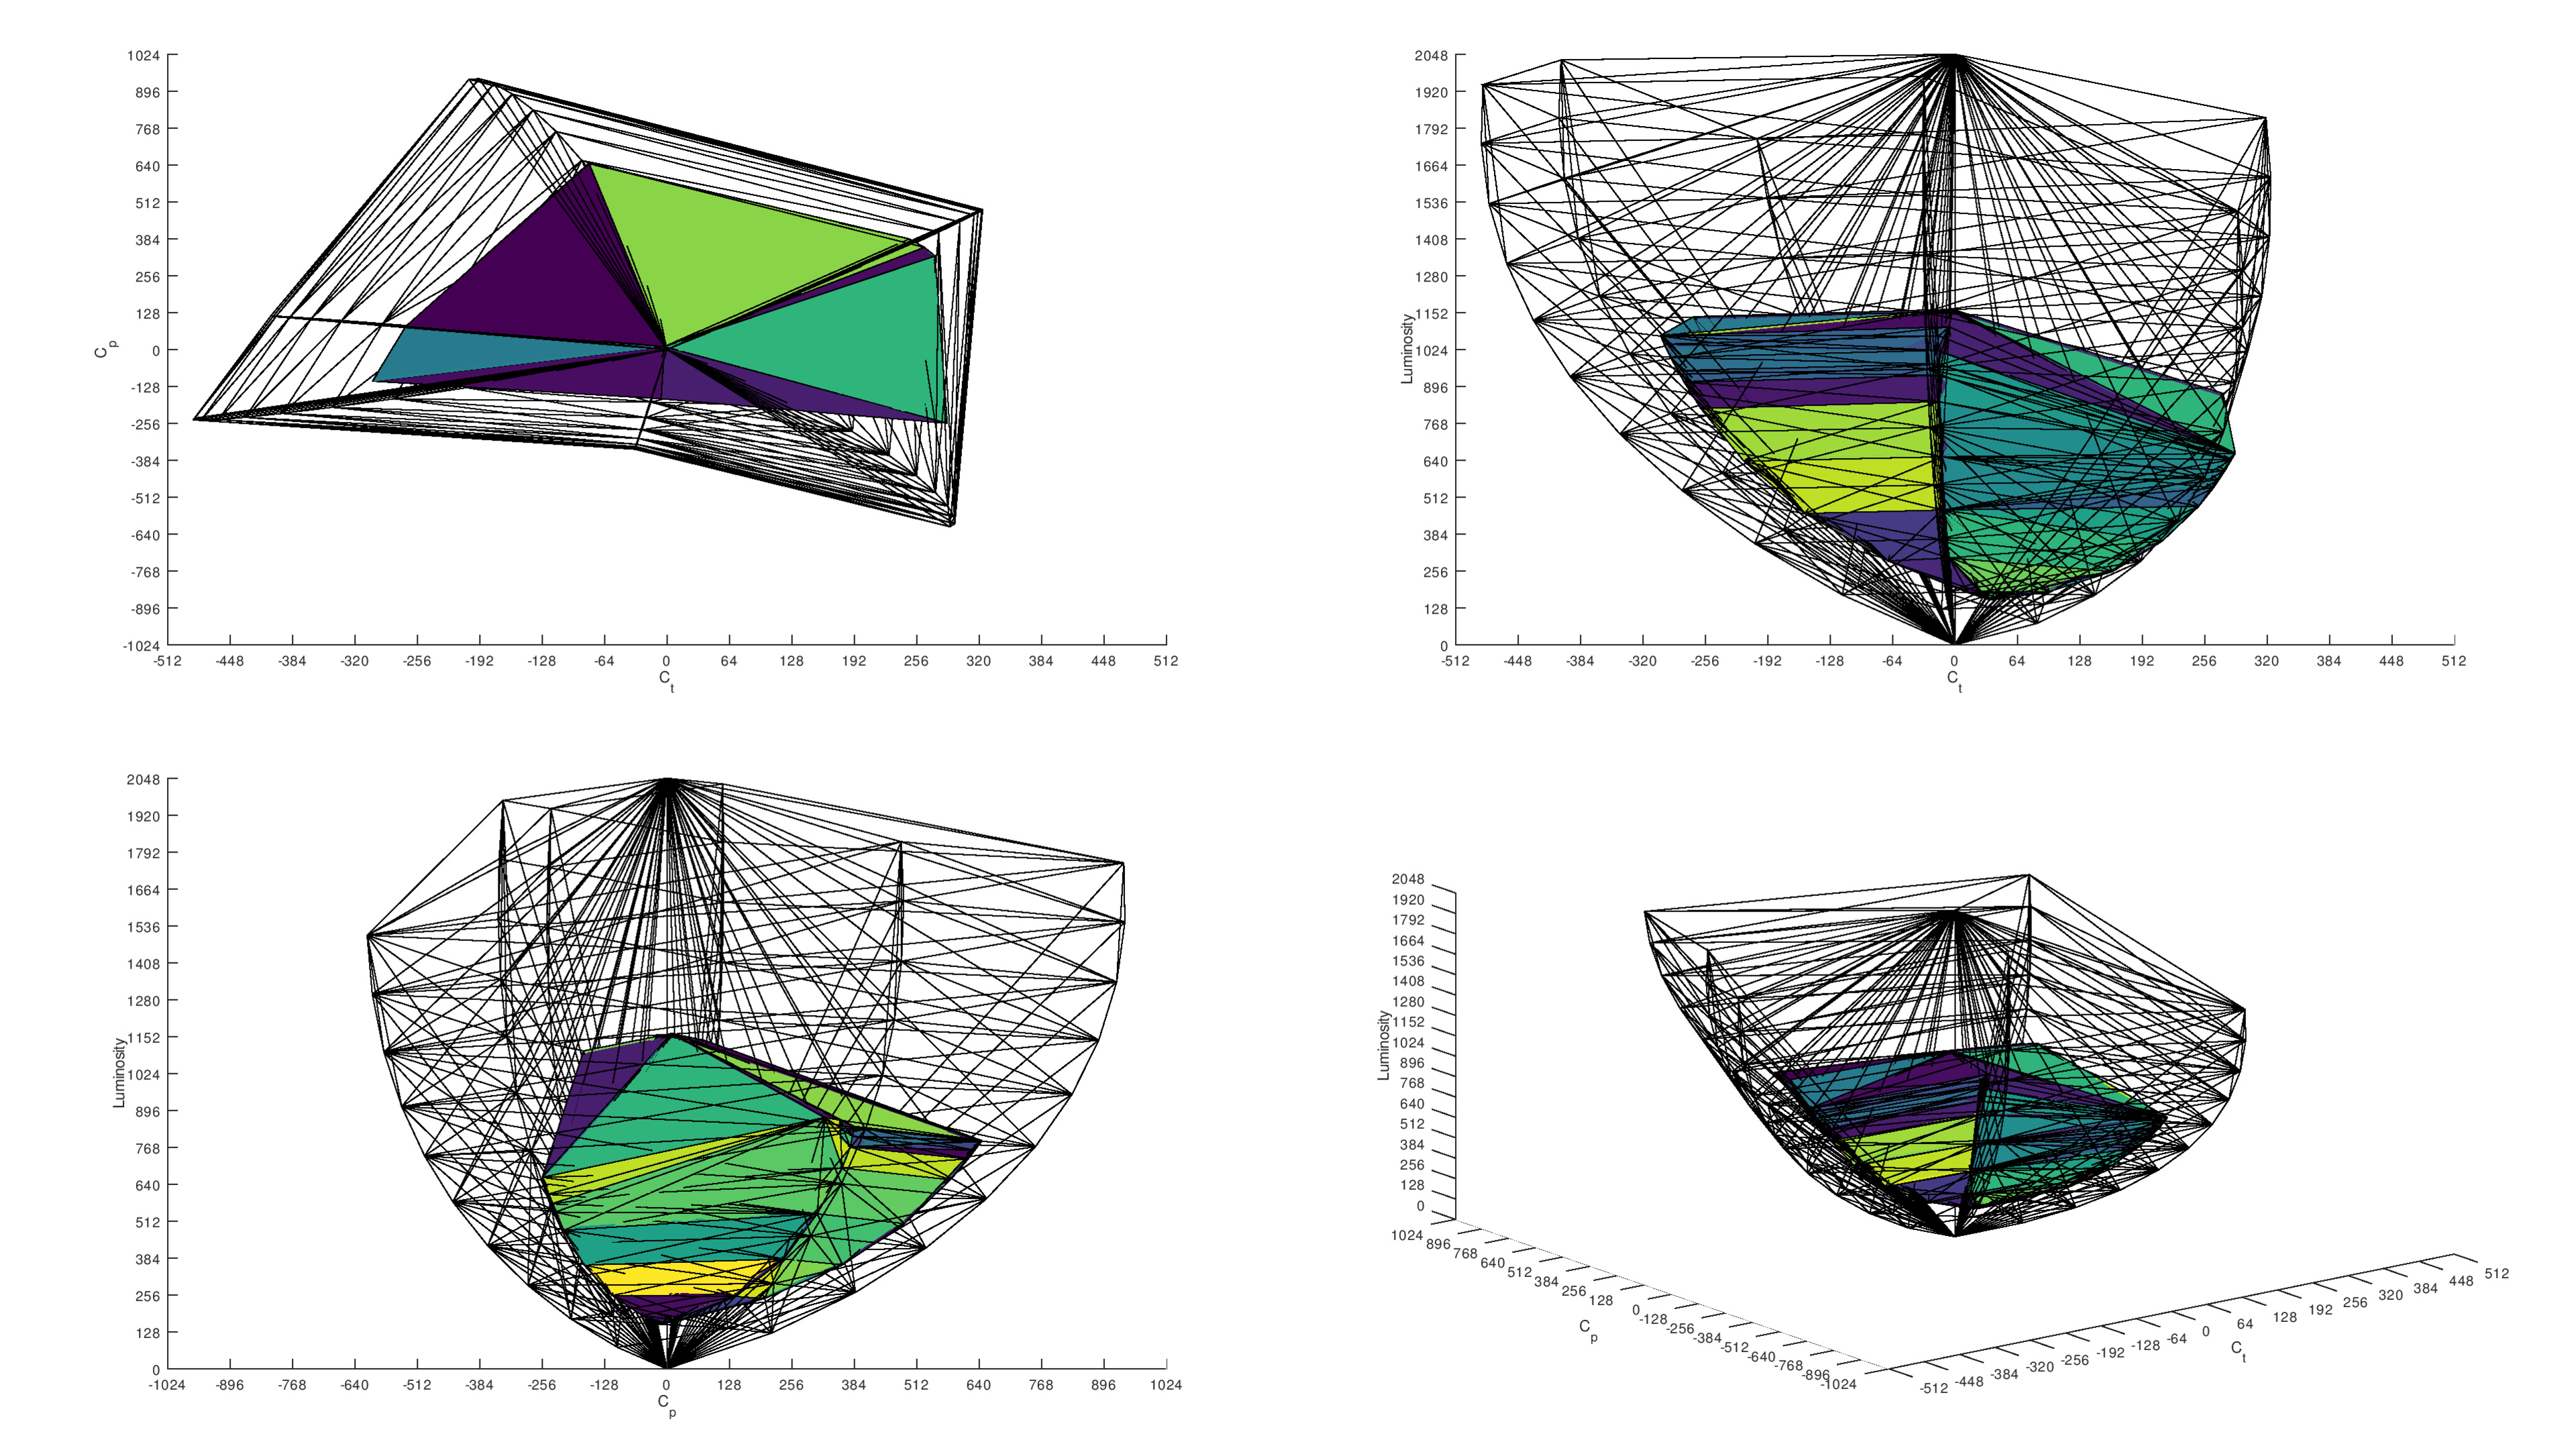
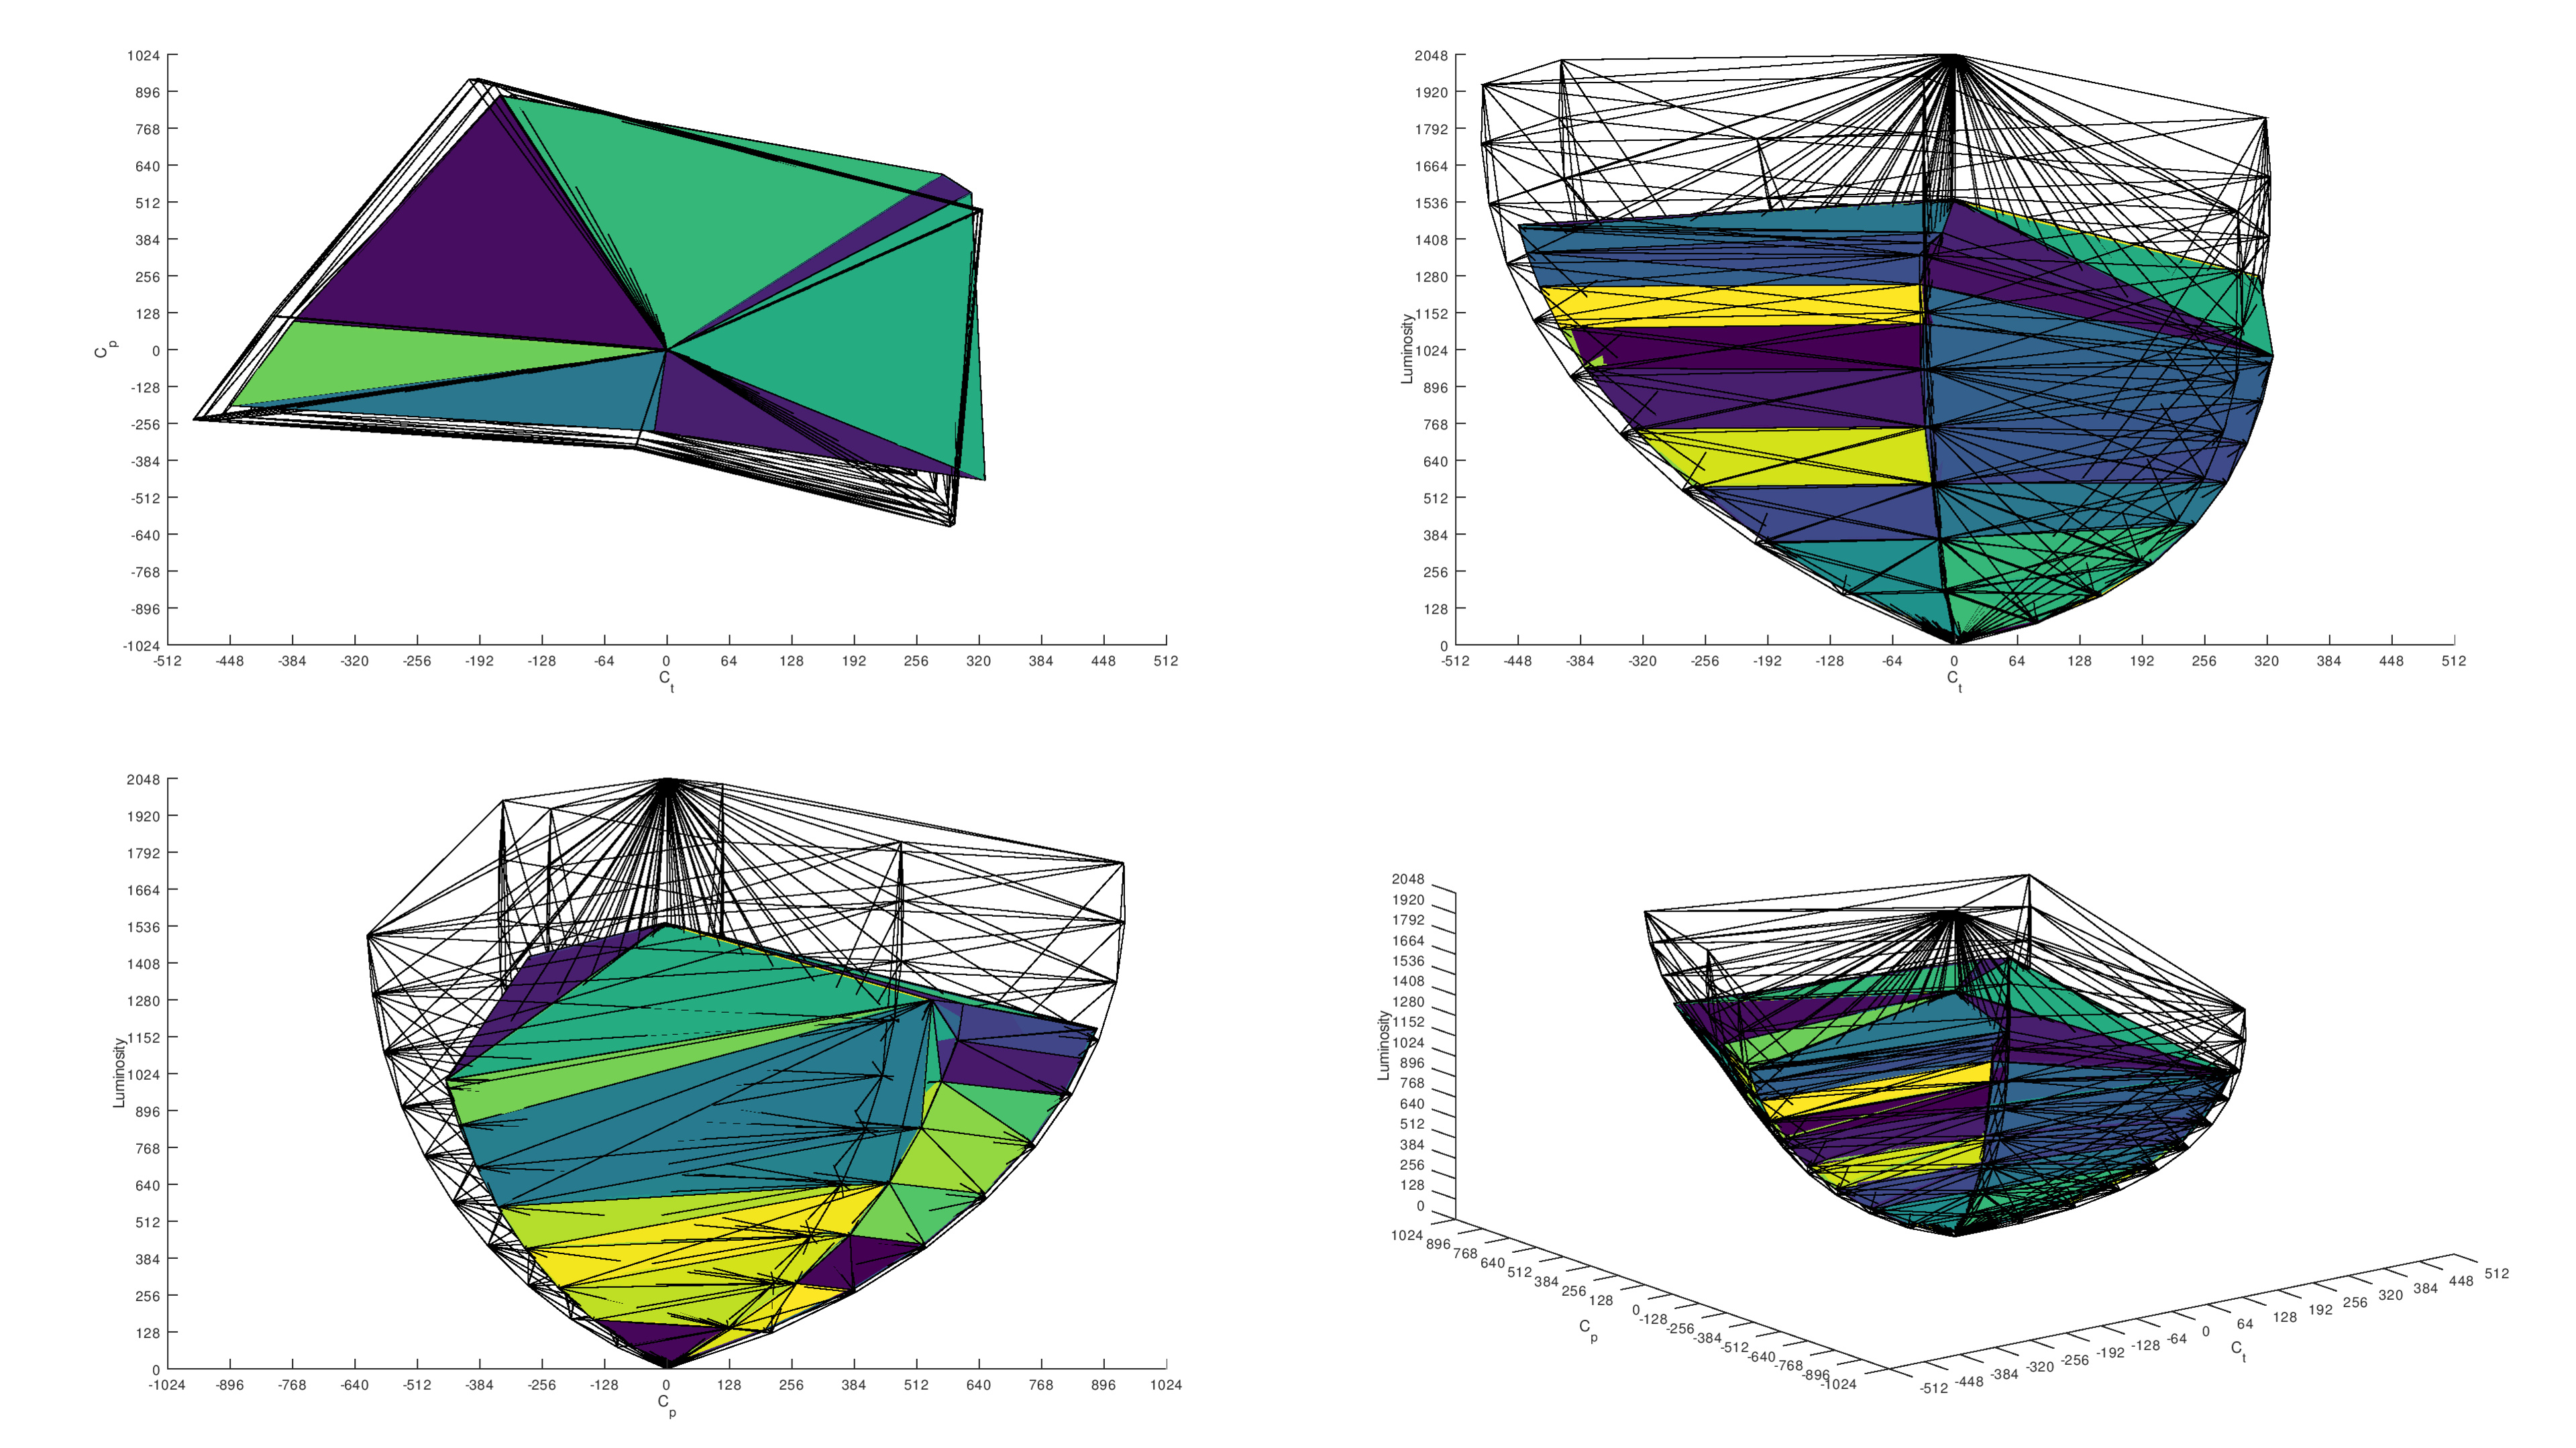
Reading the graphs above is the same as the DCI-P3 graphs. As you can see above, even one of our better TVs with Rec. 2020 color volume, the Samsung S95B OLED doesn't hit the primary colors as well as it did in the DCI-P3 charts above.
Color Luminance
We also measure the maximum luminance of pure white, red, green, blue, cyan, magenta, and yellow. We do this so you can see how colors are compared to pure white. Since most TVs use a combination of red, green, and blue subpixels, every other color you see on the TV is a combination of these three subpixels. The exception to this is OLED TVs that use an RWBG subpixel layout, like the LG C2 OLED. Since these TVs have a separate white subpixel, pure whites are brighter than other colors, and colors in general aren't very bright. As you can see in the below graphs, the Samsung S95B OLED, which doesn't use an RWBG layout, has much better color volume than the LG C2 OLED.
 Samsung S95B OLED Without Elevated Whites
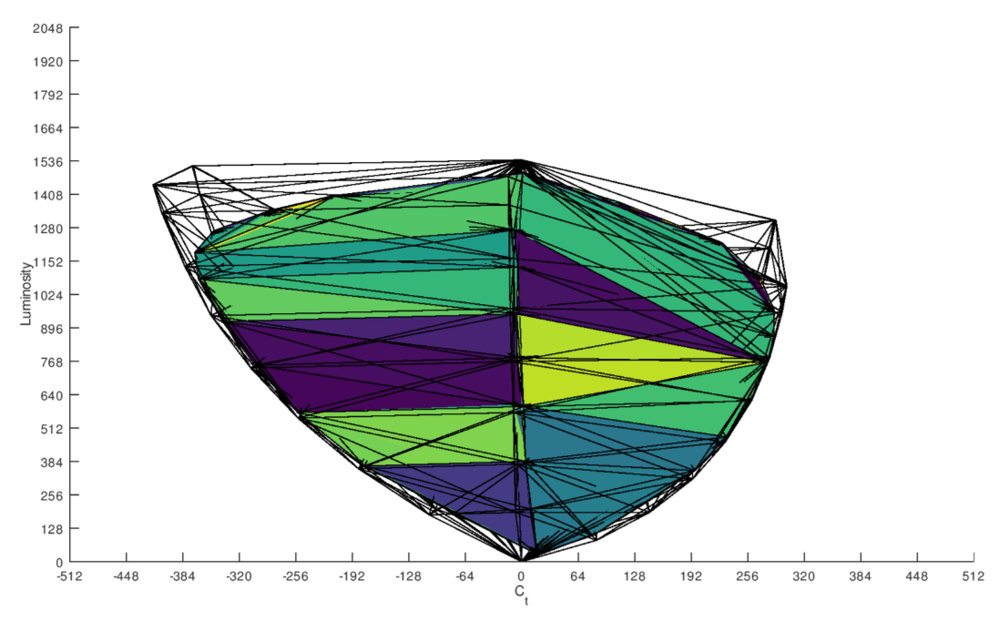 LG C2 OLED With Elevated Whites
When looking at the color measurements, it's important to keep in mind that the individual color measurements don't matter as much as how they relate to each other. The human eye doesn't perceive colors equally; it's far more sensitive to green than it is to blue, for example. It's perfectly normal for the blue luminance to be significantly lower than red or green.
Additional Information
ICtCp Color Space
For a color volume measurement to be significant, it should correspond to the way we perceive colors at different luminosity levels. The eye is much more sensitive to small changes in the luminosity of a dim light compared to a bright one. Although the measured change in luminosity may be the same, the bright source with a less perceivable difference should have less impact. This means that the way luminance is viewed by the human eye isn't linear, and our testing accounts for that.
ICtCp is a color space designed for HDR content and mimics the human eye's response. As a result, it's more perceptually uniform.
Color Gamut vs Color Volume
As mentioned in the 'When It Matters' section, color gamut and color volume are related to each other but are somewhat different. Our color gamut test is a 2D cross-section of the 3D color volume bubble, and it tells us how many different colors it displays at that specific cross-section. Imagine you have a cheese sandwich. If you take a bite of just the cheese, you know what the cheese tastes like; this is like the color gamut. However, to fully understand the flavors of the sandwich and how they work together, you have to take a bite of the entire sandwich; this represents the color volume of the TV. Since we test our color gamut at 75% stimulus, the specific slice is at 75% of the way up in the color volume bubble.
How To Get The Best Results
For TVs that support a wide color gamut, it's activated automatically once the TV detects supported content. You may have to enable full-bandwidth signals for HDR content.
The best settings to use are the same as those suggested for HDR content:
- Set the backlight to maximum. This allows you to take advantage of the bright highlights and colors.
- If there's a local dimming option, activate it. Reducing the intensity of the backlight in some parts of the screen allows for a wider range of colors in dark scenes.
Related Settings
On some TVs, the 'Color Space' option allows the color space of the TV to be adjusted. This target must match between the source and the TV, so should almost always be left to 'Auto' for HDR content. If you set it to Native, if that option is available, the TV stays in the same color space and adjusts the content accordingly, which may cause colors to be over-saturated.
Other Notes
- No TV can display all of the Rec. 2020 color space. As a result, they have to either clip colors that lie outside of their capabilities or compress the colors to fit them into the display limitations (or some combination of these two) in a process called tone mapping. There's no standard for calibrating these wider color spaces because there's no reference to what a display should do and how this tone mapping should be performed.
Conclusion
The color volume coverage of a TV describes how many colors it can display at a range of luminosities. The larger a TV's color volume is, the greater range of saturated colors it can produce. A large color volume is useful for HDR content, which takes advantage of this wider color range and results in a better image. For SDR content such as DVDs or cable boxes, the color volume is less significant as the content is not designed to take advantage of these wider color spaces. For the color volume test, we measure how much of the DCI-P3 and Rec. 2020 color spaces the TV can cover. Unlike the color gamut, the color volume assesses performance for both dark and bright scenes.