This article explores our process of creating tests for our new product category: keyboard switches. The goal of these tests is to provide data for a wide selection of switches to help you find the best ones for your needs. These tests can also help us improve our keyboard reviews, letting us project a keyboard's performance using different switches than those we bought and tested in our review.
This article focuses on the design and the data validation of the Latency, Keystrokes, and Smoothness tests. It covers the investigation that we went through to consolidate our knowledge of keyboard switches and the validation of our tests based on a sample of 101 switches. Among all investigations, we've confirmed several things:
- There's a clear correlation between latency and pre-travel.
- The actuation and latency are mostly consistently different between switch units.
- The perceived smoothness of the switch is more than the small change of resistance felt when pressed.
The article splits the major aspects into different sections, covering their respective issues, investigations, and result analysis.
Latency
By testing keyboard switch models individually, we can build a database of each switch model's respective contribution to a keyboard's latency. This will allow us to approximate the PCB latency of every keyboard by subtracting the switch pre-travel latency from the keyboard latency from the review. This database will also help address an issue in our current keyboard reviews: we only test a keyboard with one switch model, which may not be representative if you want to buy that keyboard and use a different switch. We hope to give you the ability to convert our results to approximate keyboard performance with a different switch model than the one we tested.
The Problem
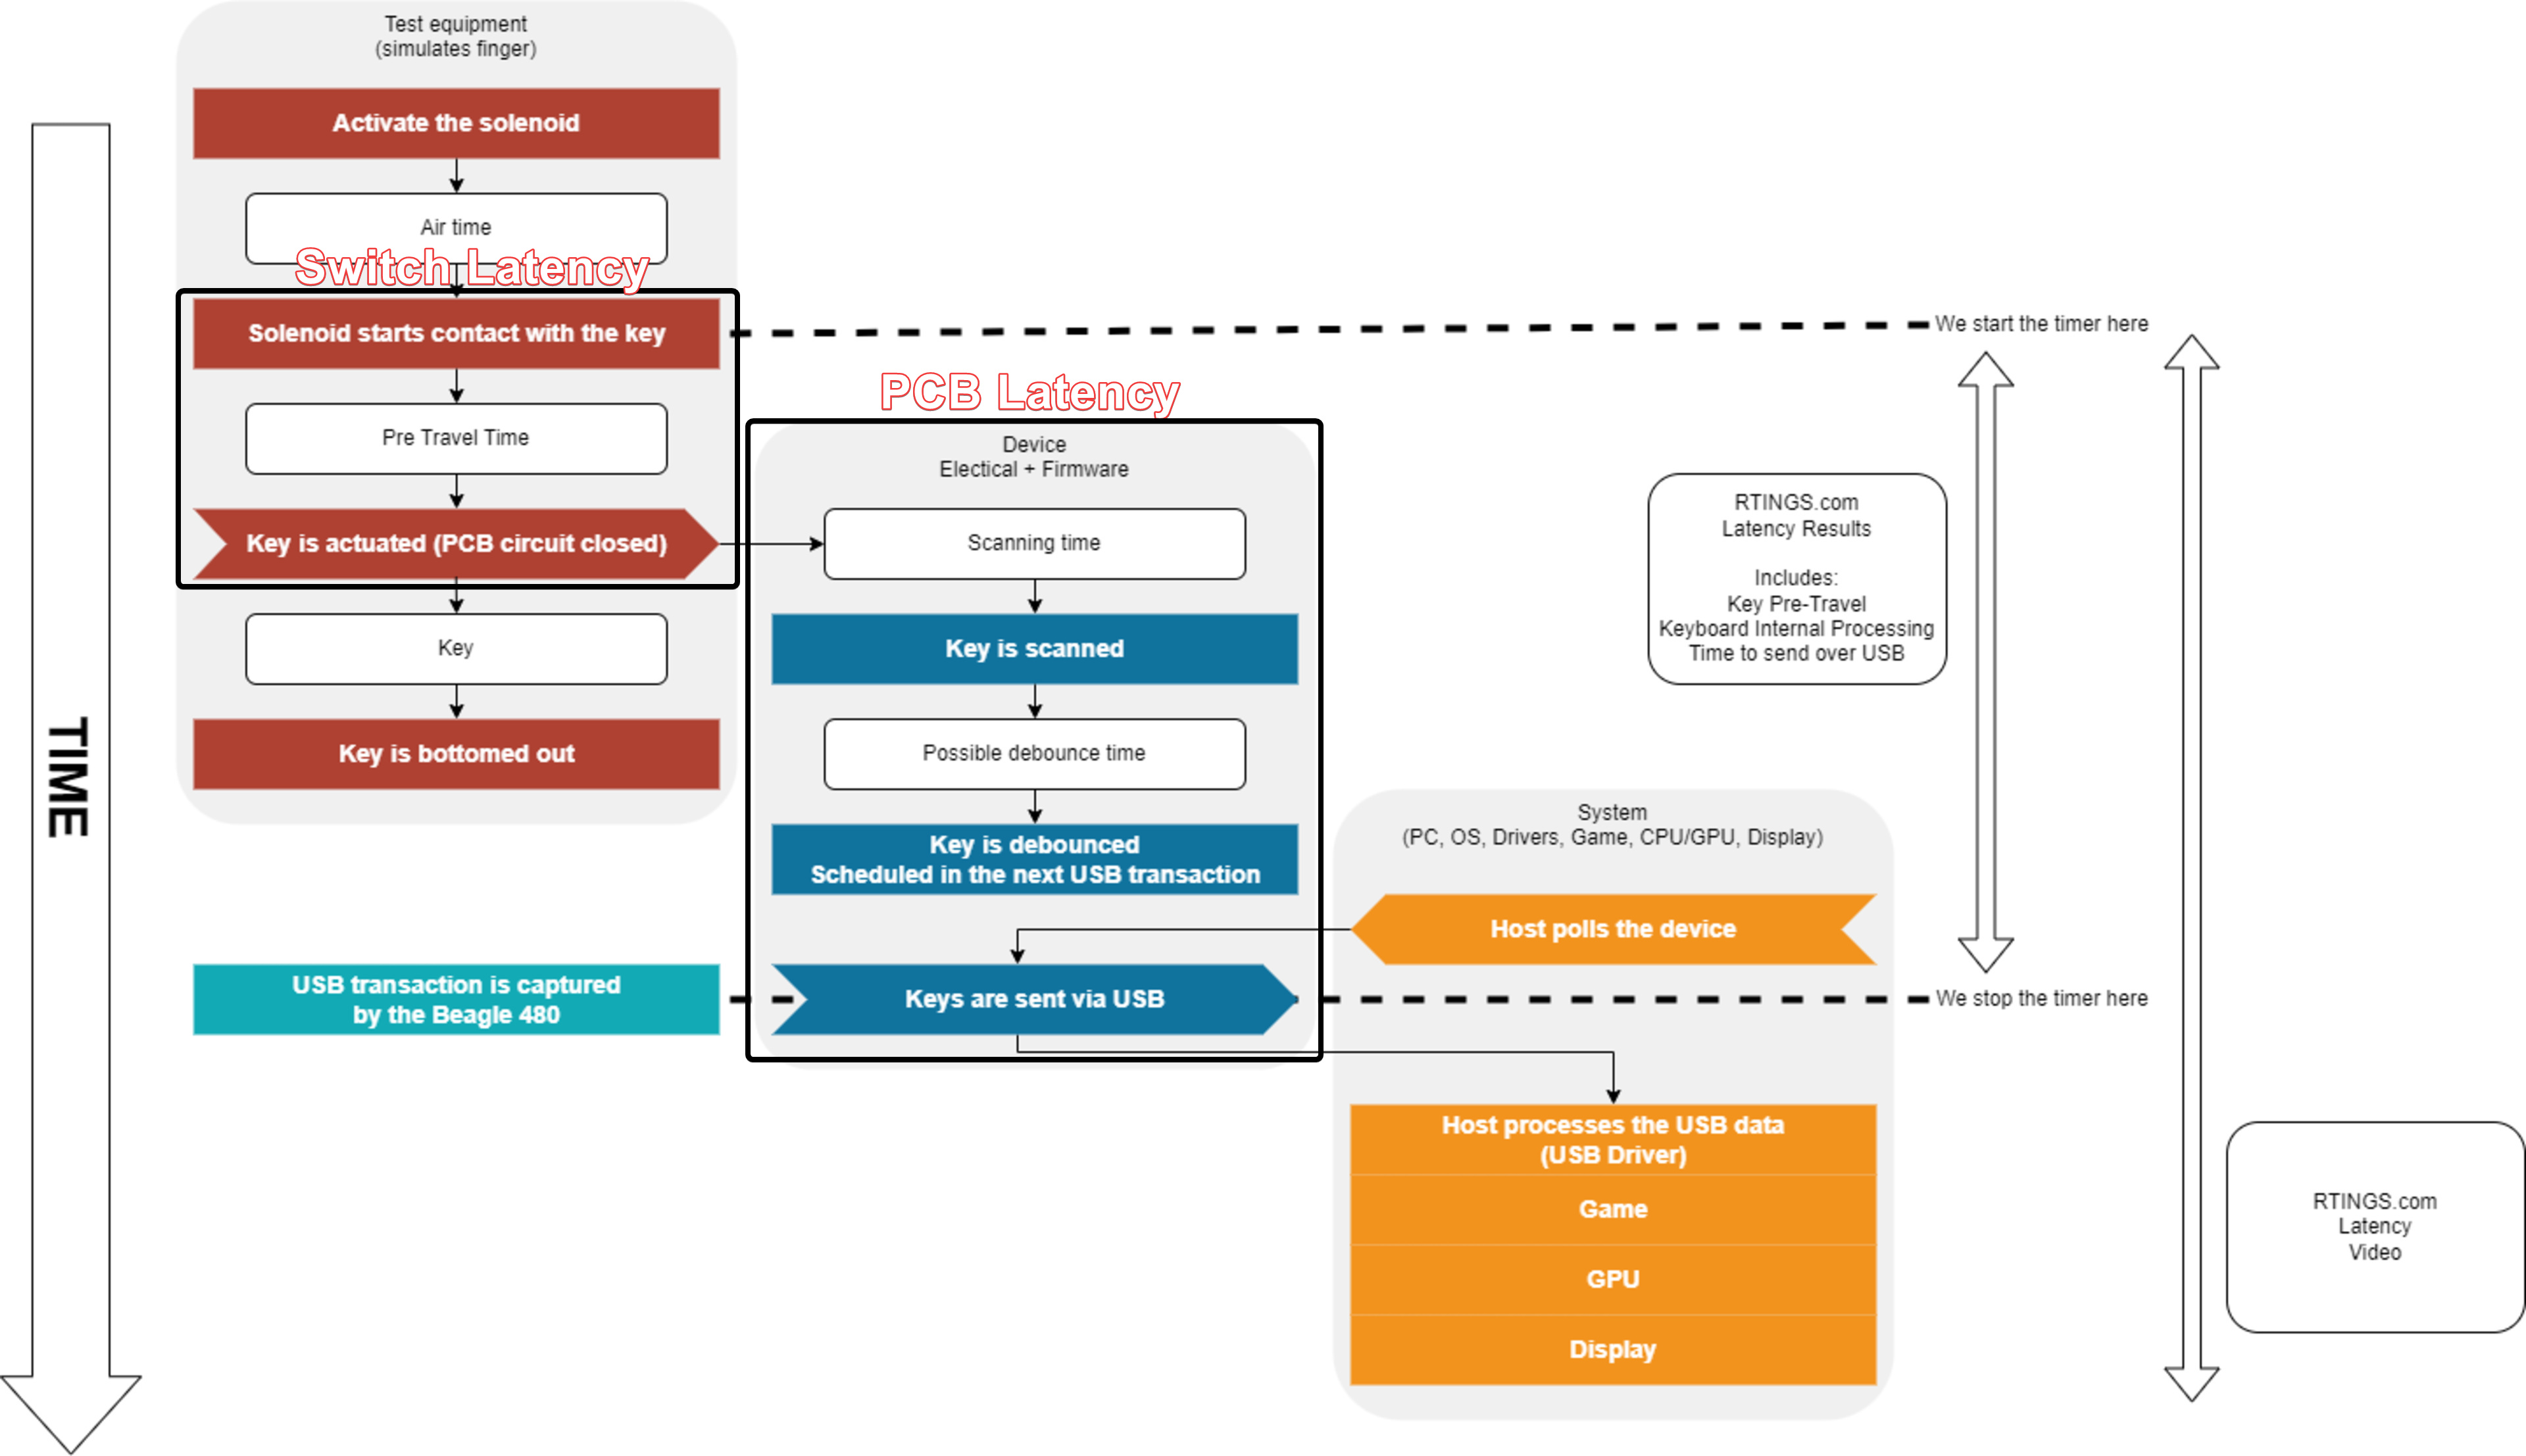
Block diagram of keyboard latency aspects.
As part of our recent keyboard 1.3 test bench update, we found that PCB latency accounted for about 20% of total keyboard latency. The remaining 80% is switch pre-travel and depends on how fast you can press the key, which may explain the difference between our latency results and those advertised by keyboard manufacturers.
We accept this solution because our solenoid is about 20% faster than a human finger, so it doesn't produce worse results than you'd obtain during normal use. The benefit is that our results are relatable to how long it takes to push a keyboard switch for gamers.
 Latency from the Corsair K65 RGB Mini keyboard review.
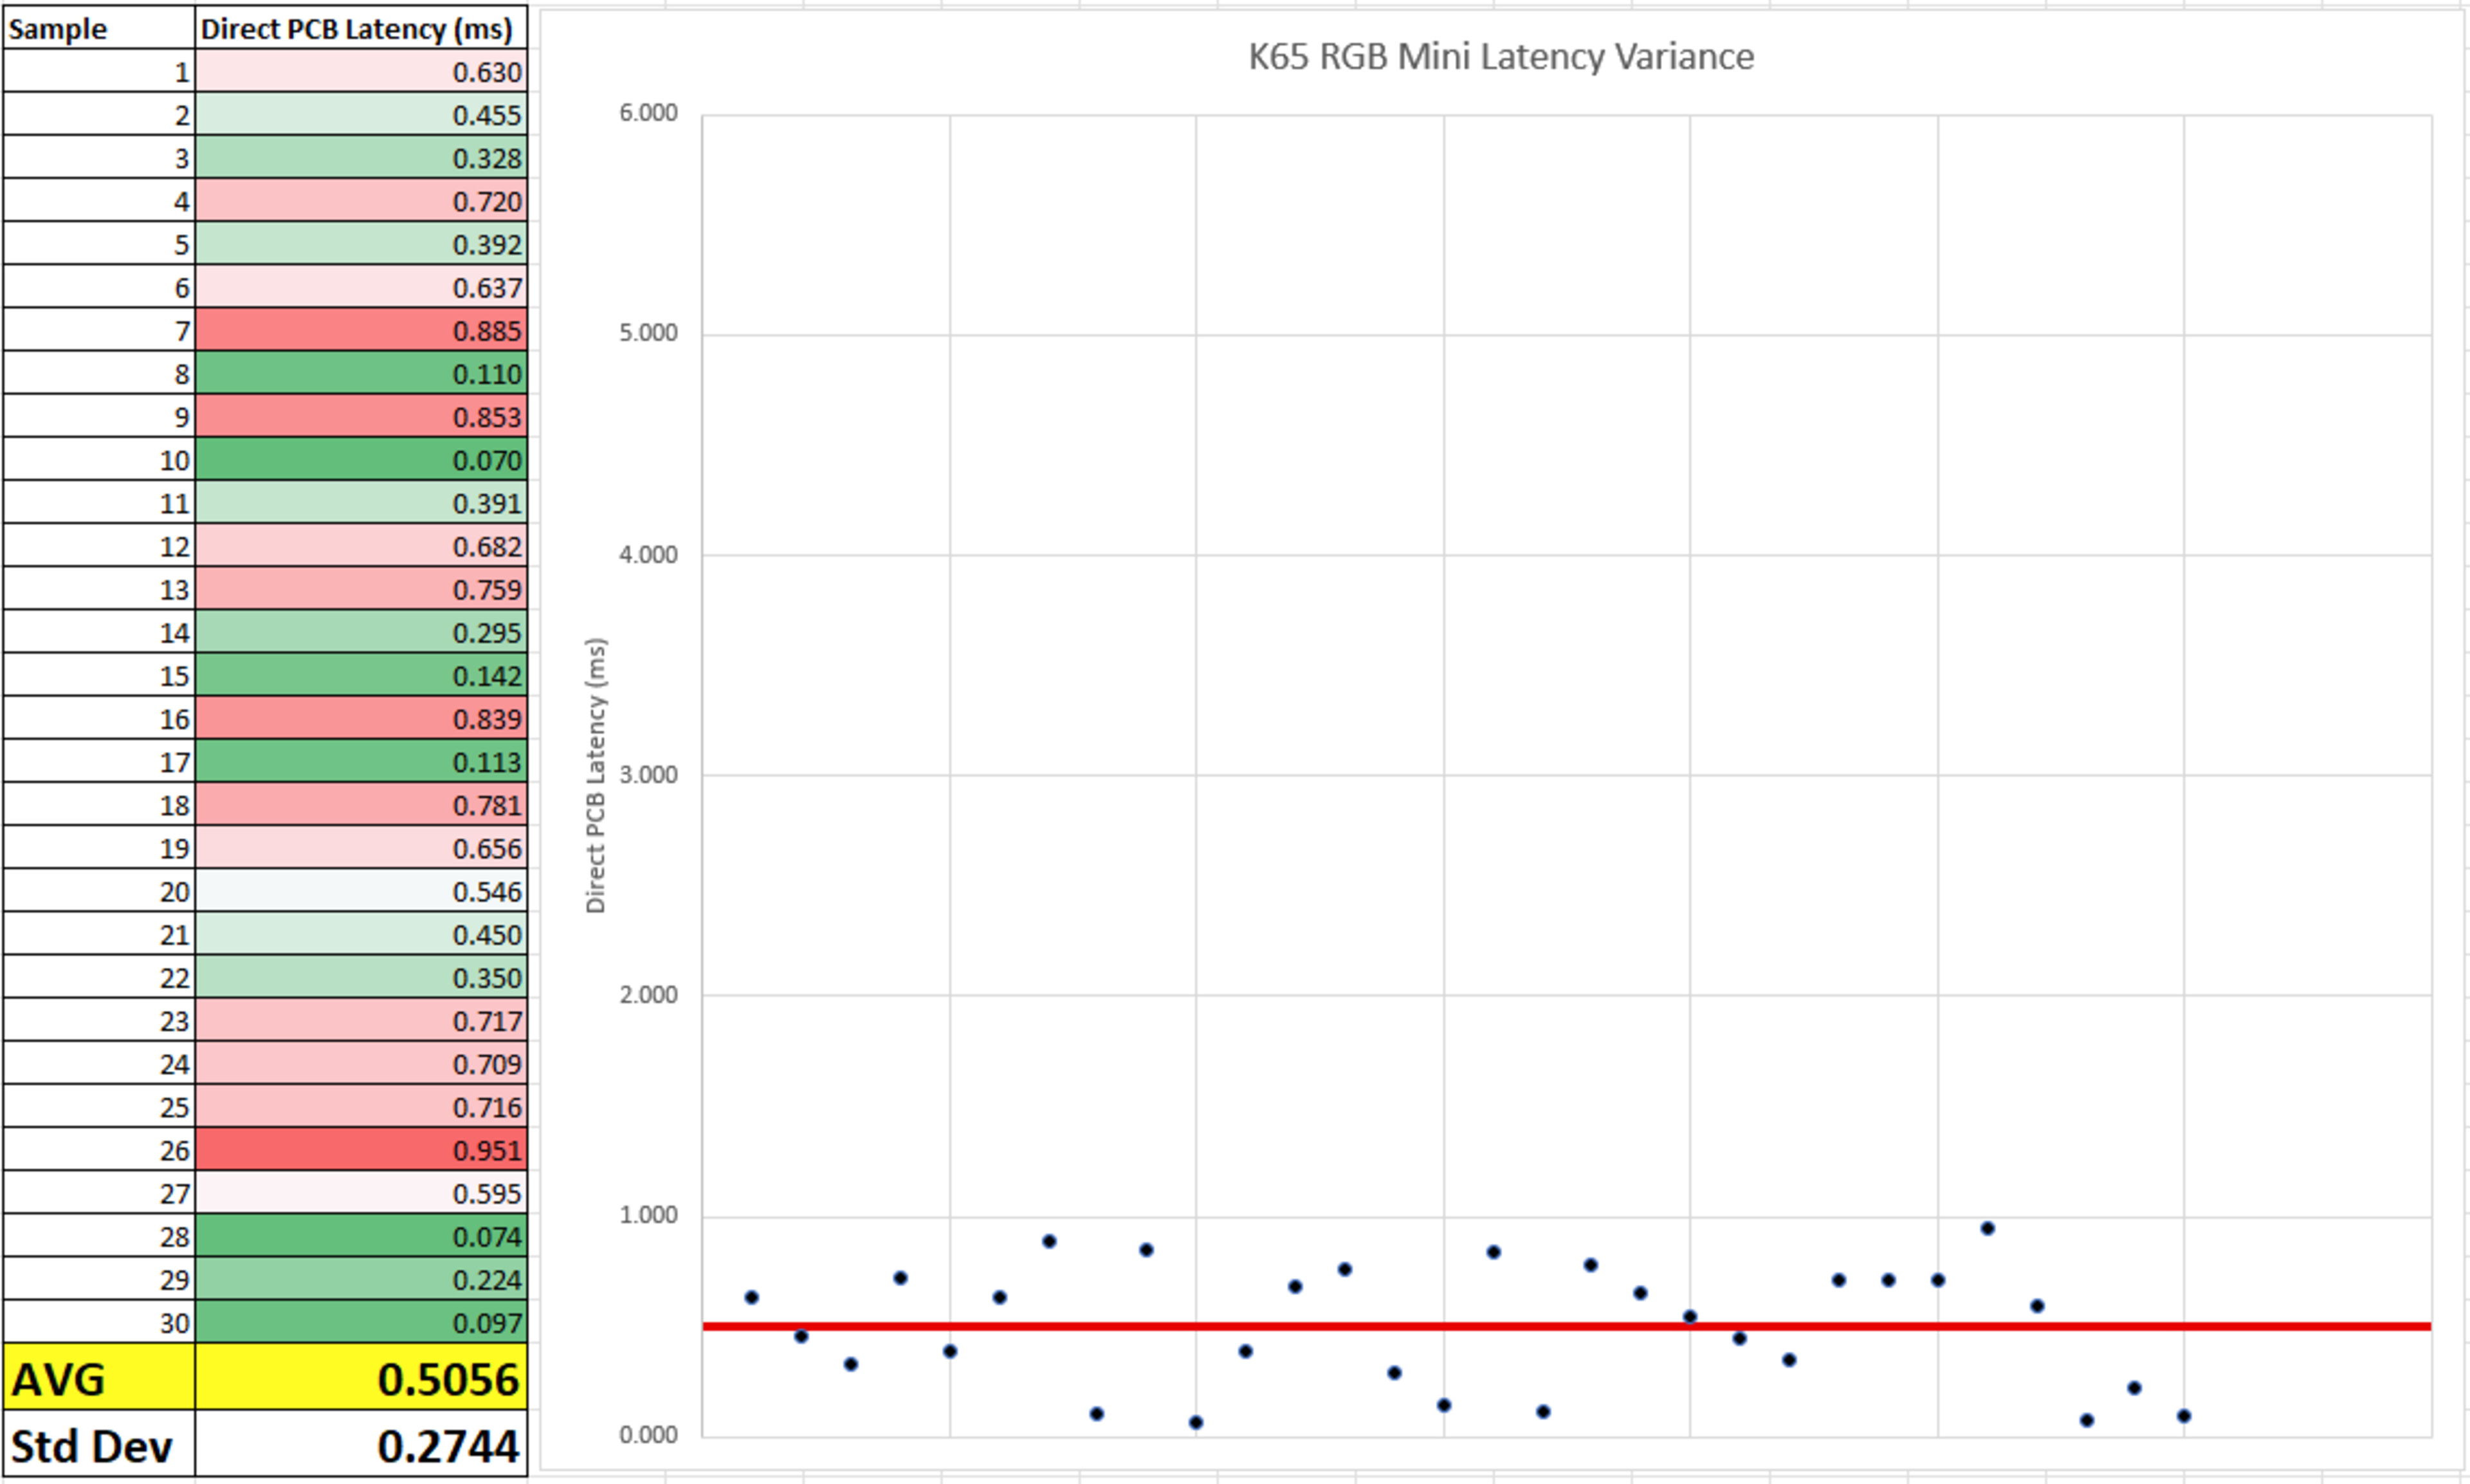 PCB latency of the Corsair K65 RGB Mini keyboard.
What don't we know at the moment?
- We can approximate PCB latency, which lets us roughly calculate switch latency (keyboard latency - PCB latency = switch latency). However, this only gives us the answer for a single keyboard and may not be equivalent for all switch models for that given keyboard.
Evidence
- Requests for other switches in our keyboard reviews
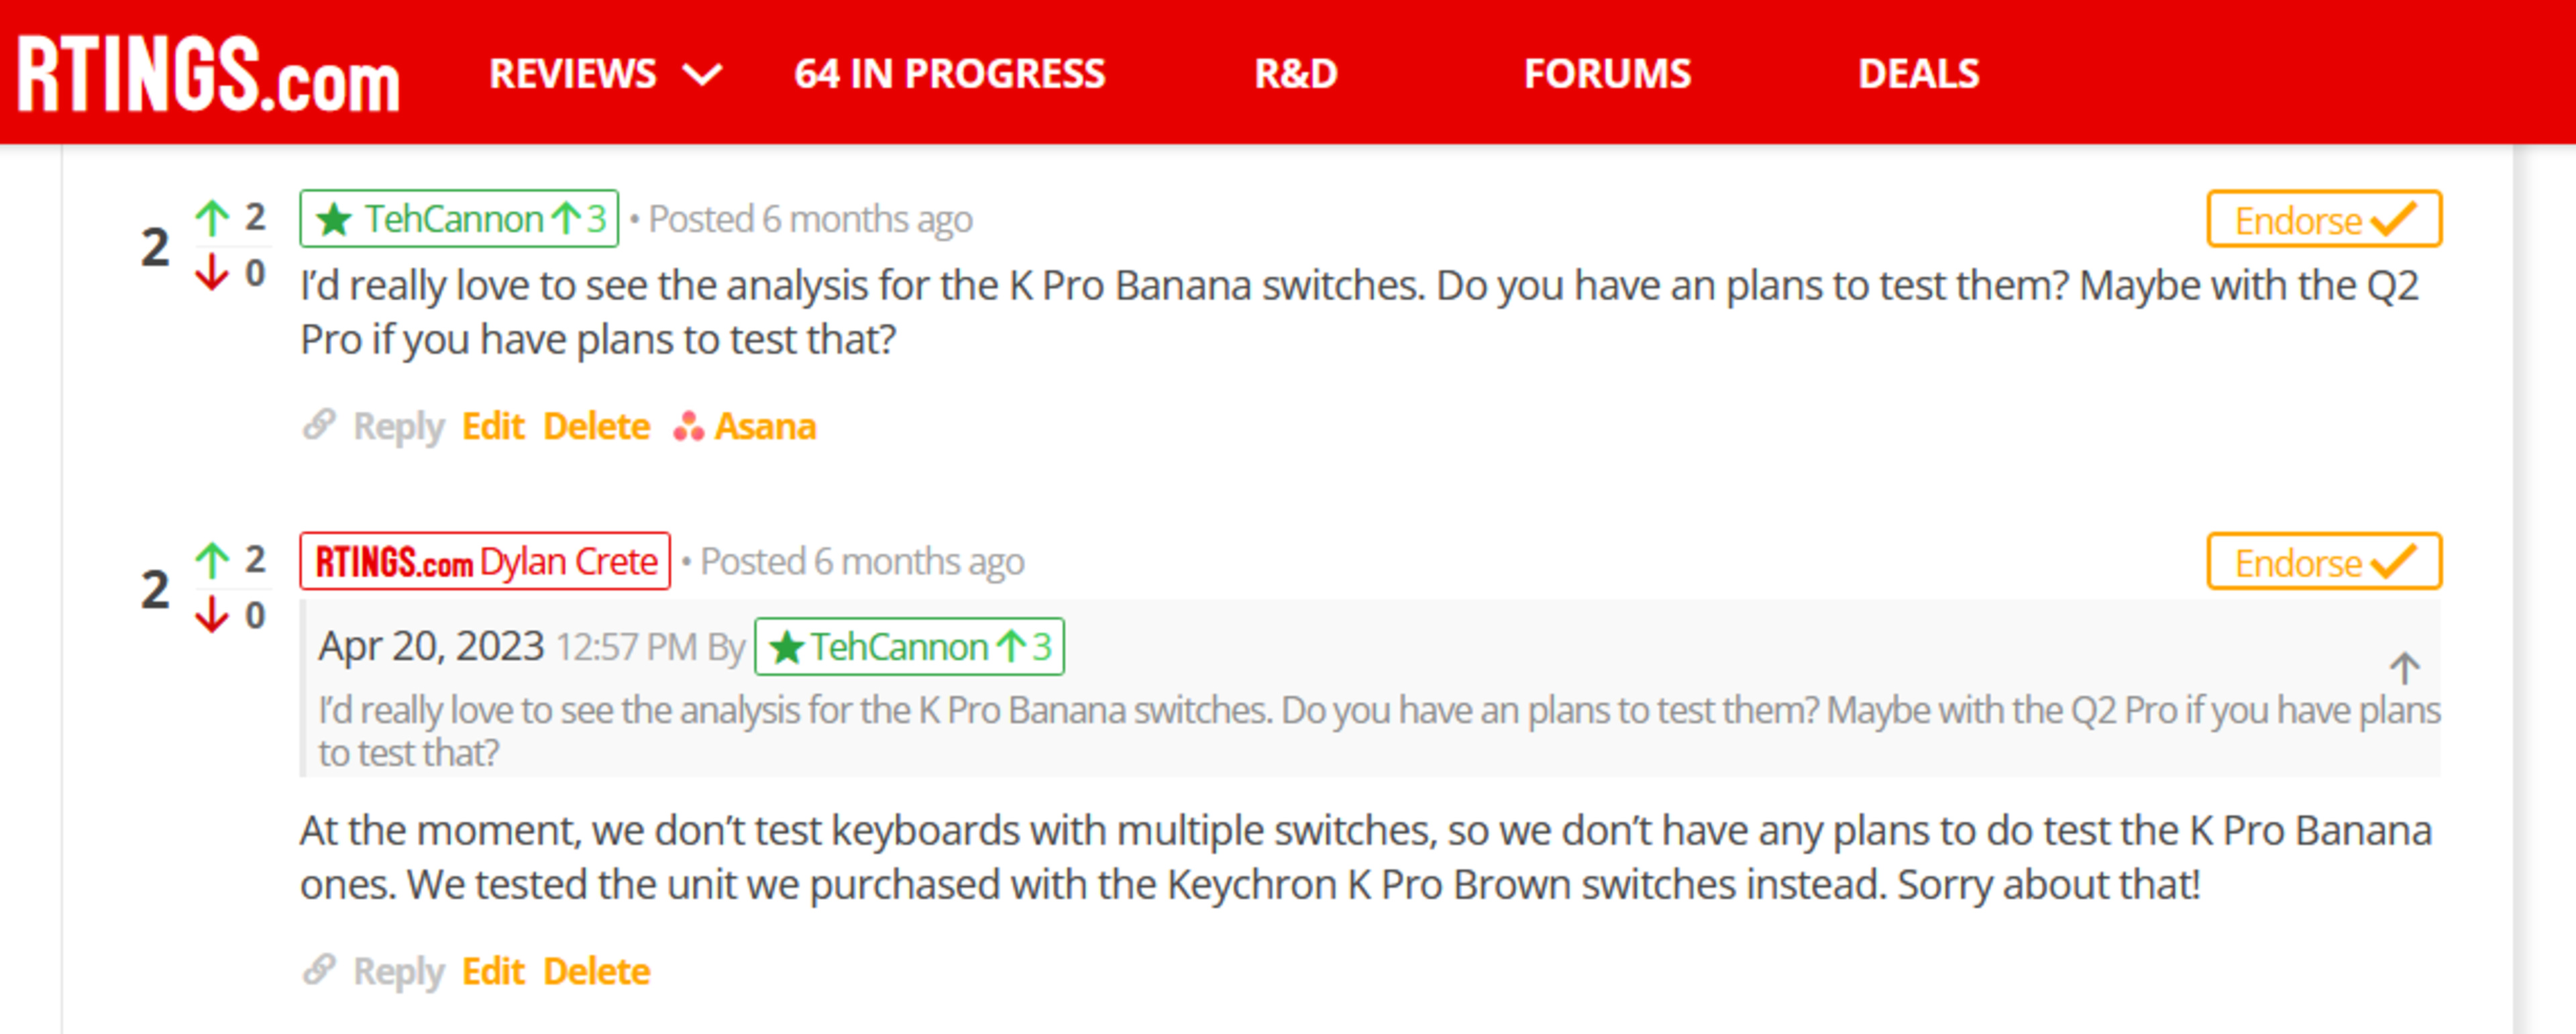
A user, TehCannon, showing interest in a different switch from the one we purchased
- A Razer employee criticized our latency testing approach
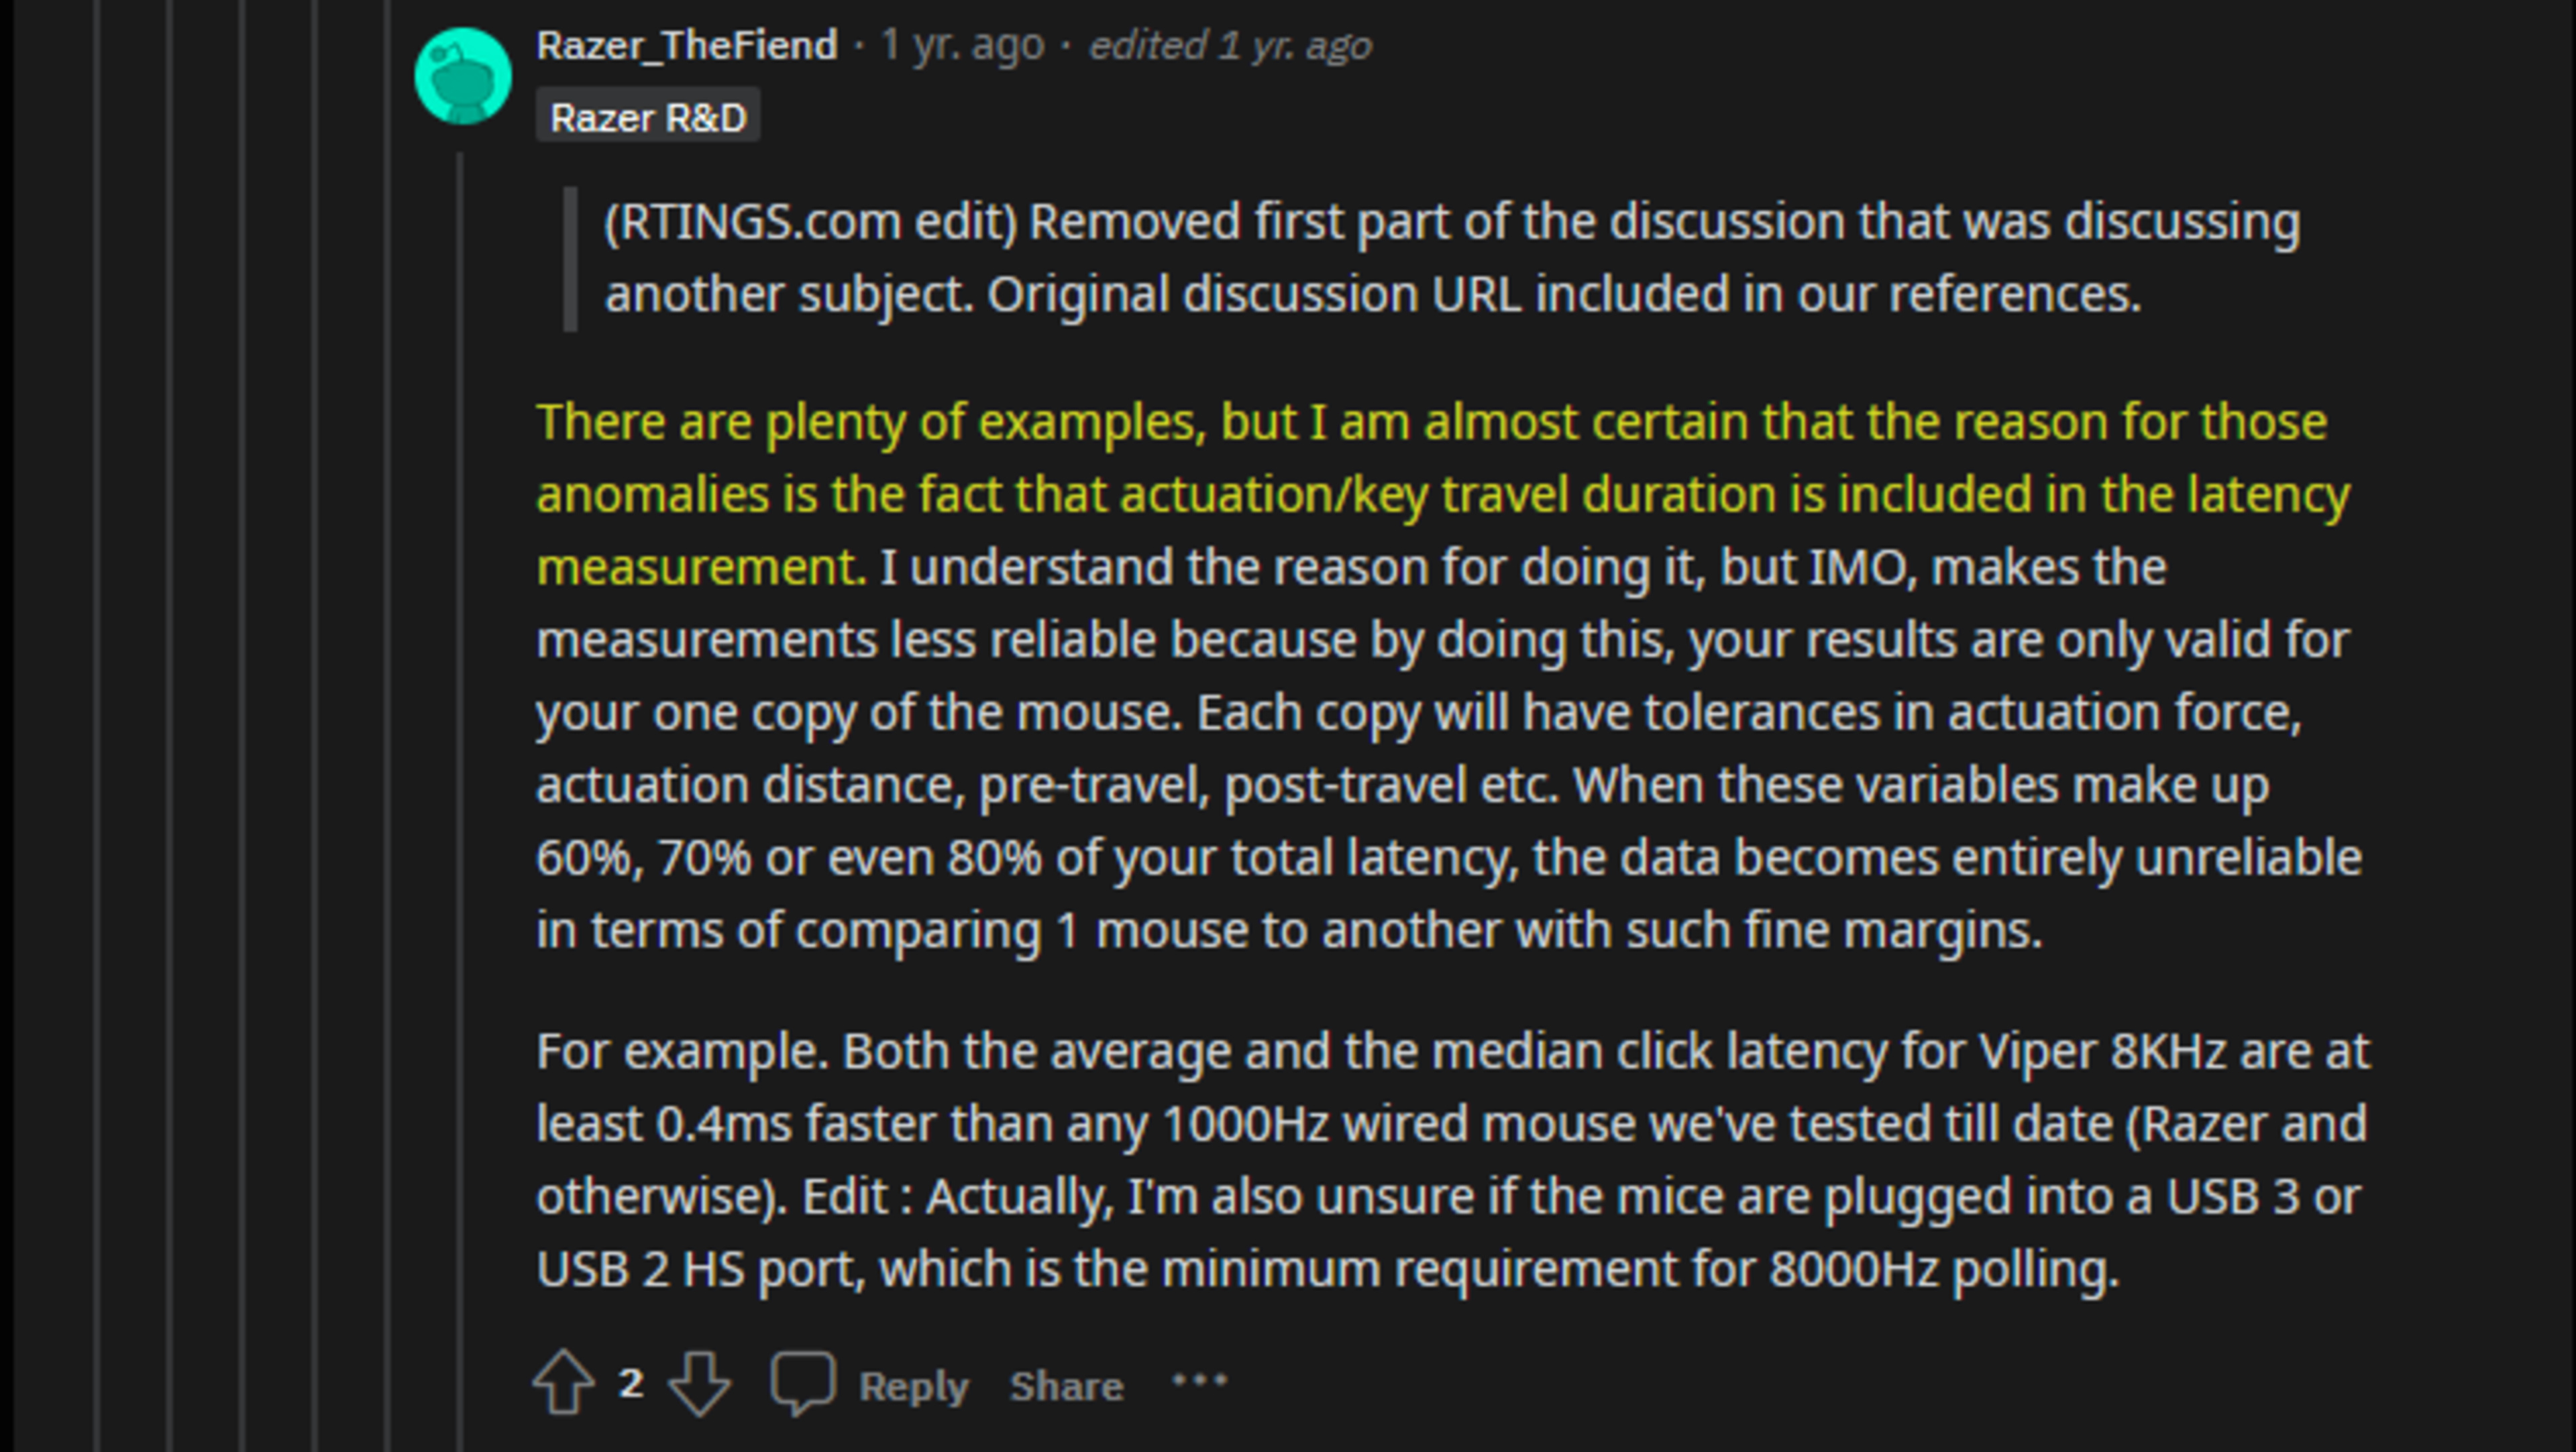
Razer challenging our mice latency approach, which was reused on keyboard 1.3
Proof of Success
- Speed switches are designed for gaming and often have short pre-travel, allowing them to actuate faster. These switches should be the fastest.
- Switches with "Speed" in their name should be some of the best switches for low latency. This is because those switches, designed for gaming, often have a low pre-travel, which allows them to actuate faster.
- No switch latency result should be greater than the total latency measured on a keyboard with the same switch. This would suggest negative PCB latency, which is impossible.
Investigation: Reuse the Keyboard Latency Setup and Isolate the PCB Latency
This is the ideal starting point for keyboard switches since the setup is proven to work for our needs. The goal of this investigation is to extend the current keyboard latency setup and add an additional trigger for the PCB contact.
Block diagram of keyboard latency aspects.
Used Terminology:
- Switch Latency: The time it takes from the switch starting to move to an electrical signal going through the switch contacts.
- Pre-Travel Latency: Same as above.
- PCB Latency: The time it takes from the moment the switch is pressed (circuit closed) until the key is reported over USB to the host.
- Keyboard Latency: The latency as currently presented in our keyboard reviews. This result is measured as a single value but is a combined result of Switch Latency + PCB Latency.
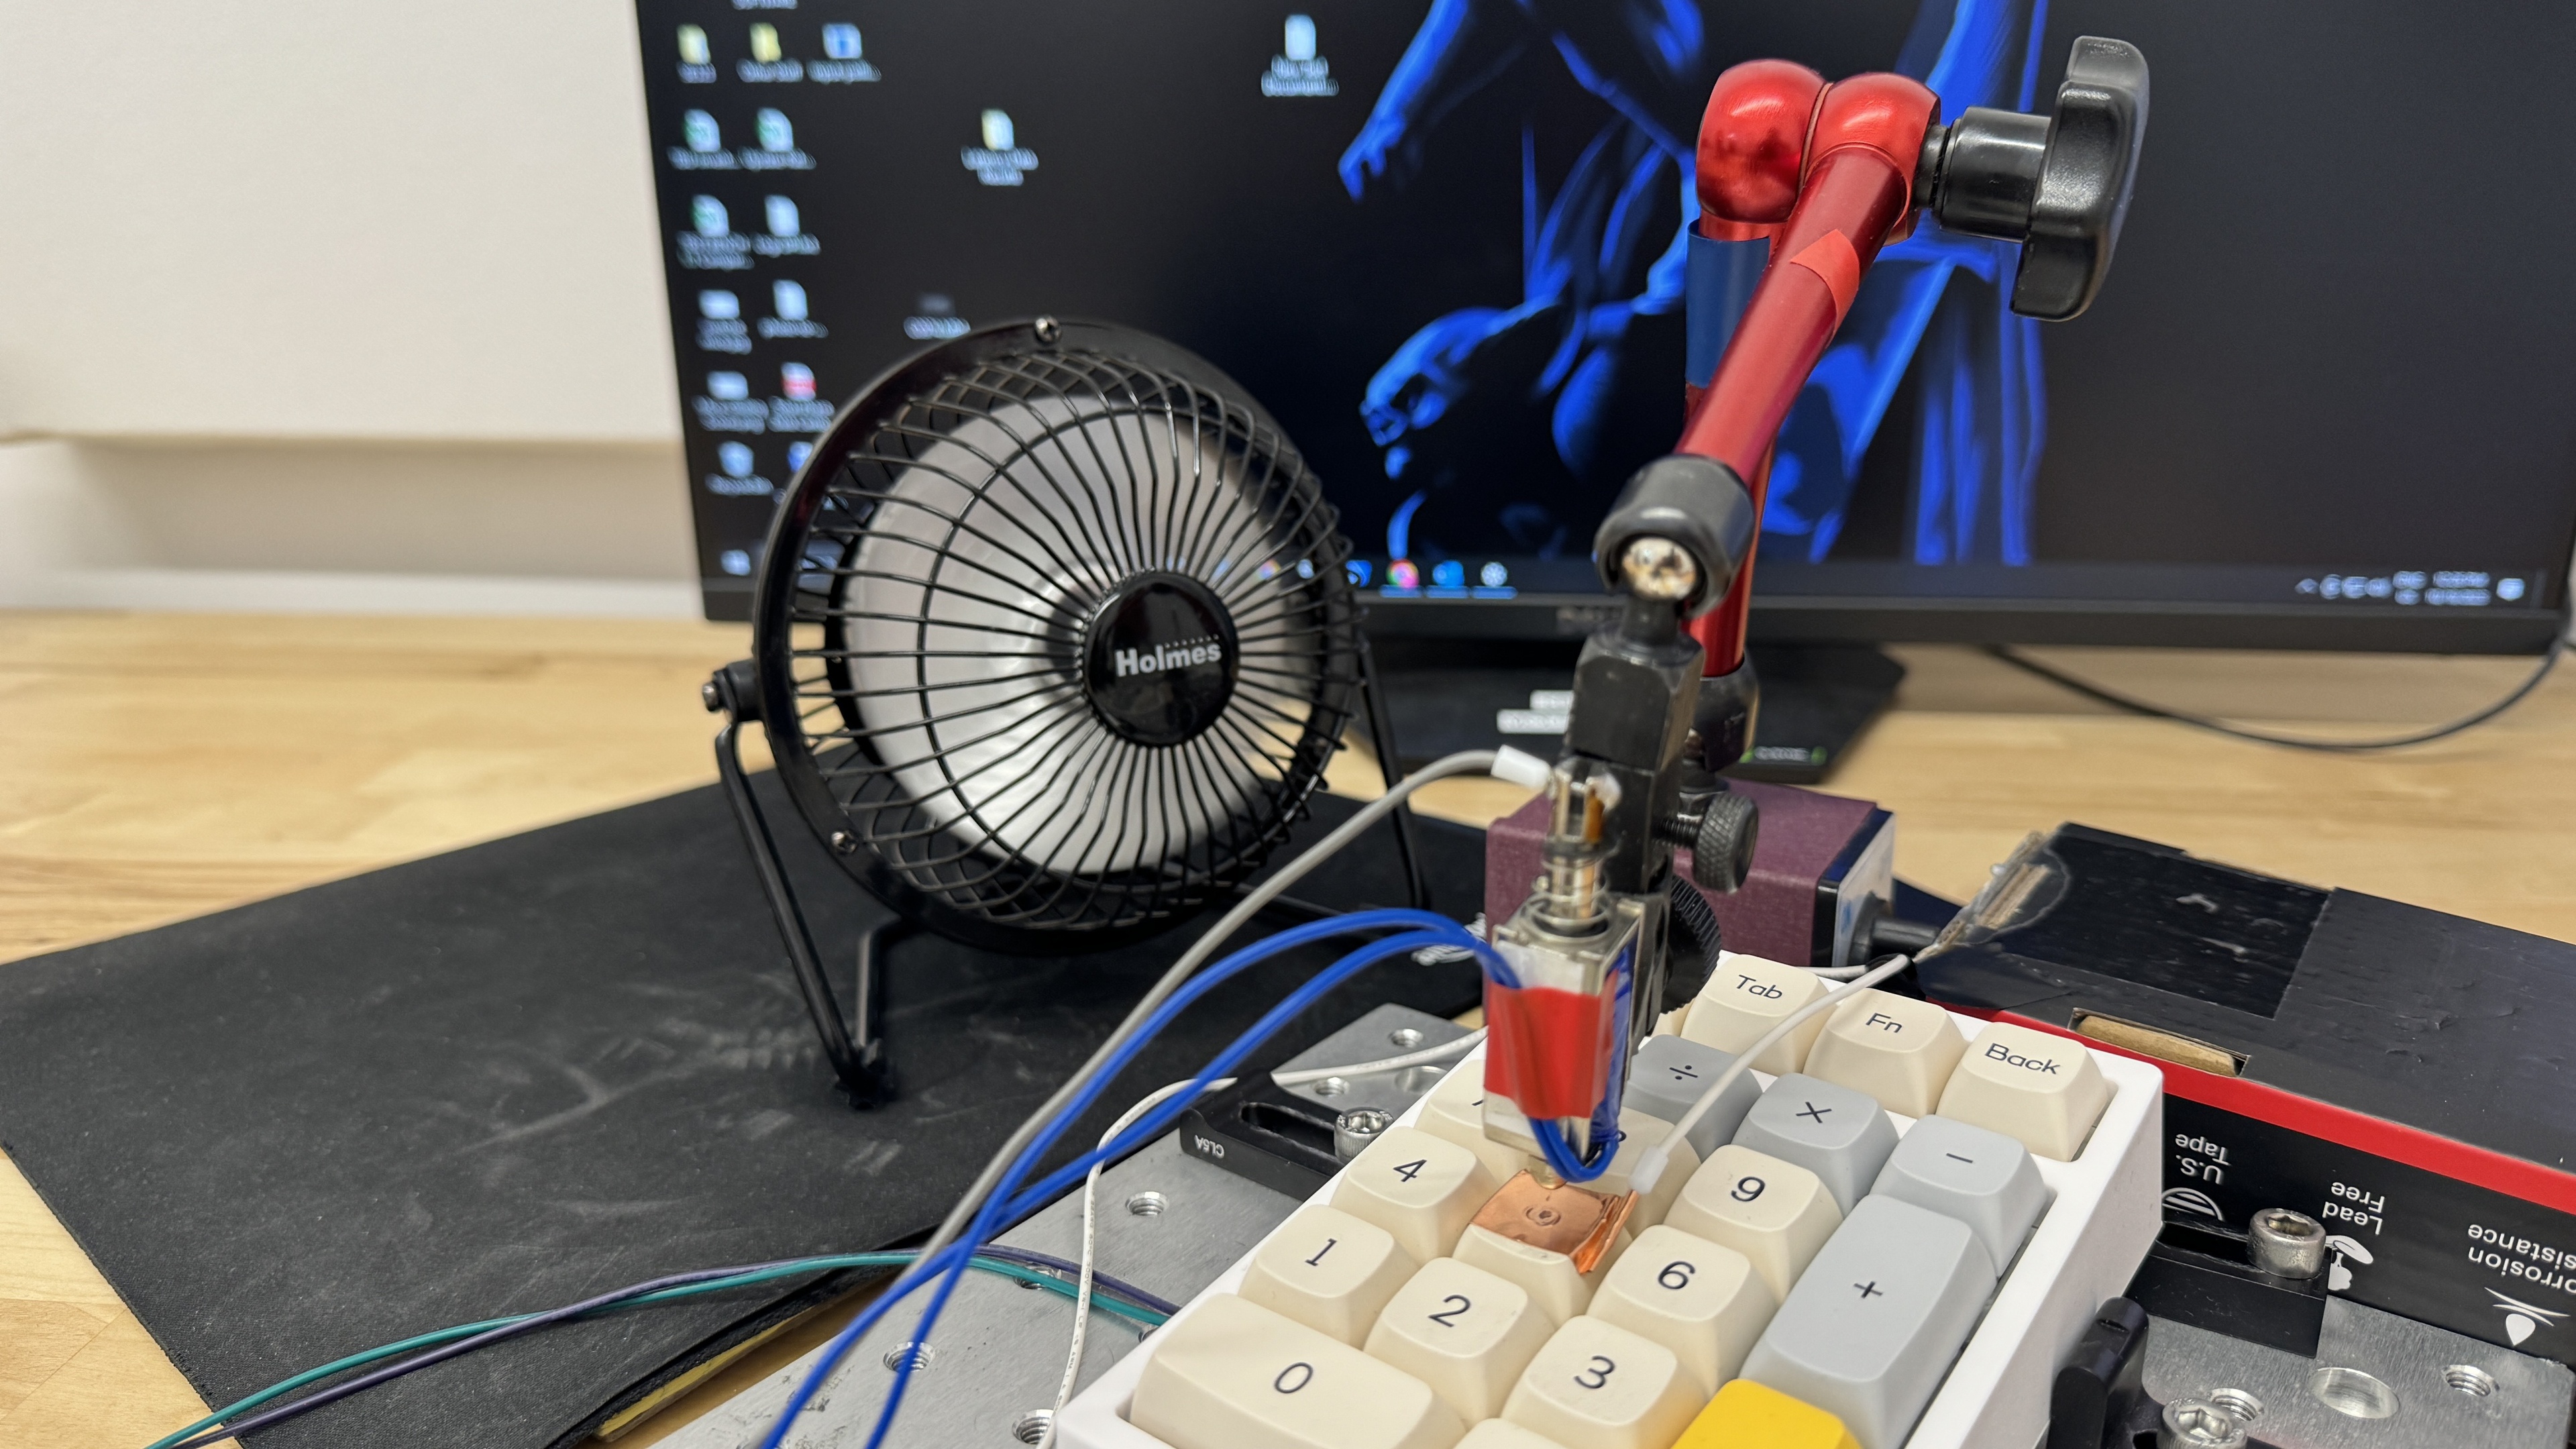
Latency Testing Setup using a modified Epomaker TH-21 Keypad.
Investigation: Prototyping the Latency Testing Setup
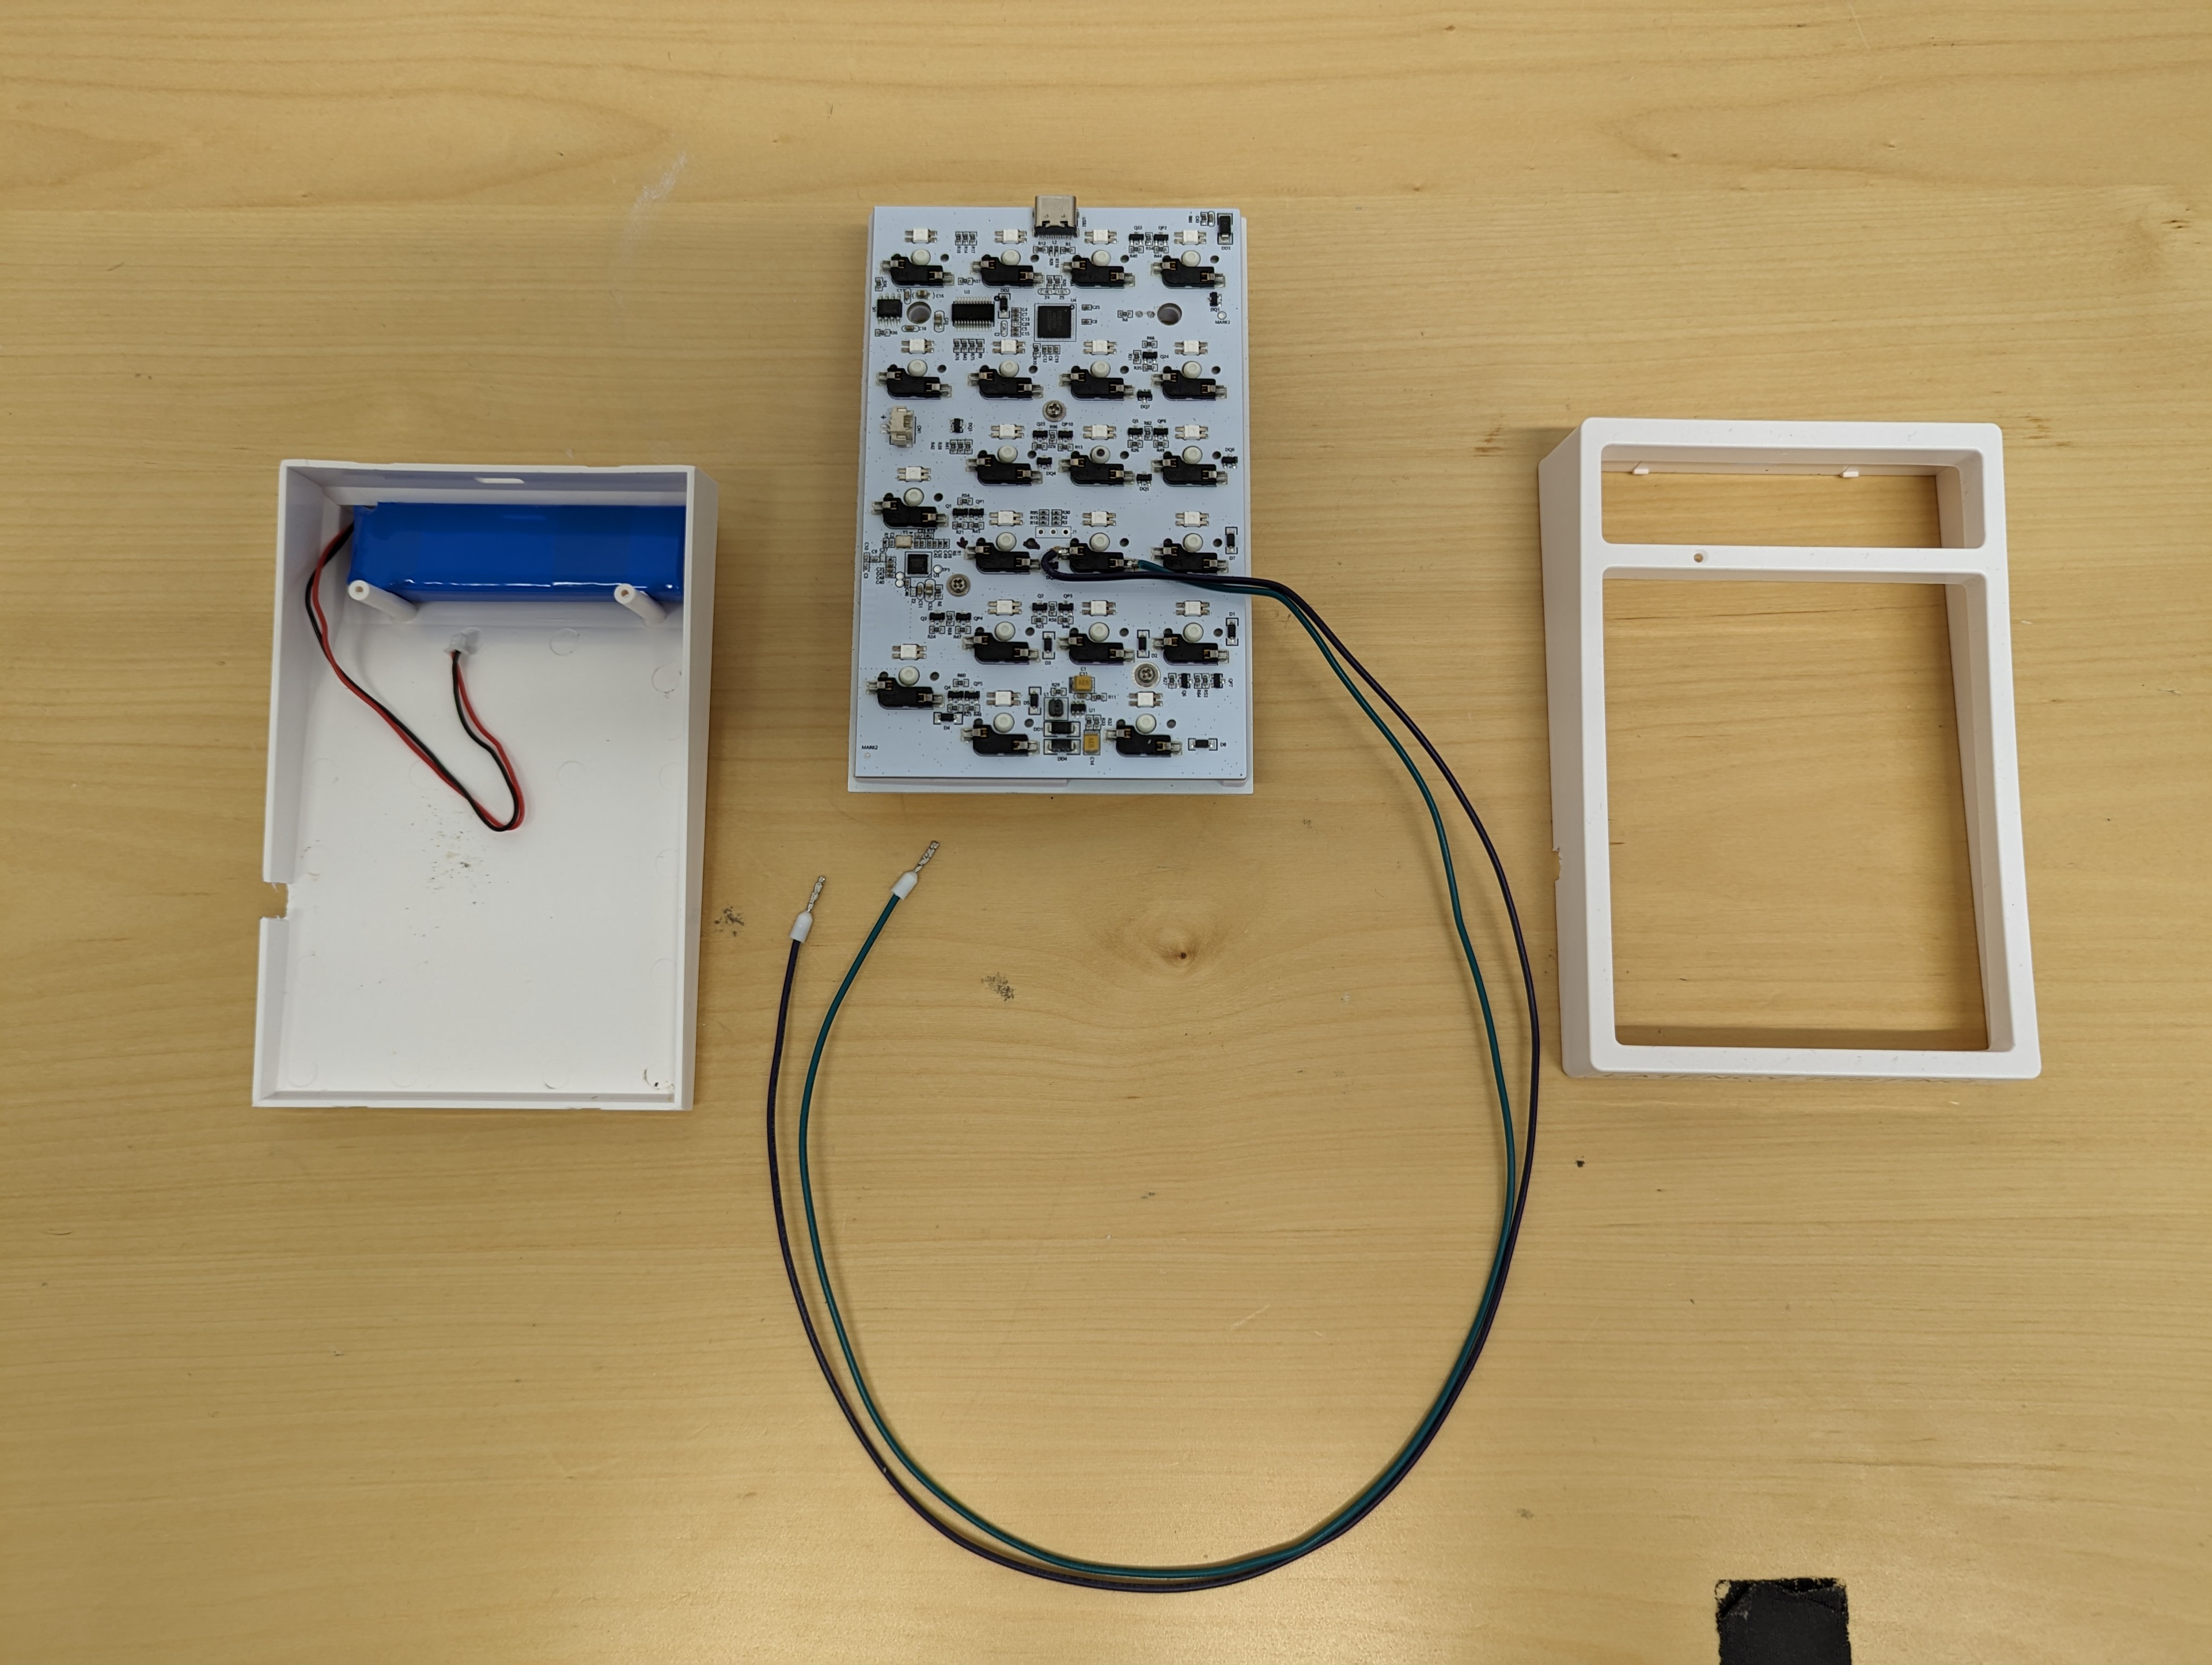
We disassembled an Epomaker TH-21 keypad and soldered wires onto the keypad's hot-swappable PCB socket. This allows us to monitor the state of the switch at the electrical level. We expected this to produce continuity when a switch was pressed. Our testing equipment monitors voltage and not purely continuity like a keyboard microcontroller.
However, in designing this method, we didn't initially account for the electrical differences inherent from a keyboard matrix. The matrix design means the switch pins are only connected when the key is actively scanned. The signal, if monitored by an external instrument, has a high likelihood of floating since, most of the time, the rows/columns in the matrix aren't connected or are set to scan another switch. The switch socket pins/pads are not in a deterministic state, leading to unpredictable readings.
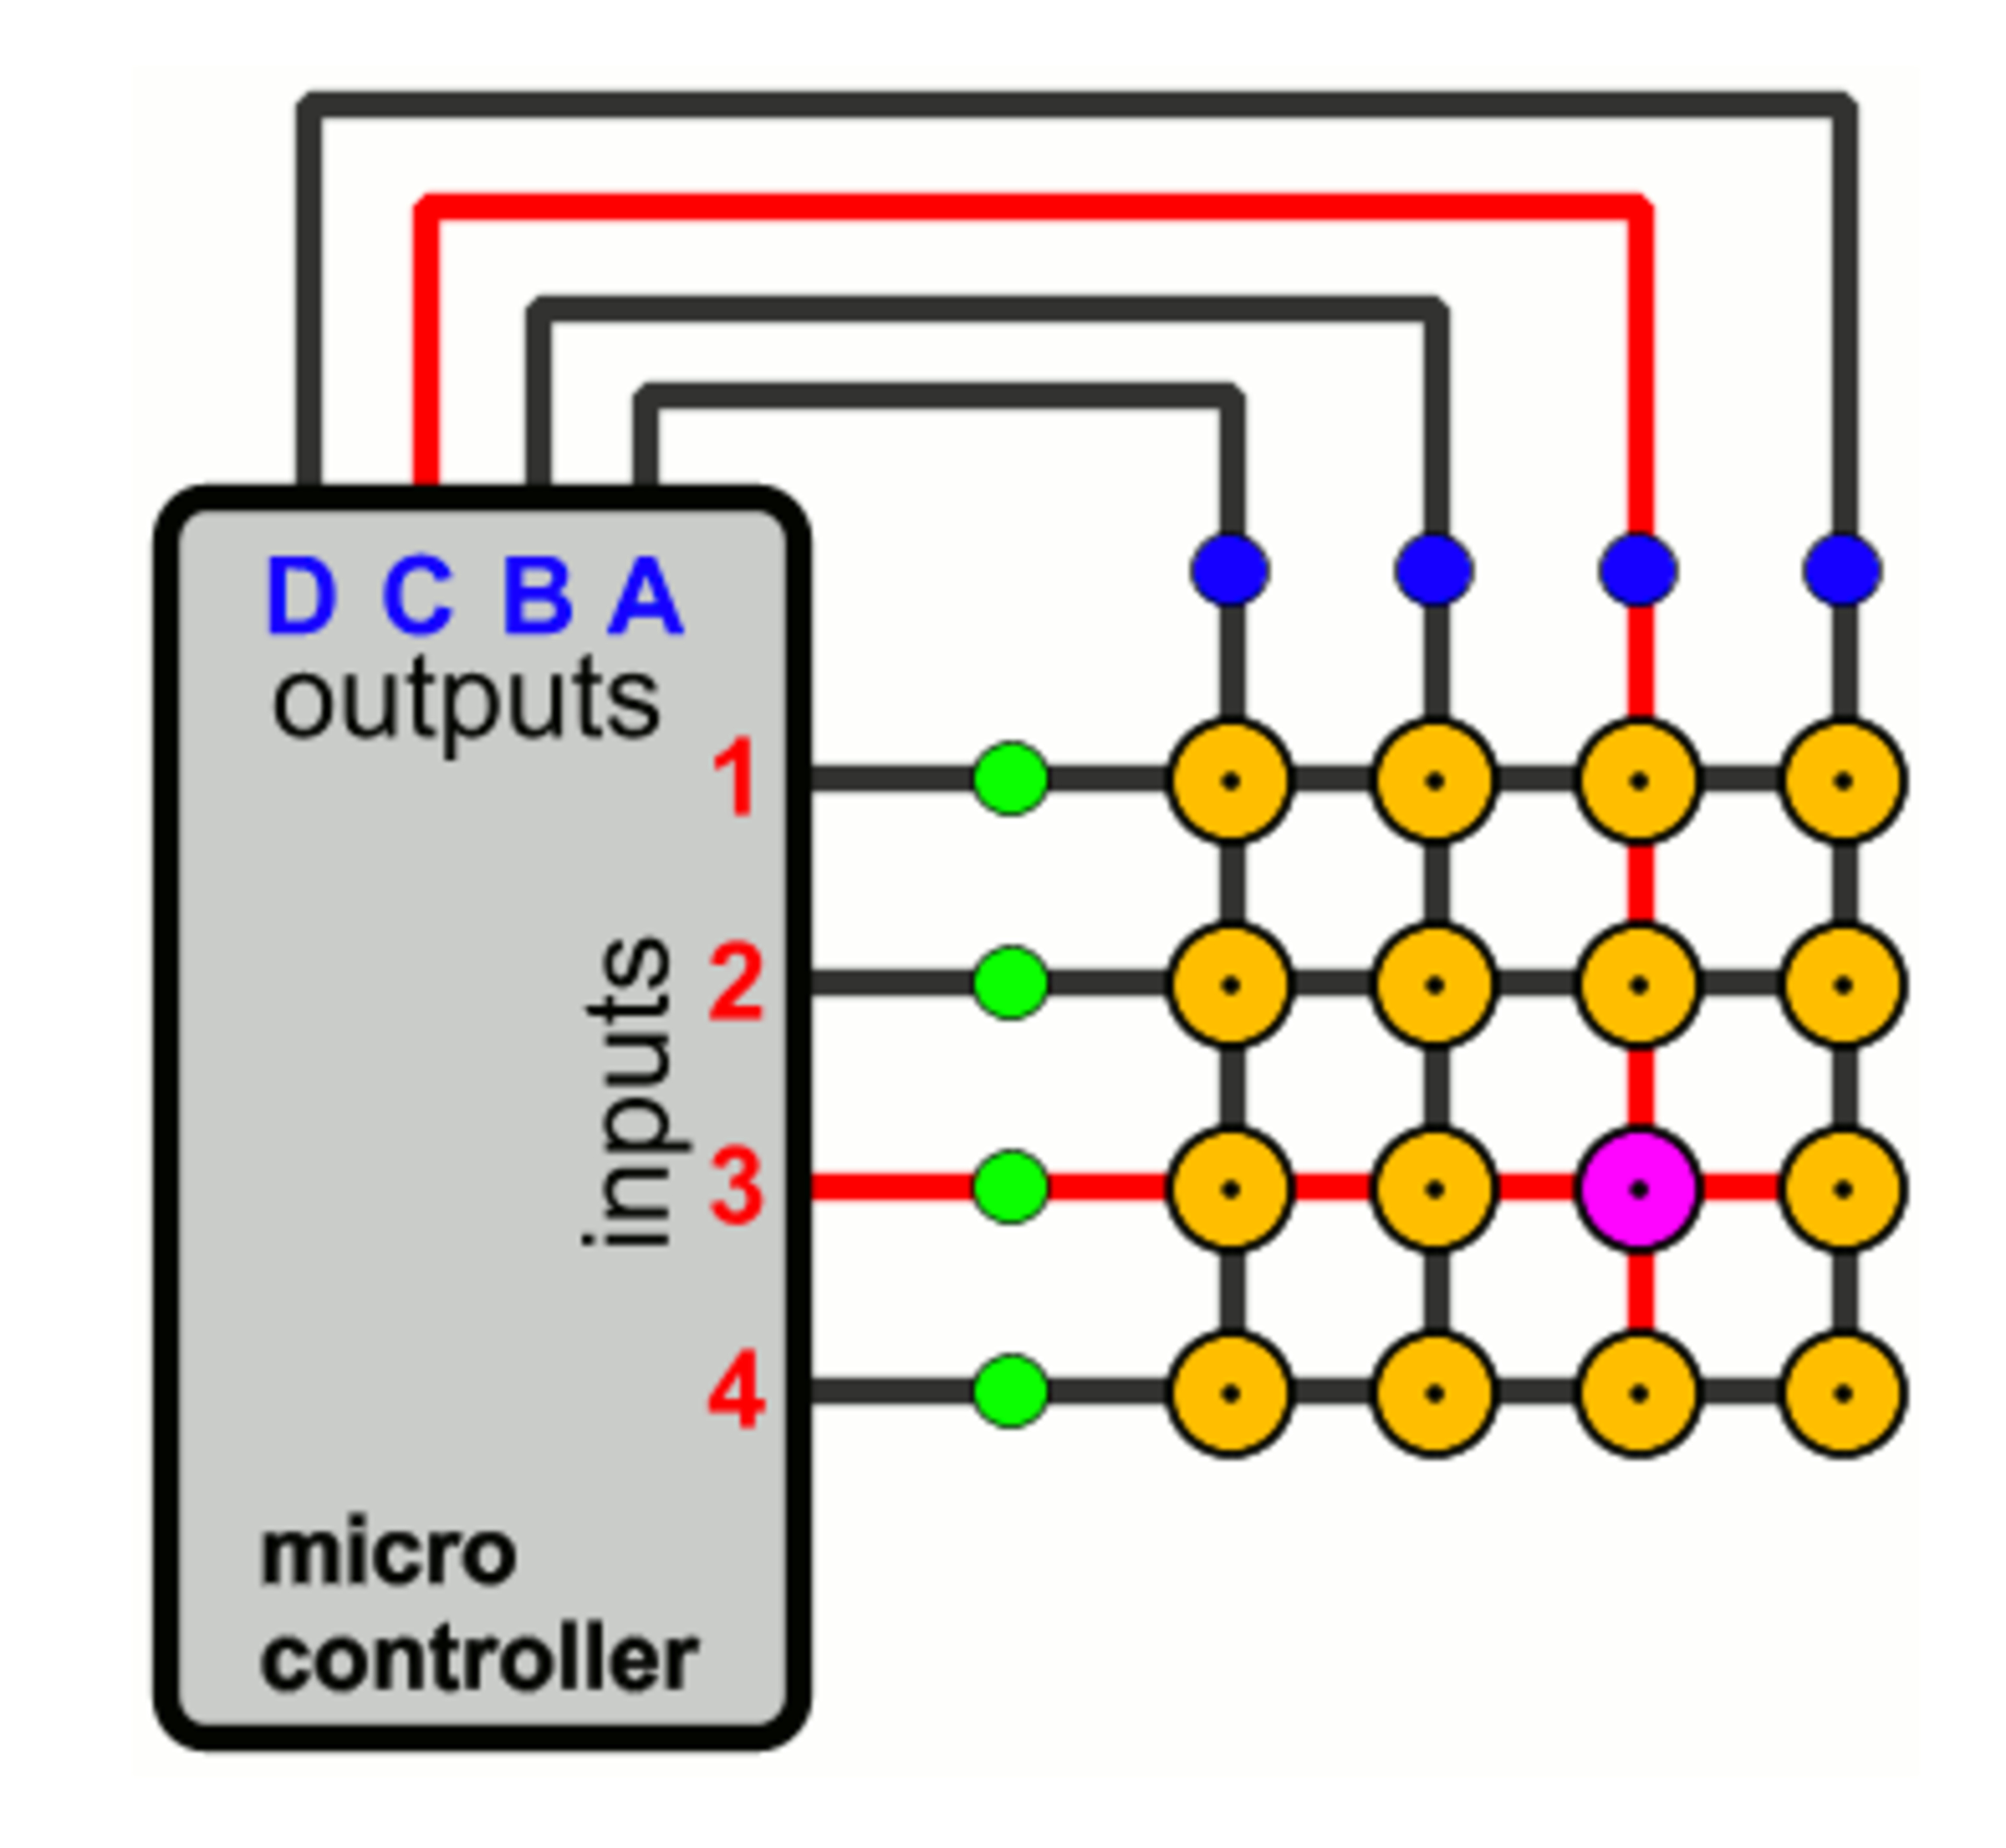
Keypad matrix connected to MCU pins rather than a power rail. (Source: PCB Heaven)
Connecting an oscilloscope showed "spikes" and, while unpredictable (we don't know exactly how the Epomaker TH-21 we are using as part of our setup scans its matrix), the interval of the spikes did suggest it's related to the key matrix scan frequency.
Probing the switch pin. The difference between spikes is sometimes 1000Hz, which would match the keyboard's polling rate.
We adapted our strategy by ensuring we turned off/unplugged the keyboard during our test. In doing this, the switch pins can be forced and held at known levels (+3.3v and GND) without the keyboard microcontroller attempting to do the same at the same time. This, in turn, allows us to monitor the keyboard switch as if it were a simple button, as opposed to a switch in a matrix.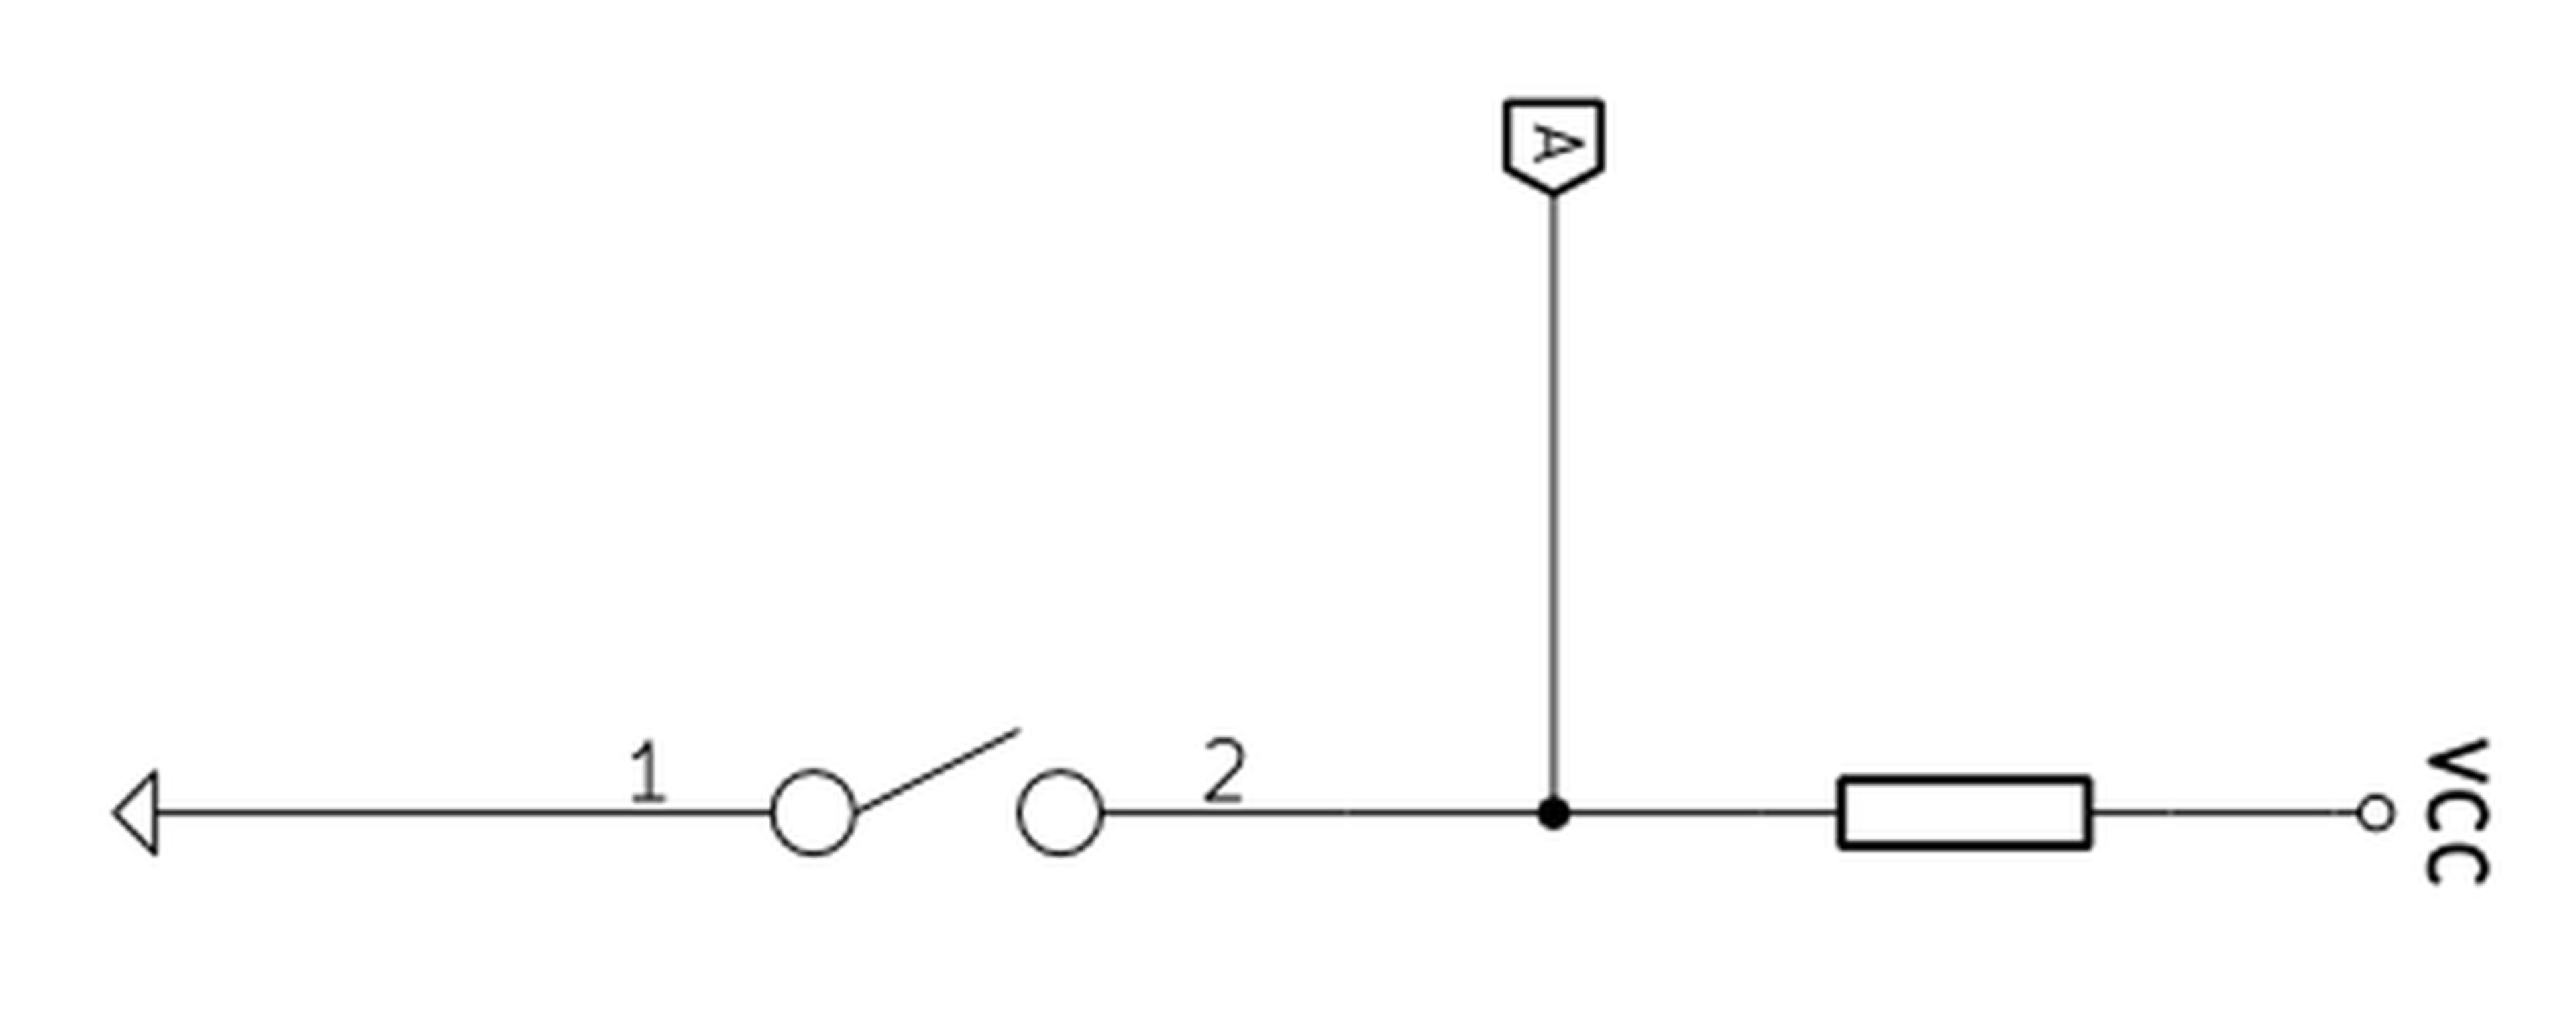
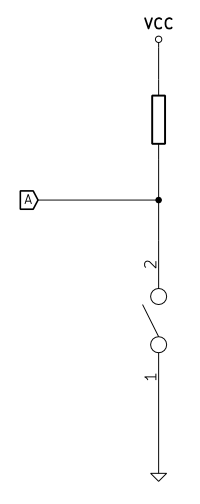
Simple button circuit with pull-up resistor. (Source: Komar's Tech Blog)
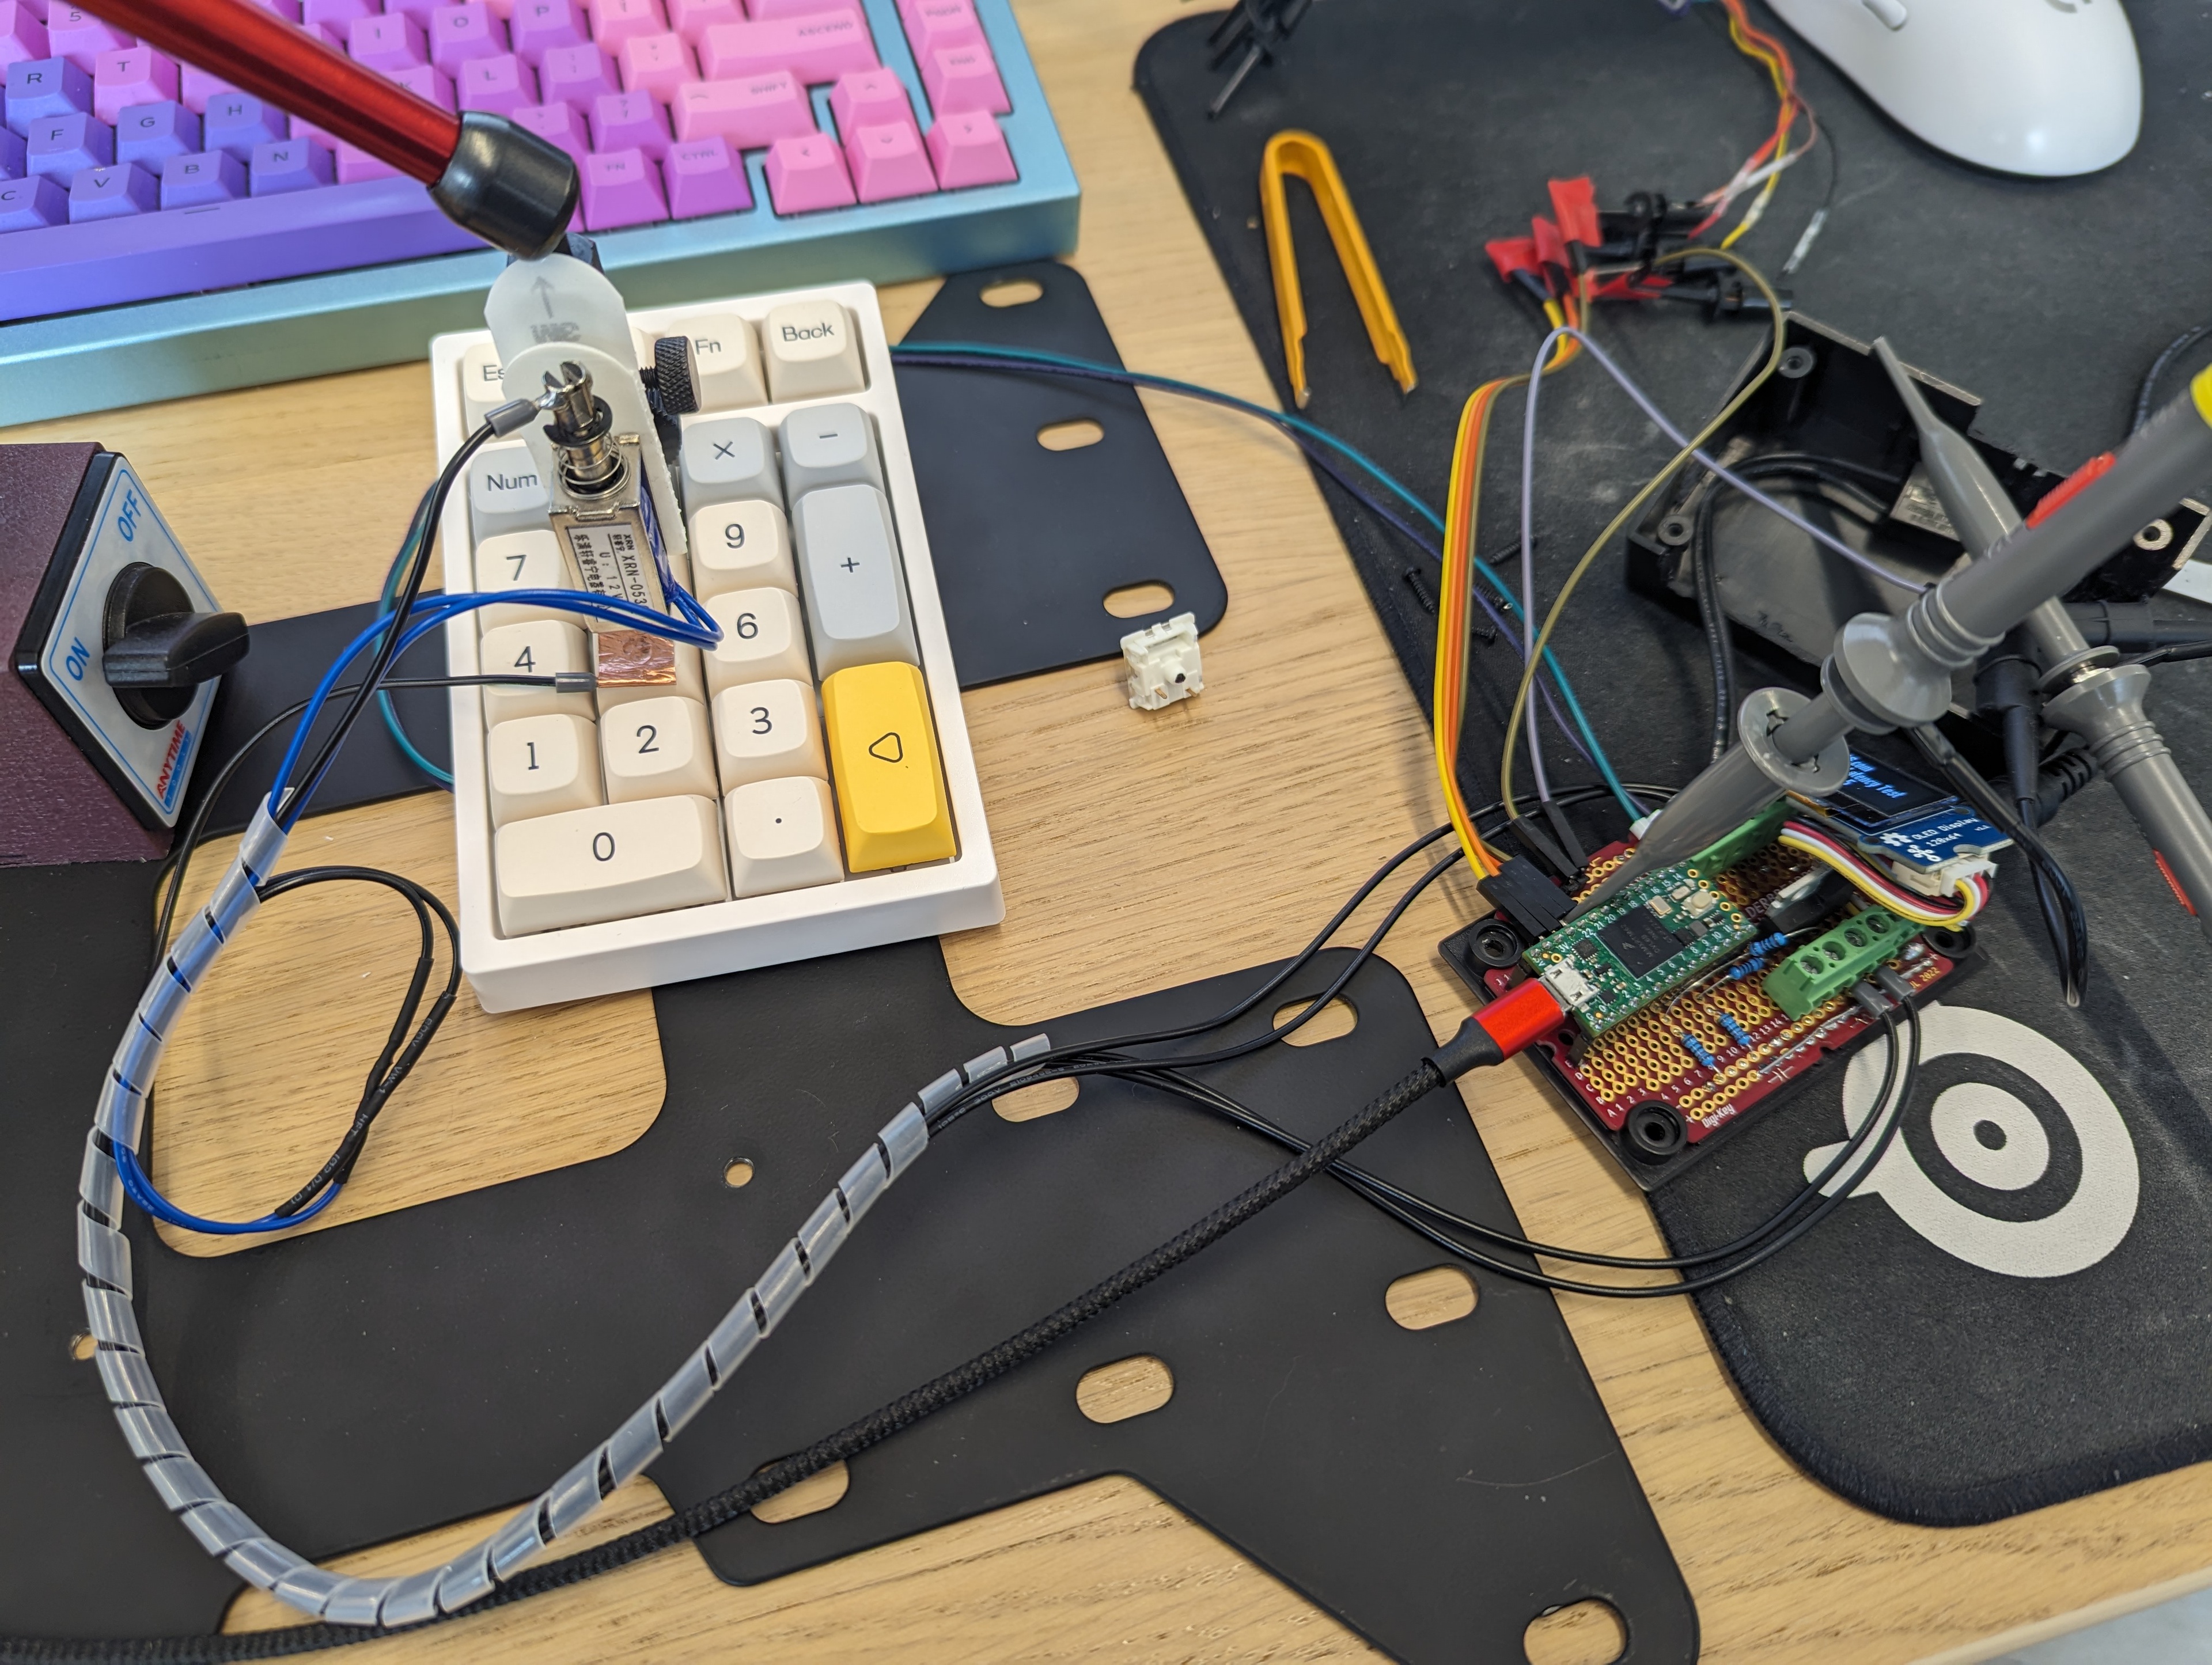
Custom switch latency test setup with our modified Epomaker TH-21 Keypad.
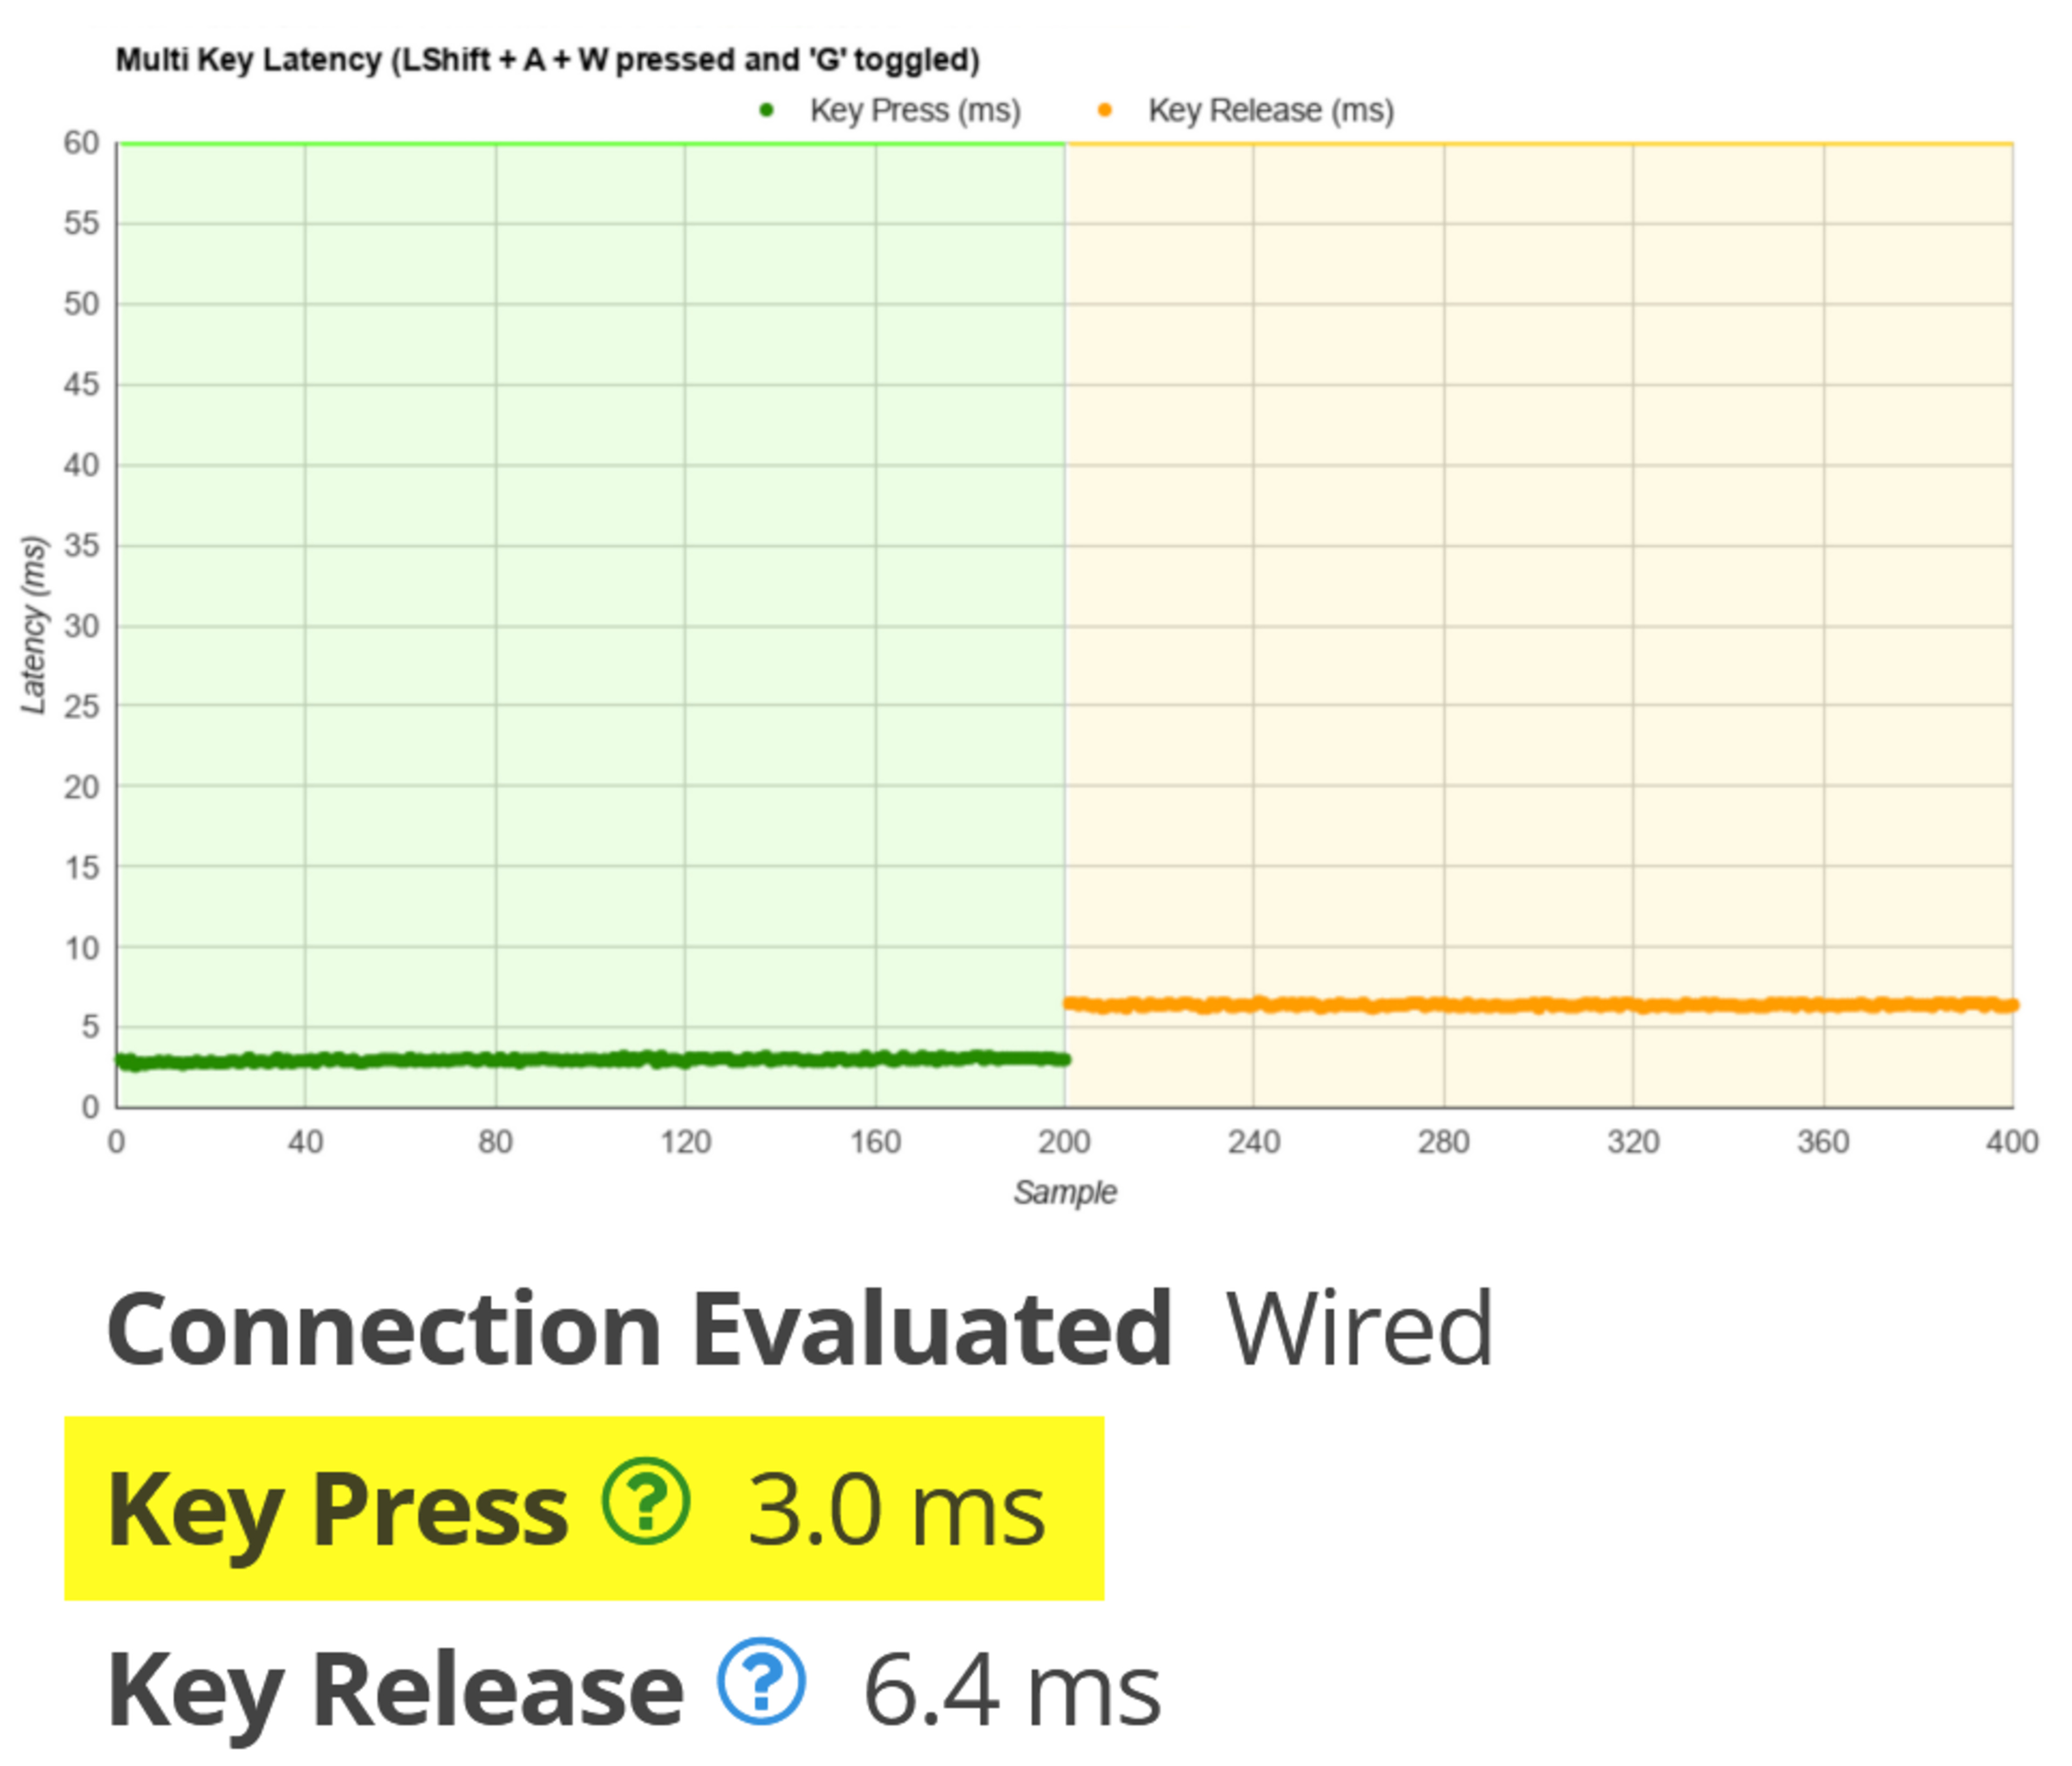
Our custom switch latency test setup provided latency results between 1-2 ms for press and around 5 ms for release. These results align with our previously established calculations that switch latency should account for 80% of the total keyboard latency as measured in our keyboard review.
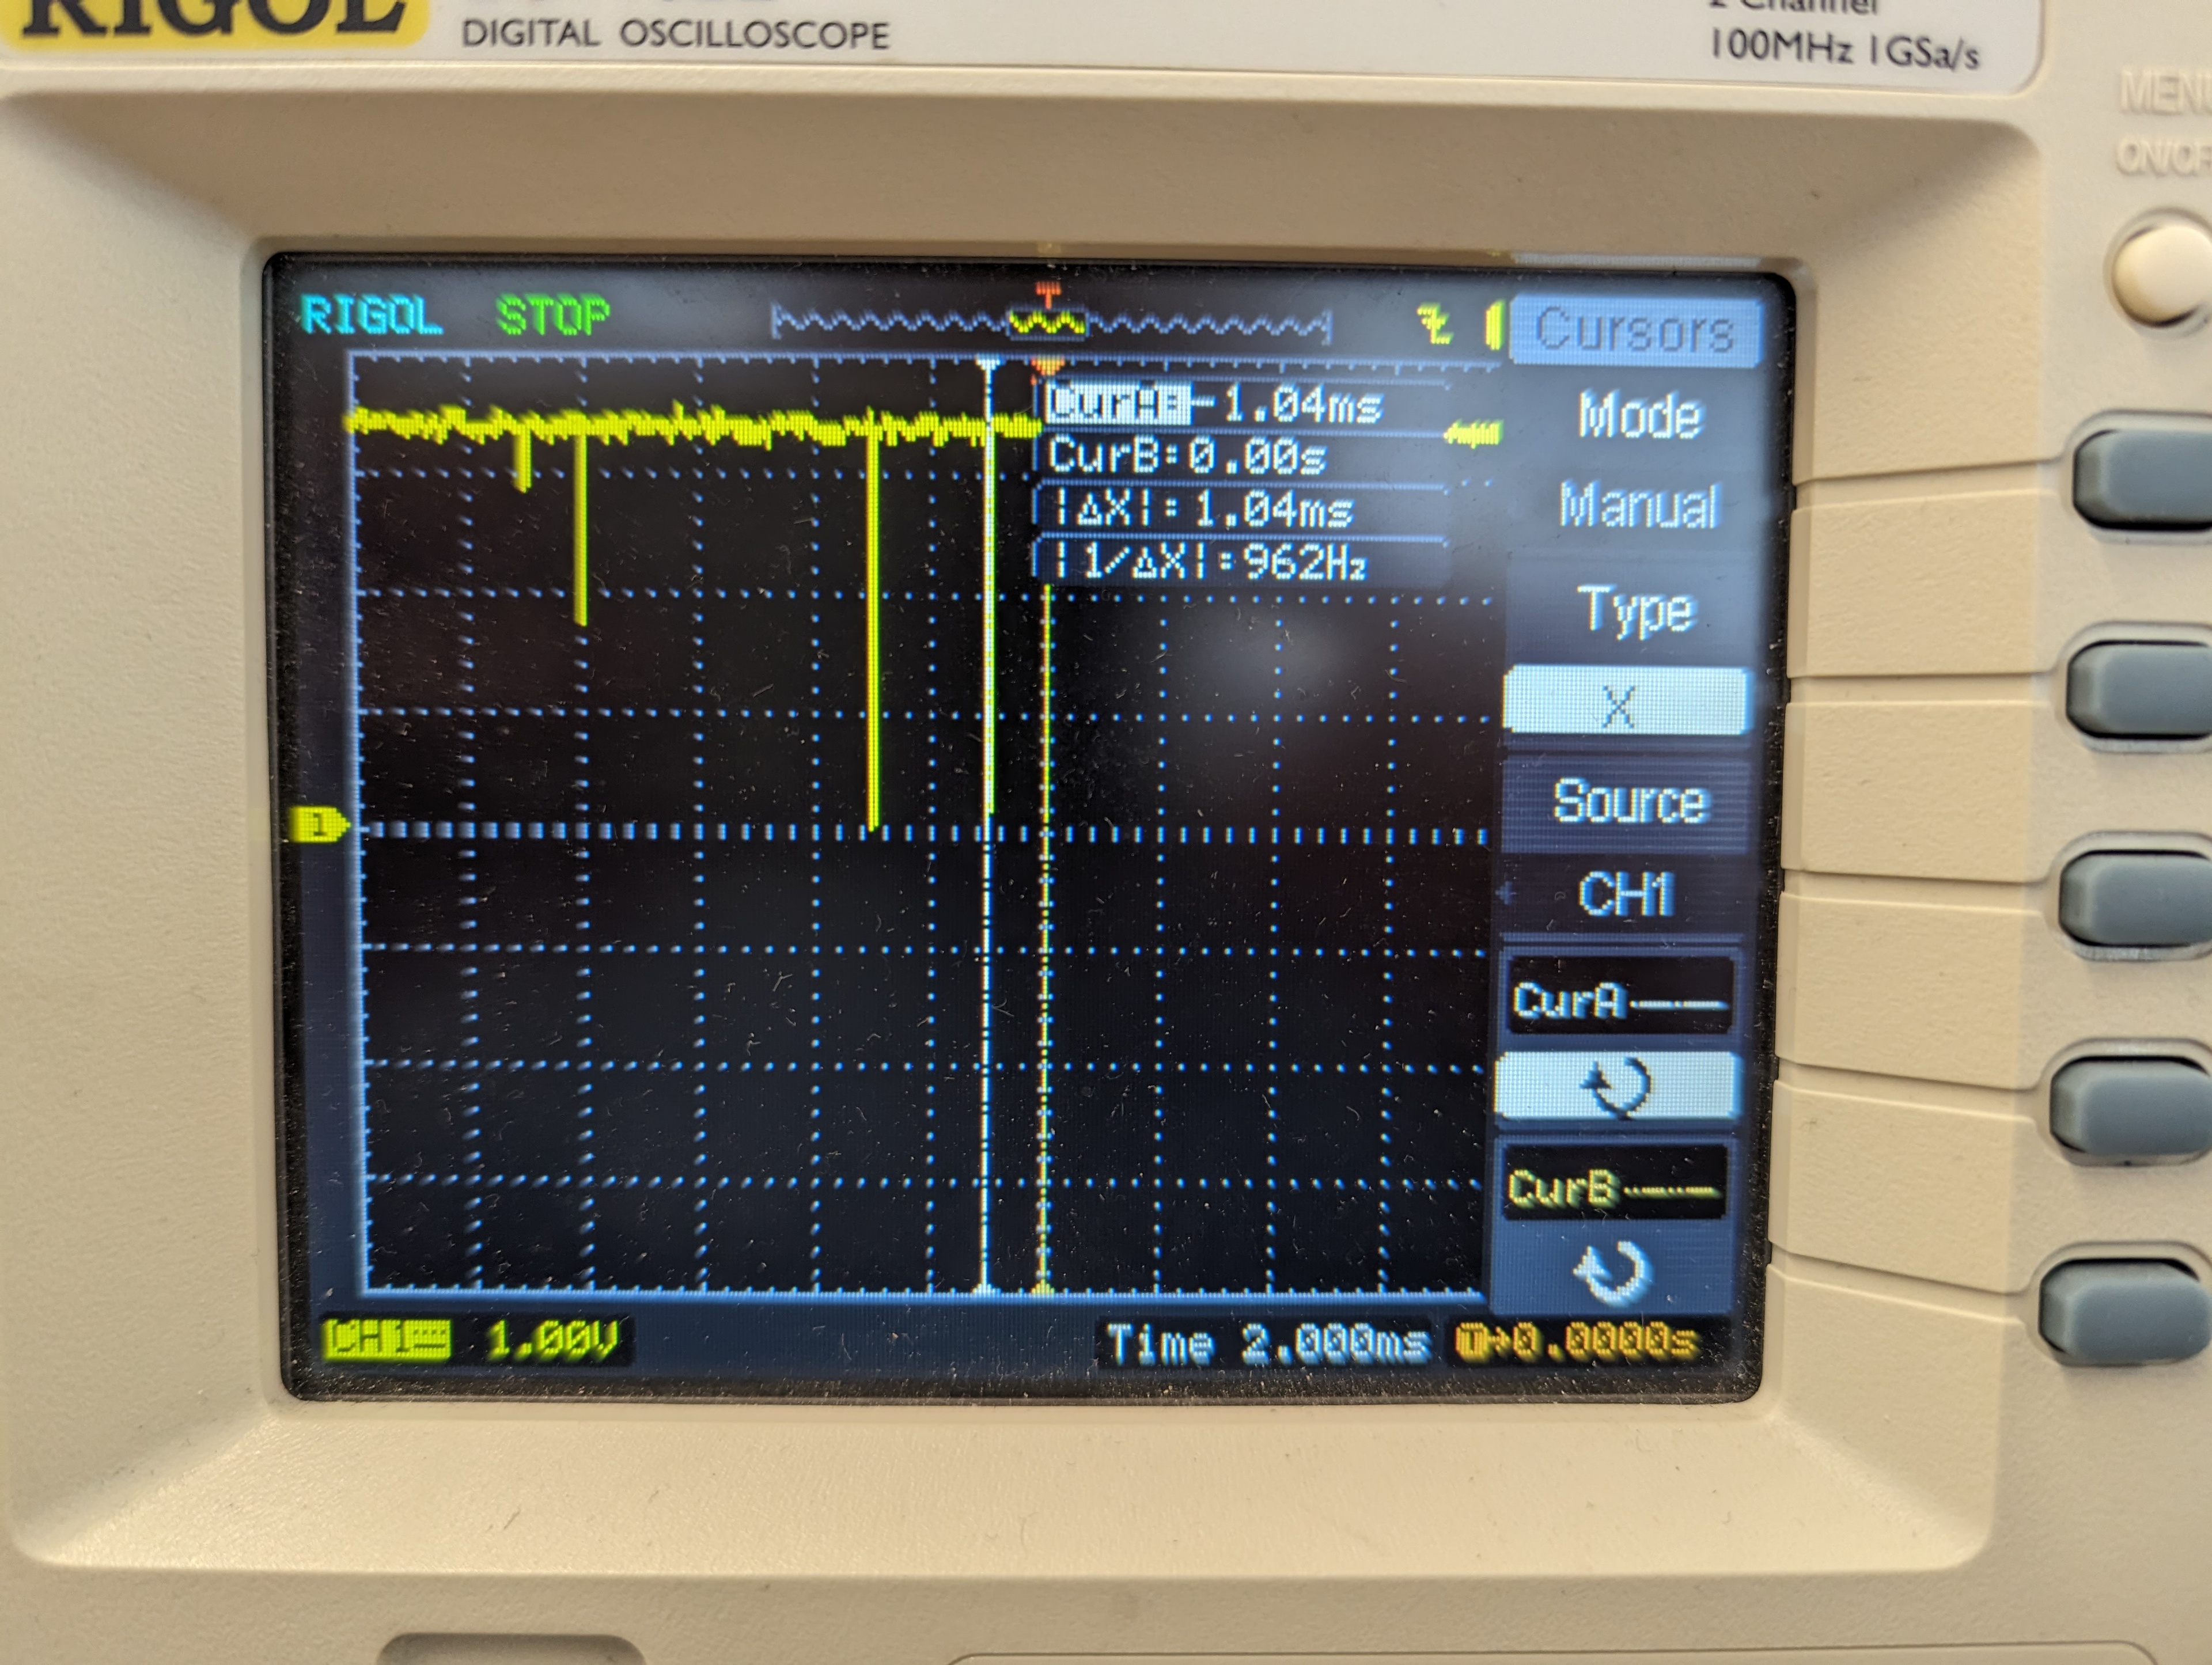
 Switch press pre-travel latency, as measured by an oscilloscope. This sample was measured at 1.68 ms.
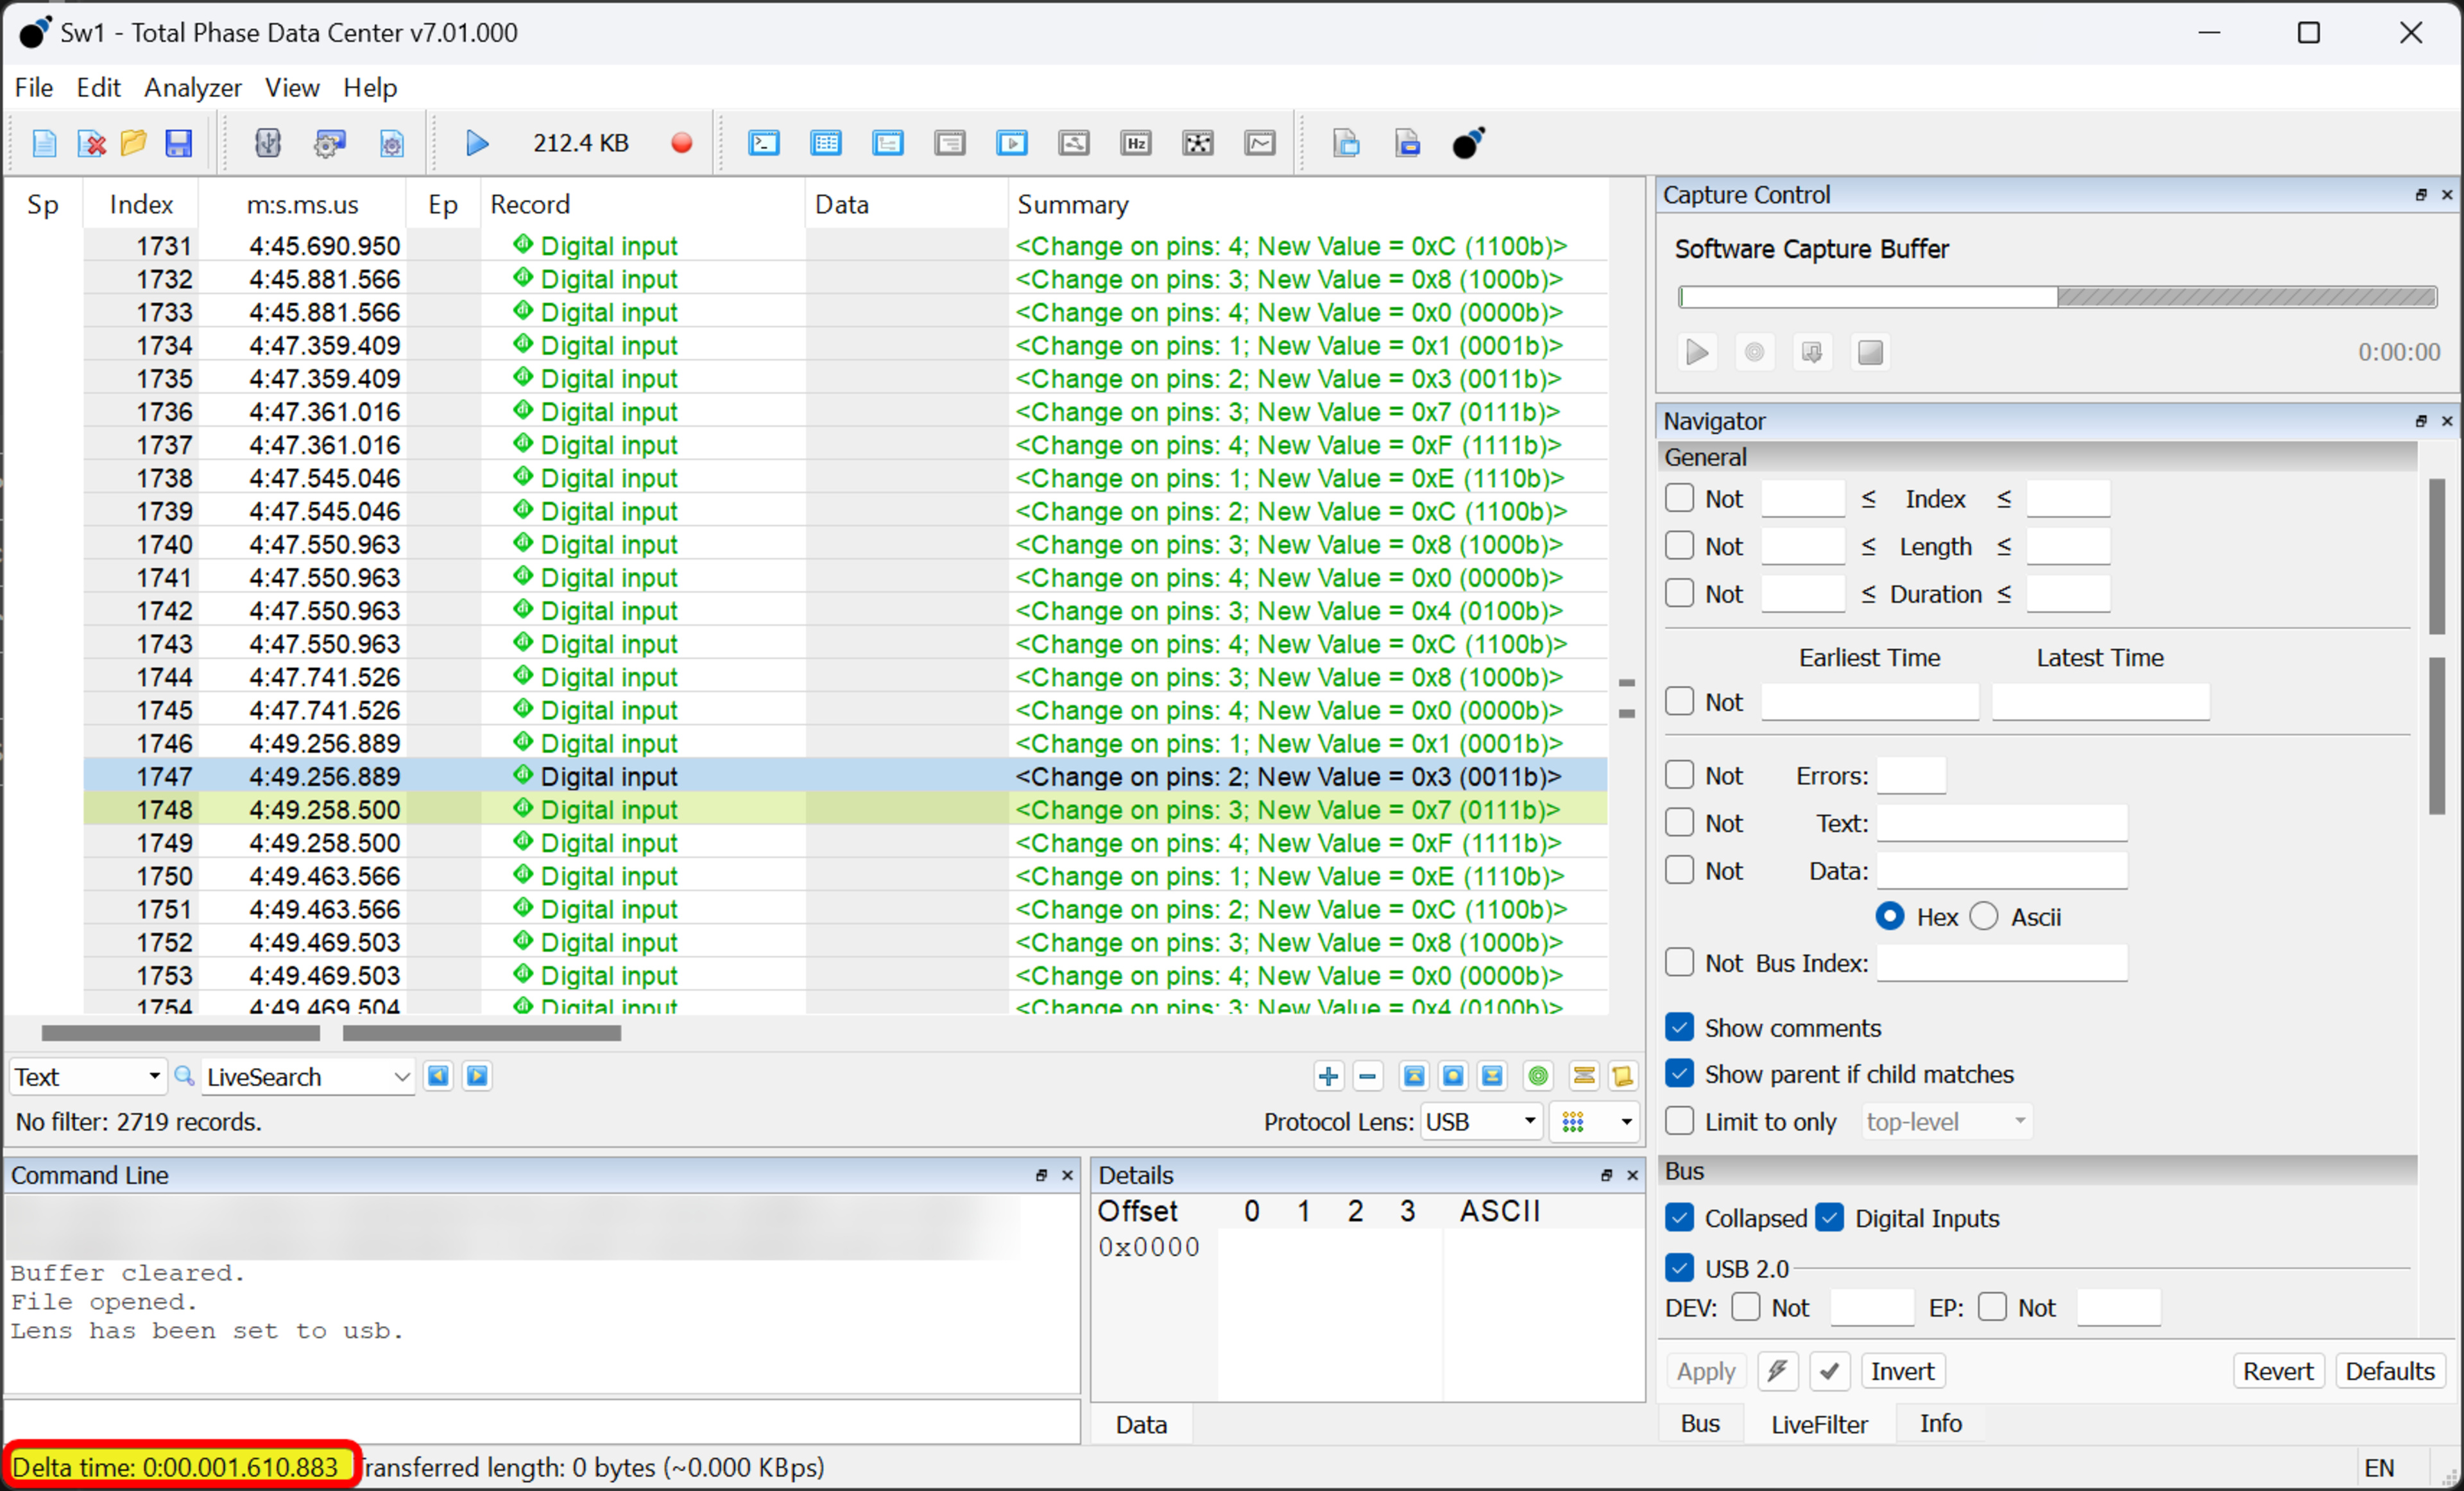 Switch press pre-travel latency, as measured by our USB analyzer. Other sample measured at 1.61 ms.
The above oscilloscope results confirm that using our custom switch latency test setup is valid as it produces results that are essentially equivalent to an oscilloscope on the switch pins. Note that the difference of 0.07 ms is not necessarily attributed to custom setup since they've been taken on different samples. You can attribute this to switch-to-switch variance and/or instrument variance.
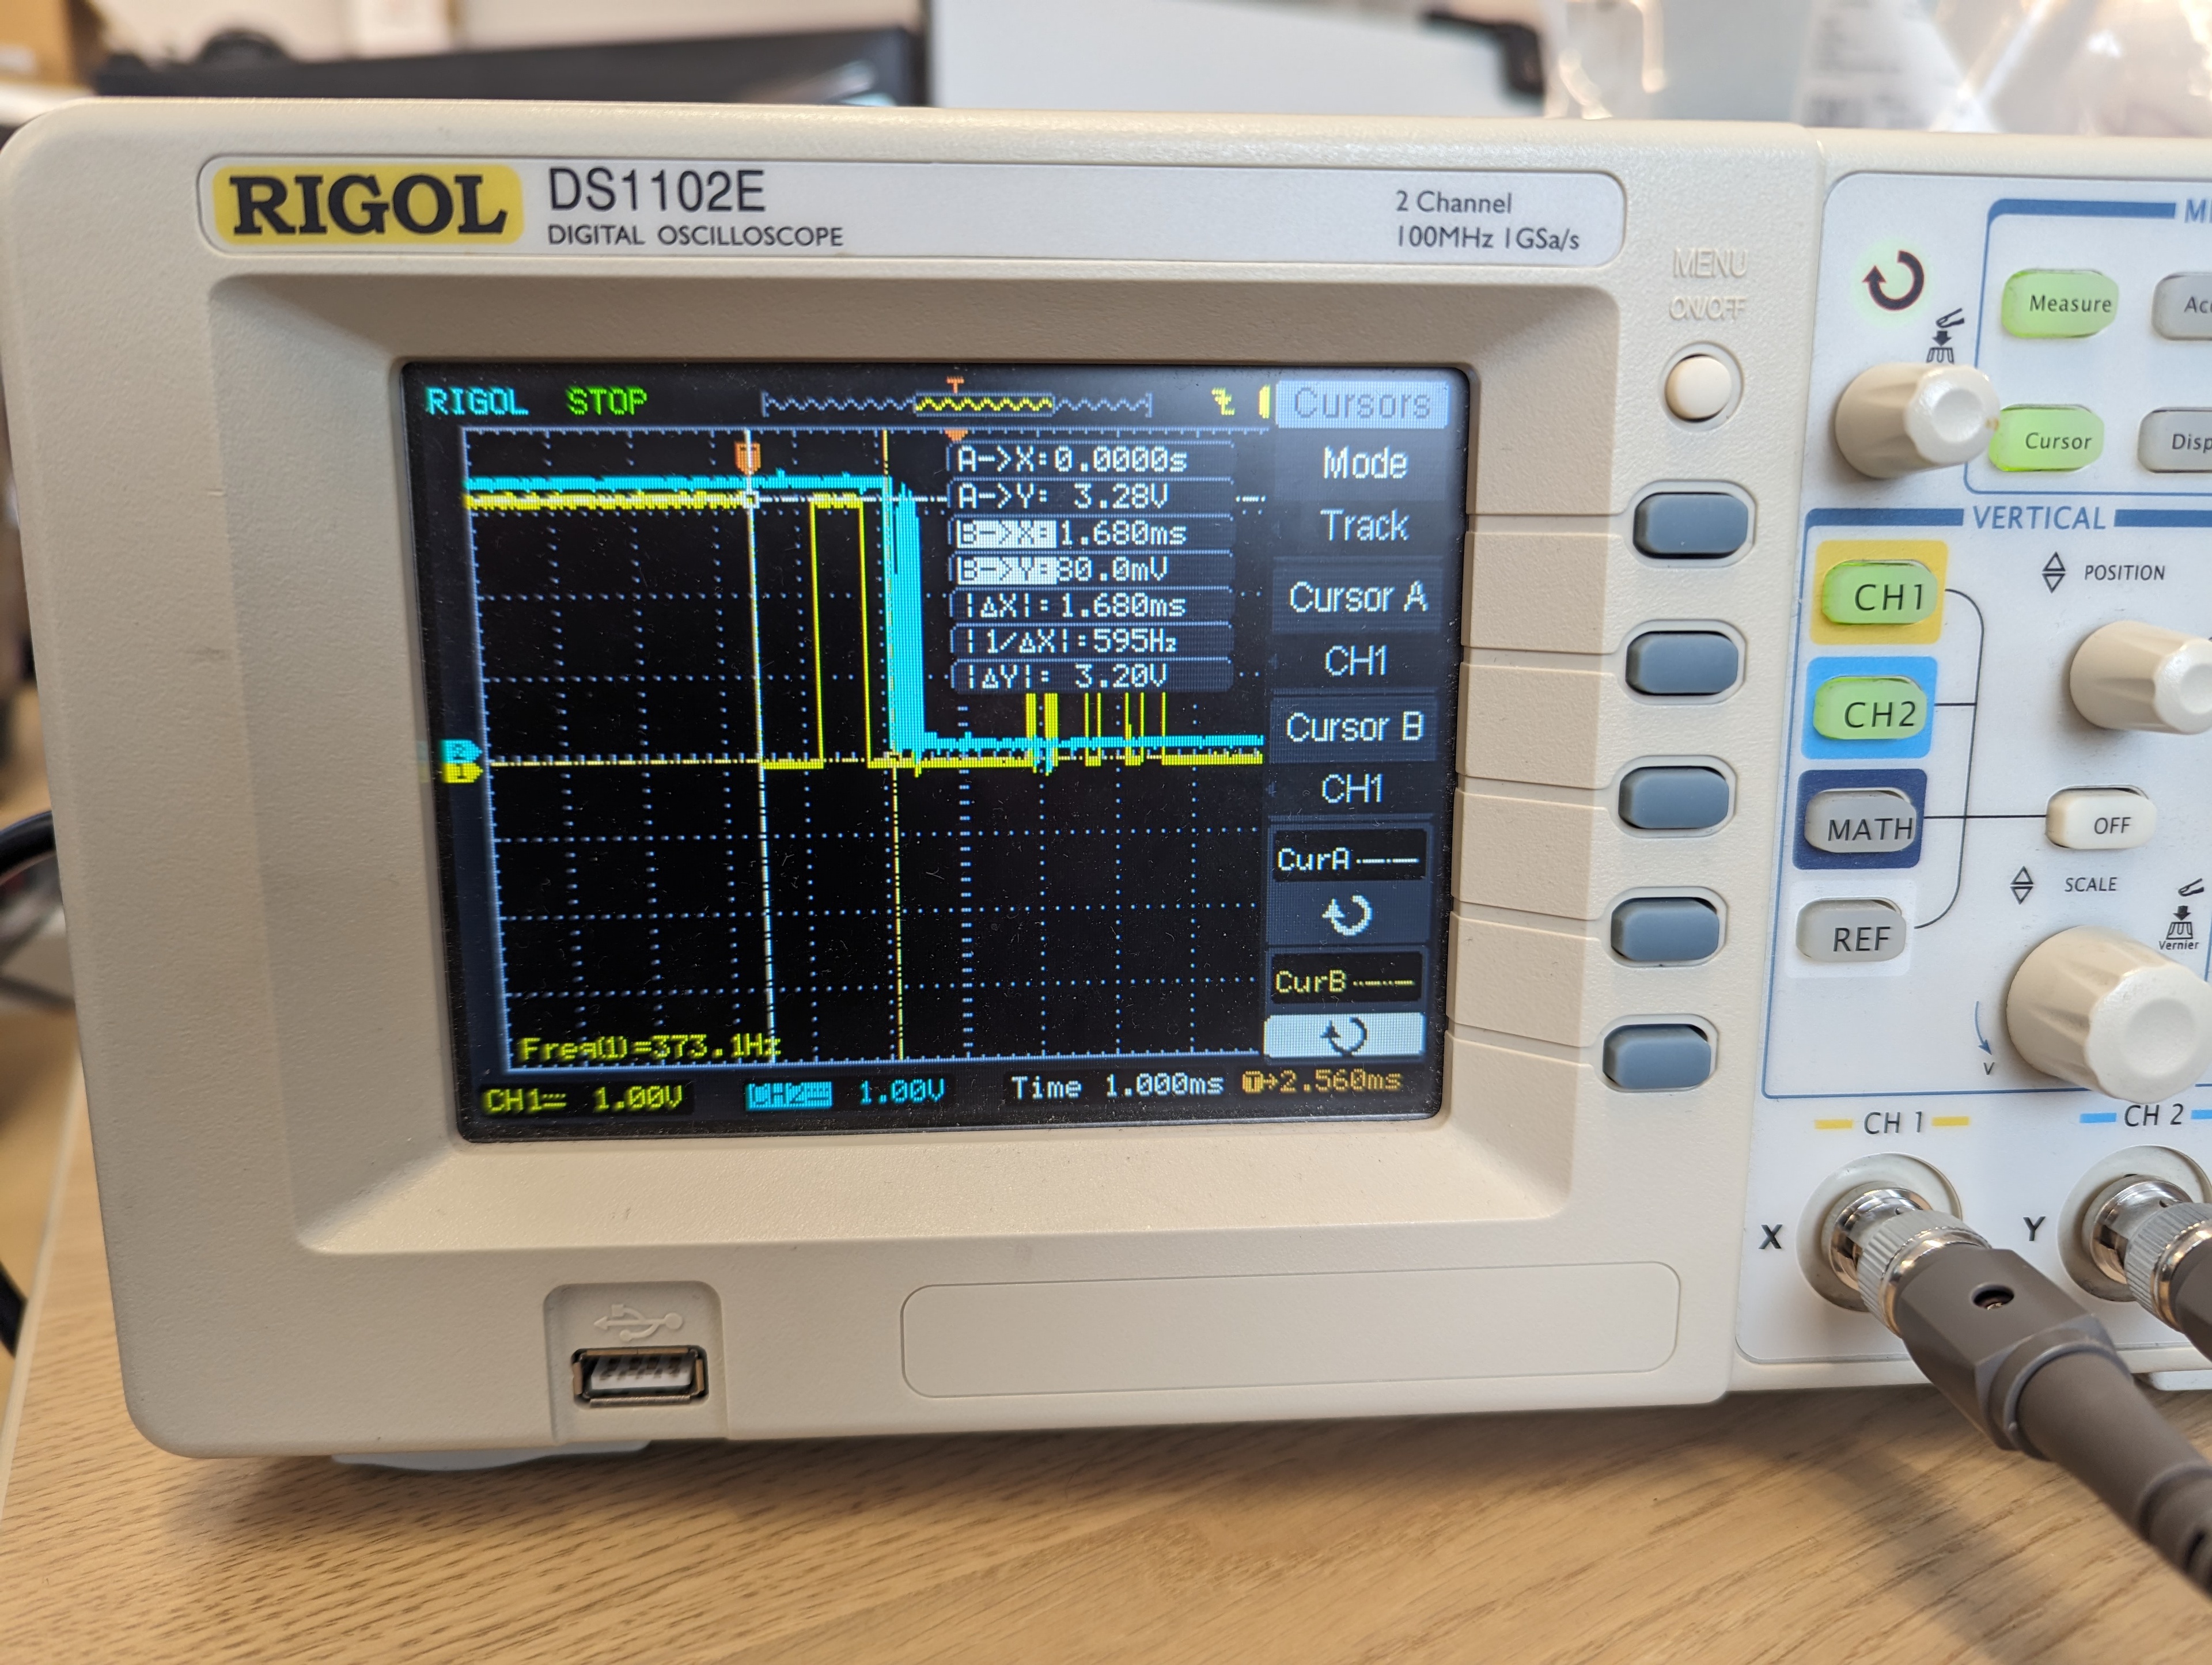
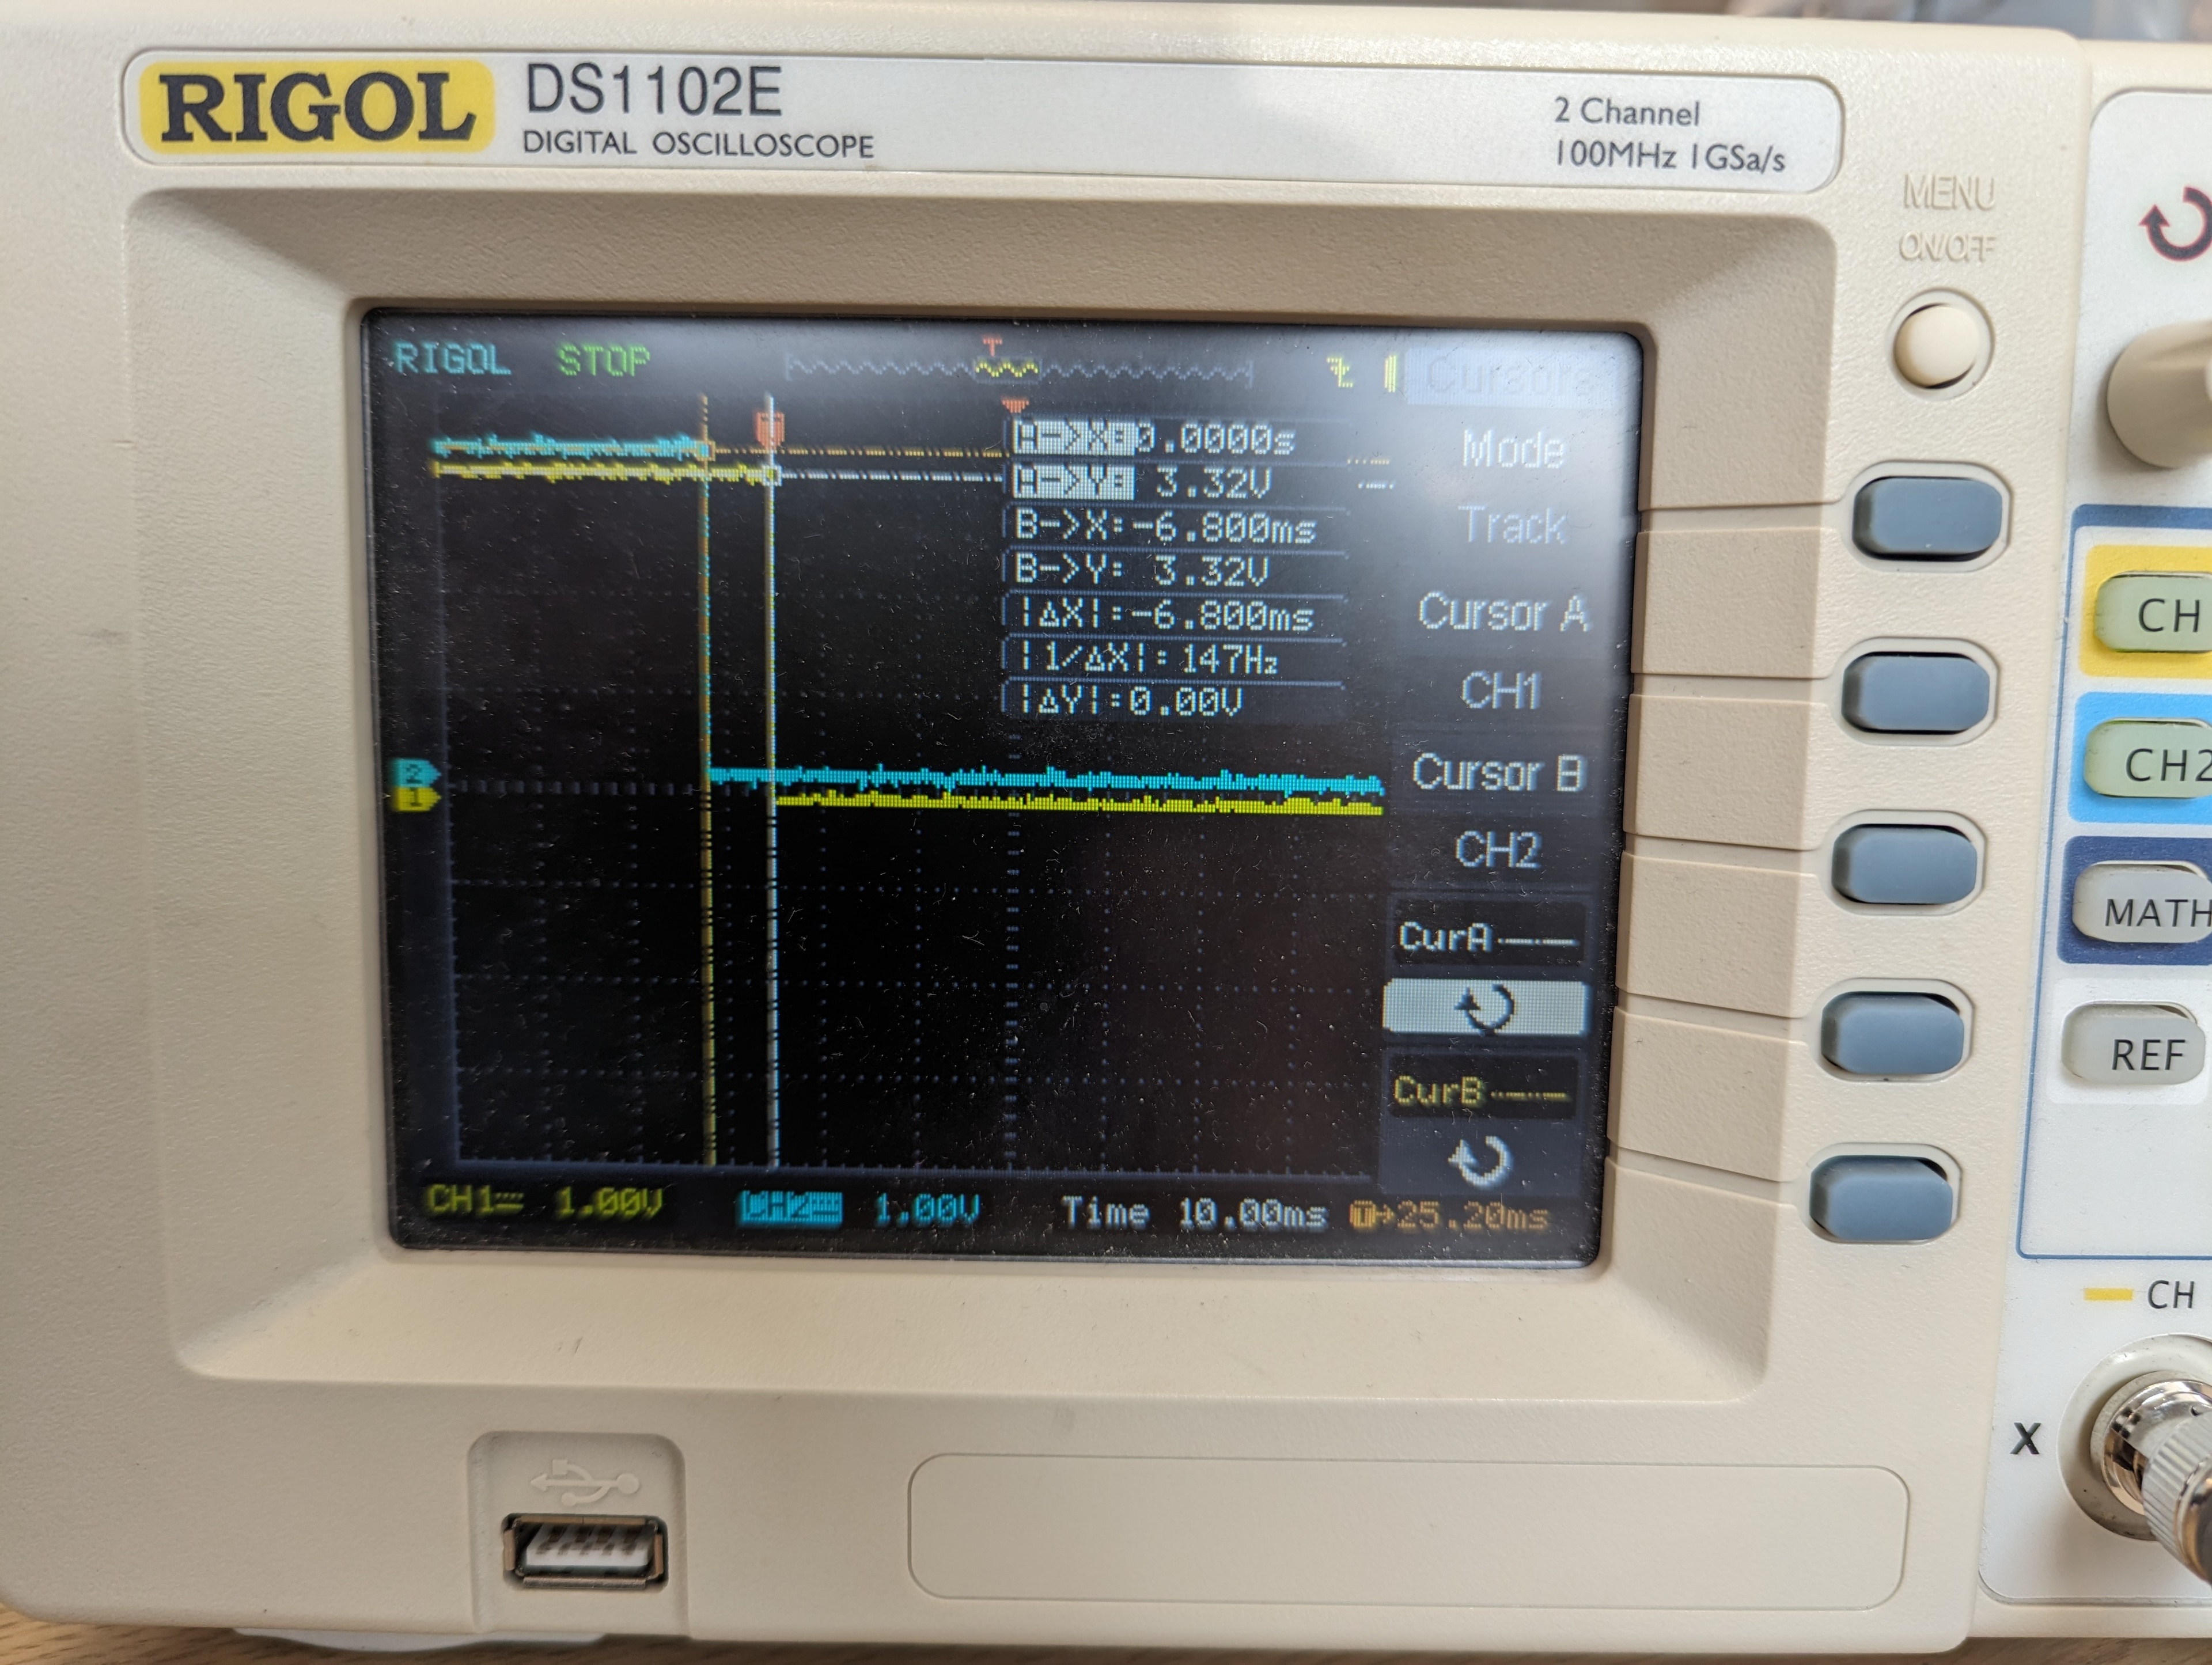 Switch release latency as measured by an oscilloscope. Sample was measured at 6.8 ms.
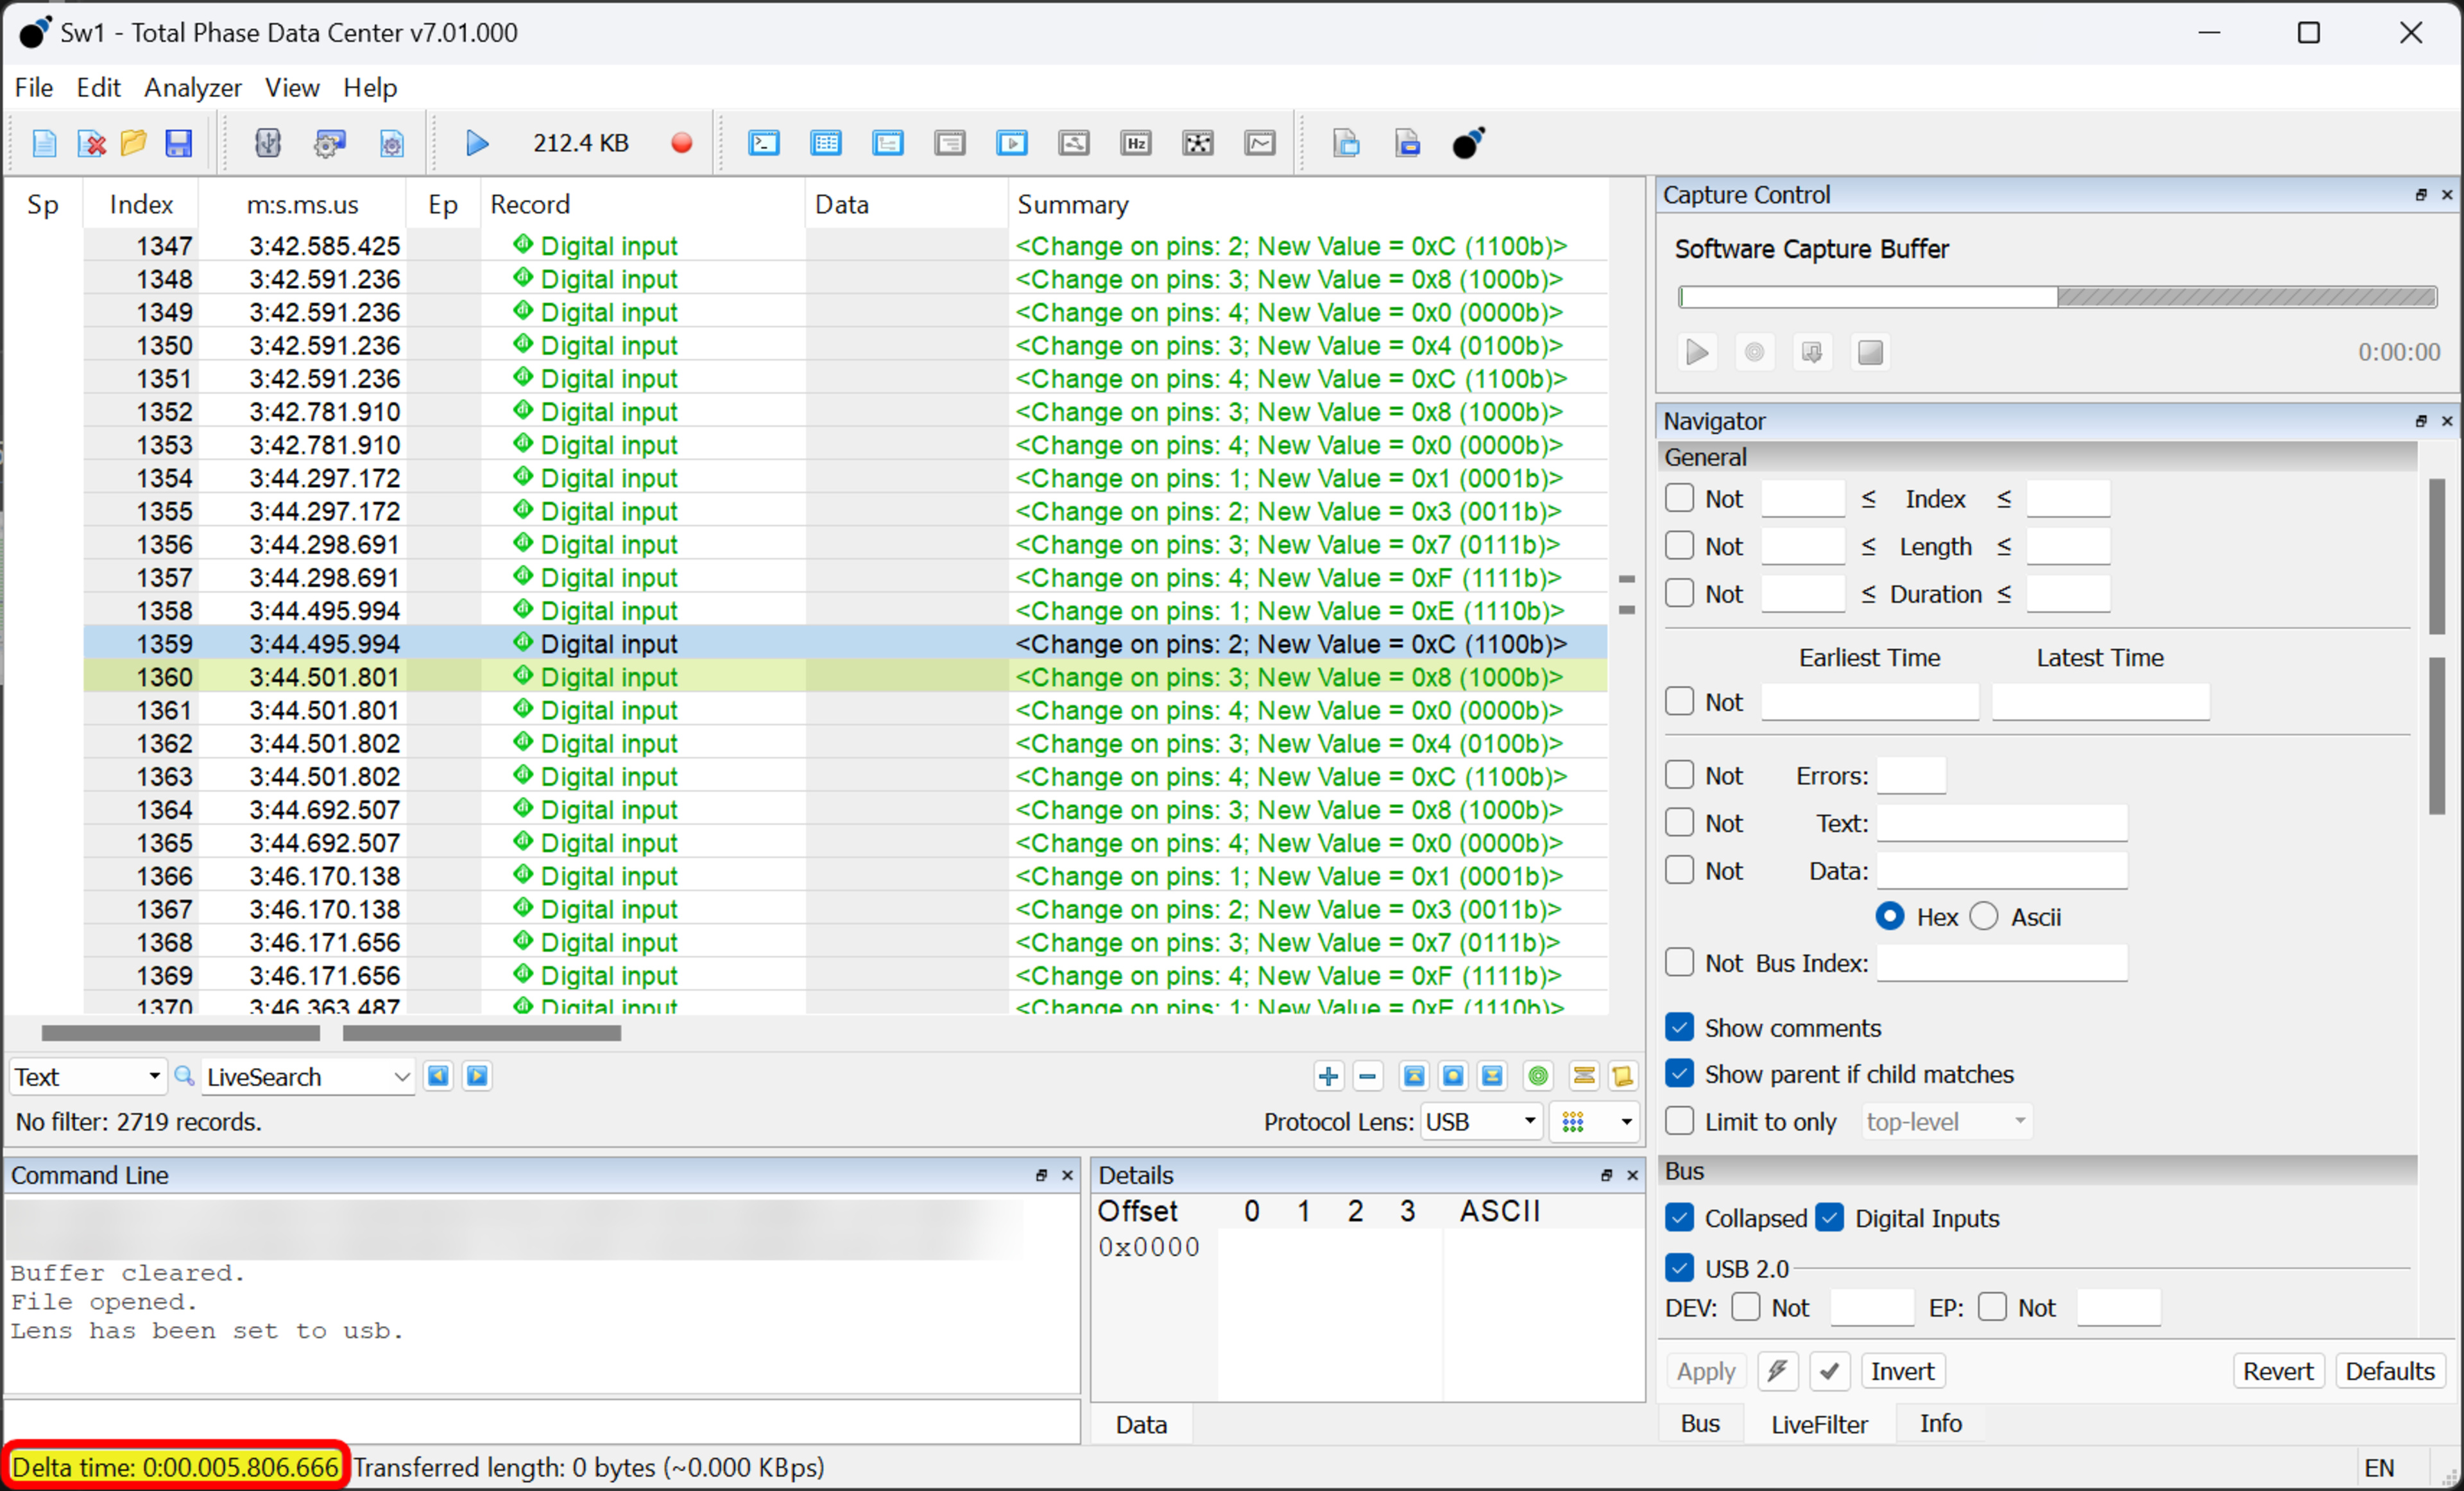 Switch release latency as measured by the USB analyser used for our keyboard reviews. Other sample measured at 5.8 ms.
When testing switch release latency, there's a significant difference in the results between our custom latency setup and the oscilloscope. This suggests that switch release latency results are less reliable than press latency. We know that latency is very sensitive to the height of the solenoid over the key (even more so for release latency). We believe this is due to the weak return spring of the solenoid. To mitigate this as much as possible, we pay extra attention to keep this height consistent in our final testing.
Investigation: Switch to Switch Latency Consistency
In our office, many of us can feel the difference between individual switch units of the same model. This prompted us to investigate whether that inconsistency is manifested in latency.
This investigation has design impacts, like testing multiple switches and testing the same switch multiple times to ensure we can show relevant latency results.
We tested the latency of multiple units of a single switch model to verify whether the latency is consistent across units.
Most of our initial observations were confined to the setup. Our solenoid showed signs of overheating after 250 samples. Critically, we noticed this issue greatly impacted our latency results. While trending deviation of 0.5ms is not too impactful for keyboard latency, it is for switches since most switch latency results are within 1ms of each other.
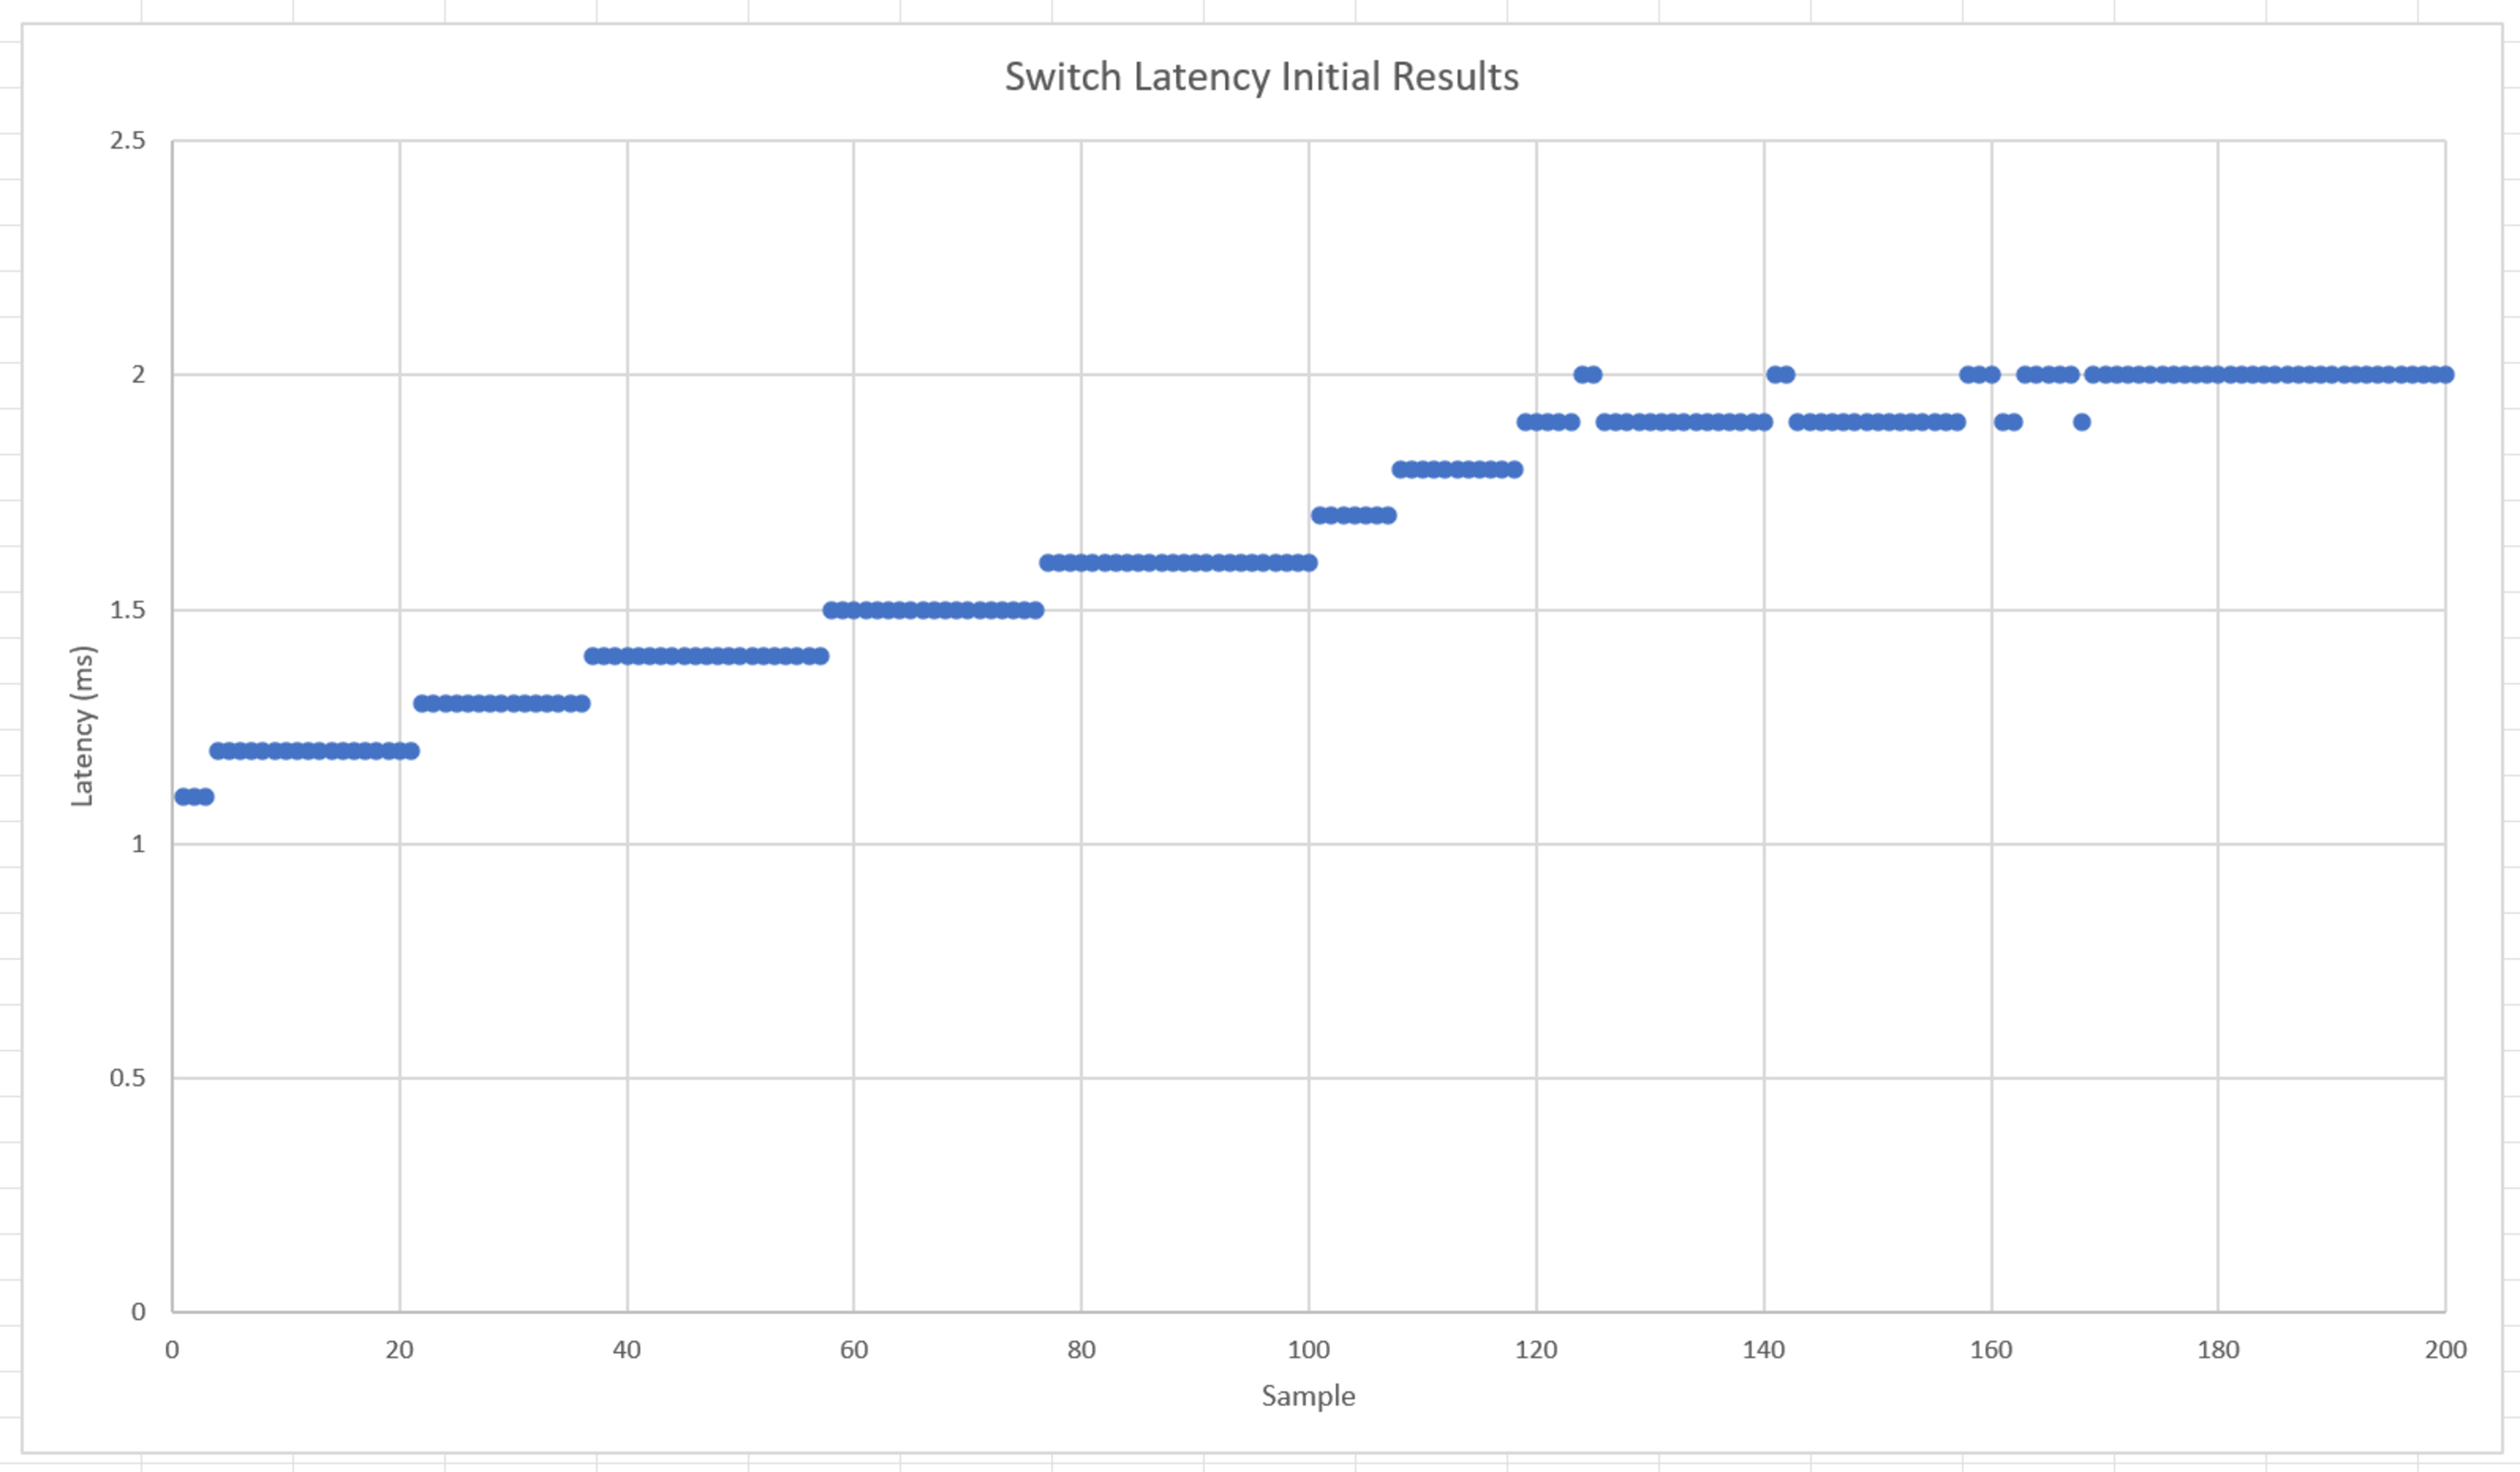
Latency creep due to solenoid temperature increase. Latency rounded to the nearest 0.1ms.
We added a fan around the solenoid, and this change decreased our results and greatly extended the timeframe during which the results are consistent.
Cooling setup for the latency solenoid.
We also observed that the keypad used in our latency test setup would shift a little when hit by the solenoid repeatedly. We could also see the copper tape lifting over time if we didn't replace it regularly. For the last samples, we clamped the board and replaced the tape, and the consistency of the results was much improved.
Latency consistency of Kailh Pro Purple switches after clamping the Numpad and cooling the solenoid.
We did all the above tests with Kailh Pro Purple switches, which are consistent once we control the external conditions. Based on this, we started the official latency testing on a single switch. Mostly, the results between the switches tested by R&D and those tested by our testing team were consistent. One switch did stand out as being noticeably different: the Glorious Panda.
 Glorious Panda latency difference between two units.
Our small sample size doesn't allow us to suggest any consistency issues with Glorious switches in general. However, the fact that switch inconsistency is an issue (regardless of the switch model) means we should account for it in our testing. Therefore, we adjusted our latency test, so we're testing five switch units. As such, the latency results presented in each review are an average from the result of five switch units.
Investigation: Correlation to Pre-Travel
Entering this update, we were confident that latency scores would be closely correlated to pre-travel distance. However, due to the solenoid we use, more variables impact latency than we originally thought.
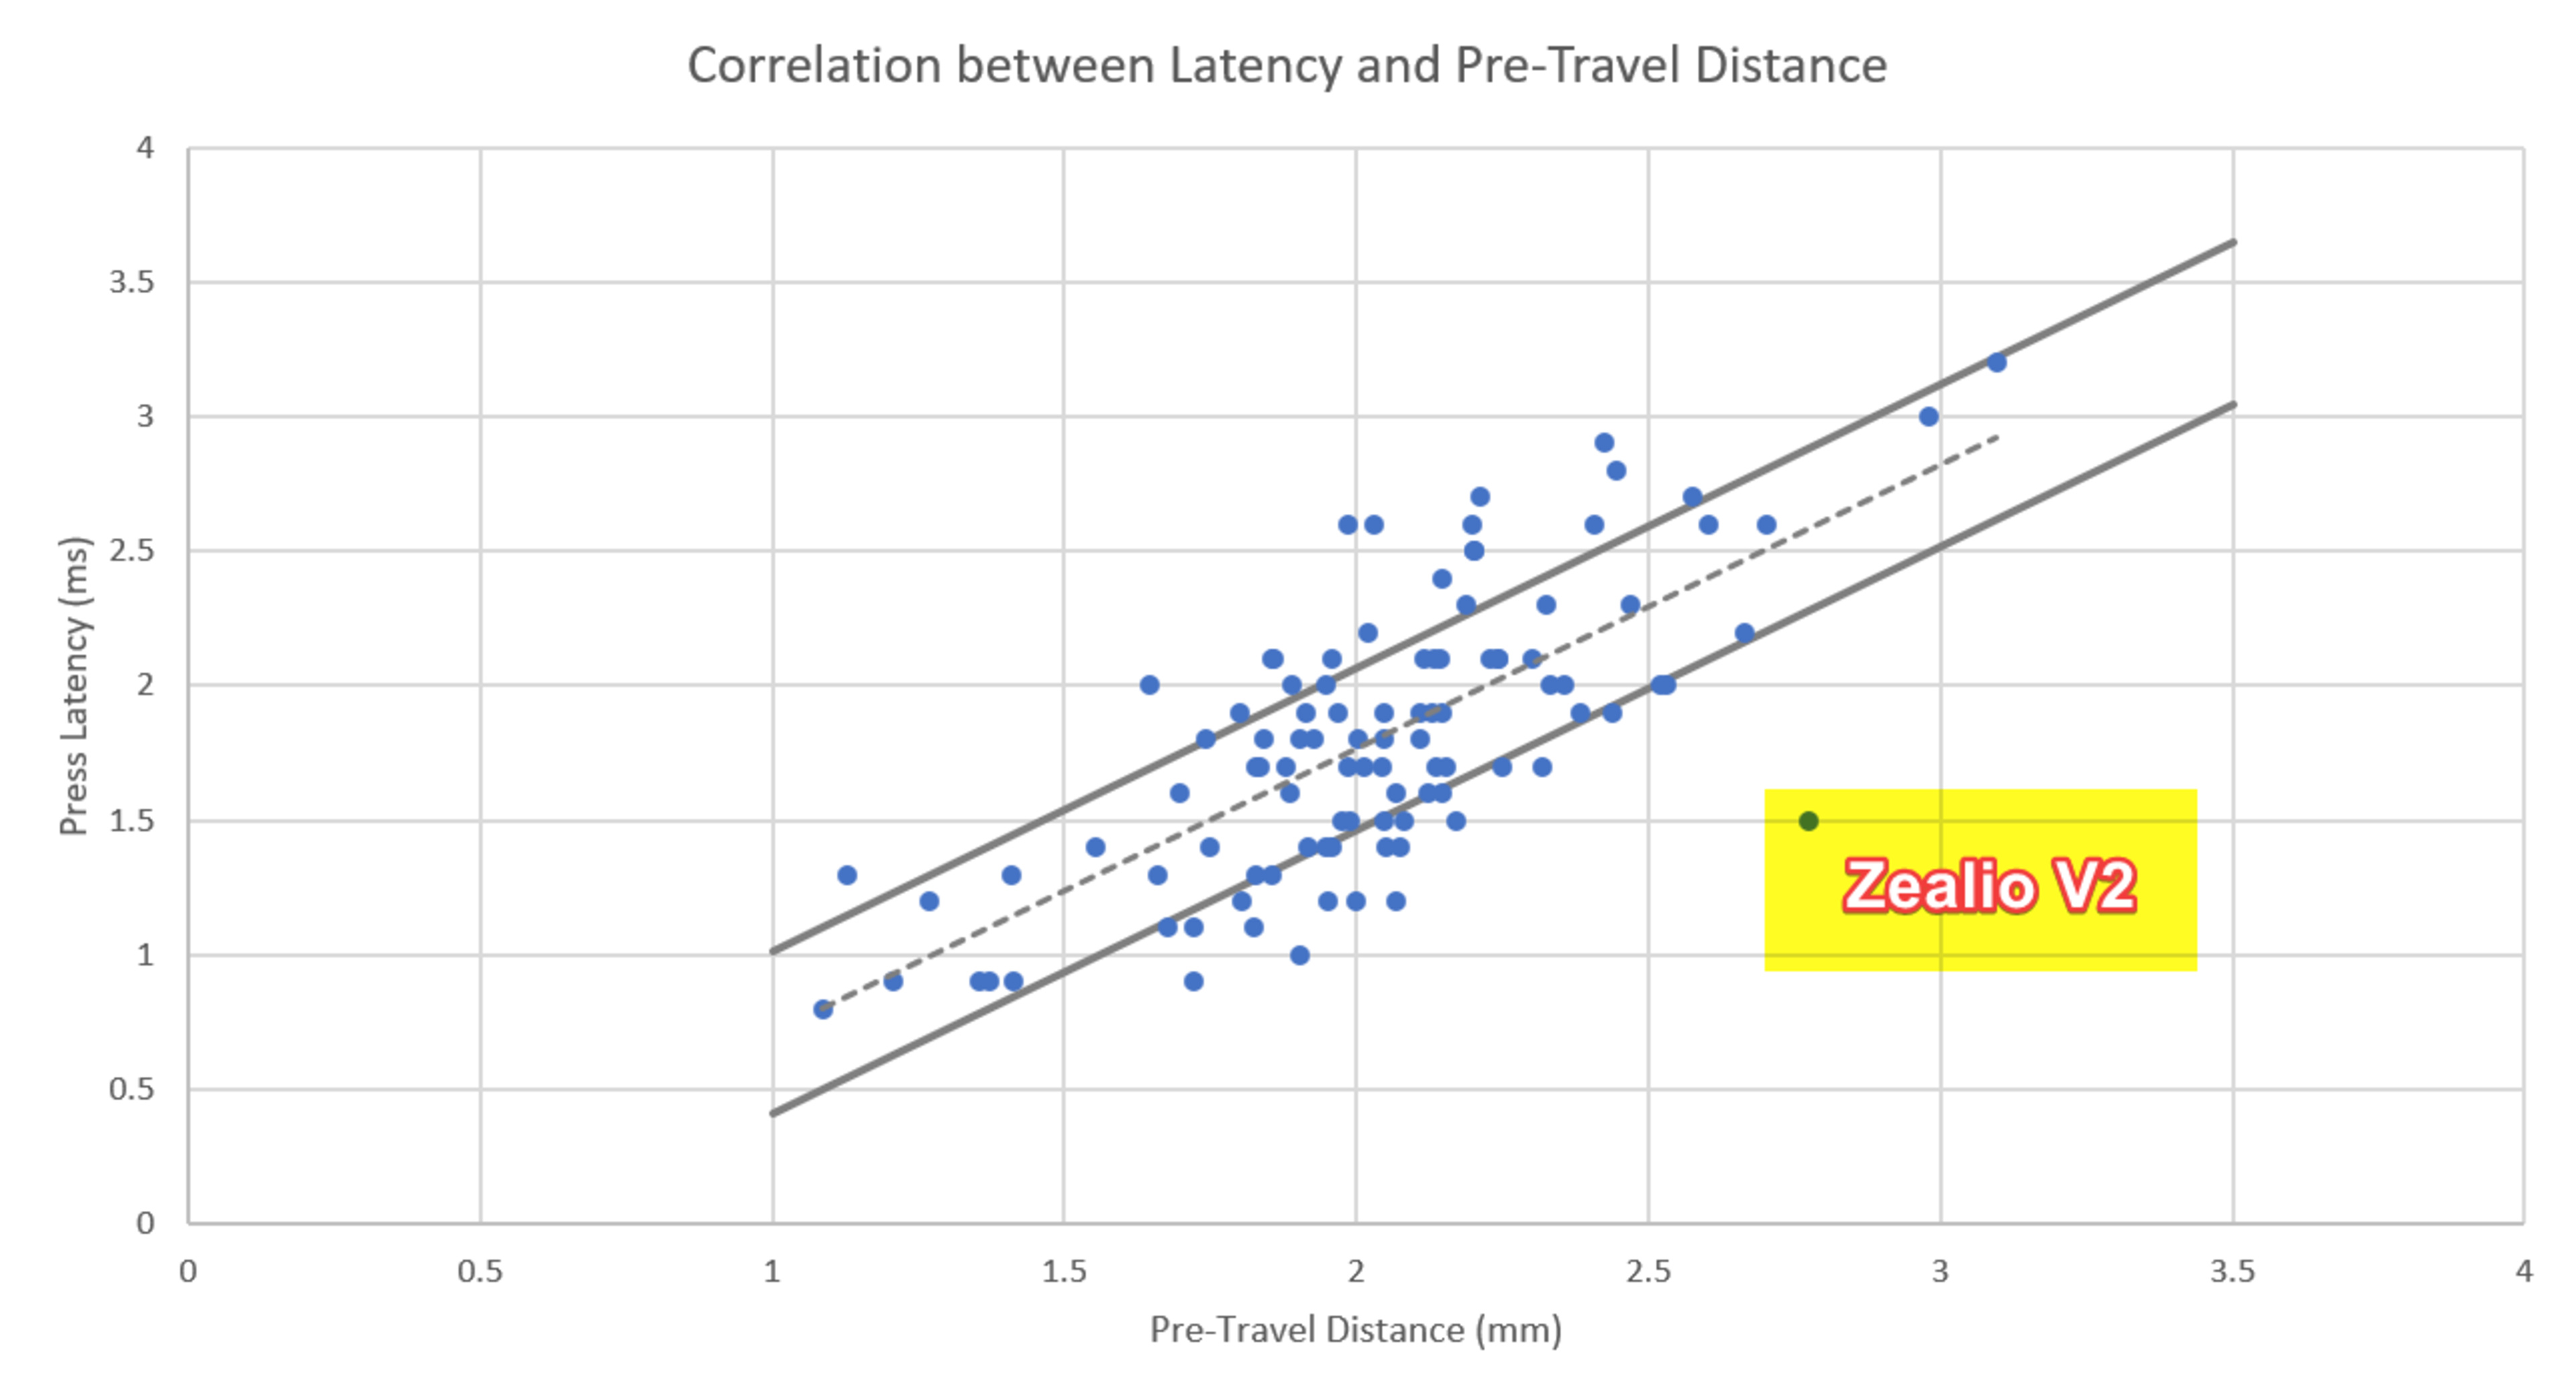
Correlation between latency and pre-travel distance.
Overall, there's a clear correlation between the two, but there's also quite a bit more nuance than we expected. Spring Force and Click Bars likely have an impact, too. We estimate the overall tolerance to be about 0.3 ms when accounting for both measurement errors.
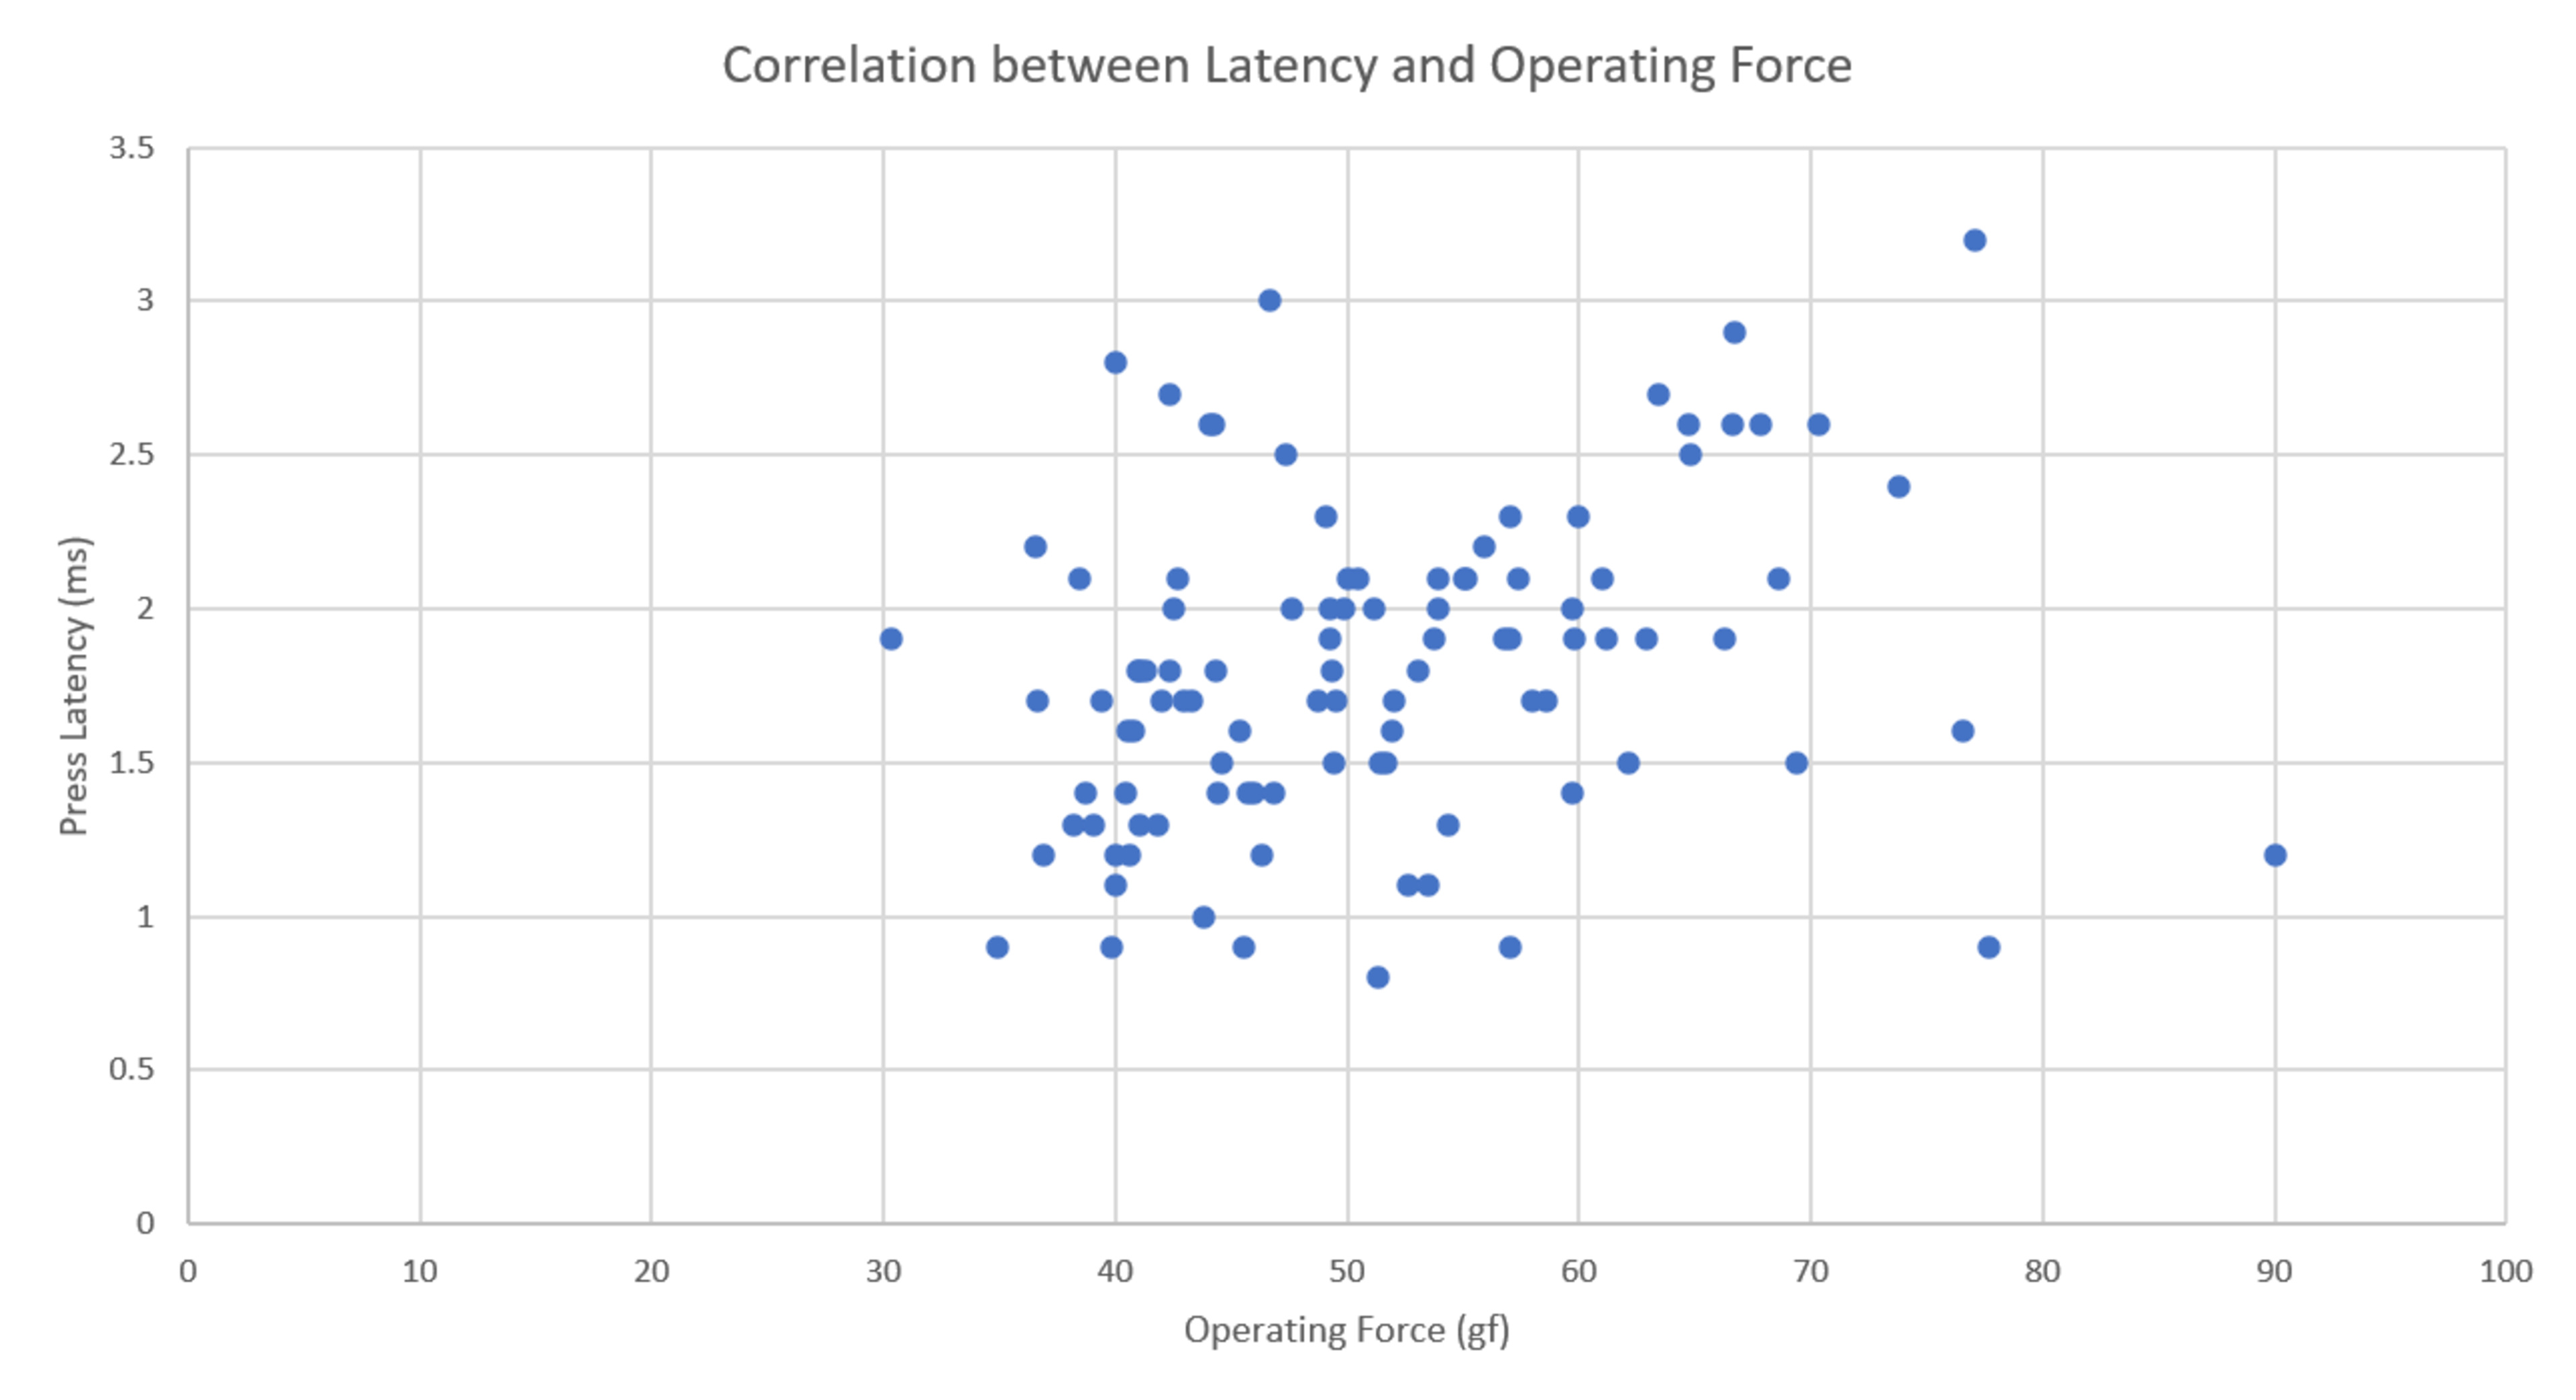
Correlation between latency and operating force.
Looking at the chart above, there isn't a correlation between the operating force and the press latency. This is good news, as the opposite would have meant that our solenoid isn't strong enough.
We see one major outlier: the Gateron Zealio V2 67g. We checked all the results and how the switch feels in our hands. The results look good, and these switches are among the most consistent switches we've tested. We also checked if the contacts were different, but they appeared to be the same as other Gateron switches.
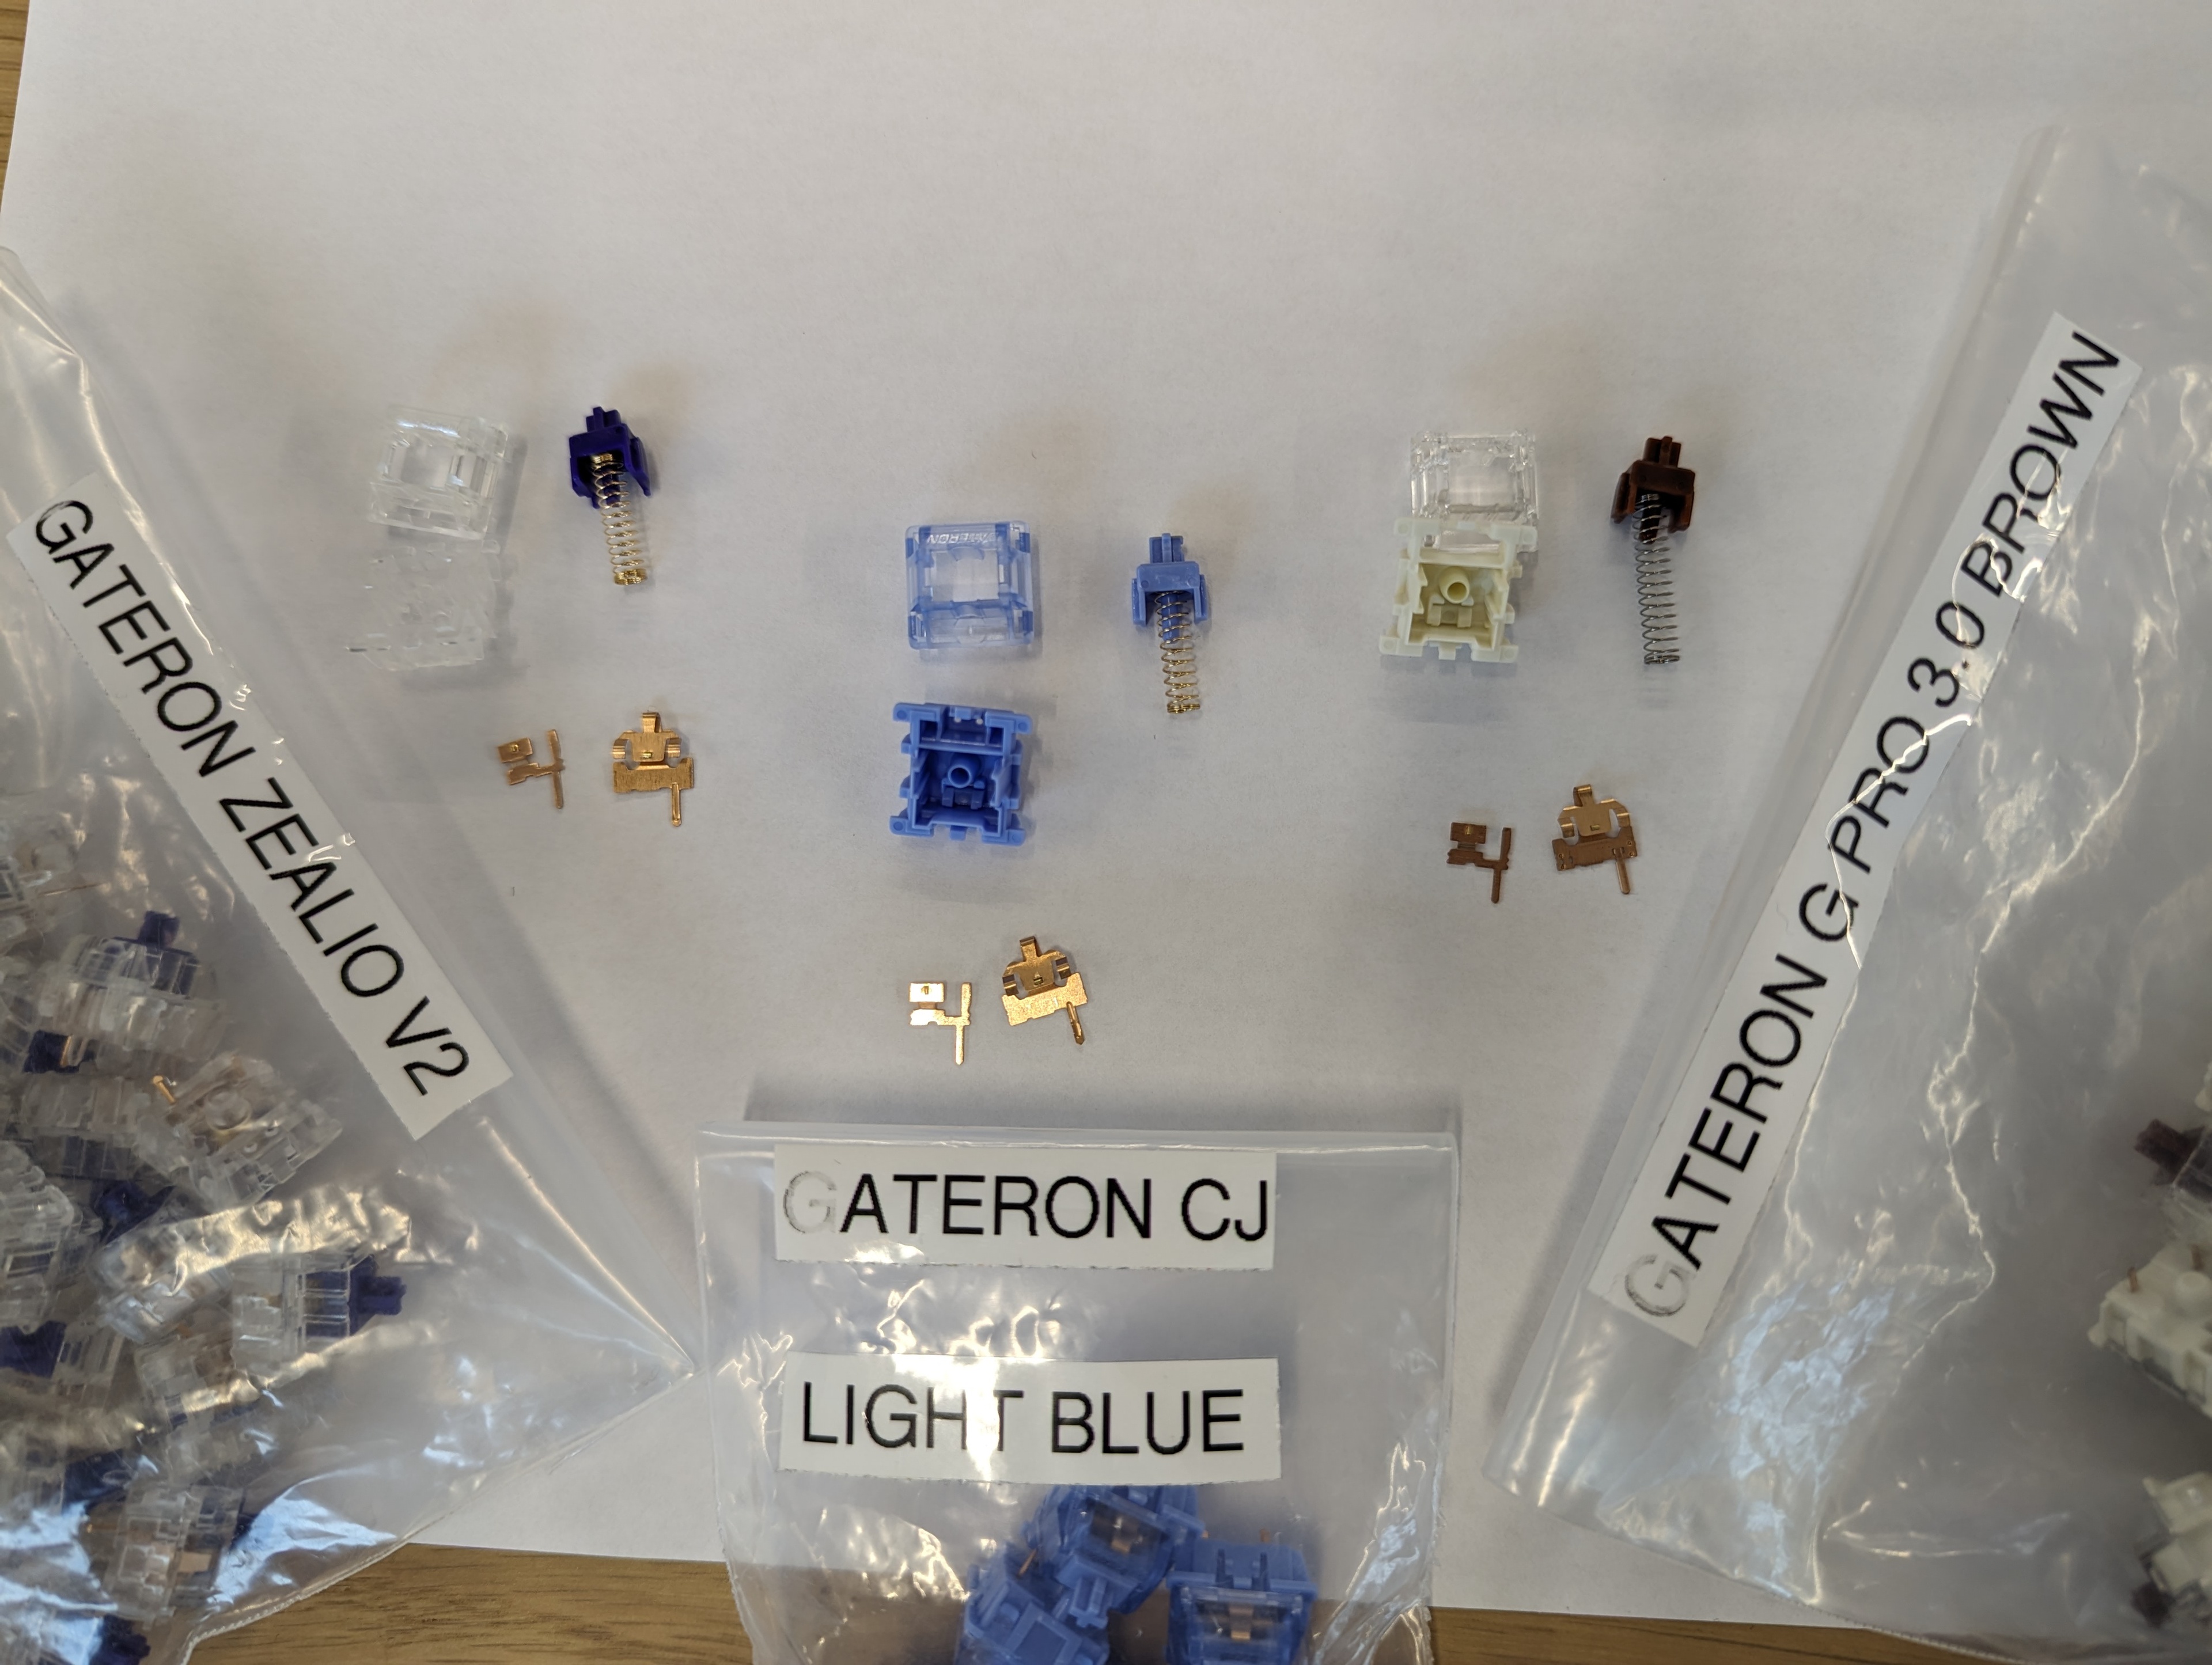
Comparison of various Gateron switch contacts
From left to right: Gateron Zealio V2, Gateron CJ Light Blue, Gateron Pro 3.0 Brown
There's one variable that could impact our ability to compare pre-travel and latency results: dynamic effects. Our keystroke data is measured slowly, and latency is very fast. This means that the inertia and acceleration of the various components of the switch are included in our latency results but not in our keystroke results. If the stem moves quickly, it could engage the copper pieces with enough force that the contacts are closing before the stem moves to the steady state actuation point.
Solution
Because we want to measure pre-travel latency, we need to add an electrical flag when the PCB signal is sent. For this, we solder wires to a keyboard's hot-swap socket and send that event to be logged with a USB analyzer. We're using a Beagle 480 because it's the same tool we use for mice and keyboard latency, and we trust its results. To avoid any electrical issues arising from the keyboard matrix, we're leaving the keyboard unplugged. This means our USB analyzer captures won't contain any USB data, only digital pin events. It may seem excessive, but this approach allows us to keep the switch latency testing closely related to the keyboard and mice latency test, making it more consistent for the testing team and allowing the R&D team to reuse much of the result processing automation.
The USB analyzer input pins expect a clean, fully digital signal, something a copper contact or a switch can't do because there's always electrical noise and bouncing. To resolve this, we also use a microcontroller as a middleman. The microcontroller reads every electrical contact and then sends those to the USB analyzer. During early development, we compared the switch latency measured by the oscilloscope and the latency captured by the USB analyzer and found that it was always within the same microsecond (0.000 001s). With this result, we're confident that our microcontroller acting as a middleman and the USB analyzer aren't adding any latency to the test results.
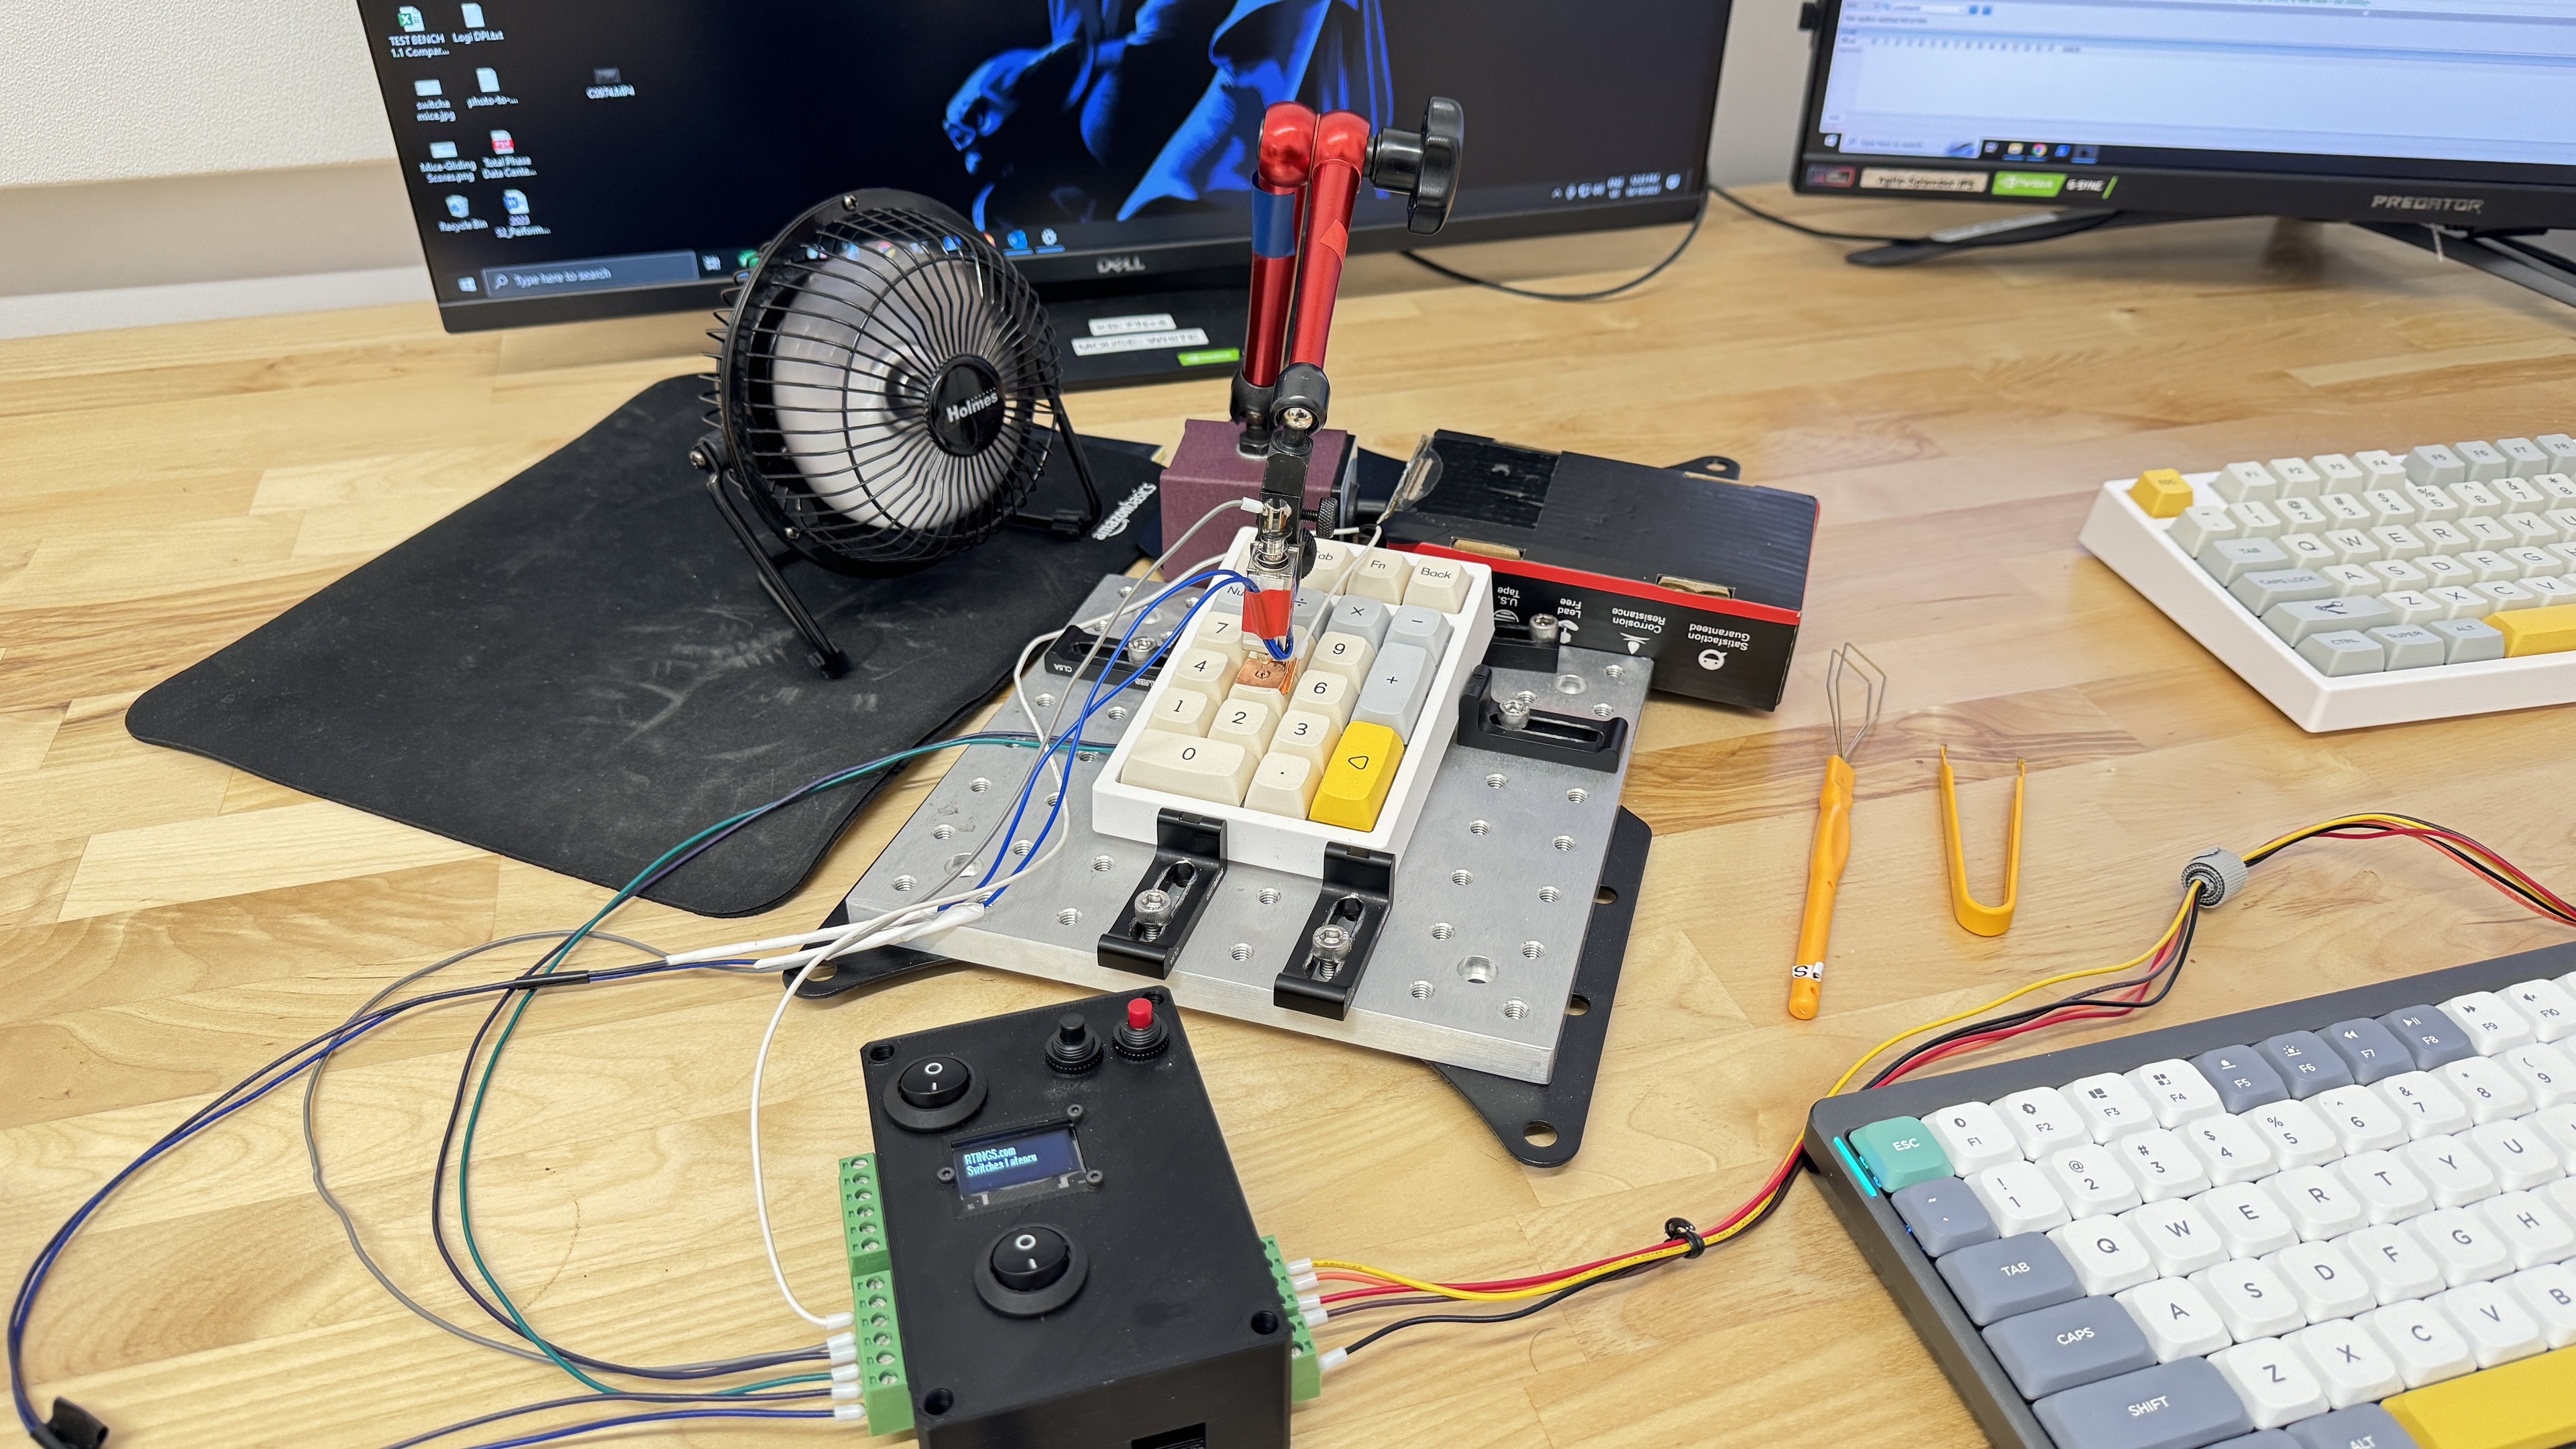
Keyboard switch latency setup.
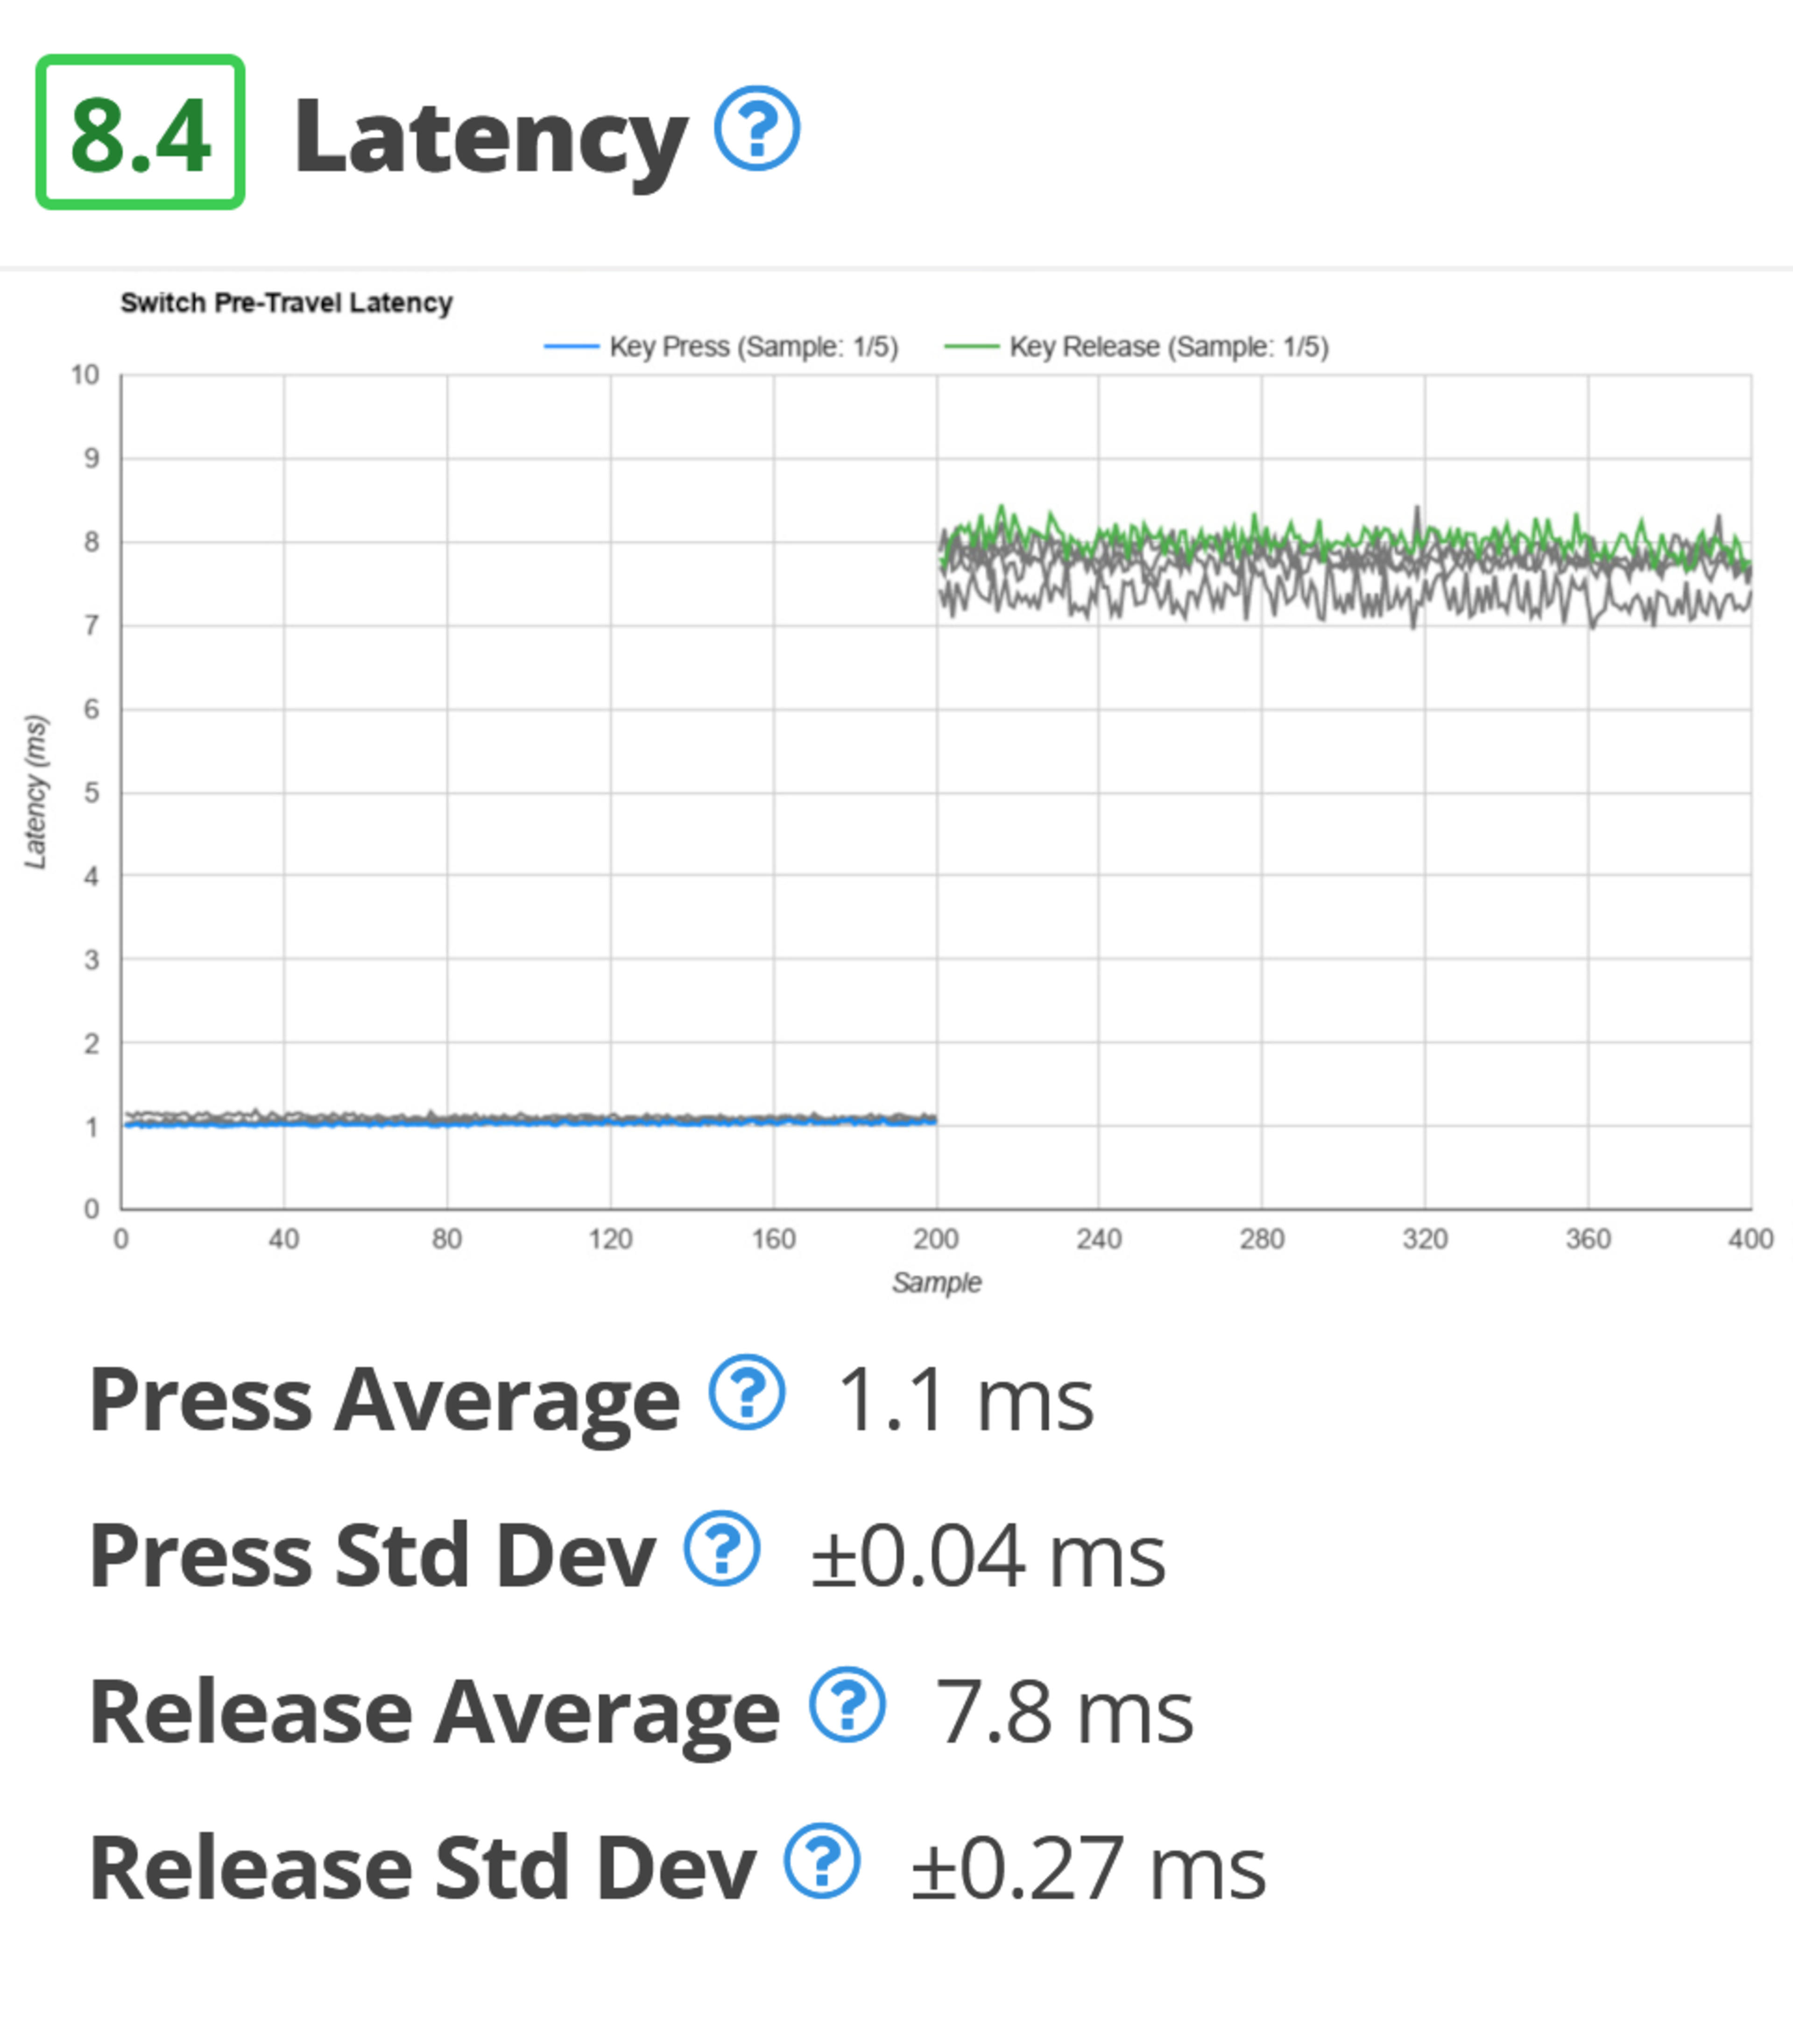
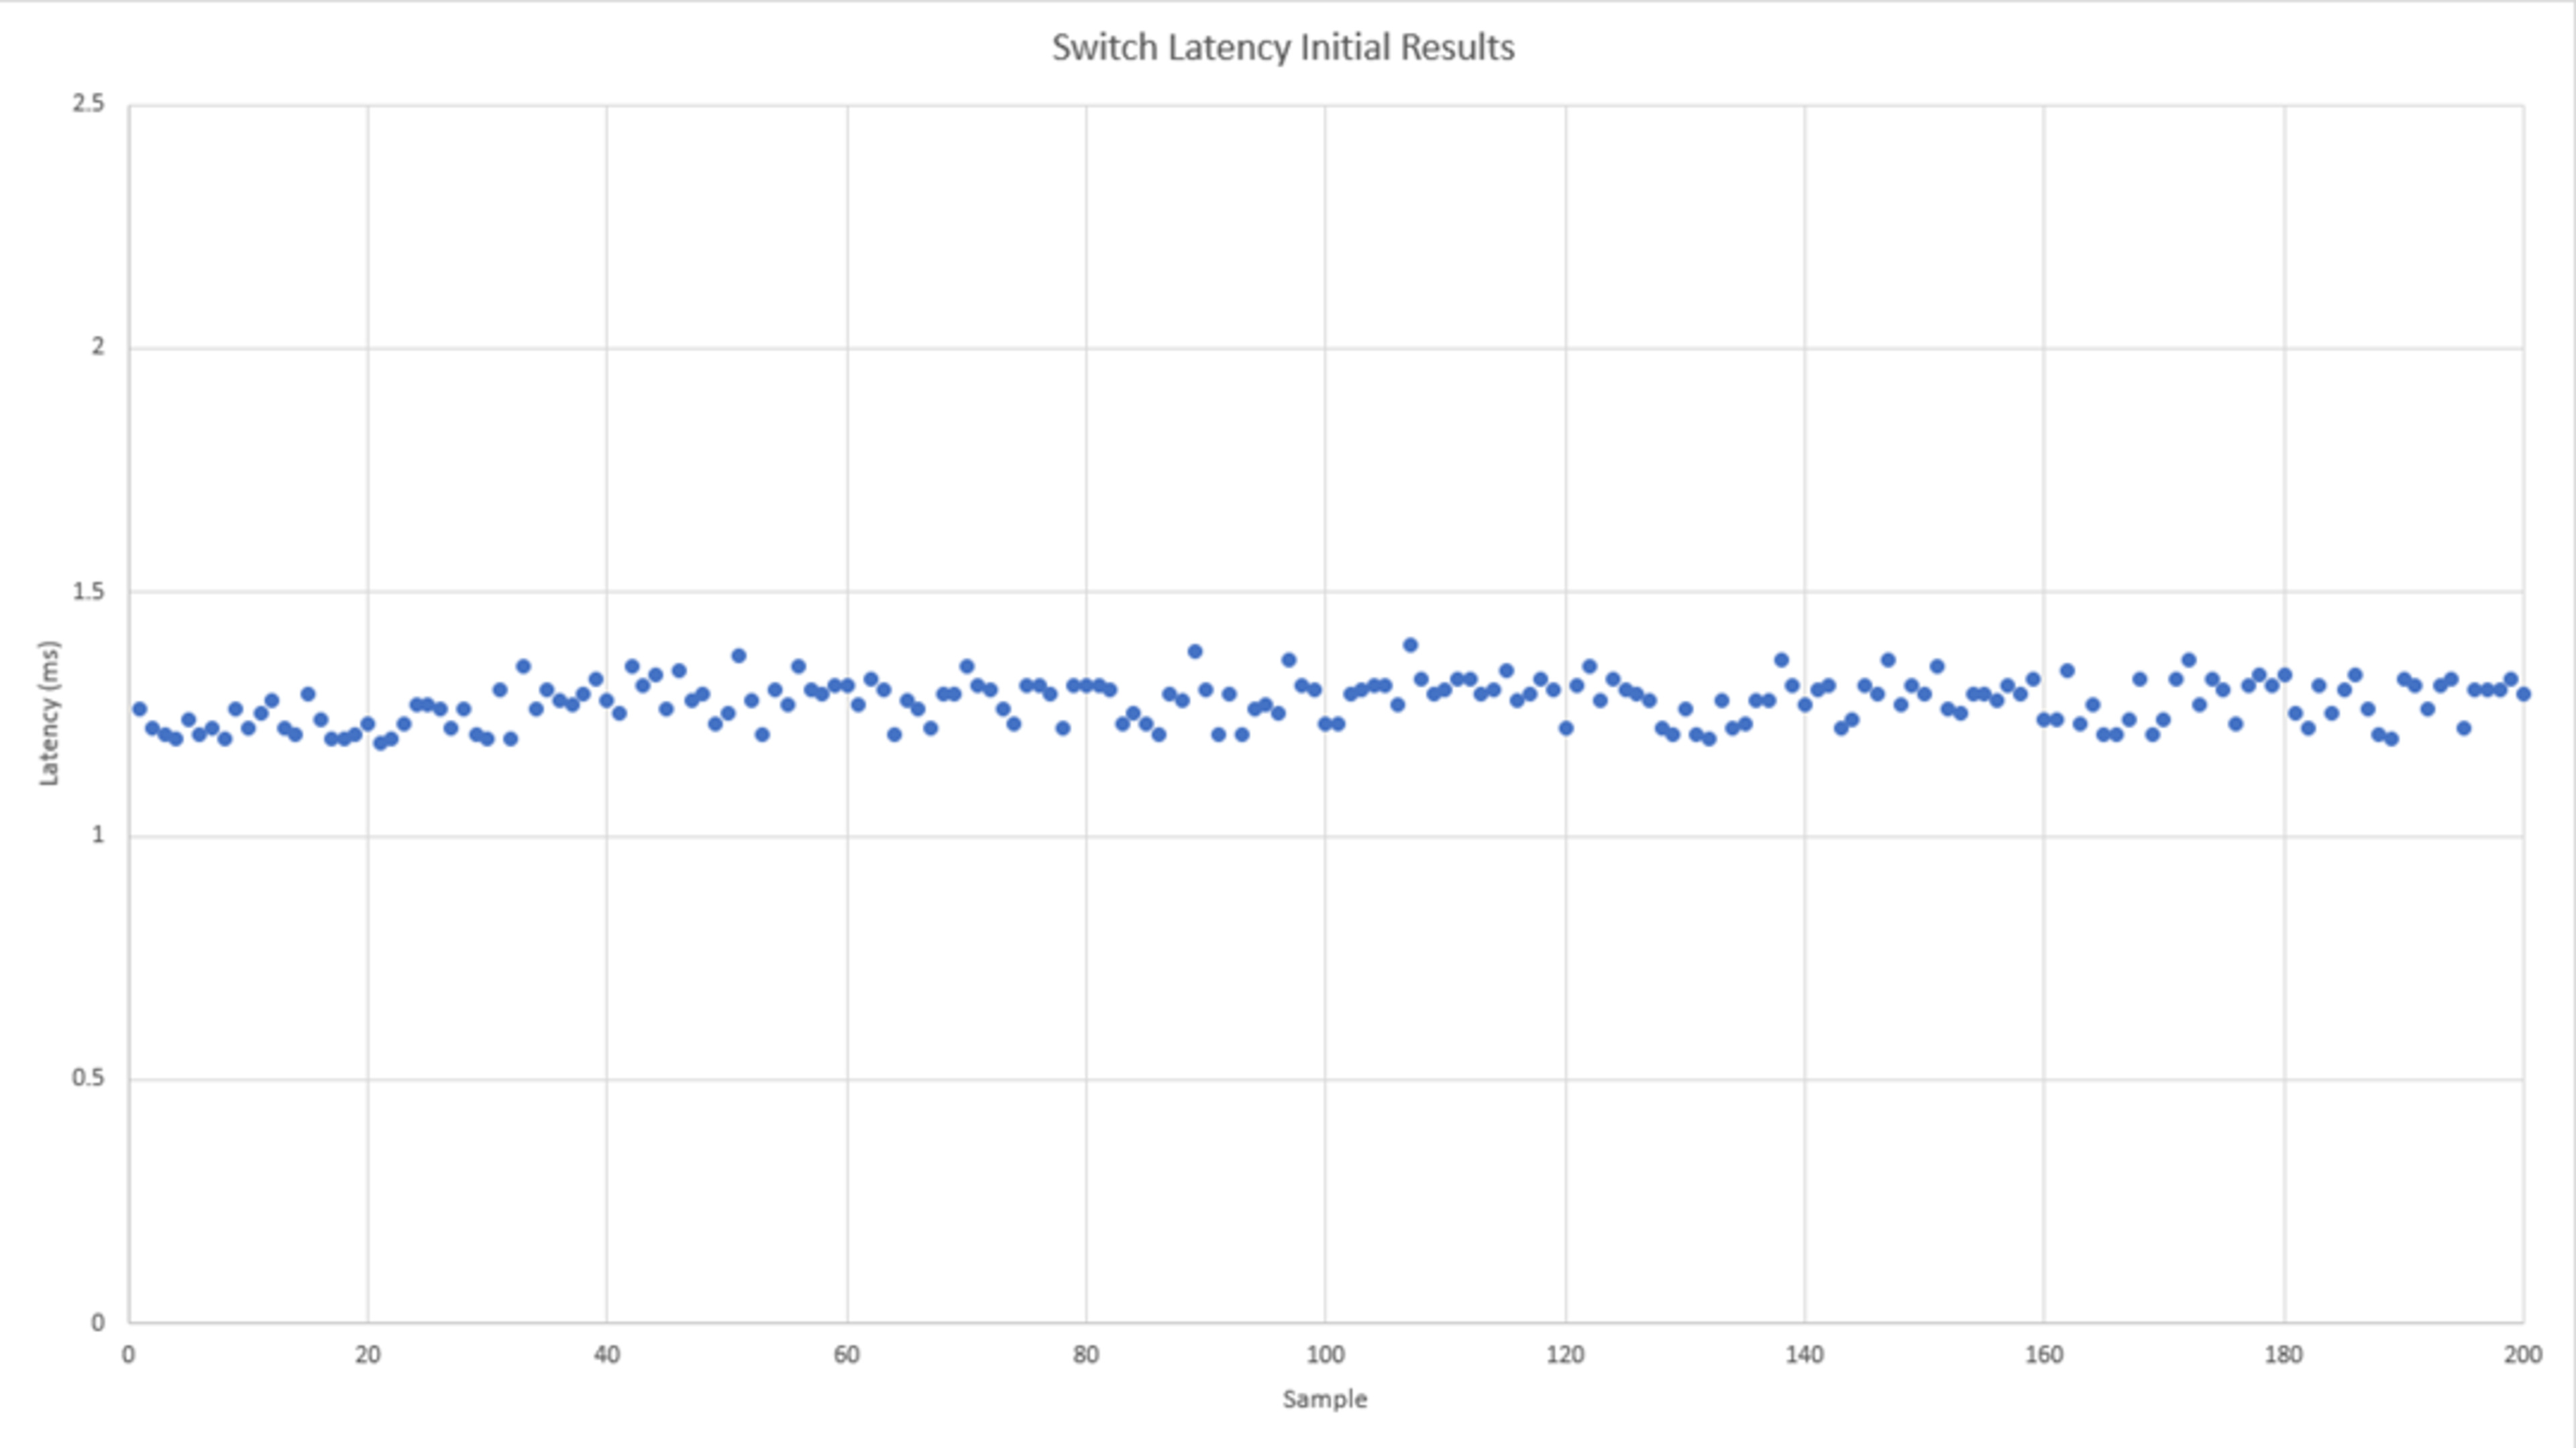
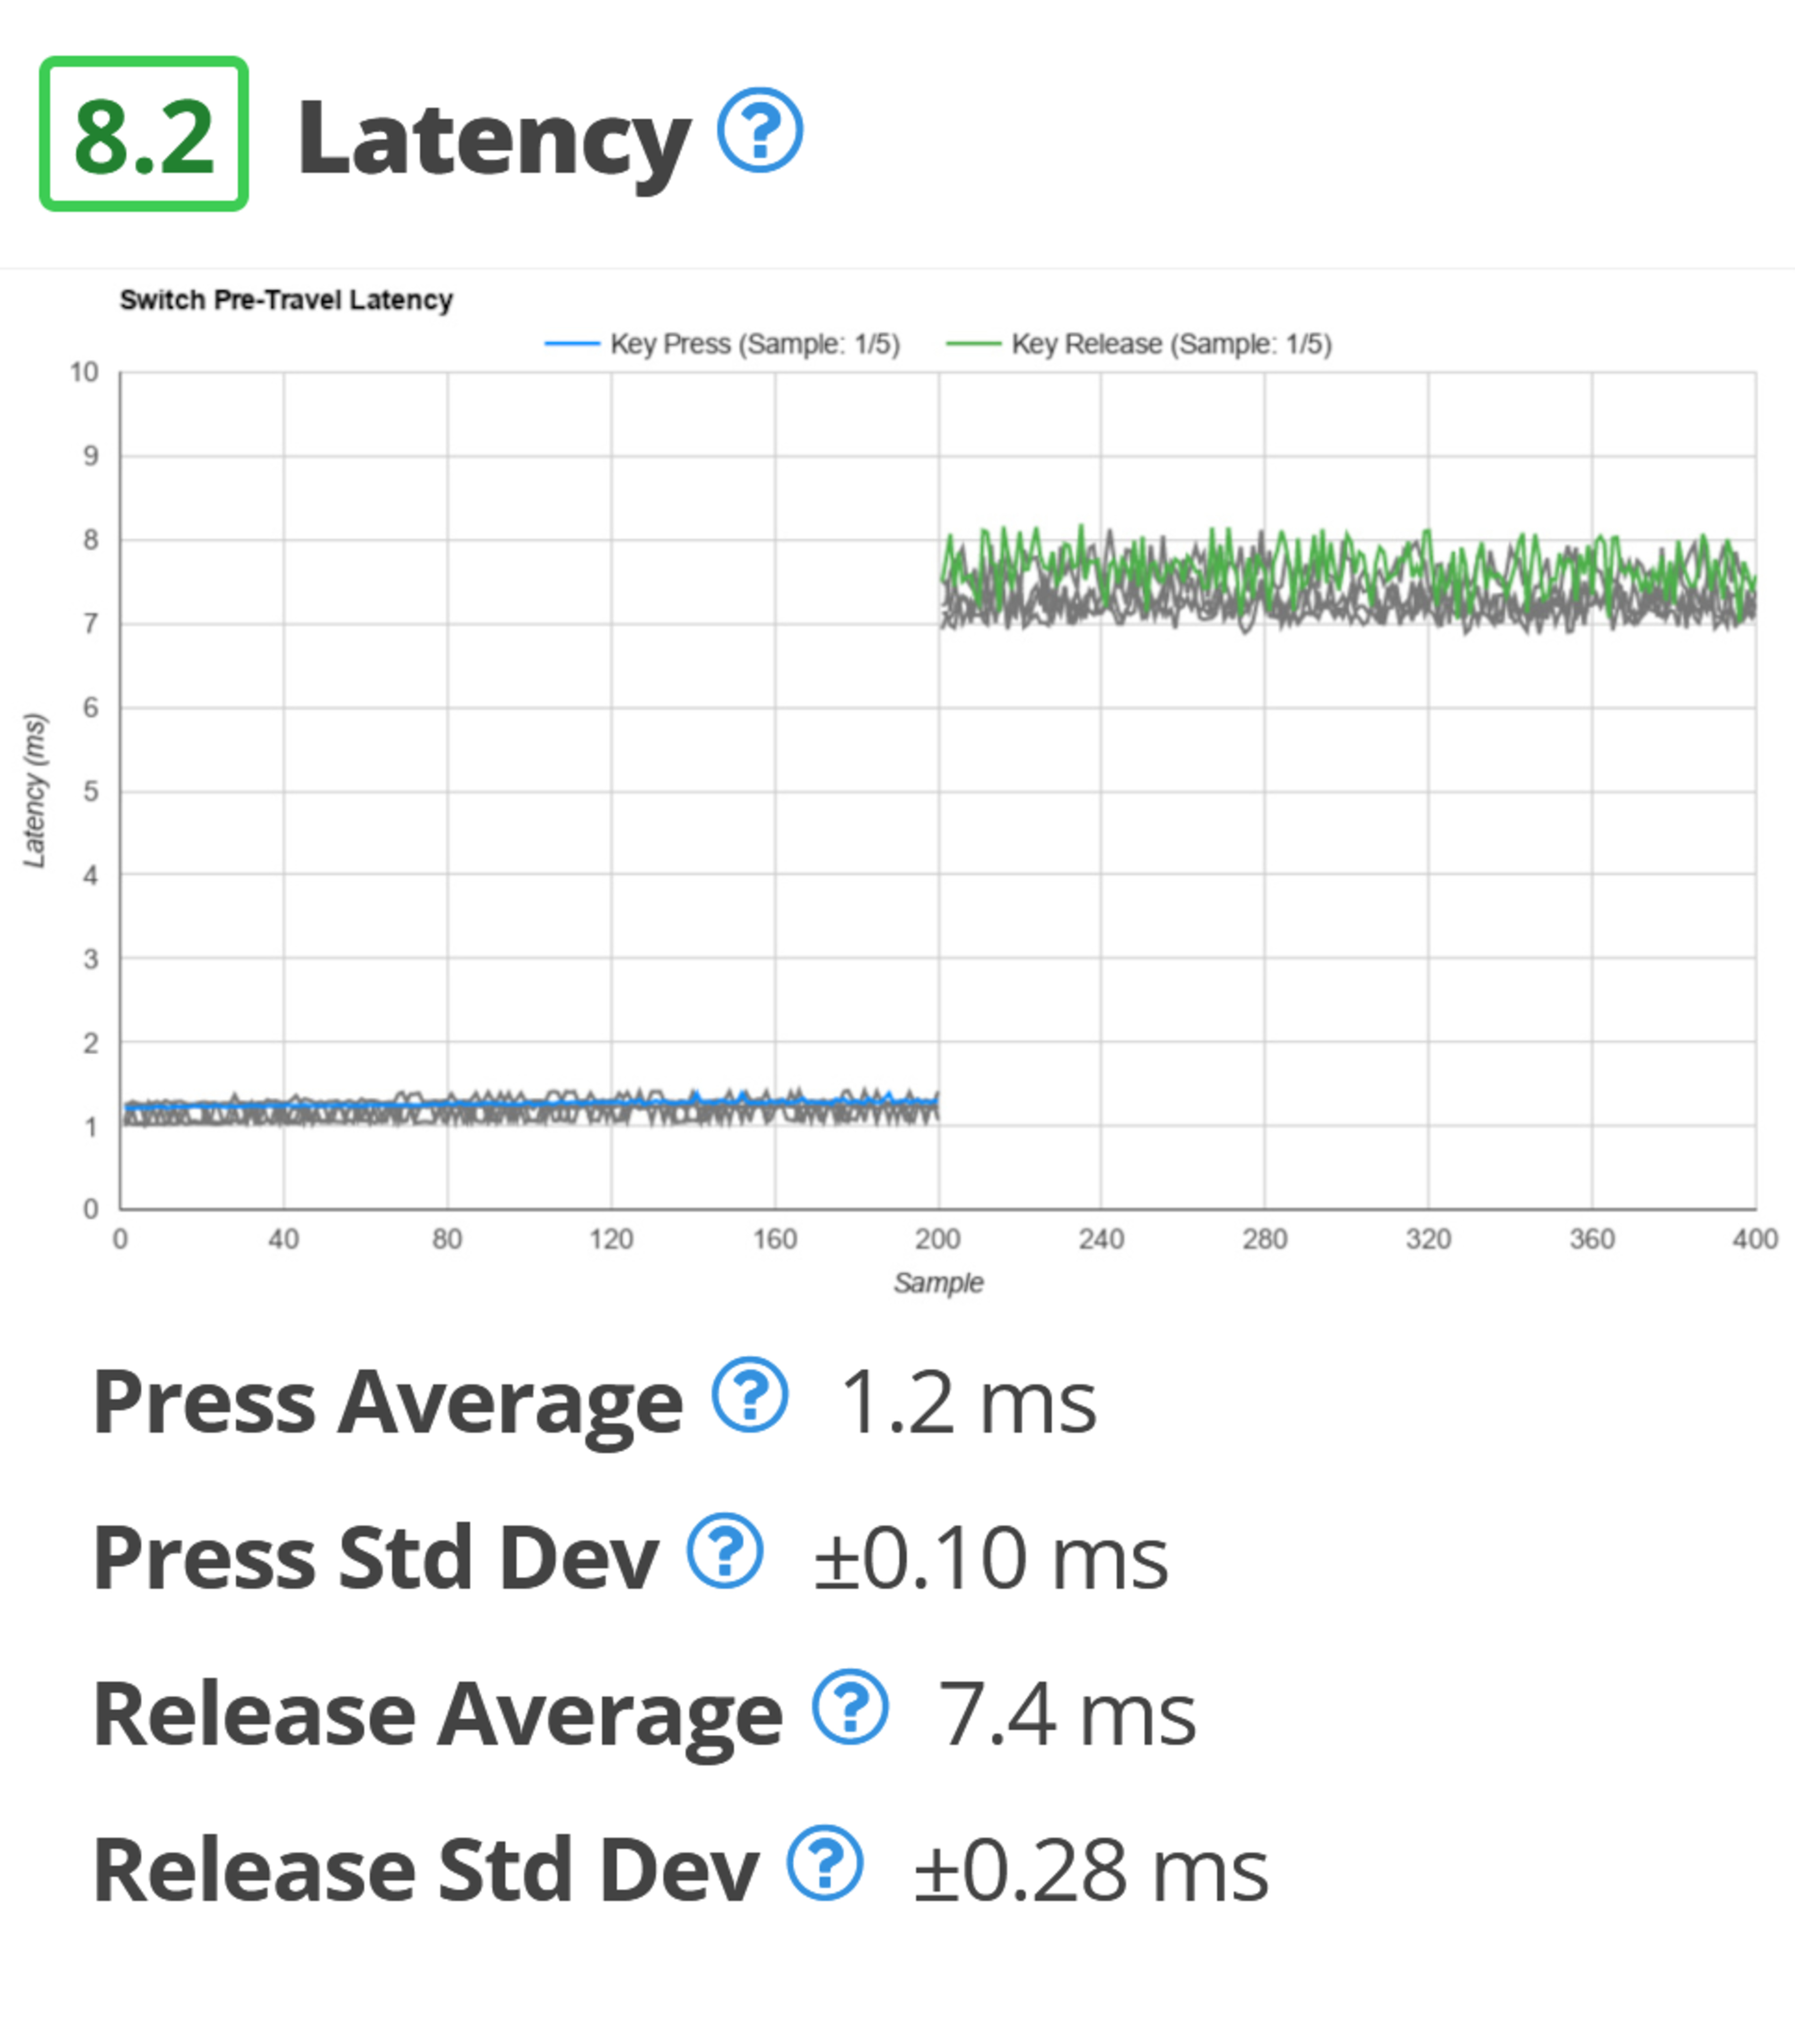
Latency results from the Kailh Pro Purple keyboard switch review.
The graph above shows 400 pre-travel latency samples for each switch tested (200 press and 200 release). It gives a good sense of the standard deviation.
Results
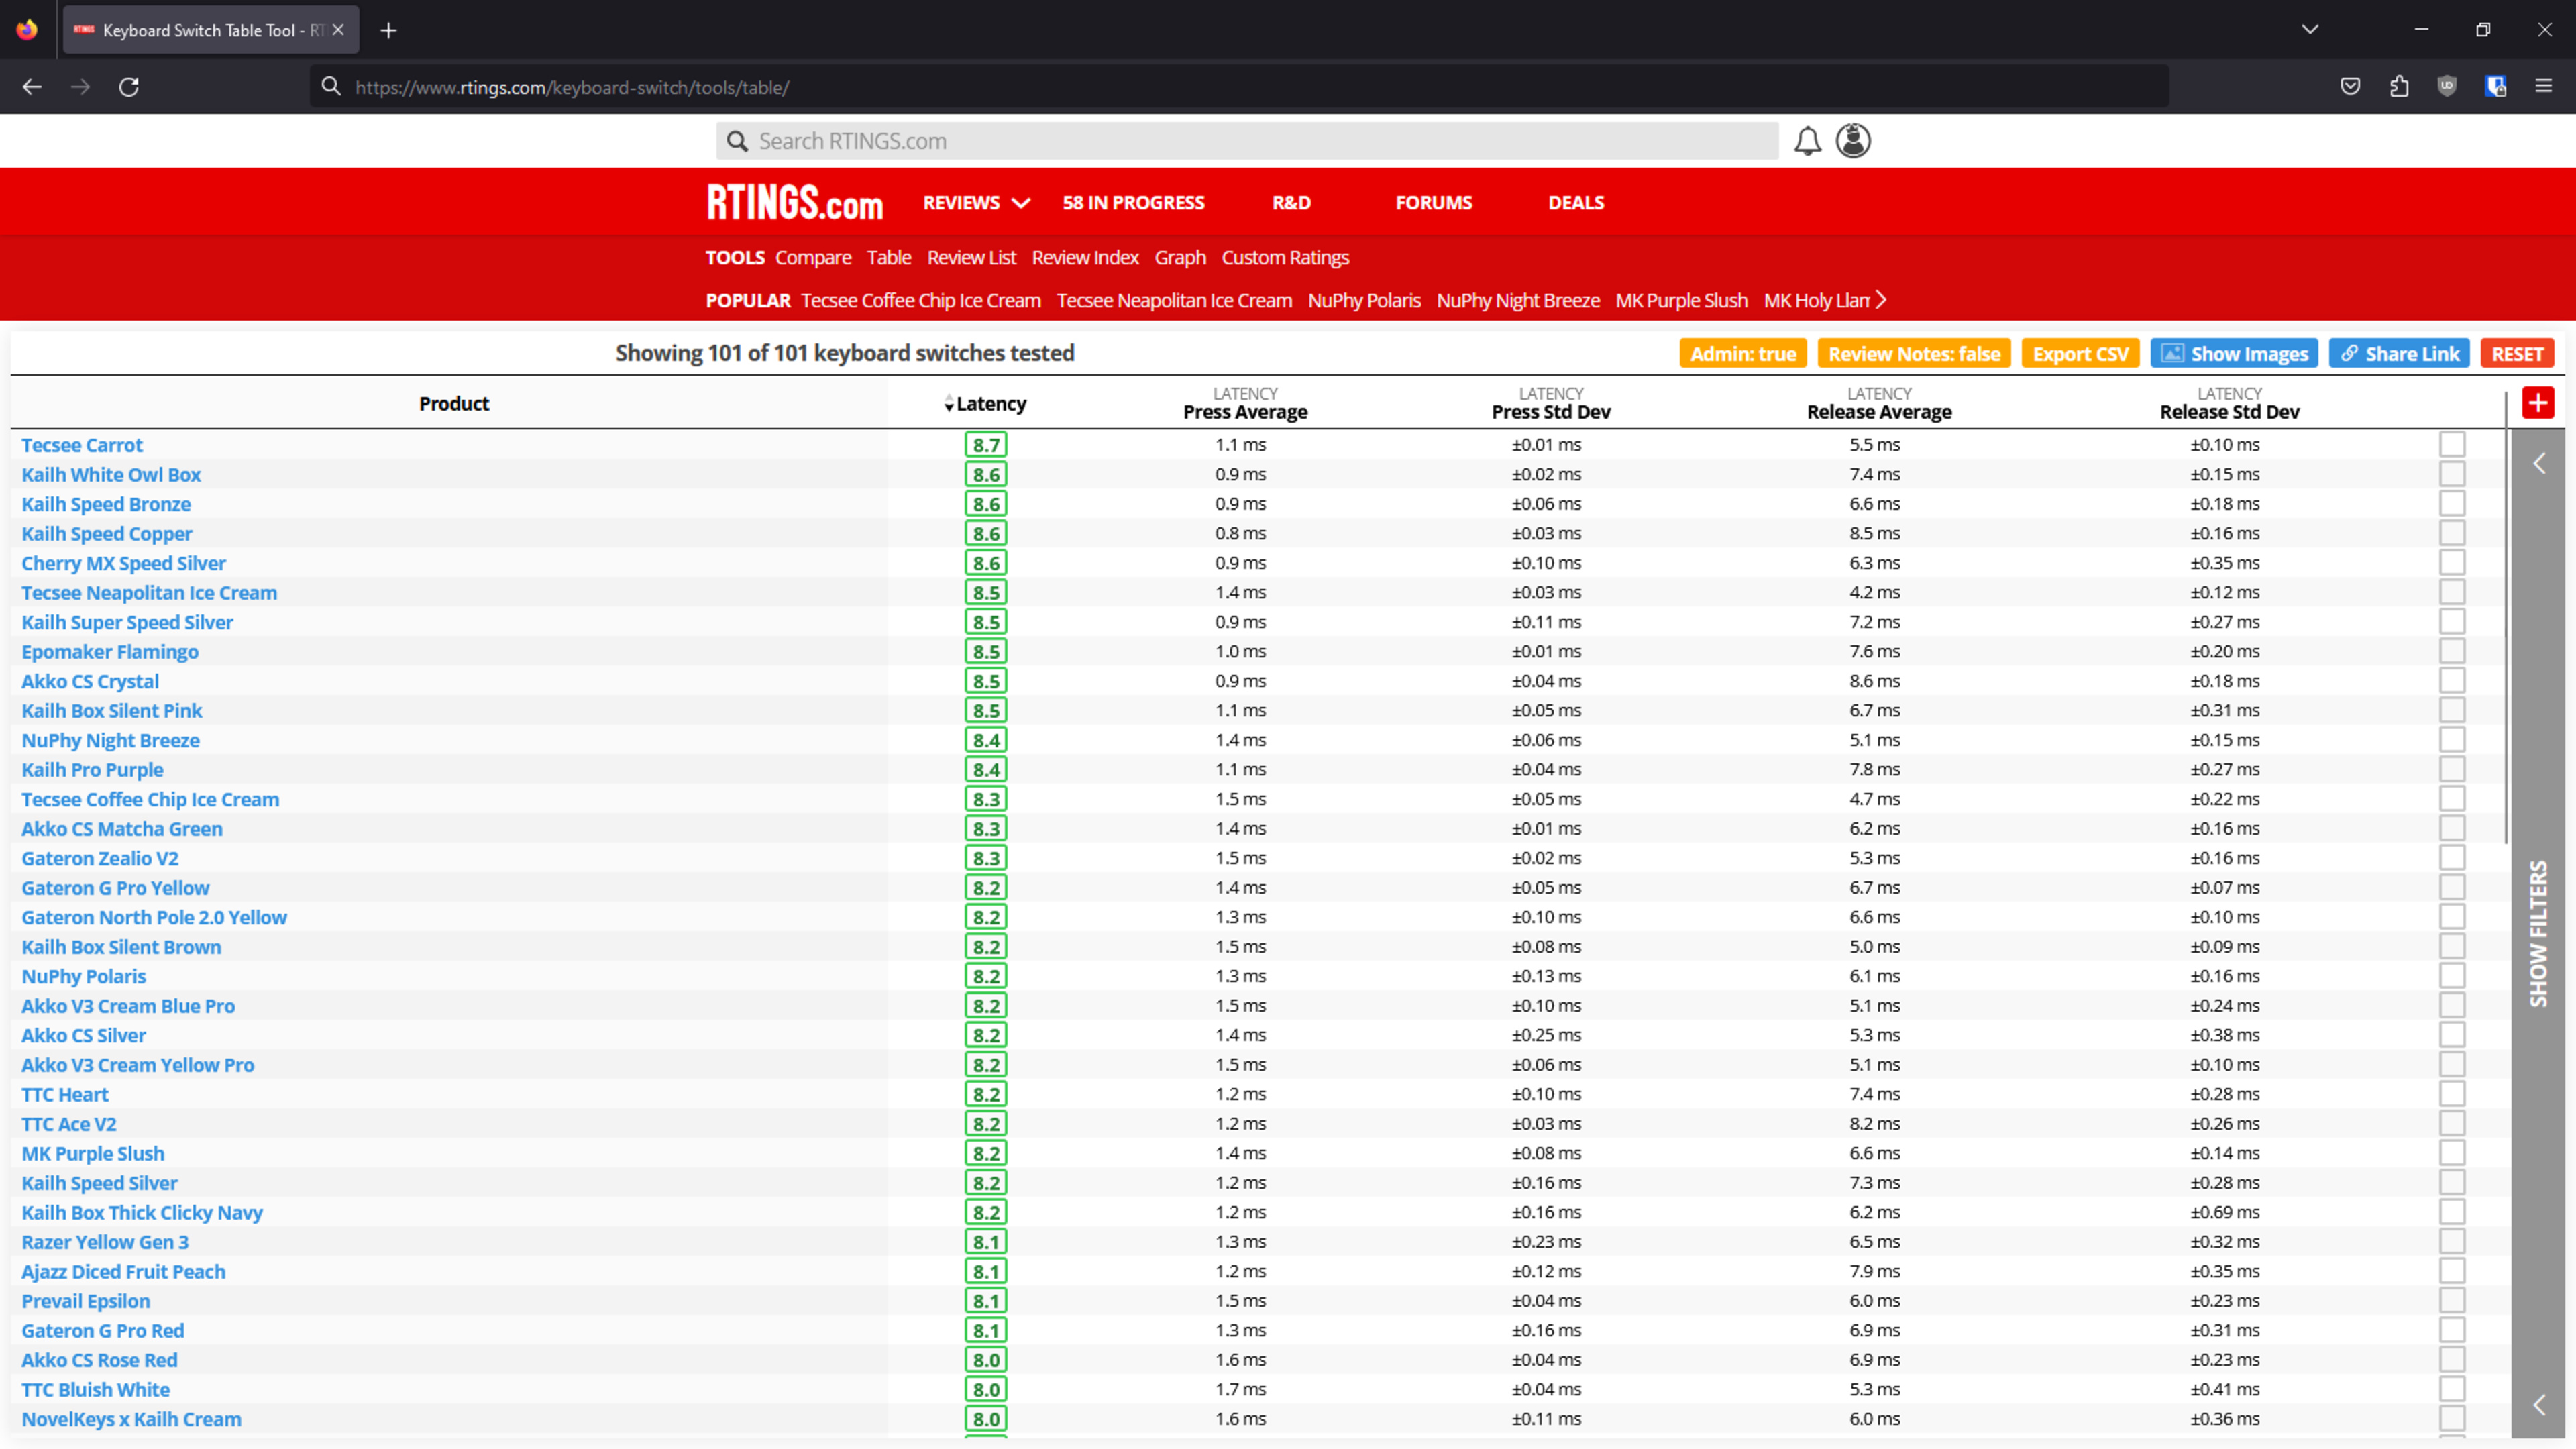
Latency results sorted by best score
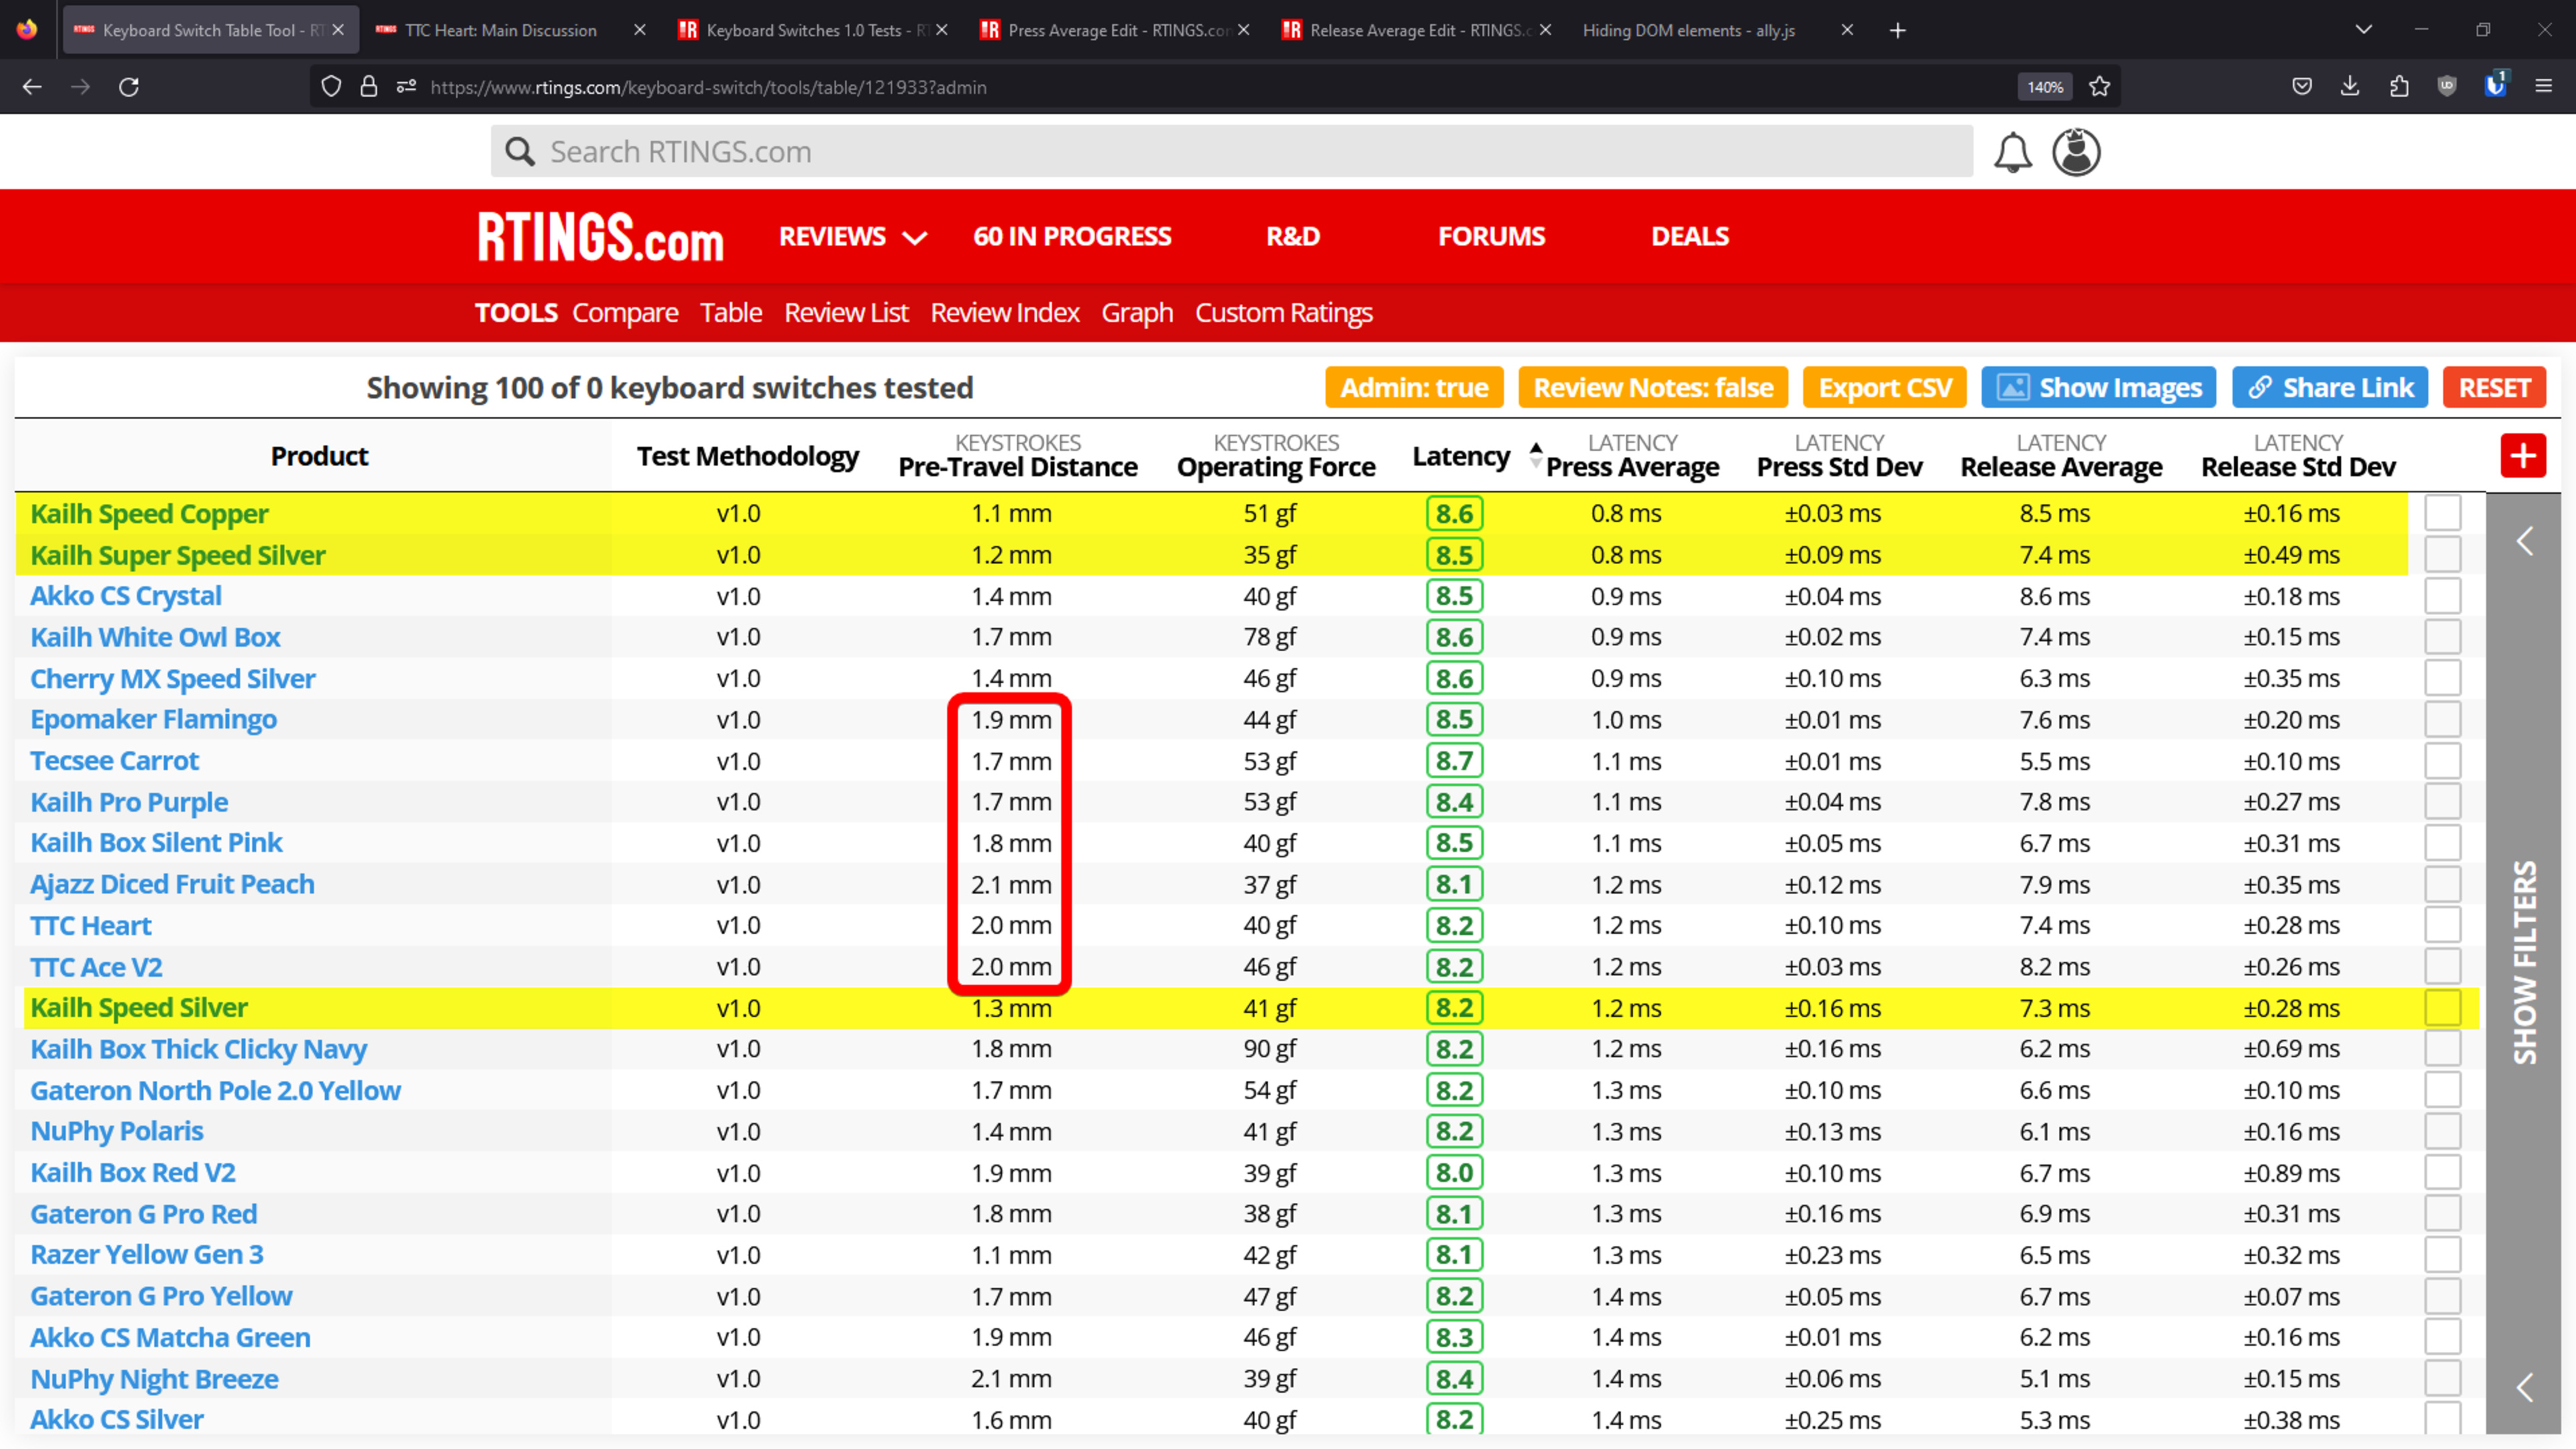
Latency results for various Speed switches
If we reflect on the proof of success we outlined earlier, we expected the speed switches to achieve the highest latency scores. Many Speed switches are at the top, but other switches also score highly. In most cases, these other switches also have very low pre-travel distance, just like the Speed switches, which is the most impactful attribute. Some of the faster switches that don't carry the Speed moniker are simply not advertised for gaming, but their geometry is still well-suited to it.
TTC Heart has low latency (consistently) but a somewhat high pre-travel distance.
Some switches with upwards of 2mm pre-travel distance are still fast. For example, TTC Heart switches are consistently fast. While it may appear strange, it does fit in the tolerance of ± 0.3ms we estimate based on the correlation between latency and pre-travel distance. The latency measurement itself is ±0.1 ms, but when compared to pre-travel distance, its tolerance should also be considered. We believe this is about ±0.25 mm.
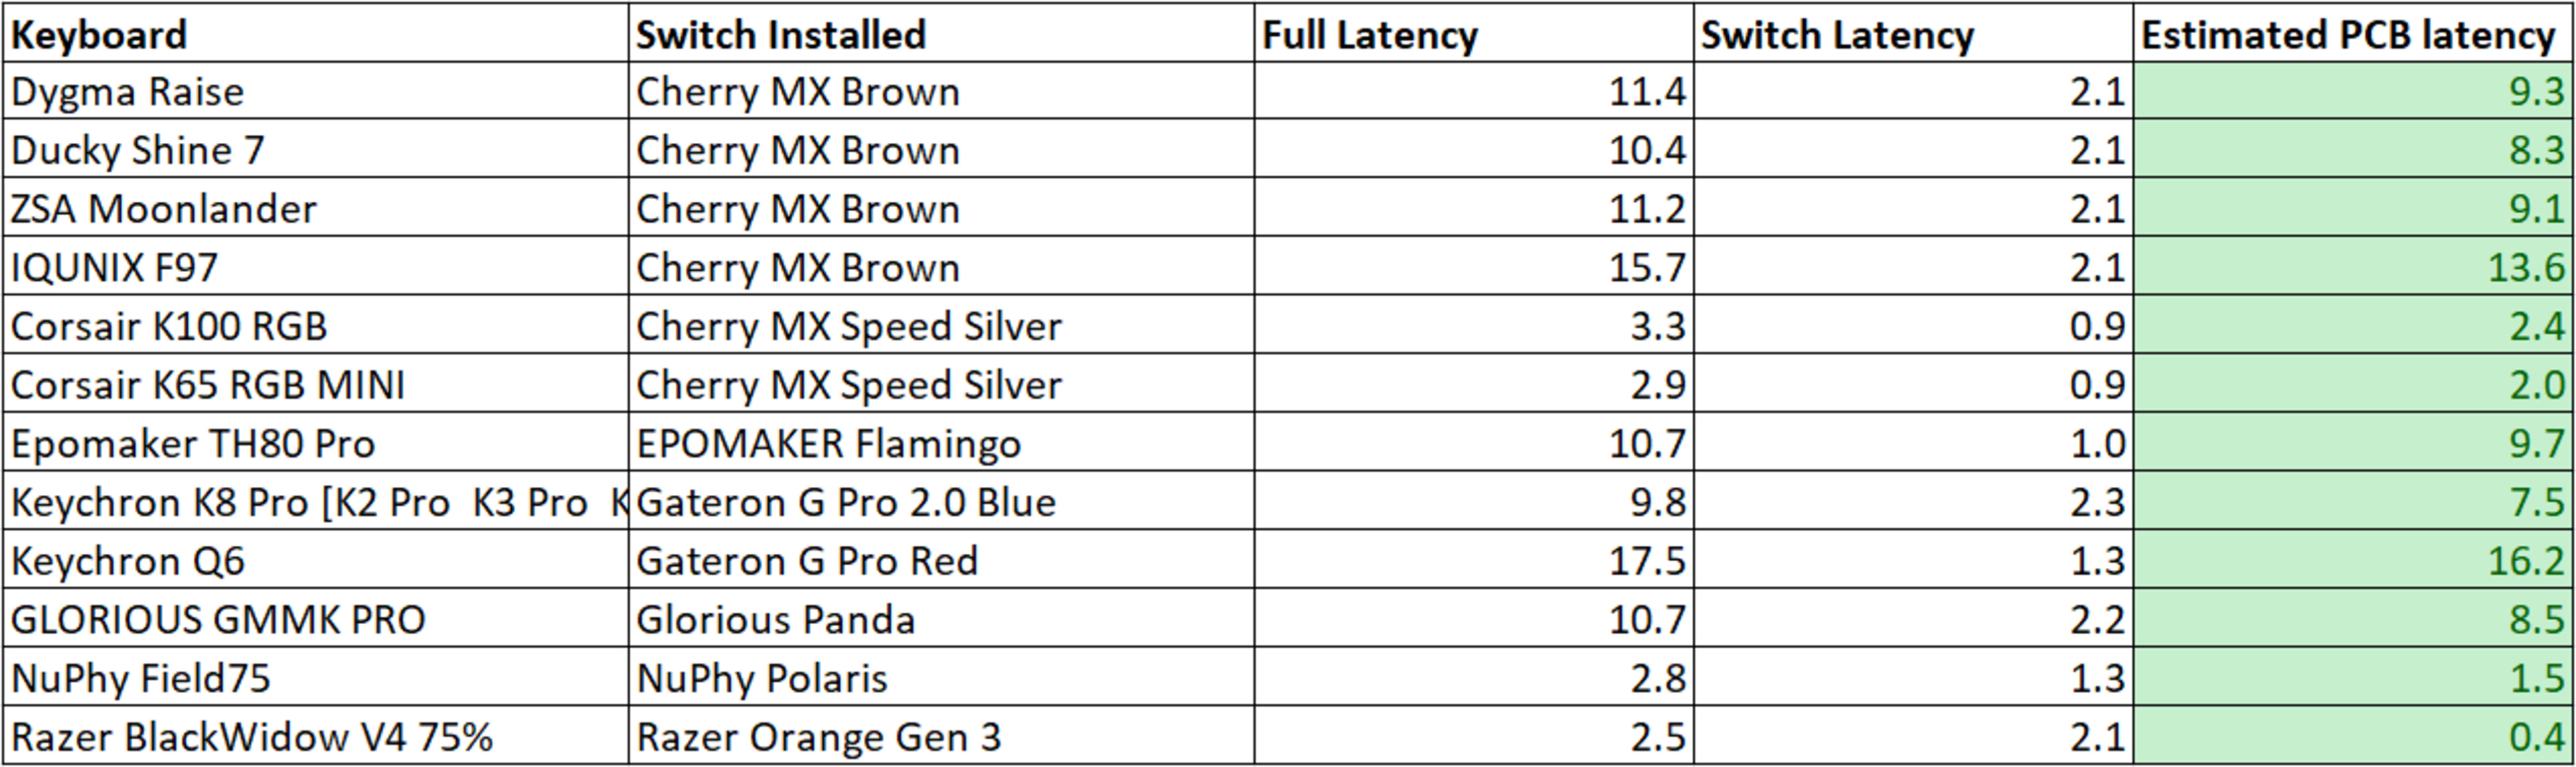 Estimated PCB latency of a few keyboards since we now know their switch latency.
As expected, no switch latency is high enough that it would lead us to estimate negative PCB latency.
Test variance & limitations
The setup shares issues with mice and keyboard click/press latency tests. The biggest factor is the solenoid speed:
- The solenoid's weak return spring significantly increases release latency results.
- Press latency is just a little faster than what a human finger can achieve.
Release latency is less reliable than press latency. The exact reason why is not known at this stage. It could be:
- The solenoid's weak return spring.
- Thin switch contacts of the switch that cause variations in the speed at which it returns to its open position.
We tested two of our solenoids and determined they aren't equivalent regarding latency results. This is important to know but shouldn't impact our results. All the official testing was with the same set of solenoids and electronics, so every switch was tested with the same hardware.
We had a few switches that would often fail our test. We noticed the PCB circuit wouldn't always close. In these cases, it was always an issue with the switch, not our testing setup. Some switches were a little smaller and would be loose in the socket. In those cases, either taking another switch or bending the contacts away from each other ensured a stable connection to the hot swap sockets.
There's an additional possibility that the modified Epomaker TH-21 Keypad we used as part of our latency test setup has loosened after testing 101 switches and five samples, all in the same socket. The cumulation of over 1000 insertions and removals takes its toll on the plastic construction, but we have spare keypads of the exact same model for future tests should this become an issue.
The average standard deviation latency of 101 switches is around ± 0.1ms. Human impact on the result is low, so we consider two press values different when the difference between them is greater than 0.2 ms.
Latency Conclusion
Looking at the results of over 100 switches, we can conclude that our test is functional but is otherwise not as stable and precise as we'd hoped. This doesn't invalidate our data, but we must be careful when comparing switches with similar latency results, as their order could be a little off.
Pros:
- Standard deviation results help to identify possible issues in testing
- Low press latency variance
- Instrumentation can accurately measure down to 0.01ms
Cons:
- High release latency variance
- The precision of the result is very sensitive to the solenoid position
- Some switches become loose over time
This switch latency test improves upon our keyboard latency test since we now evaluate multiple switches. Because of this, the latency results are less sensitive to switch-to-switch variance.
Overall, our finding that latency is roughly aligned with pre-travel distance is a positive outcome. The fact that they're not fully linked justifies that a dedicated test for latency was required.
All of the above helps us better understand what we need to control in our setup to produce more consistent and comparable data. This information will also help improve keyboard and mouse latency testing in future test bench updates.
Problem Definition
In our current keyboard reviews, some test results are from the first sample only, while other results are the average of all keys tested. This design choice was due to limitations with our old graph tool, making this the only way to have the graph values and test results match each other. For consistency, we now intend to present all results as the average of all switches tested. We've also updated our graph tool, which now lets us show all samples tested.
Investigation: Graph Raw Data
The other issue we're addressing is with the "raw data" in our graphs. For technical reasons, our current keyboard graph isn't displaying the absolute raw data. To be fully transparent, we admit the keyboard switch keystroke graphs will be closer but still won't be pure raw data. We'll explore this concept more in the following investigation sections.
Our force testing machine moves quite slowly to capture the small differences in force over the switch travel, and the machine only exports data to the nearest 0.0025 mm. This means there can be many data points with different force values for the same distance. These data points are sequential since they have increasing time stamps.
Example of the raw data output from the keystroke machine.
It doesn't affect the results that we put in the review since those are extracted from the raw data, but it does mean we have to take a different approach for the graph displayed. Currently, in keyboard reviews, we average all the data points that share the same displacement value. This has the adverse effect of smoothing the data and hiding some of the jitter.
Cherry MX Brown actuation graph as part of the keystroke test from the IQUNIX F97 keyboard review.
We recently developed another approach for mice test bench 1.5, and this is the approach we'll take for keyboard switches as well.
This method takes all the raw data and recalculates its displacement value by calculating the machine speed between two different displacement values and then interpolating all the data points in between. This allows us to show all the data jitter, which can help illustrate switch smoothness. The drawback is that we altered the data.
However, we believe it's done in a way that is very close to what the machine would have recorded if the position resolution was high enough when exporting the data.
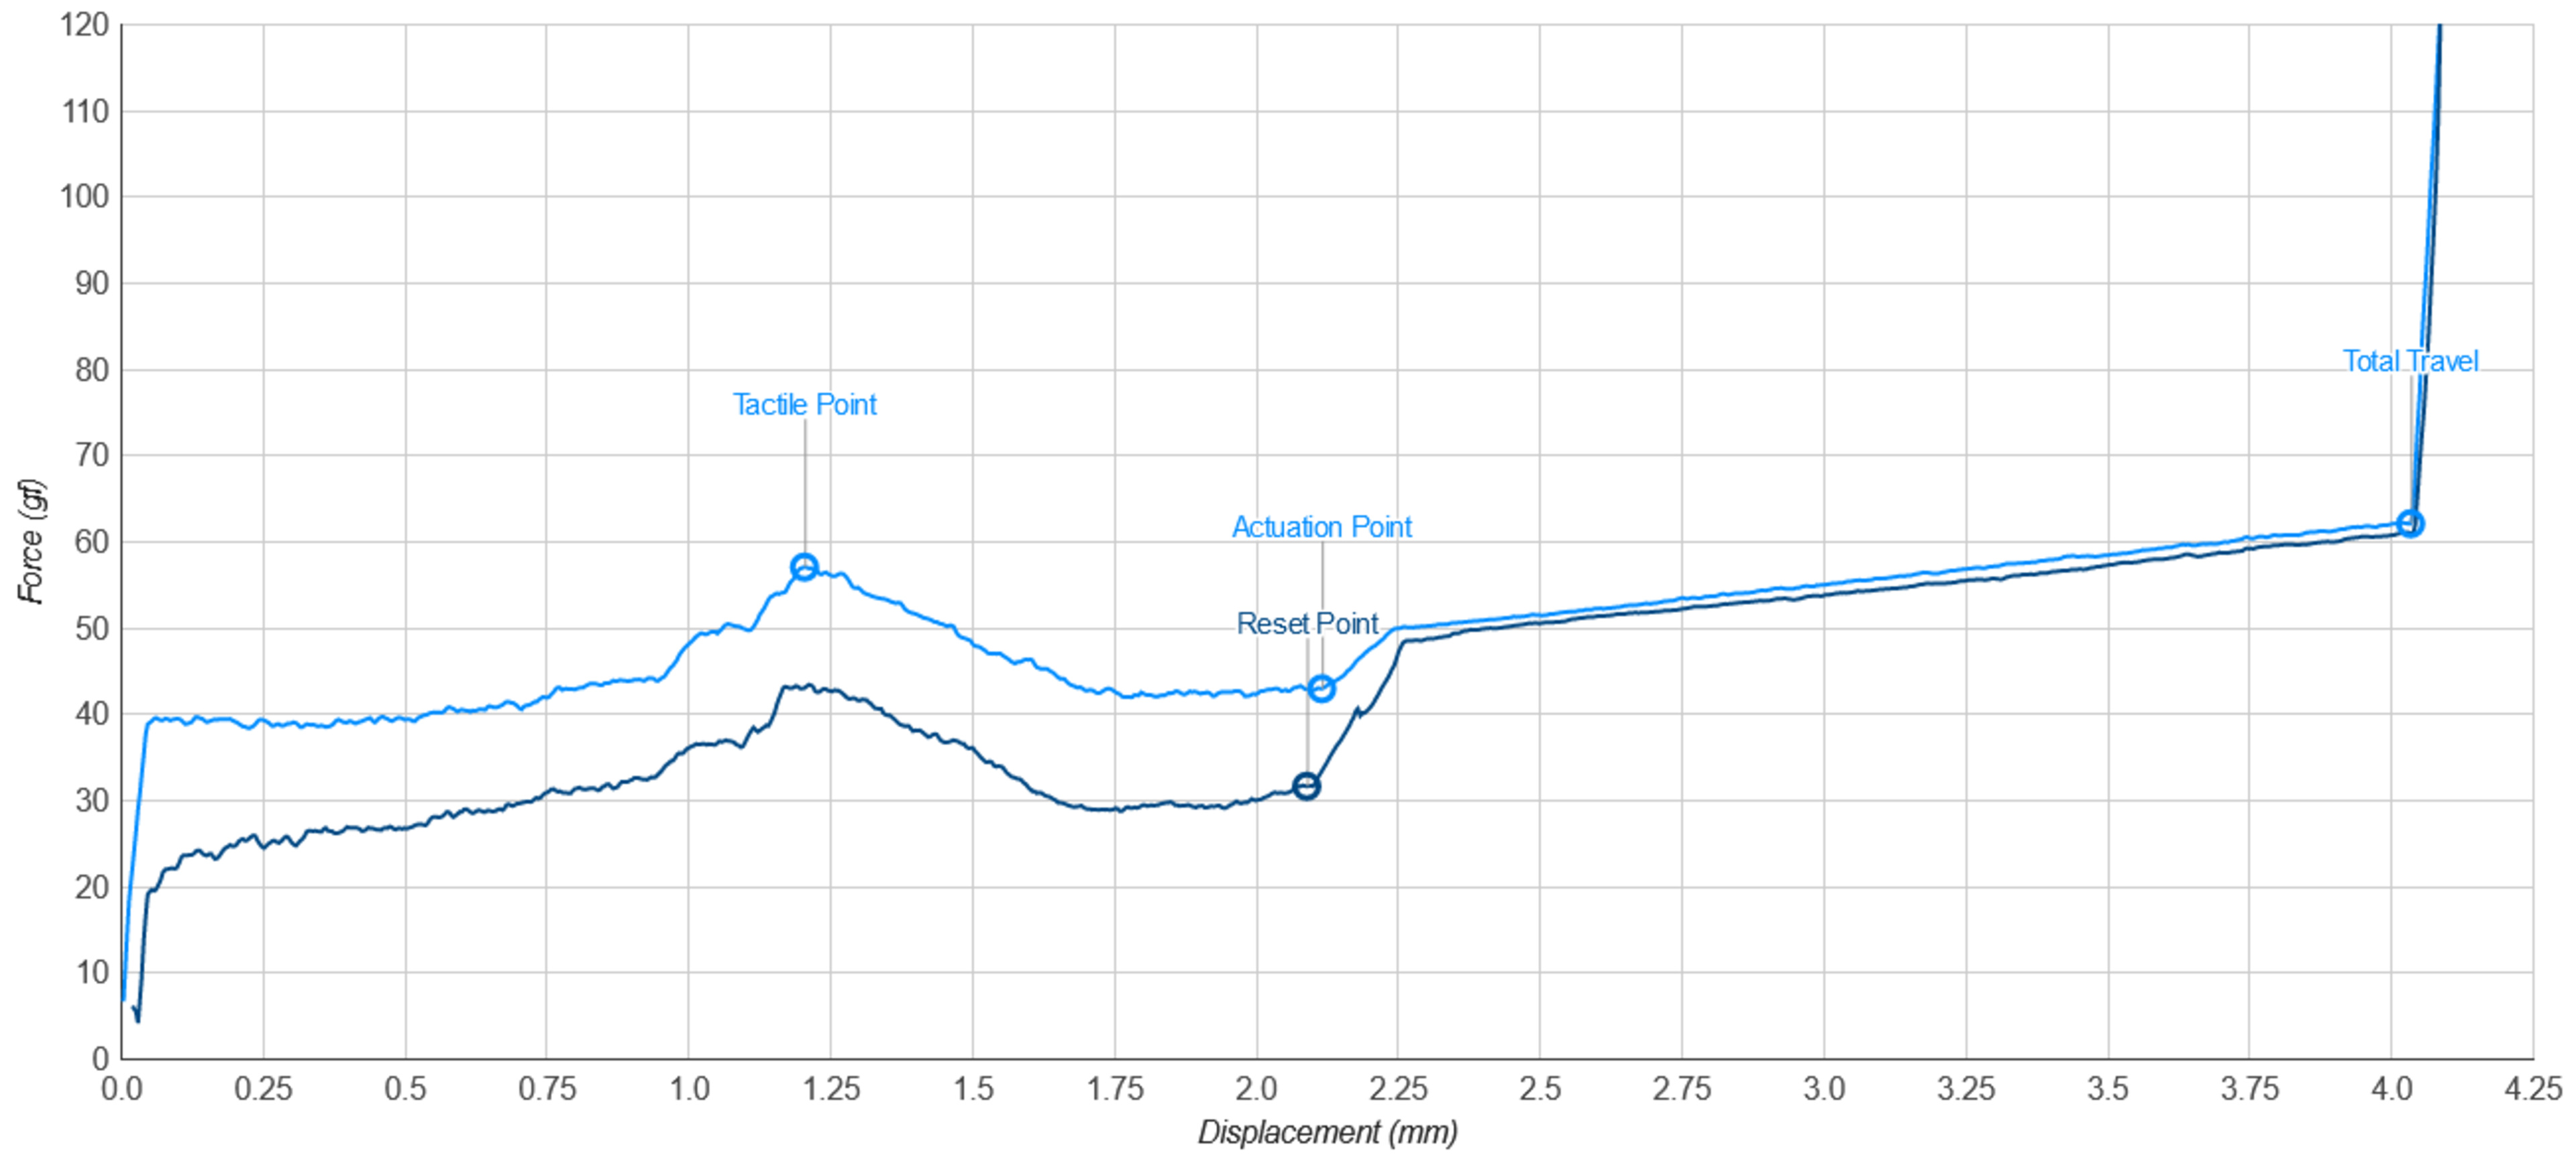
Cherry MX Brown actuation graph as part of the keystroke test from the Cherry MX Brown keyboard switch review.
Investigation: Switch to Switch Consistency
We measured five switches, and it's obvious from the individual graphs that there is variance in the results. This may not all be attributed to the switches themselves.
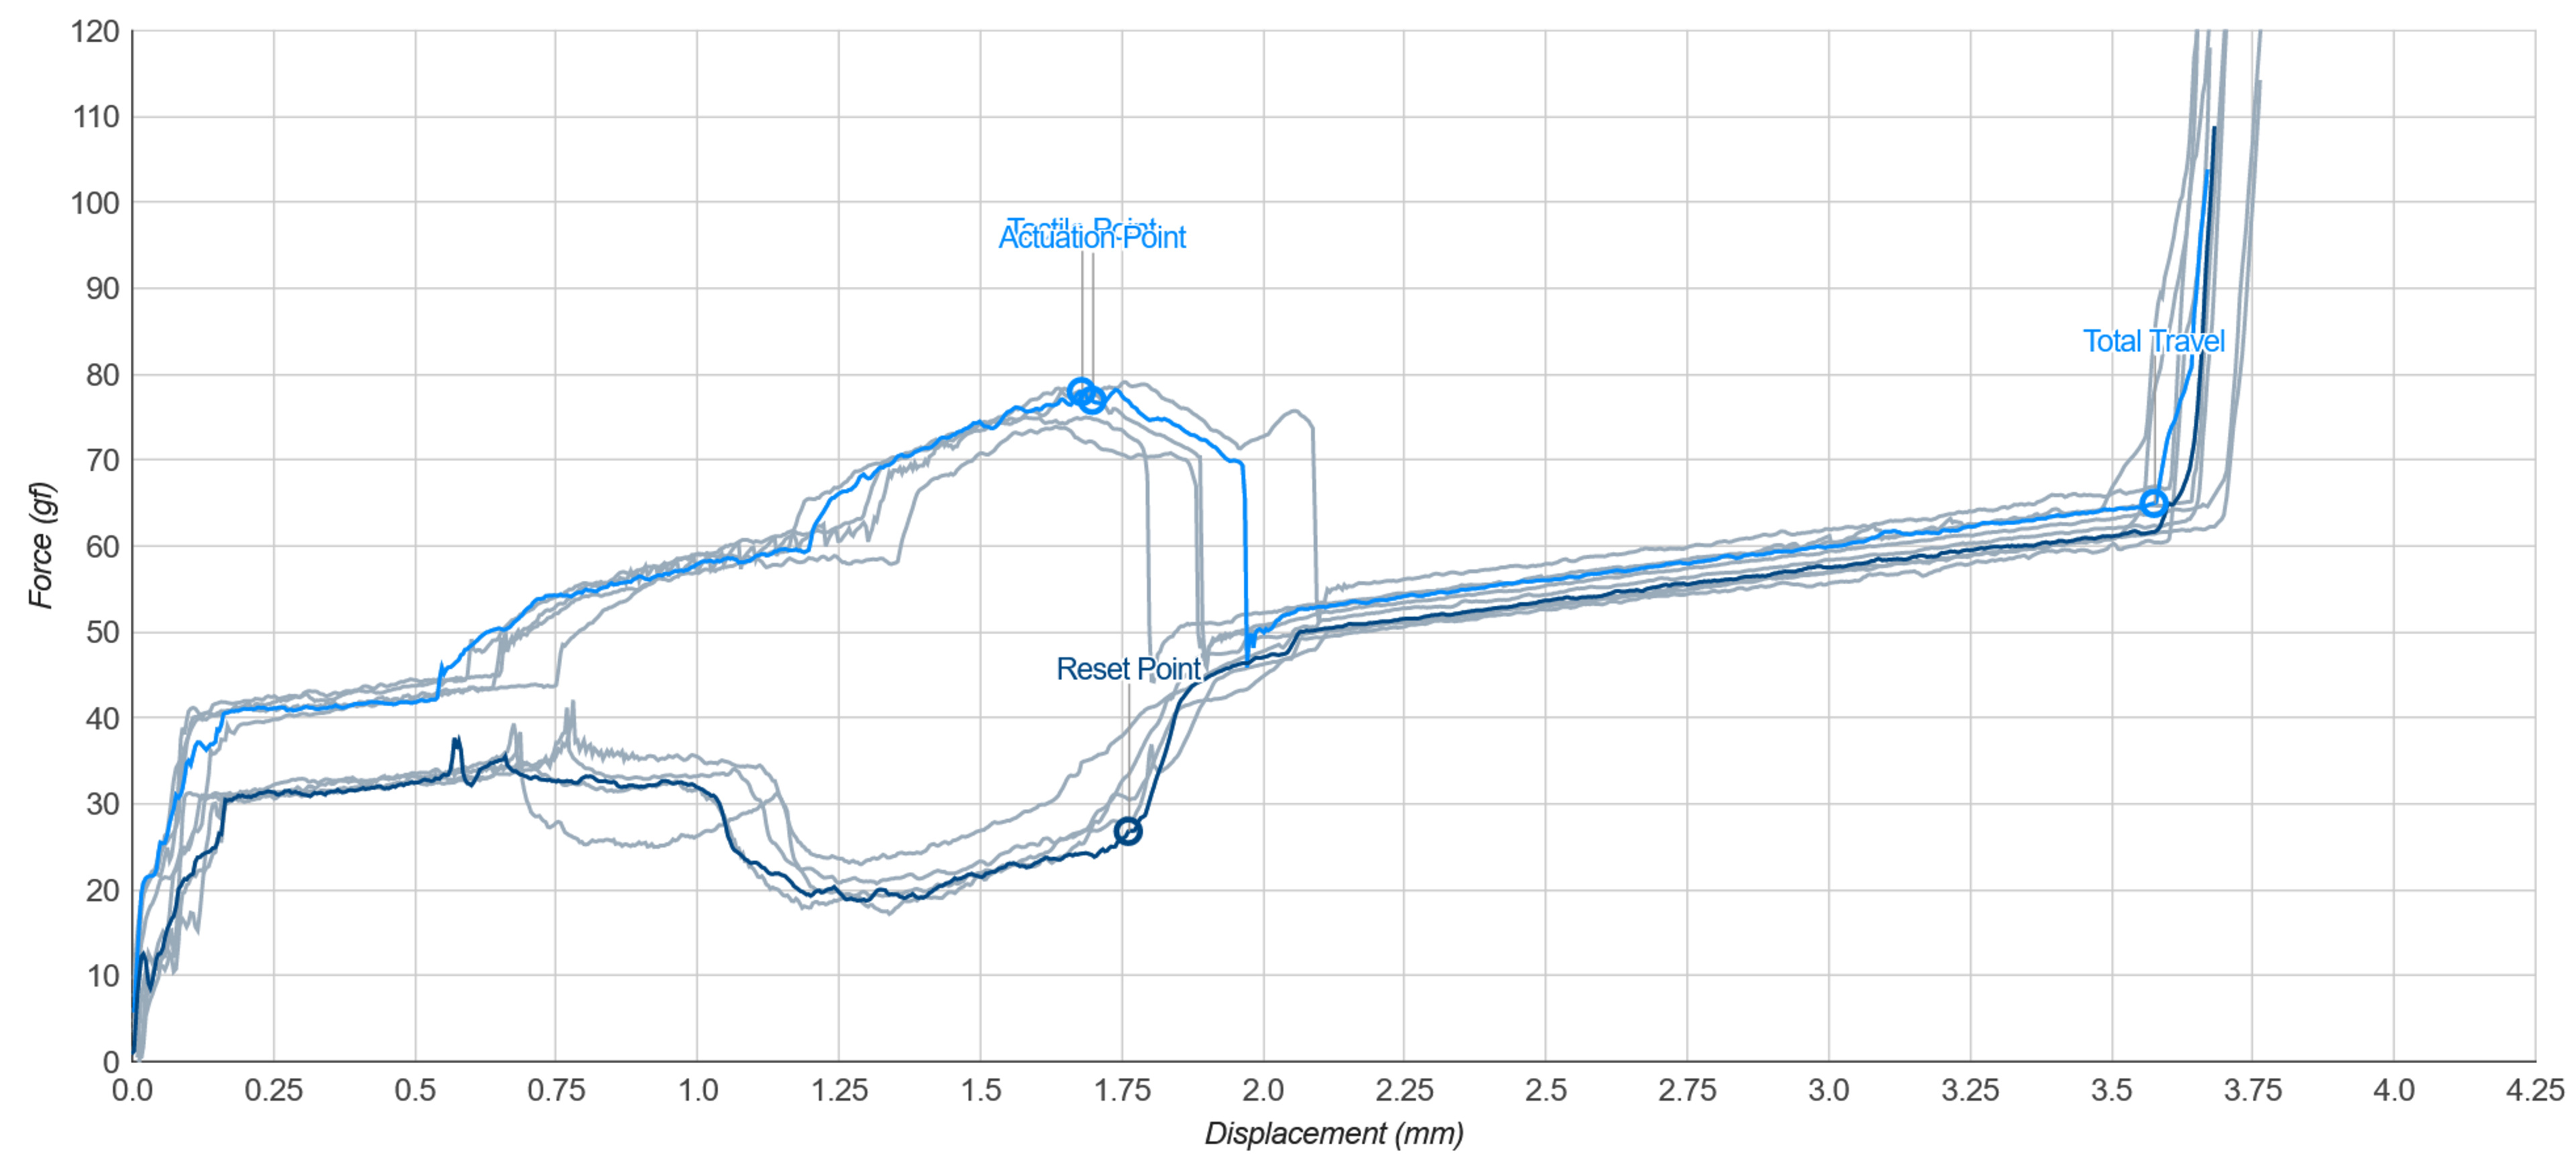
Kailh Box Jade with widely varying samples.
We checked the consistency of the setup itself. We tested the same switch five times and did this in three ways. The switch used for this test is the Gateron G Pro 3.0 Red.
For the first test, we kept everything the same way, not touching anything between samples. This gives us a baseline reference of instrument noise or single switch inconsistency.
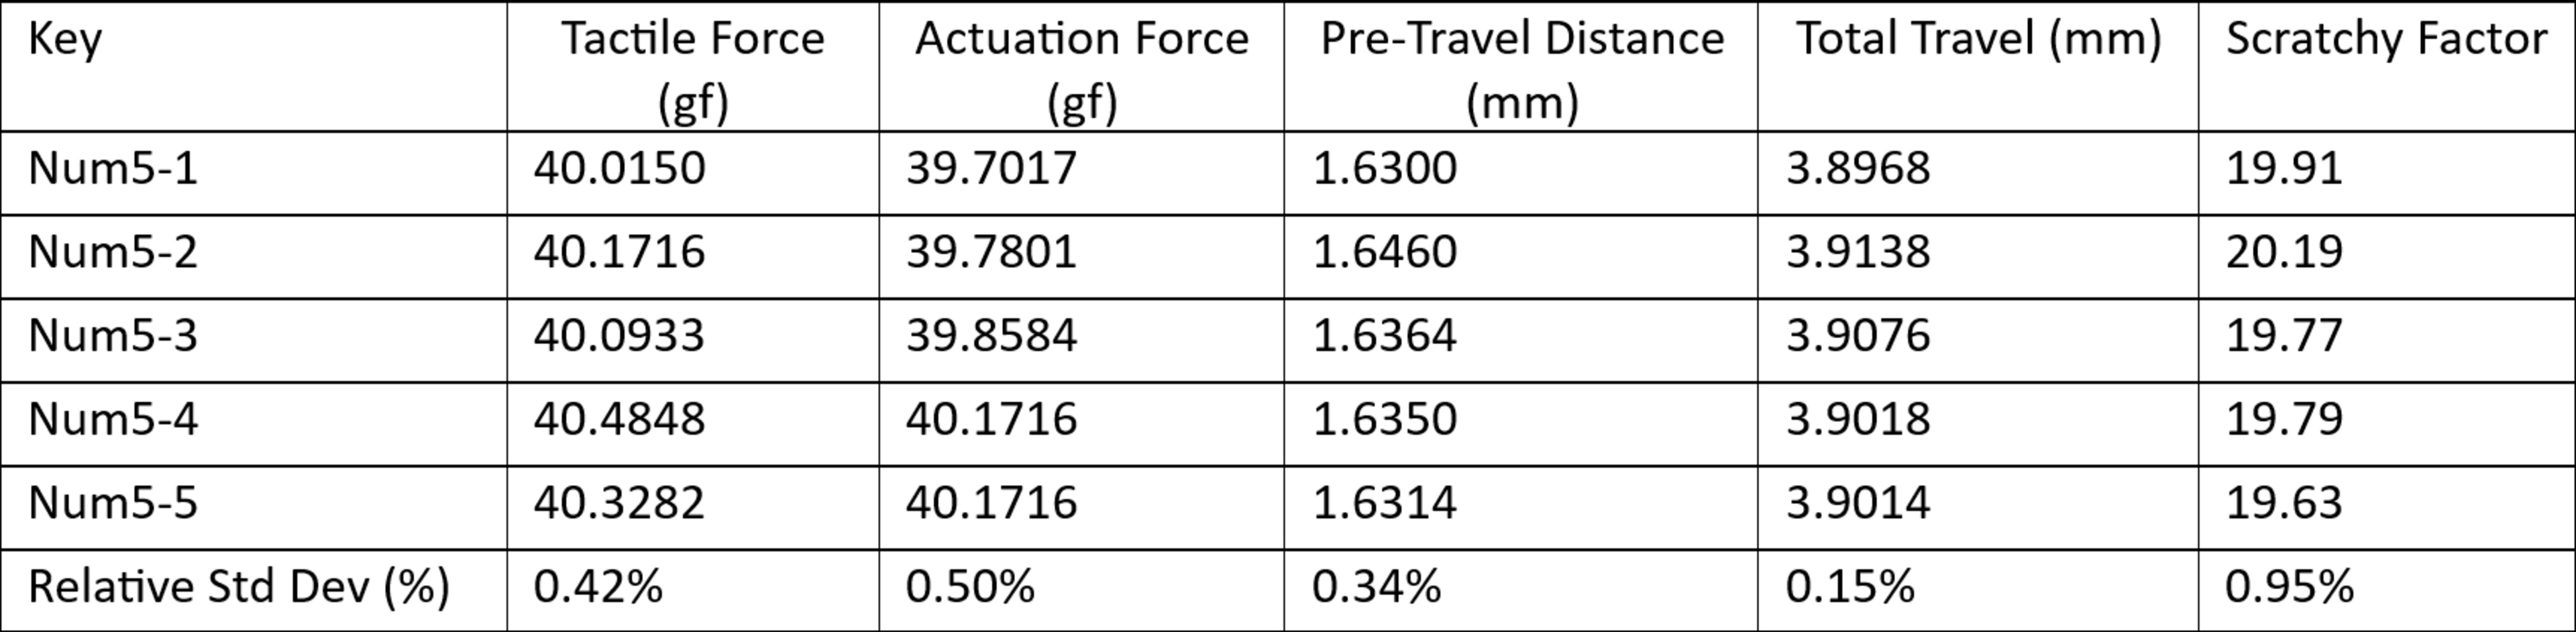 Keystroke machine consistency baseline.
Note: Scratchy factor is new and is explained further in this article.
For the second test, we keep the switch in the same socket, but move the keyboard and reposition it between every run. This, compared to the first test, informs us of the variance introduced by the centering errors.
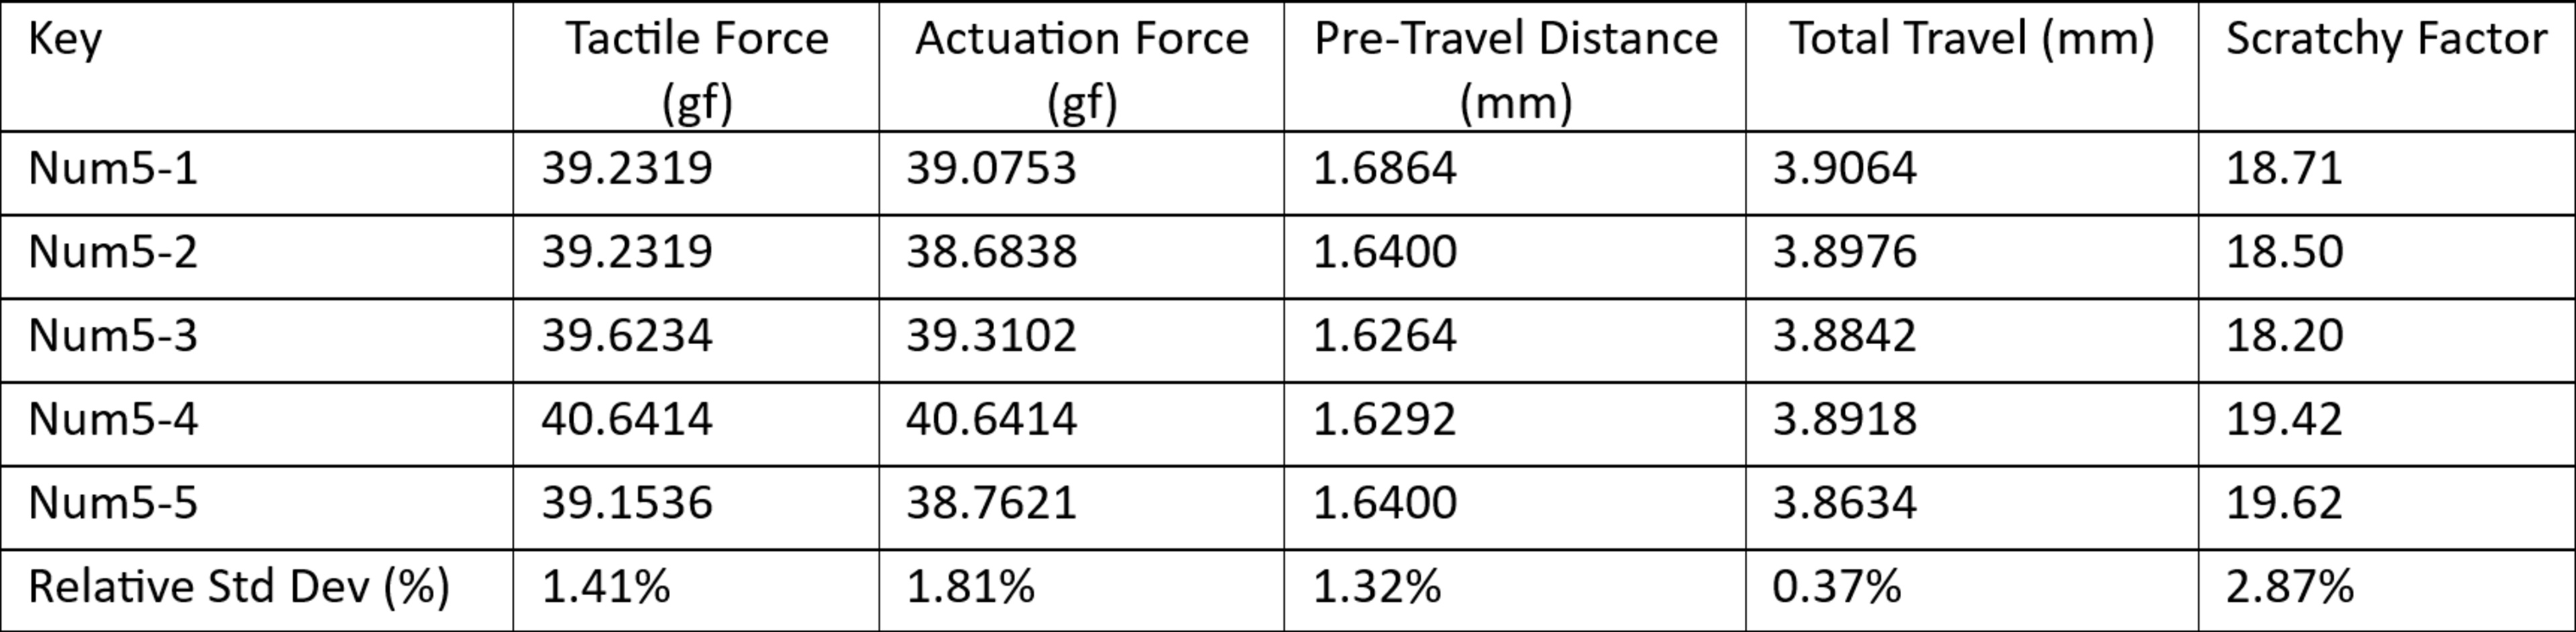 Keystroke result variance due to load cell repositioning.
For the third test, we move the switch to a different socket between samples. This allows us to characterize the keyboard variance.
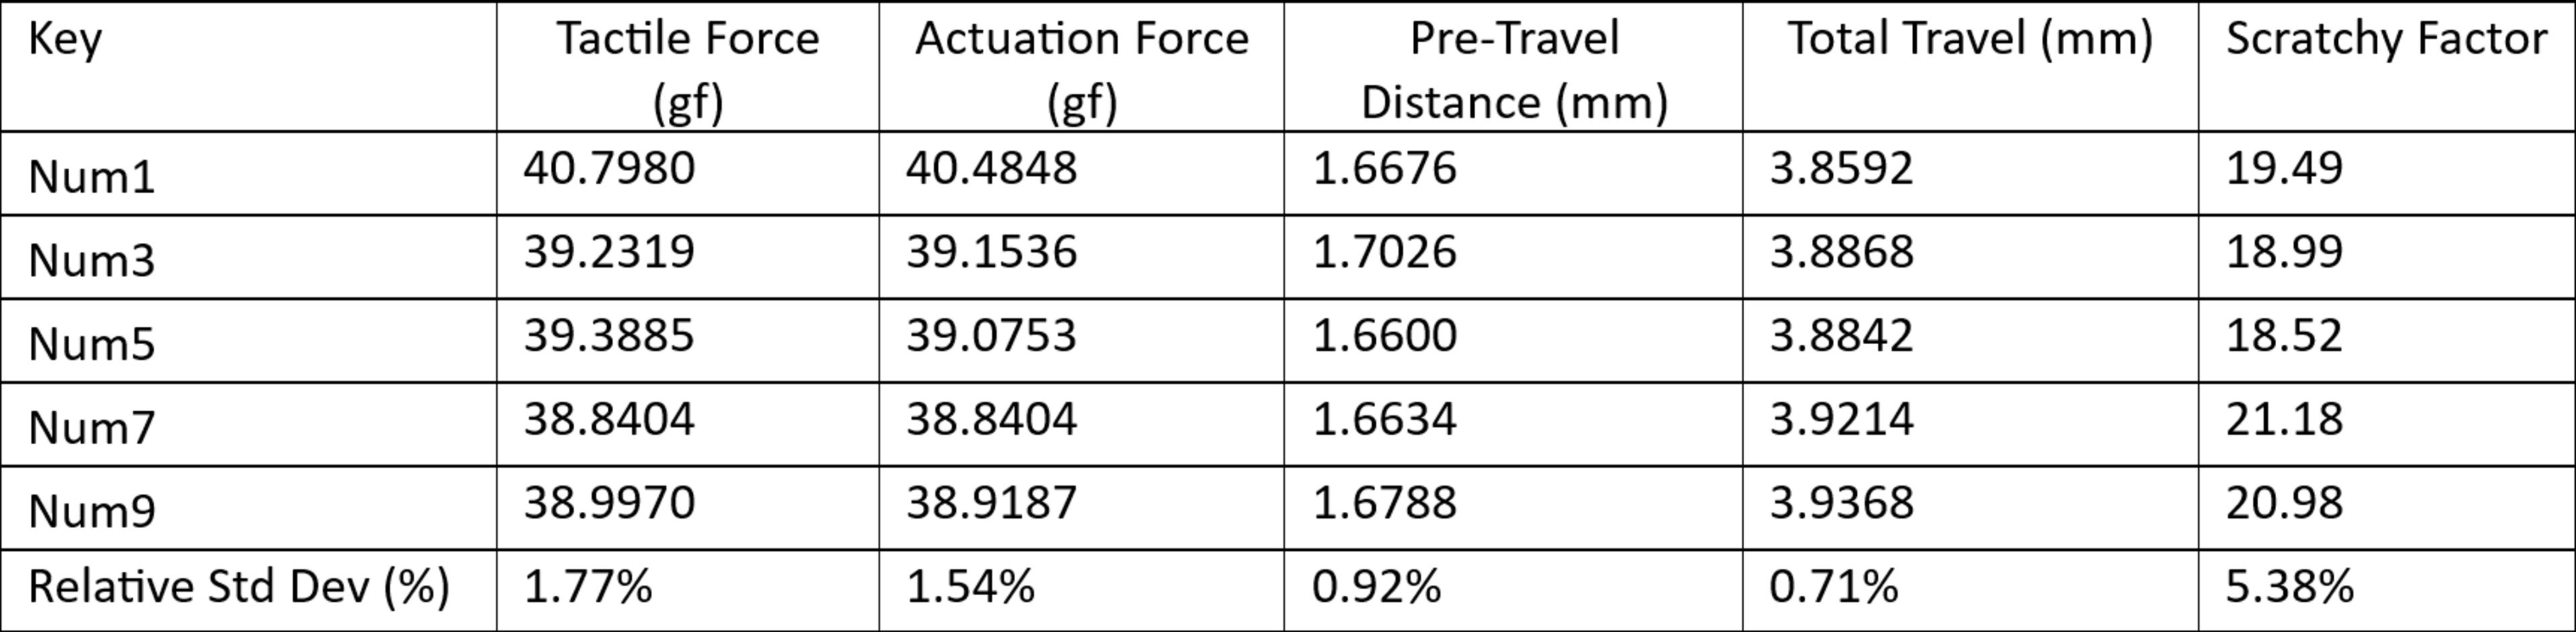
Keystroke result variance due to different switch positions/sockets.
Here's a recap of the variance changes.
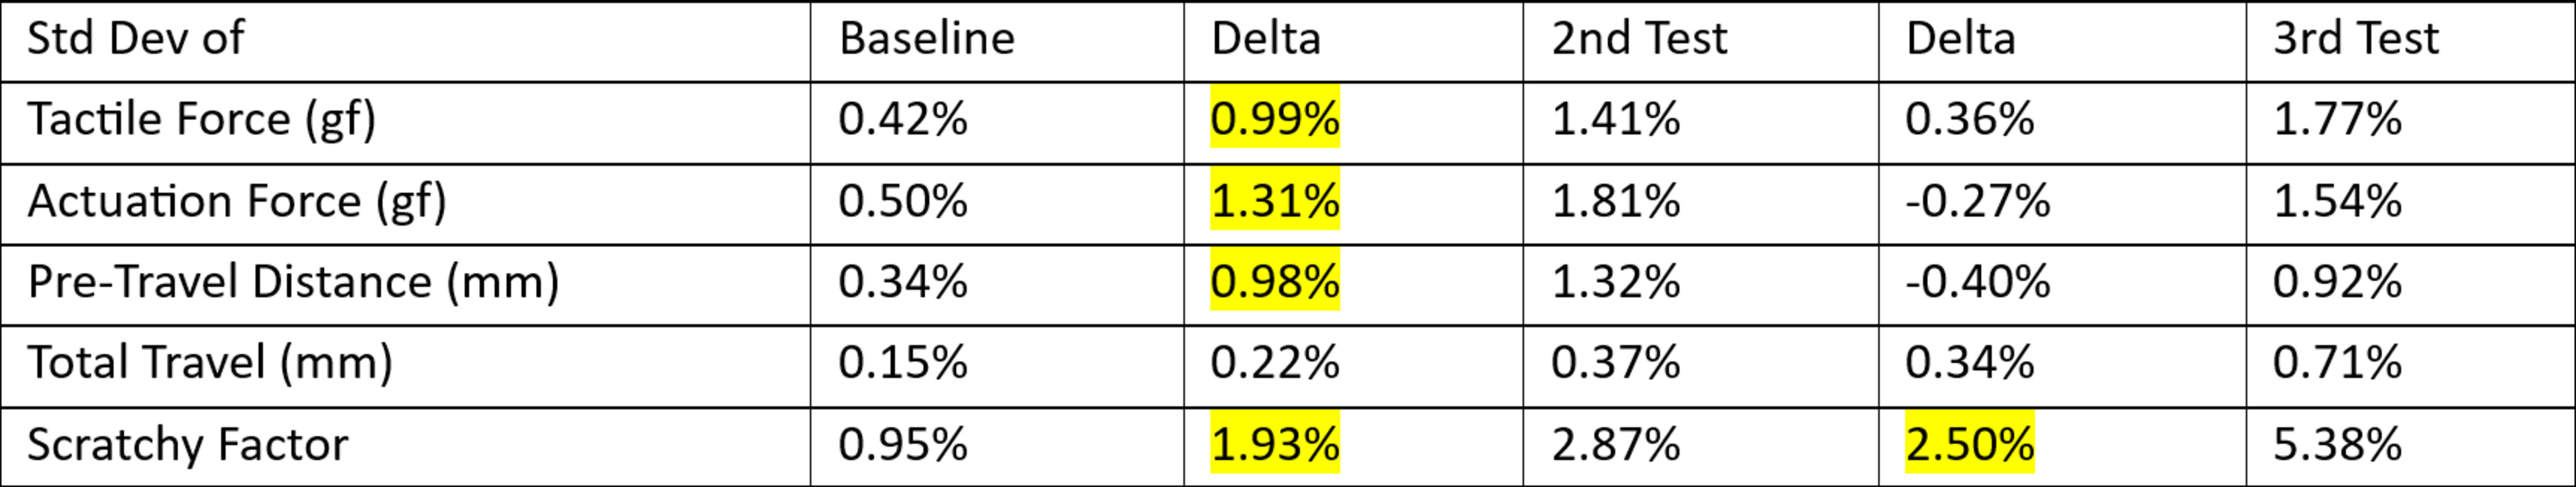 A highlight of which variables impact the results and which results are more resilient to test variability.
Now that we know our setup variance, we can compare these results to those of the five different switches. If the relative std dev is much bigger than the results from the third test, we can reasonably say that that specific switch can vary from sample to sample. However, even if it quantitively varies, it may not qualitatively differ; that depends on how someone would feel the difference. This latter affirmation is a lot harder to get a definite conclusion for.
The main conclusions for keystrokes are:
- Our force testing machine is consistent.
- A single switch behaves consistently from actuation to actuation. This does not mean it will be the same after a large number of cycles.
- The biggest impact on the results is the position of the load cell on the keycap.
- Moving the switch to a different socket doesn't affect keystroke data much.
- A single switch tolerance can be approximated to about 2% (1.93%). Any results within 4% of each other shouldn't be considered significantly different.
As mentioned above, our results are quite dependent on the load cell position accuracy. However, getting extremely precise positioning can be difficult and would slow down testing. This difficulty isn't worth it because we can achieve the same confidence in the results by testing more than one switch, which gives a better representation of the product anyway.
These are the results for the five different Gateron G Pro 3.0 Red switches.
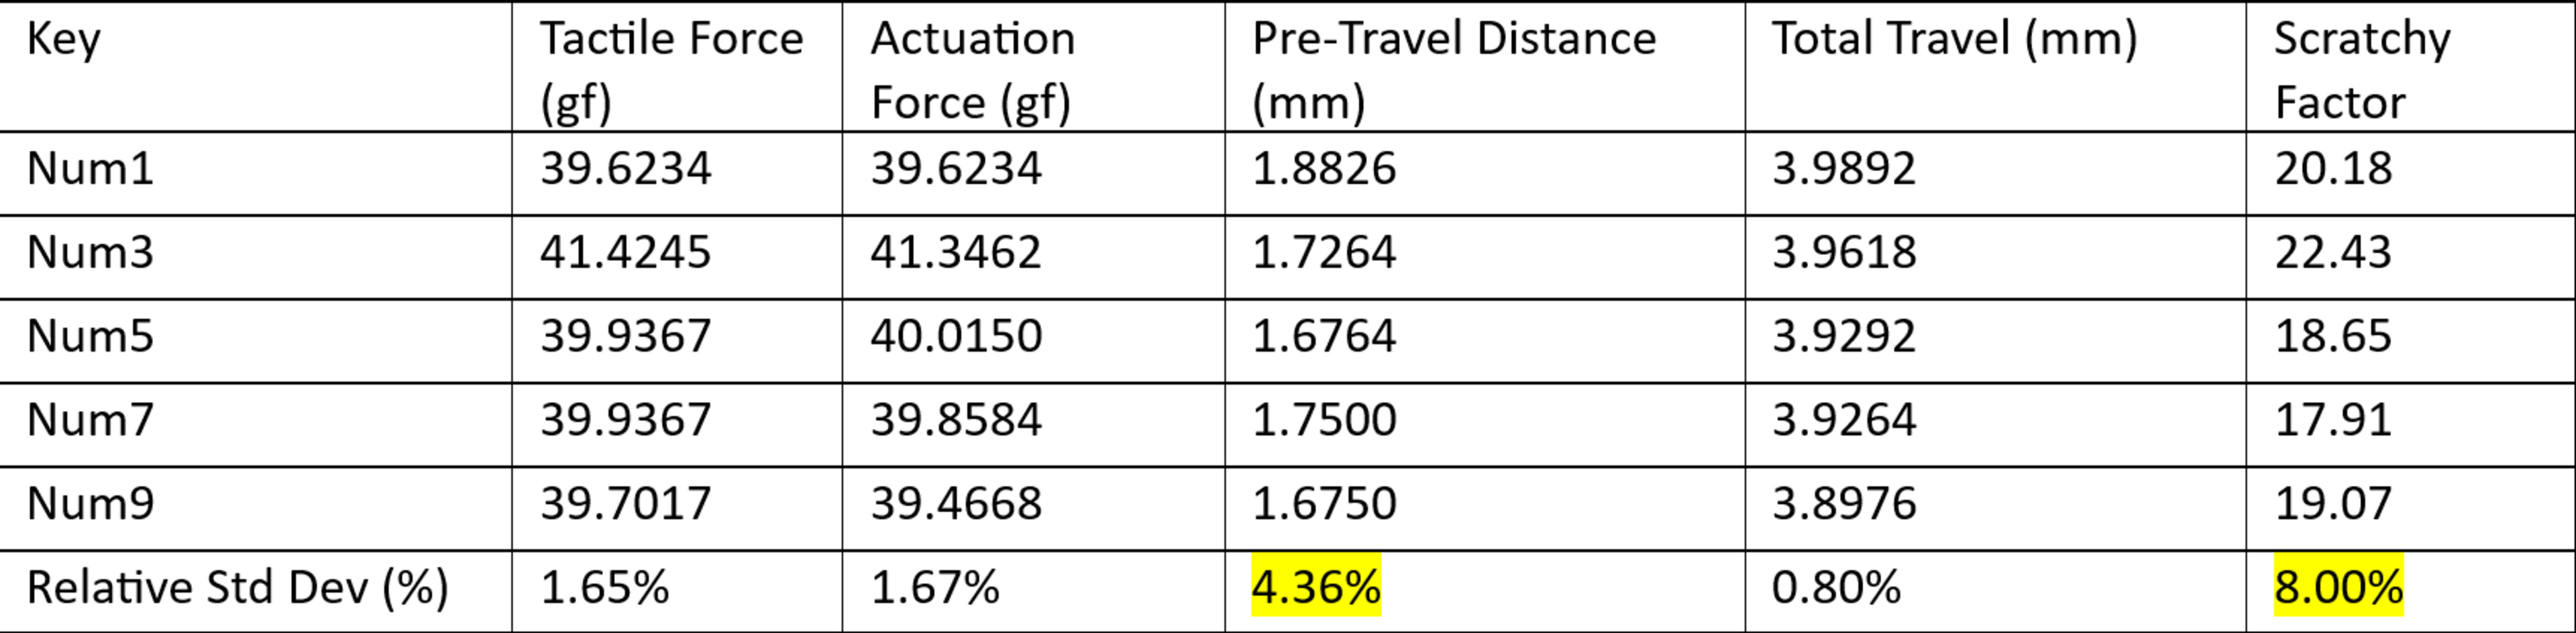 Gateron G Pro 3.0 Red keystroke result variability between switch samples.
Force appears to align with the variance observed for a single switch. Pre-travel is much bigger than what was observed for a single switch with all the setup variability (the worst variance for a single switch was 1.32%). 4.36% of std dev is equivalent to 0.07 mm. But the absolute variation is 0.2 mm. For comparison, the five Glorious Panda switches have a pre-travel spread of 0.33 mm.
We've pulled the data for a few more switches to see if it correlates well with what are accepted as bad/cheap switches from the community. Our results showed a possible weak correlation. By this, we mean that cheap switches did perform worse, but some good switches would also show bad results.
For example, the JWK Alpaca would obtain a relative std dev of 9% for its pre-travel distance. They're known to be a quality switch, and it wouldn't be wise for us to say they're an inconsistent switch based on that result.
For this reason, we're not including variance results in the review.
Technical Solution
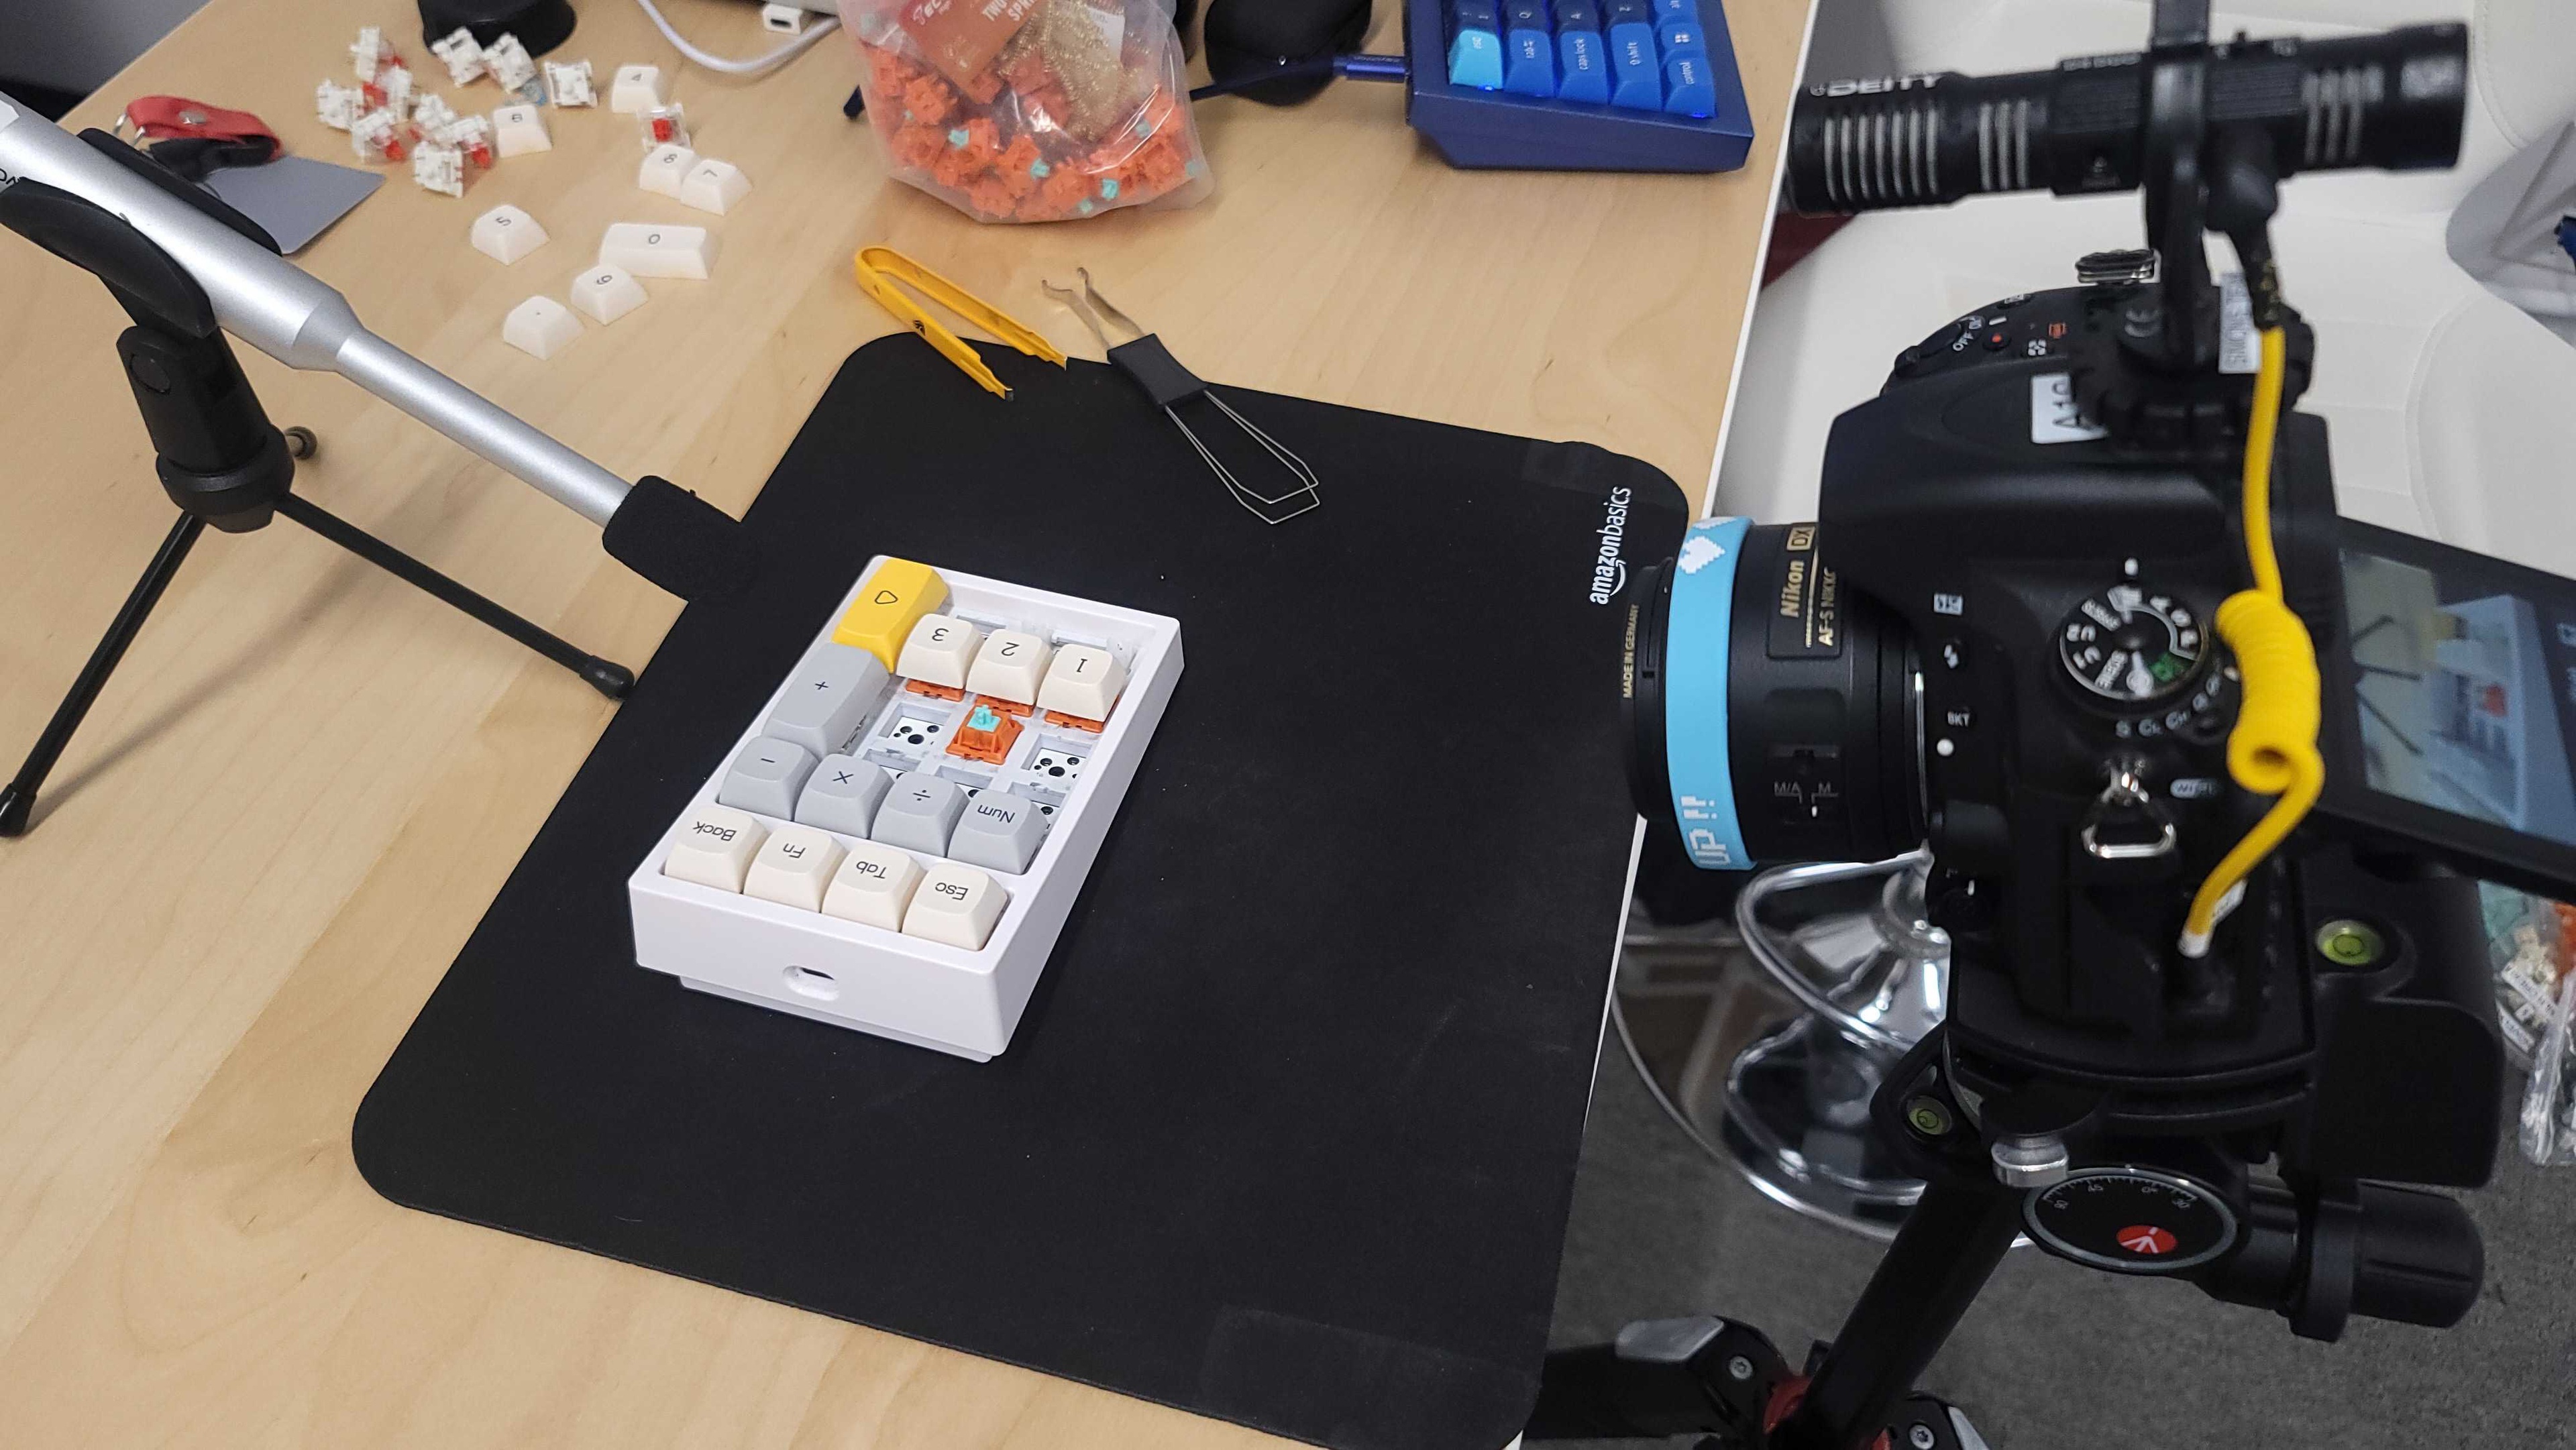
Our technical solution for designing the keystrokes test for keyboard switches is very similar to the keystrokes test for our keyboard reviews. We put five switches in a standalone Numpad keyboard. We fill the Num1, Num3, Num5, Num7, and Num9 sockets with the switches we're testing and put the keycaps back on.
The Numpad keyboard model we chose is the Epomaker EP-21/TH-21 because it's affordable and readily available. We also considered the Keychron Q0 and the Corsair K70 Mini Wireless, but they didn't provide an improvement in this test, and the Epomaker was a better fit for other tests. The plastic plate and construction allow for a more neutral sound in our smoothness test and are easier to modify for our latency test.
We place the Numpad, loaded with the switches we're testing, under the Mecmesin MultiTest 2.5-I force tester. We then shim the Numpad to make sure the keys are approximately leveled. Within the machine software, we set the load cell to slowly push the switch and record the force until it bottoms out. The load cell then reverses and measures the release.
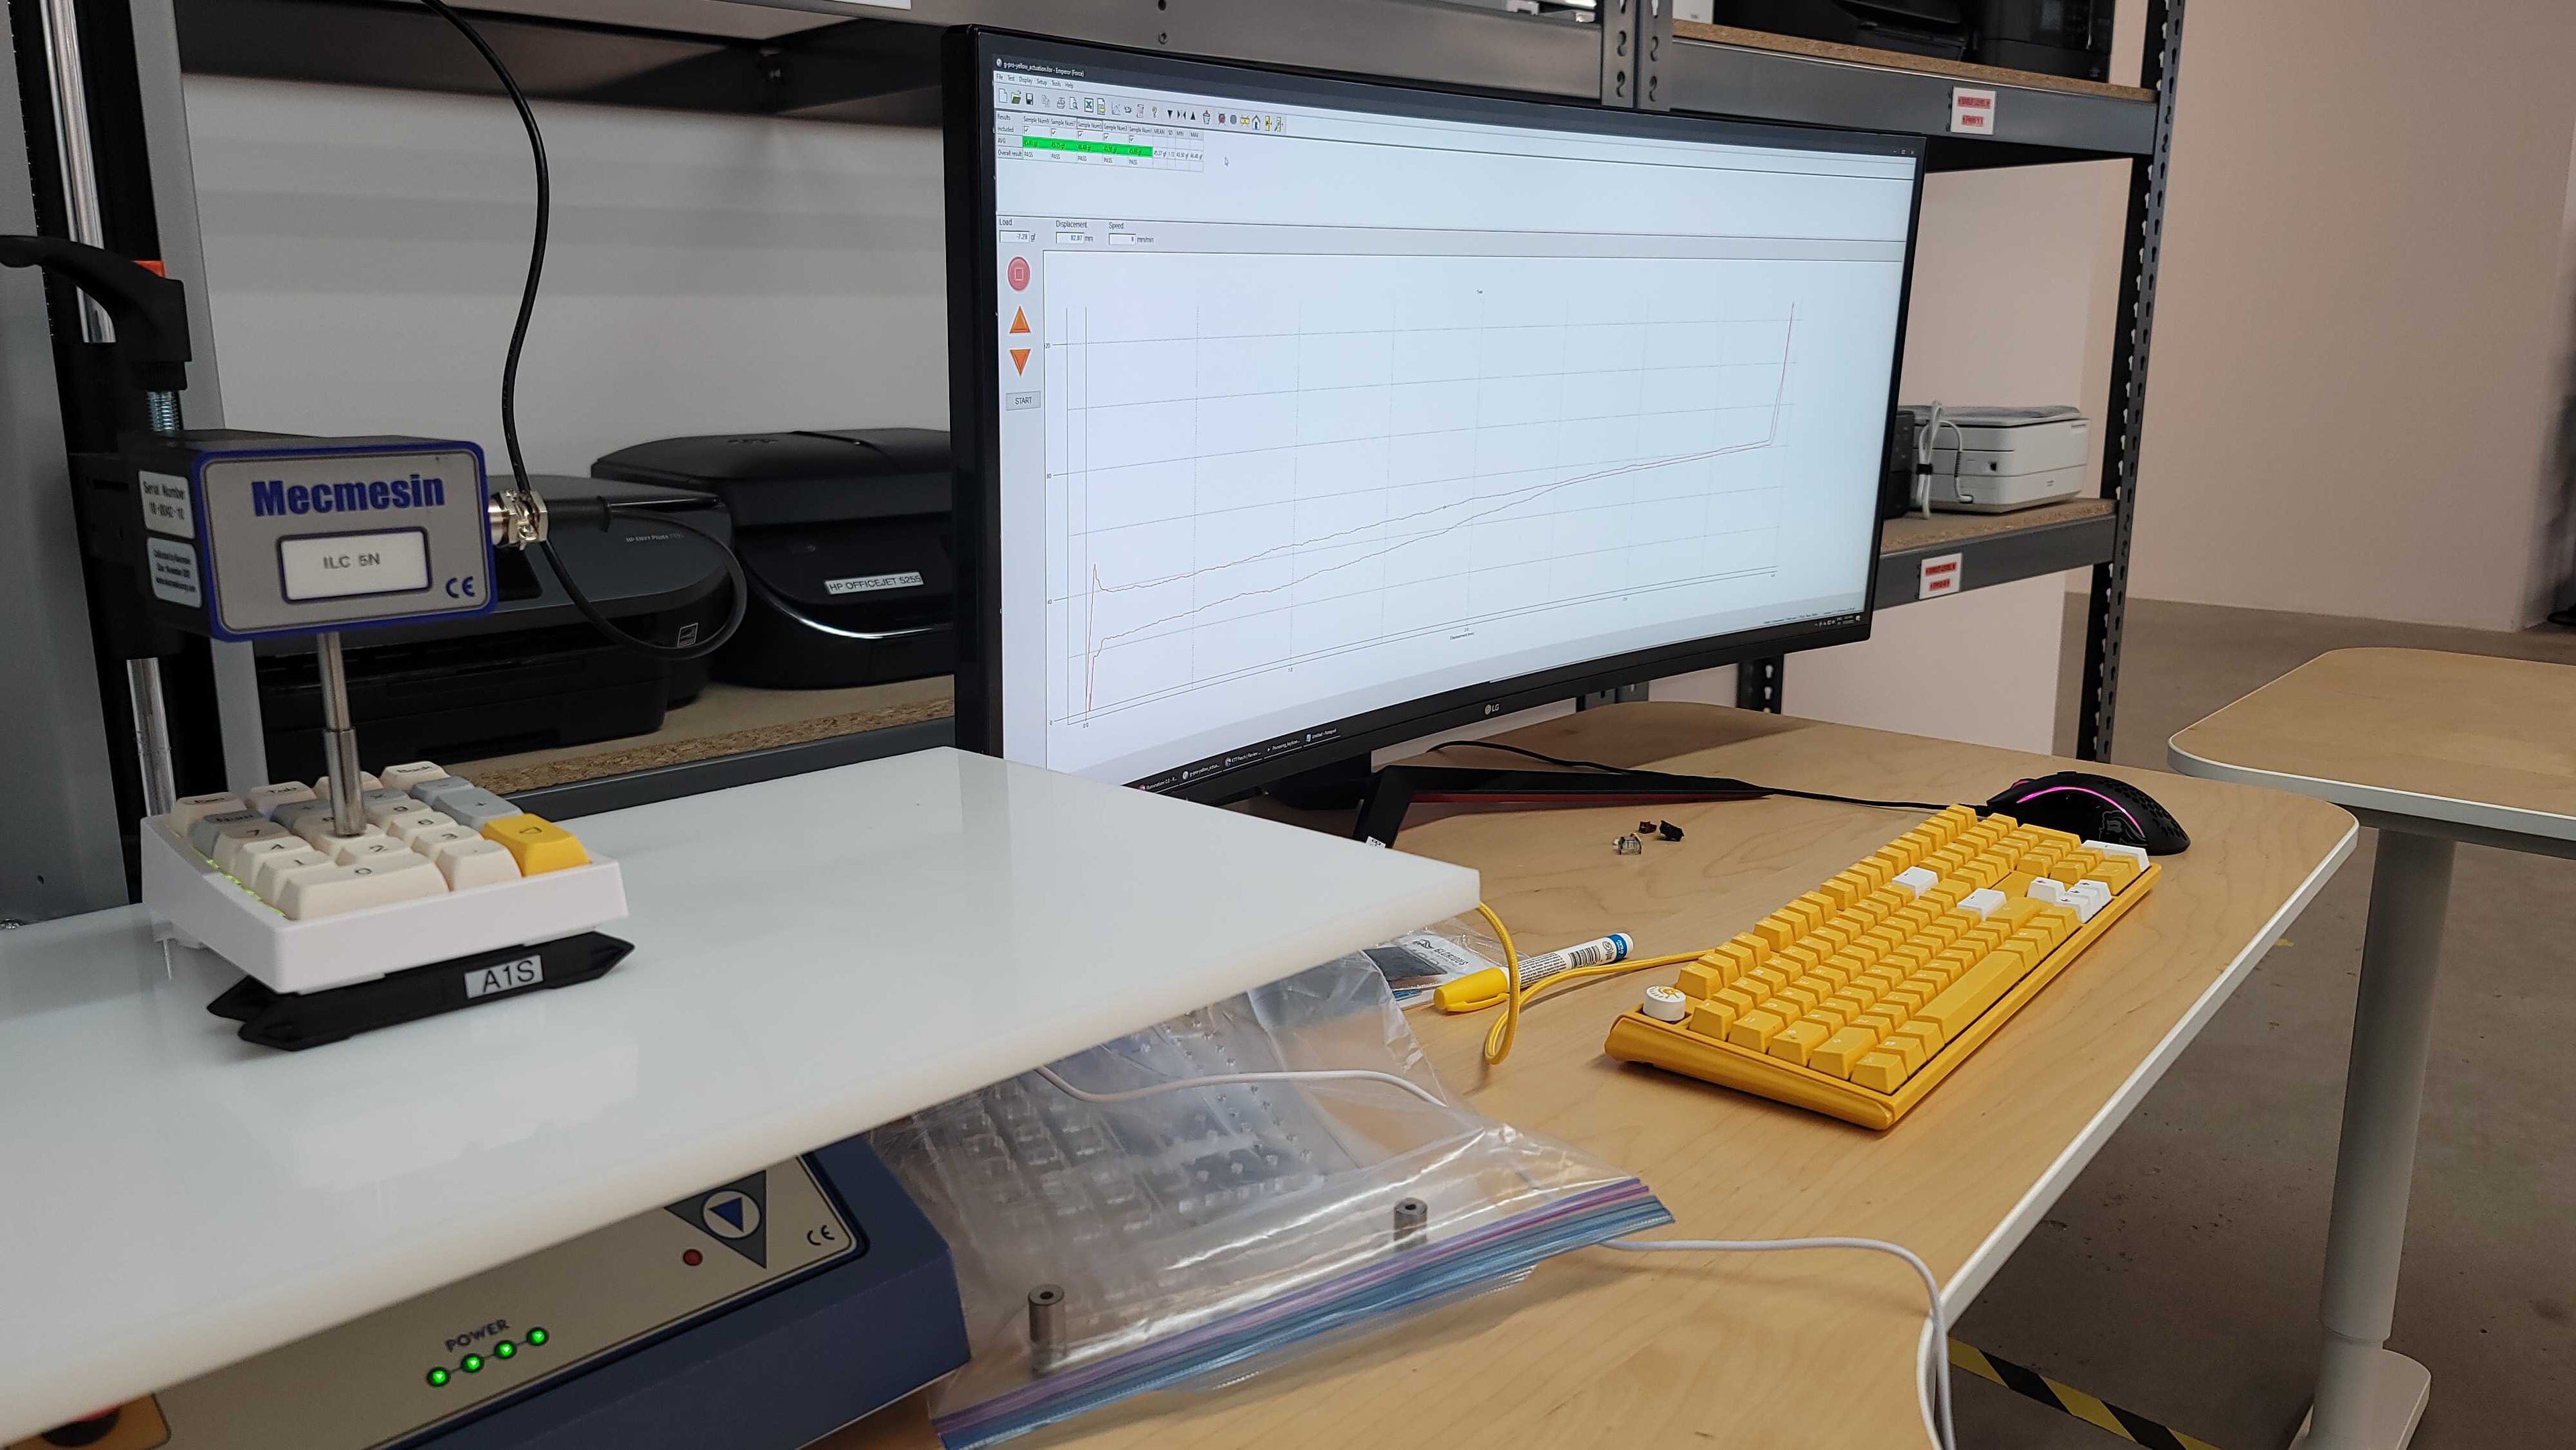
Switch keystroke testing setup.
We then move the Numpad so the next key is aligned and repeat this until all five switches are tested. We export the results and run the processing automation. This calculates the tactile force, pre-travel distance, actuation force, and total travel distance. It also creates a graph for each sample. The automation then averages all the samples and puts those numbers in the review. It will also select the graph of the sample that has the pre-travel distance closest to the average pre-travel distance.
In-Review Solution
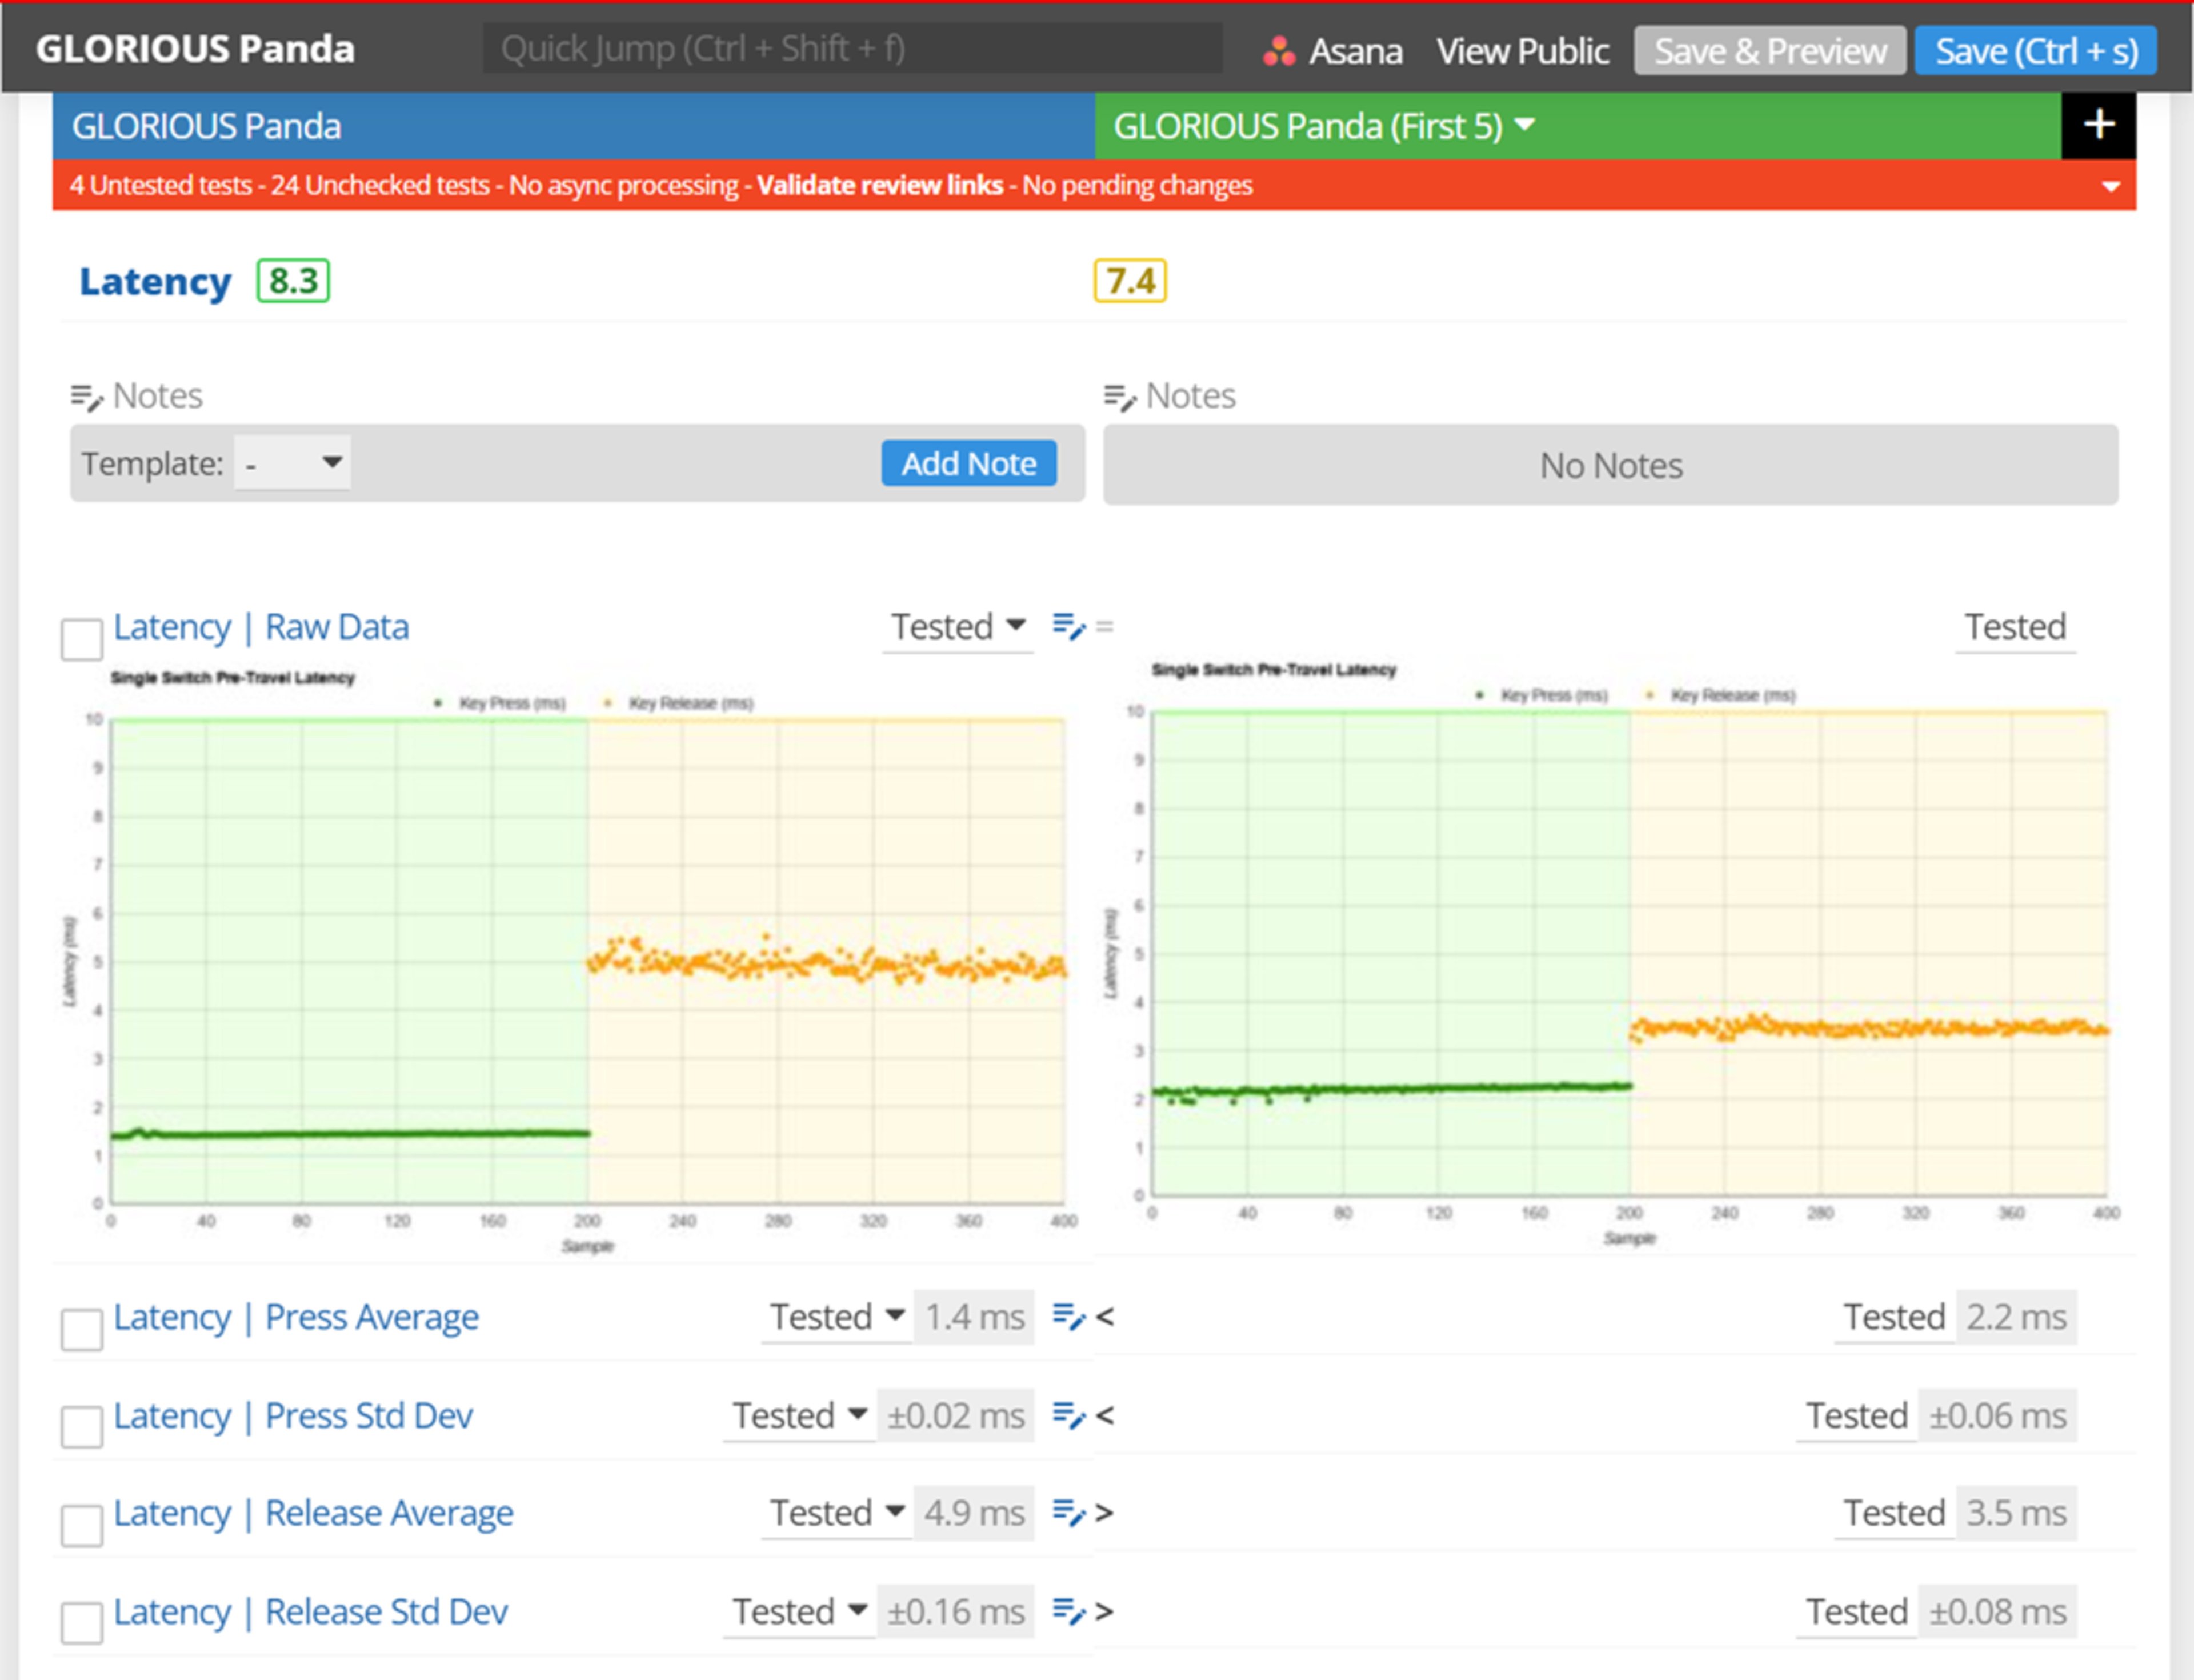
This is what the keystroke test looks like in one of our keyboard switch reviews.
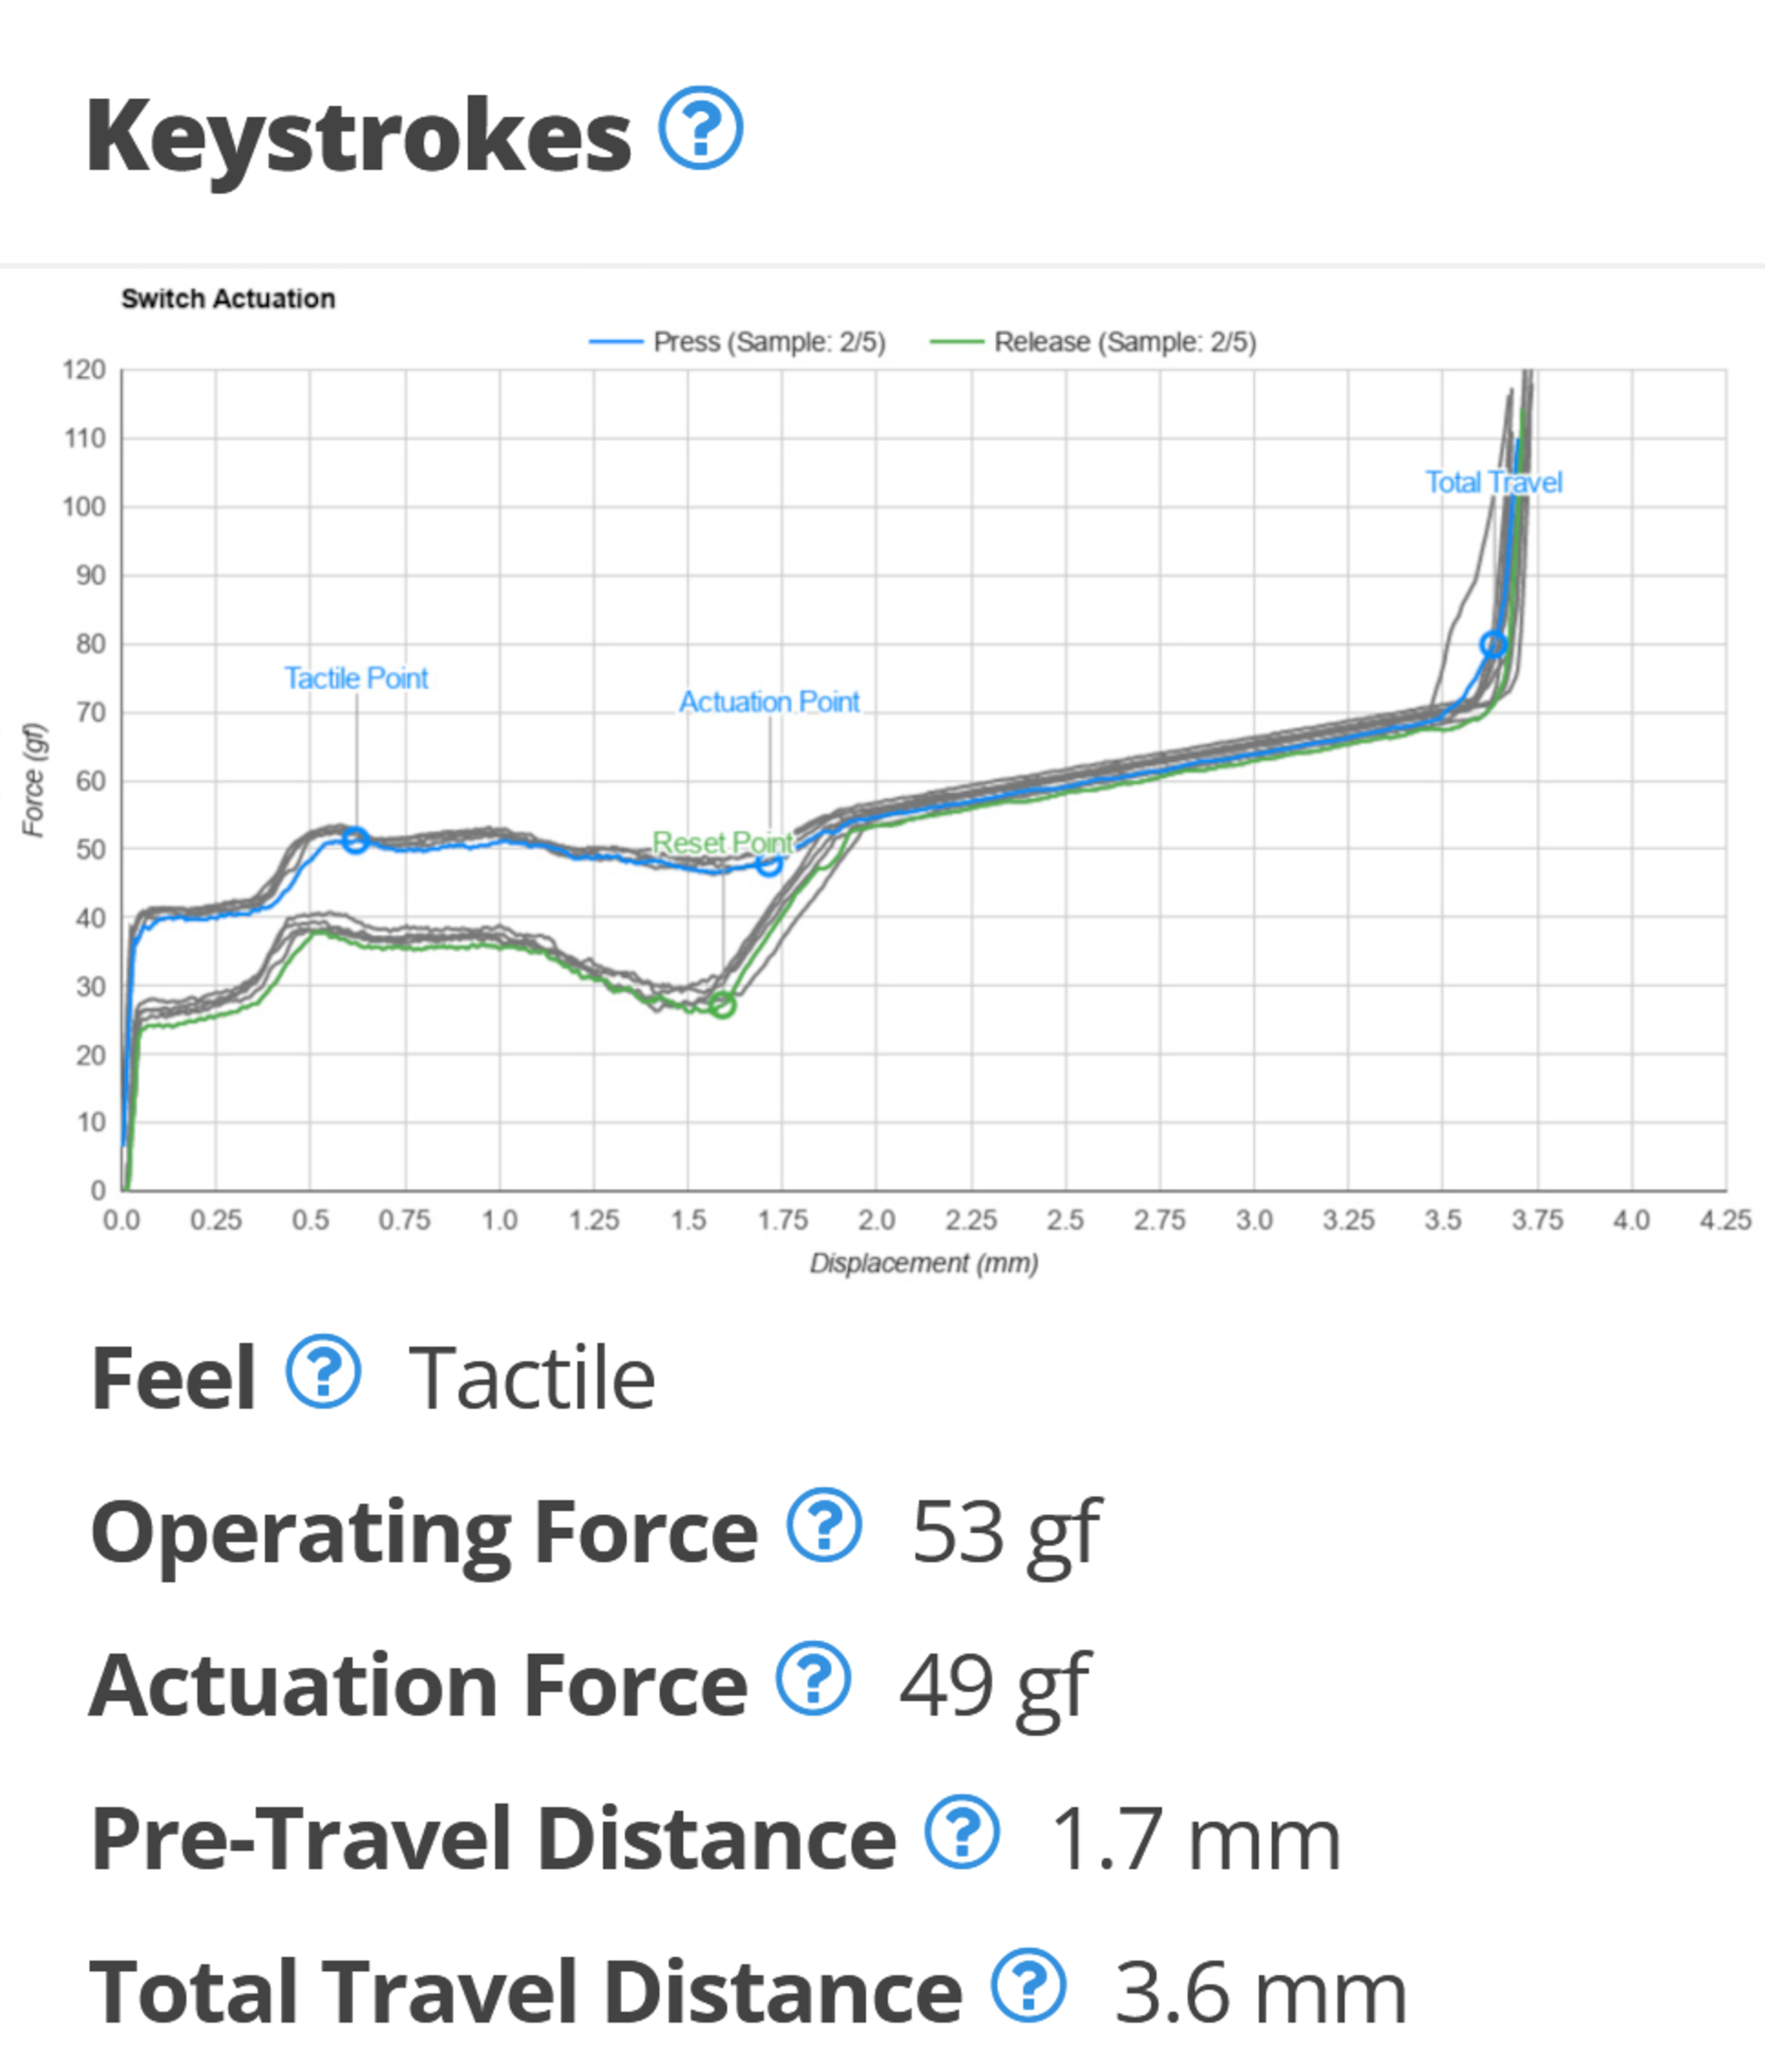
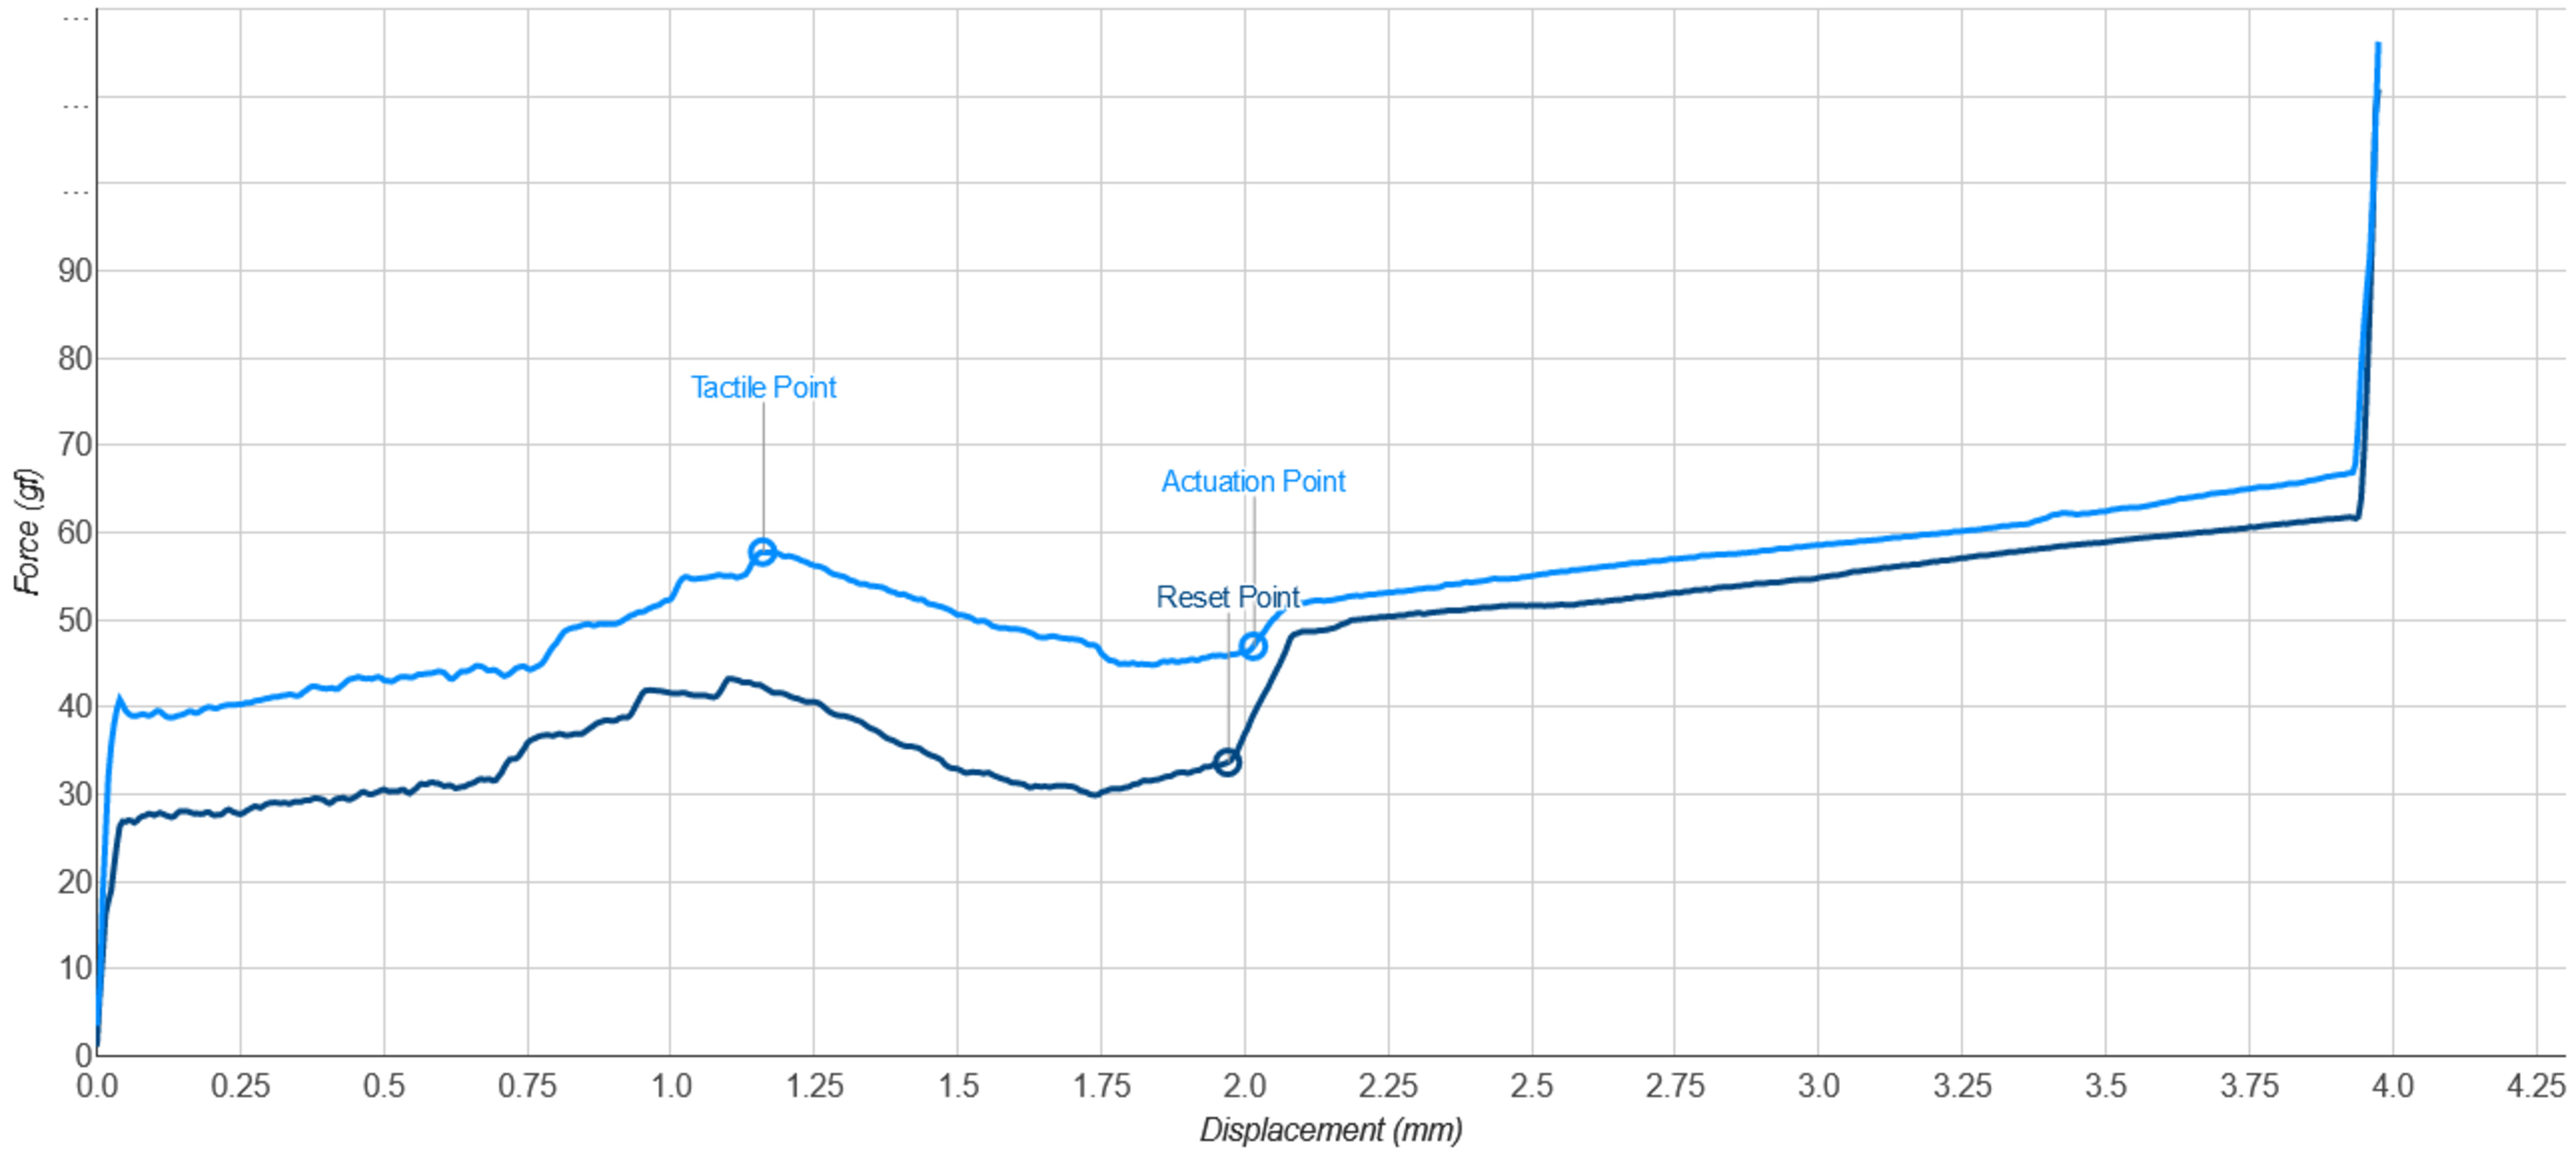
Keystrokes test example from the Kailh Pro Purple keyboard switch review.
Results
A switch's actuation characteristics are very much a personal preference, so there isn't an expected order. What we can do to validate is quickly look at the switch type and ensure the graphs all roughly match the expected characteristic curve.
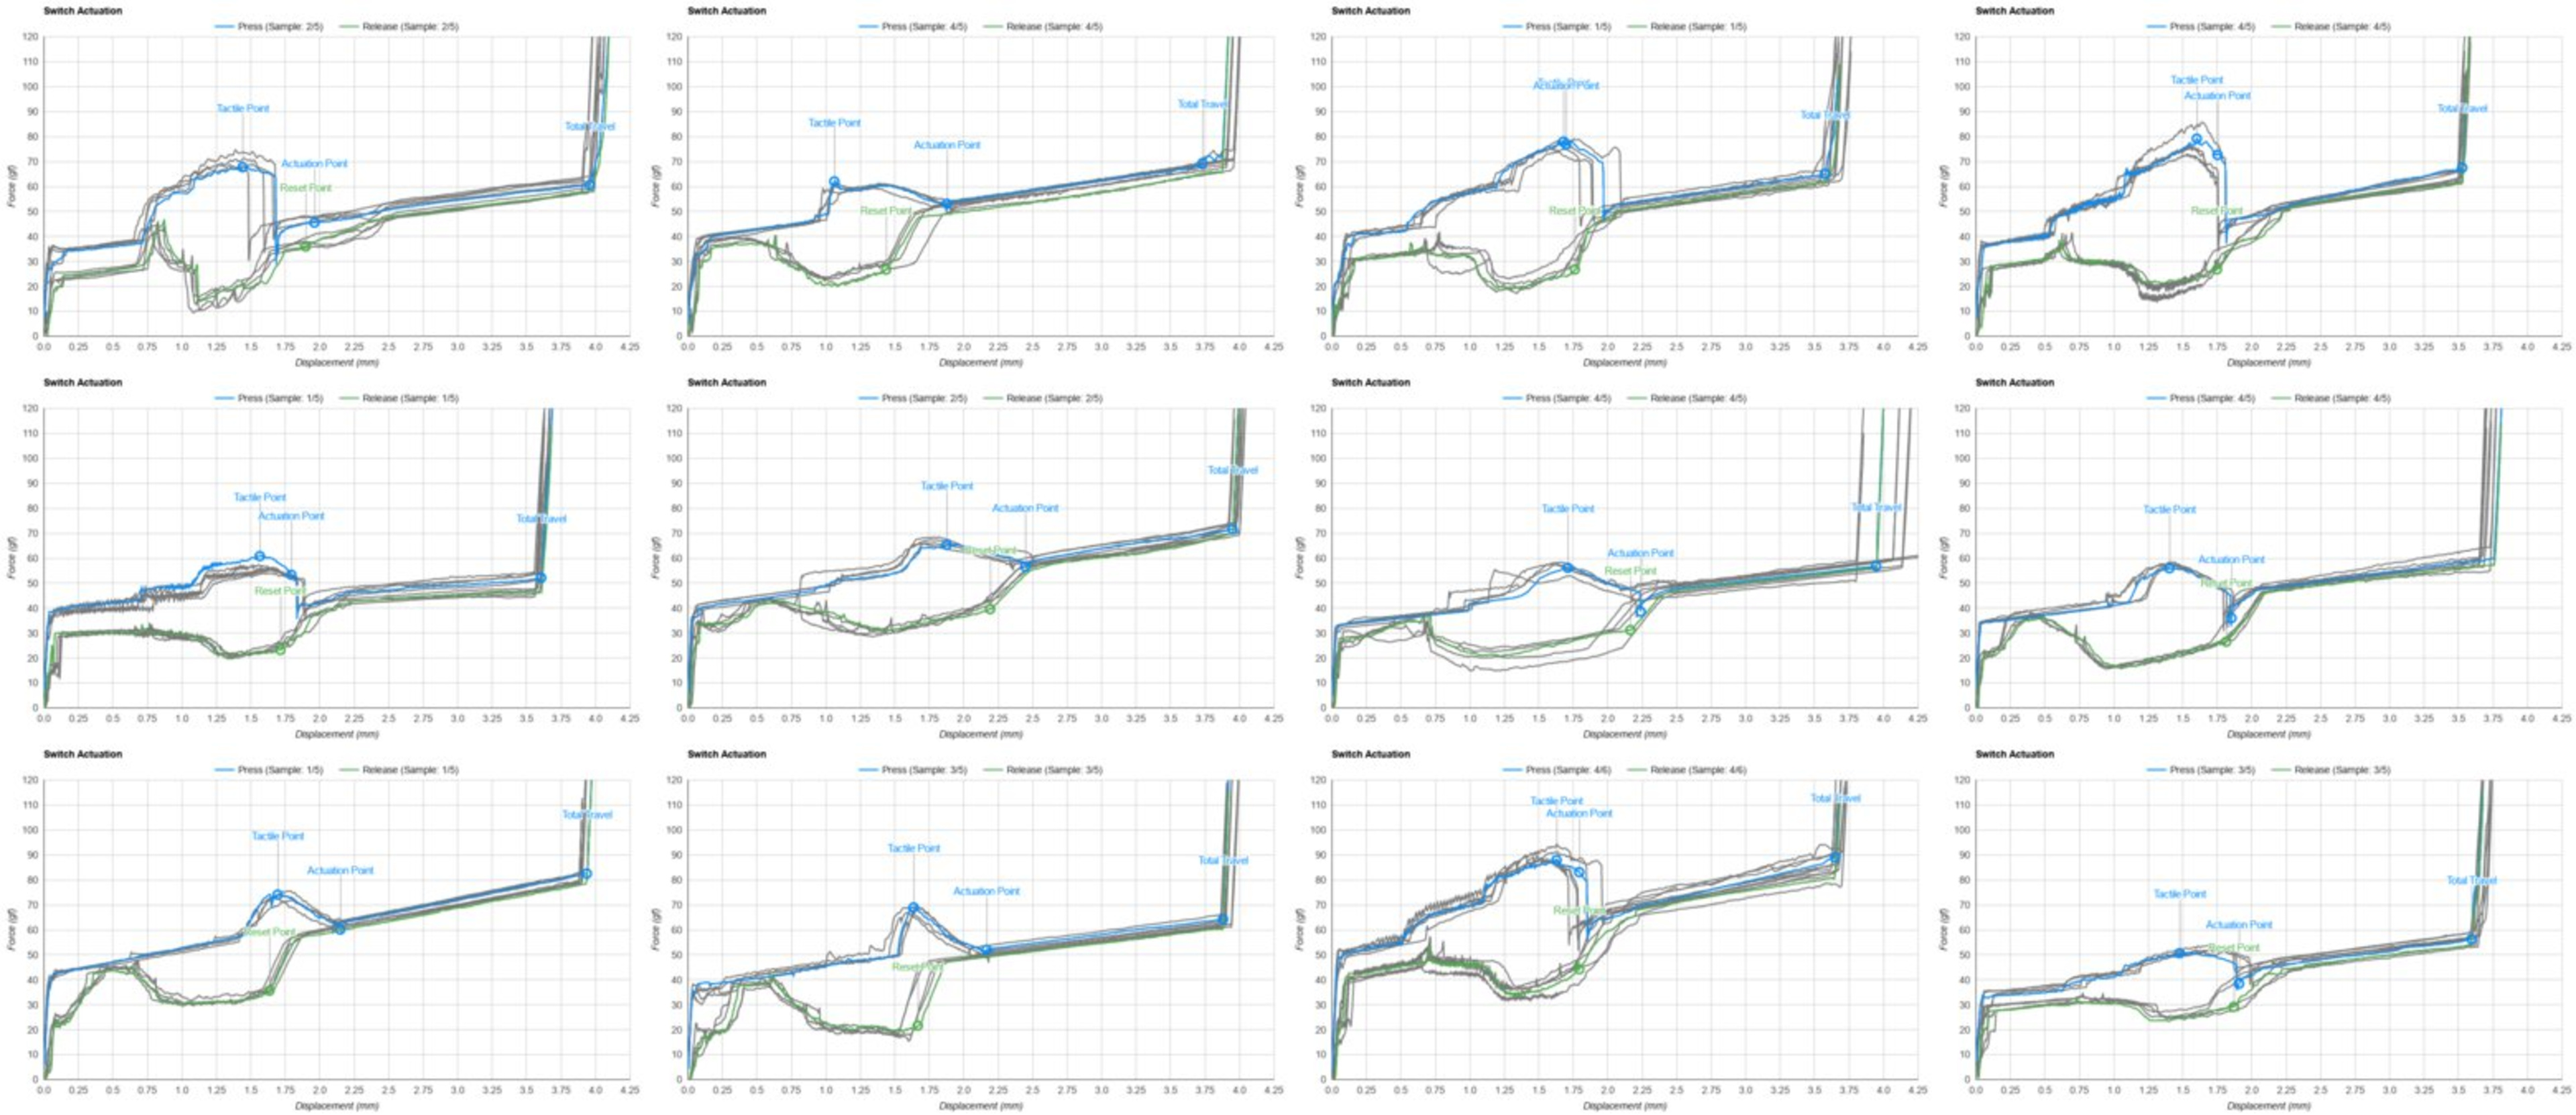 Keystroke graphs for all the clicky switches
 Keystroke graphs for almost all linear switches
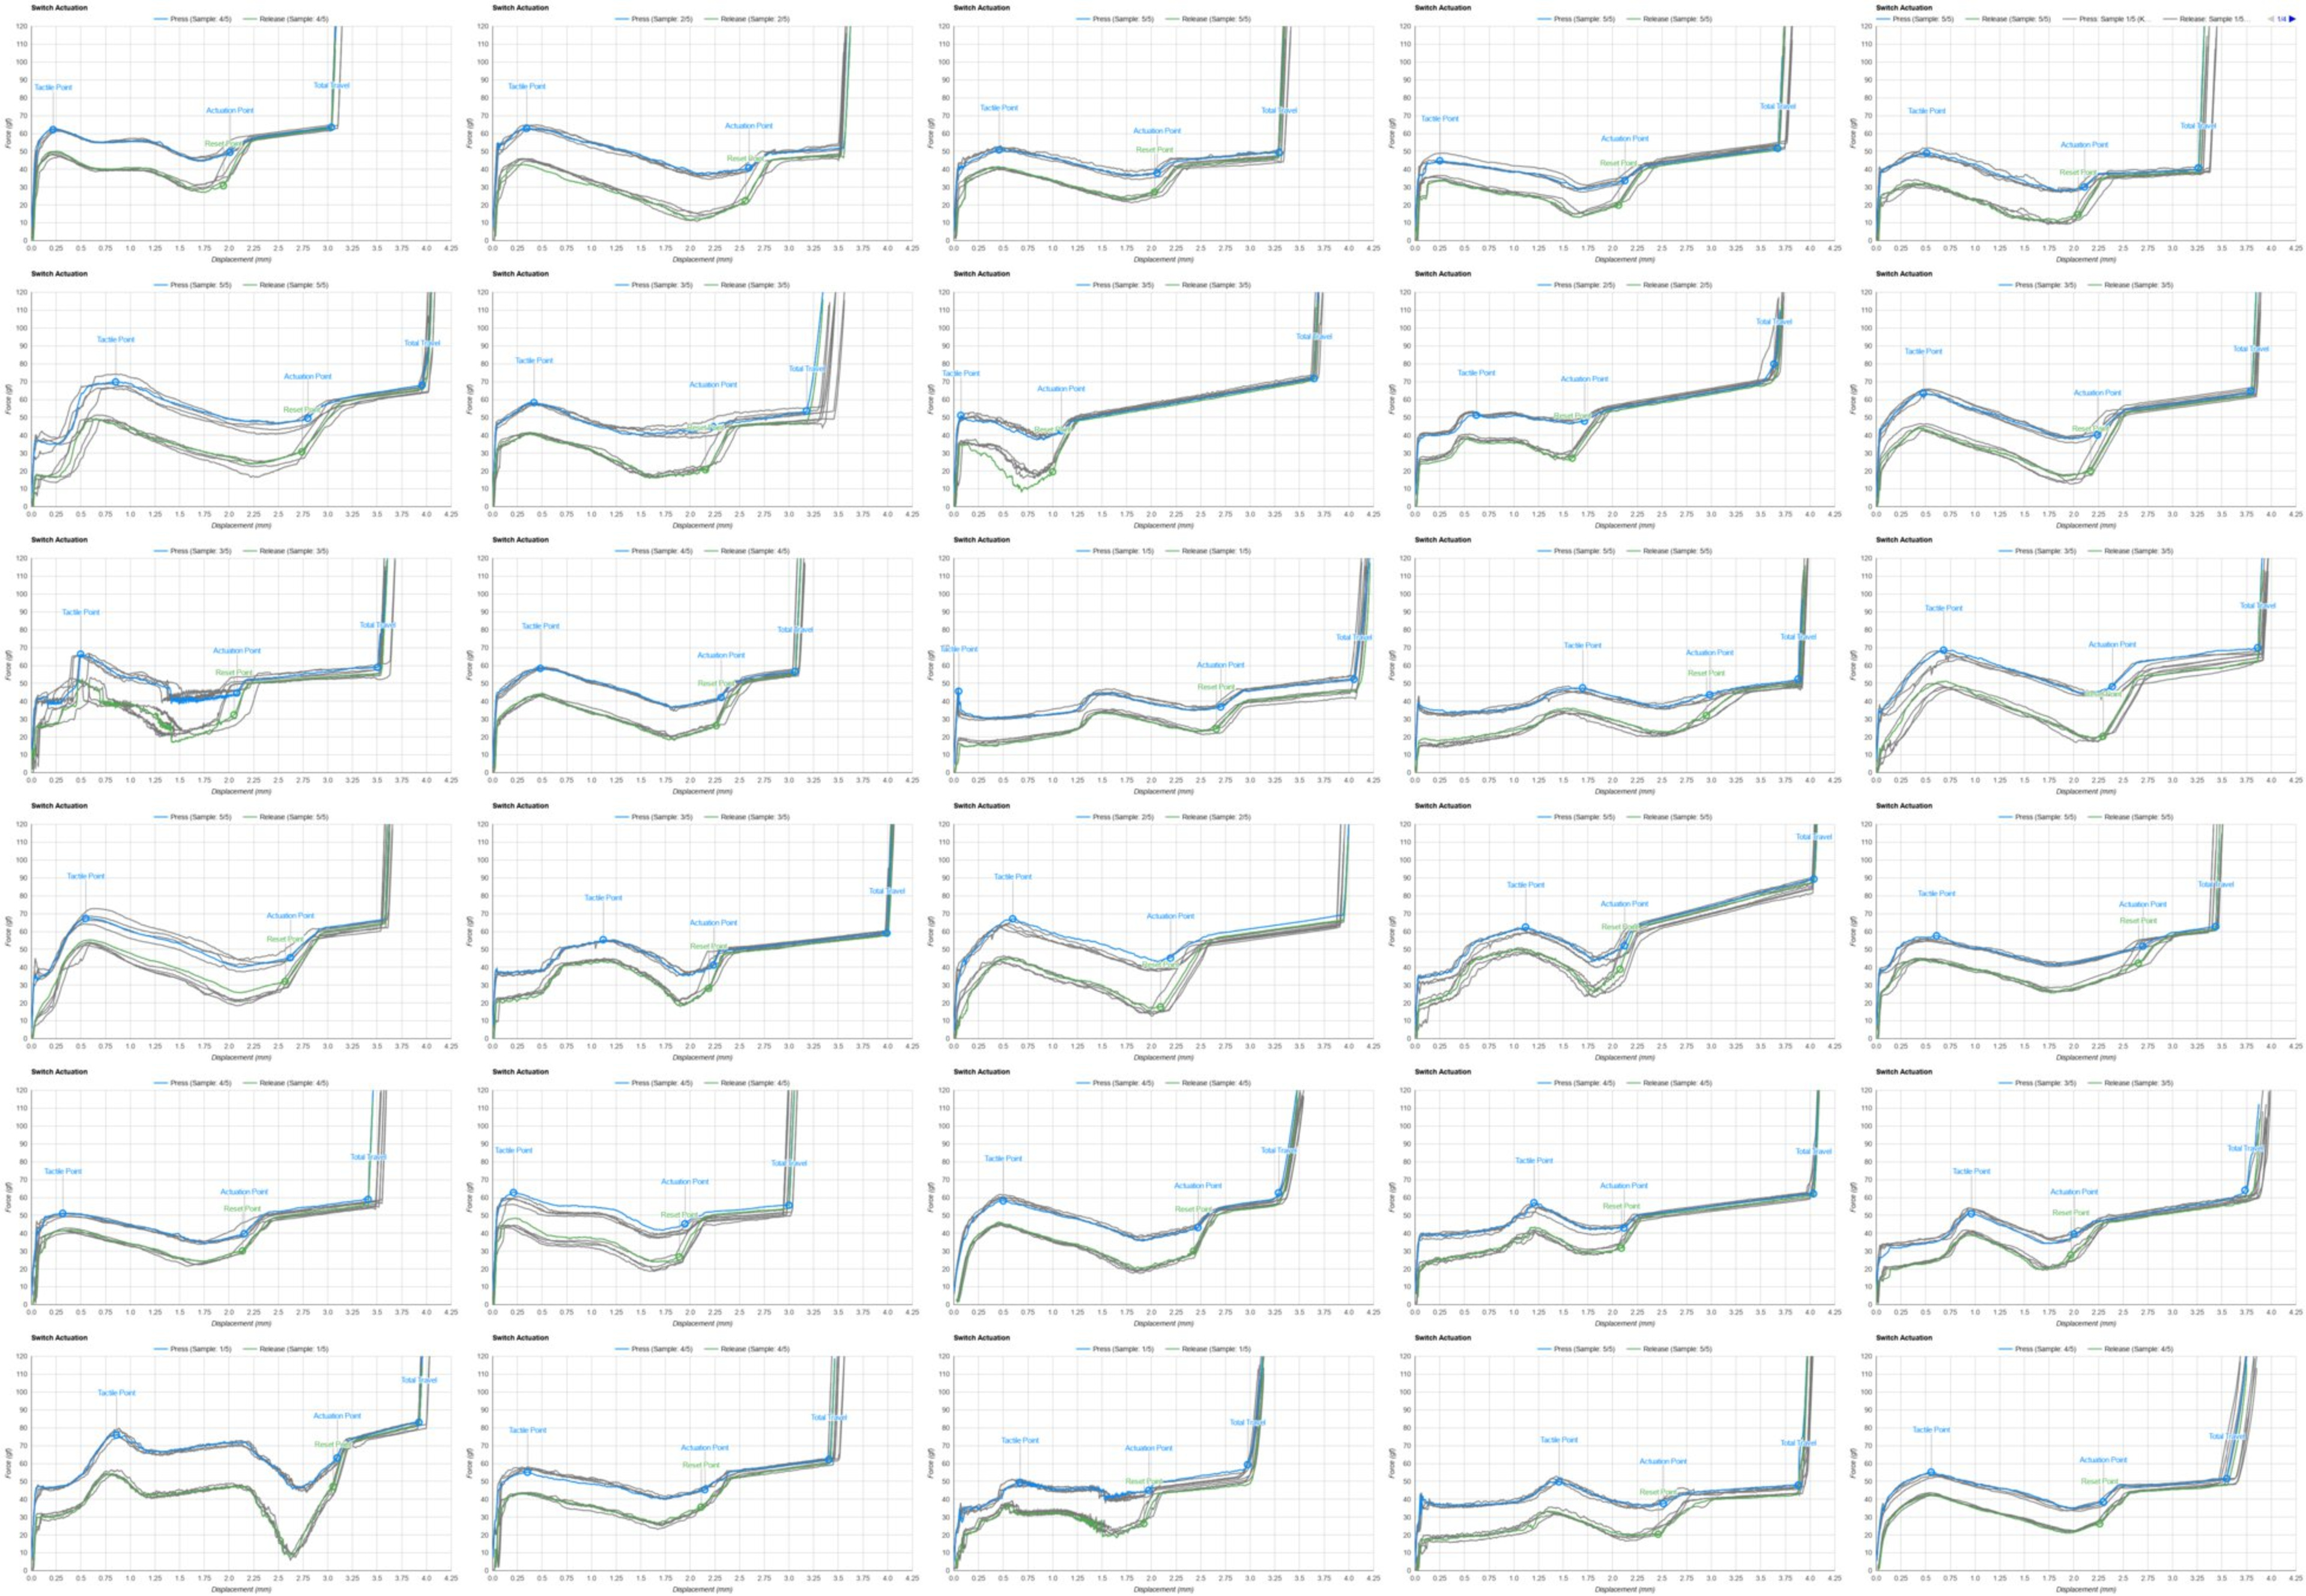 Keystroke graphs for tactile switches
Tactile and clicky implementations vary a lot as manufacturers take different approaches to tune the feel of their switches, whether to distinguish themselves from their competitors or to tune them for target market preferences. Linear implementations are much more consistent in their characteristics, but that's expected.
Test variance & limitations
Based on some of the testing in the switch-to-switch investigation, if the difference between two switches is less than 4%, then they should be considered equivalent. This is purely from our setup and tolerances on a switch. Pre-travel has a bigger variance since there are two devices in the loop: the Mecmesin machine that records the travel, and an Arduino that detects the actuation point. Pre-travel can vary as much as ±0.25mm.
Keystrokes Conclusion
It would have been nice to score switch-to-switch consistency because some people are sensitive to it, but with only five samples, the conclusion would be weak. If a switch is very inconsistent, we may be able to observe it from the graph. However, we believe that consistency is often identifiable by sound inconsistencies, and this test wouldn't convey this well in the review.
Pros:
- Displays five samples in the graph to help illustrate the variance of the test
- Low variance (except pre-travel)
Cons:
- No value for identifying switch-to-switch consistency in the review
- This test was low risk, from a design perspective, since it's a direct port from keyboards, but we're happy to show all the sample data on the graph. This better supports our approach of showing the numbers for the average of all samples.
Problem Definition
We want to find an objective way to evaluate the quality characteristics of different switches. Better latency isn't better quality; it's simply different geometry and specs. For quality, we paid attention to what words we used when describing the quality of switches. Sound is a major element we identified, but it's subjective. Smoothness was a recurring aspect that kept coming up in our considerations and feels more like a metric we can objectively measure.
Evidence
Smoothness being used to compare switches.
Smoothness being used as a main purchase criterion.
Smoothness being used to summarize a switch.
Where we might be quite off from the community expectation is that we're only evaluating the 'factory smoothness' of the switches or how smooth they are right out of the box. This doesn't consider what smoothness you can achieve if you manually lube your switches. We've made this decision for a few reasons:
- Our results would be heavily impacted by how well each switch is lubed. Any bad results would require us to perform a few retests to ensure it's the switch that's performing poorly and not just a case of a switch that wasn't lubed properly.
- The testing time required to lube a lot of different switch models properly means we'd have to severely reduce how many we can afford to test.
- It's important that our review scores are representative and don't require the reader to put a significant effort post-purchase to match our results.
Proof of Success
We can validate if our tests are effective if the Gateron Oil King switches are near the top since they're a common recommendation online for a smooth switch.
Some other switches that we expected to perform well are the JWK Alpaca and the Everglide Aqua King.
However, because we plan on evaluating factory smoothness, we can also validate our scoring based on our subjective impressions. We did some initial blind tests on five switches (Gateron Oil King, Kailh Super Speed Silver, Cherry MX Speed Silver, Glorious Panda, and Kailh Thick Box Clicky Navy), on multiple members of the testing team, and these are the expected results:
- Gateron Oil King switches should be near the top.
- Kailh Super Speed Silver switches are smoother than Cherry MX Speed Silver switches.
- With Clicky switches, it's hard to get a consistent subjective score.
- Glorious Panda switches are expected to be in the 40th percentile at most since they were consistently set as the worst of five in our subjective test of five.
Investigation: Graph Noise
Looking at the keystroke graph, we can see differences in the noise. We're interested in whether this noise correlates to perceived smoothness.
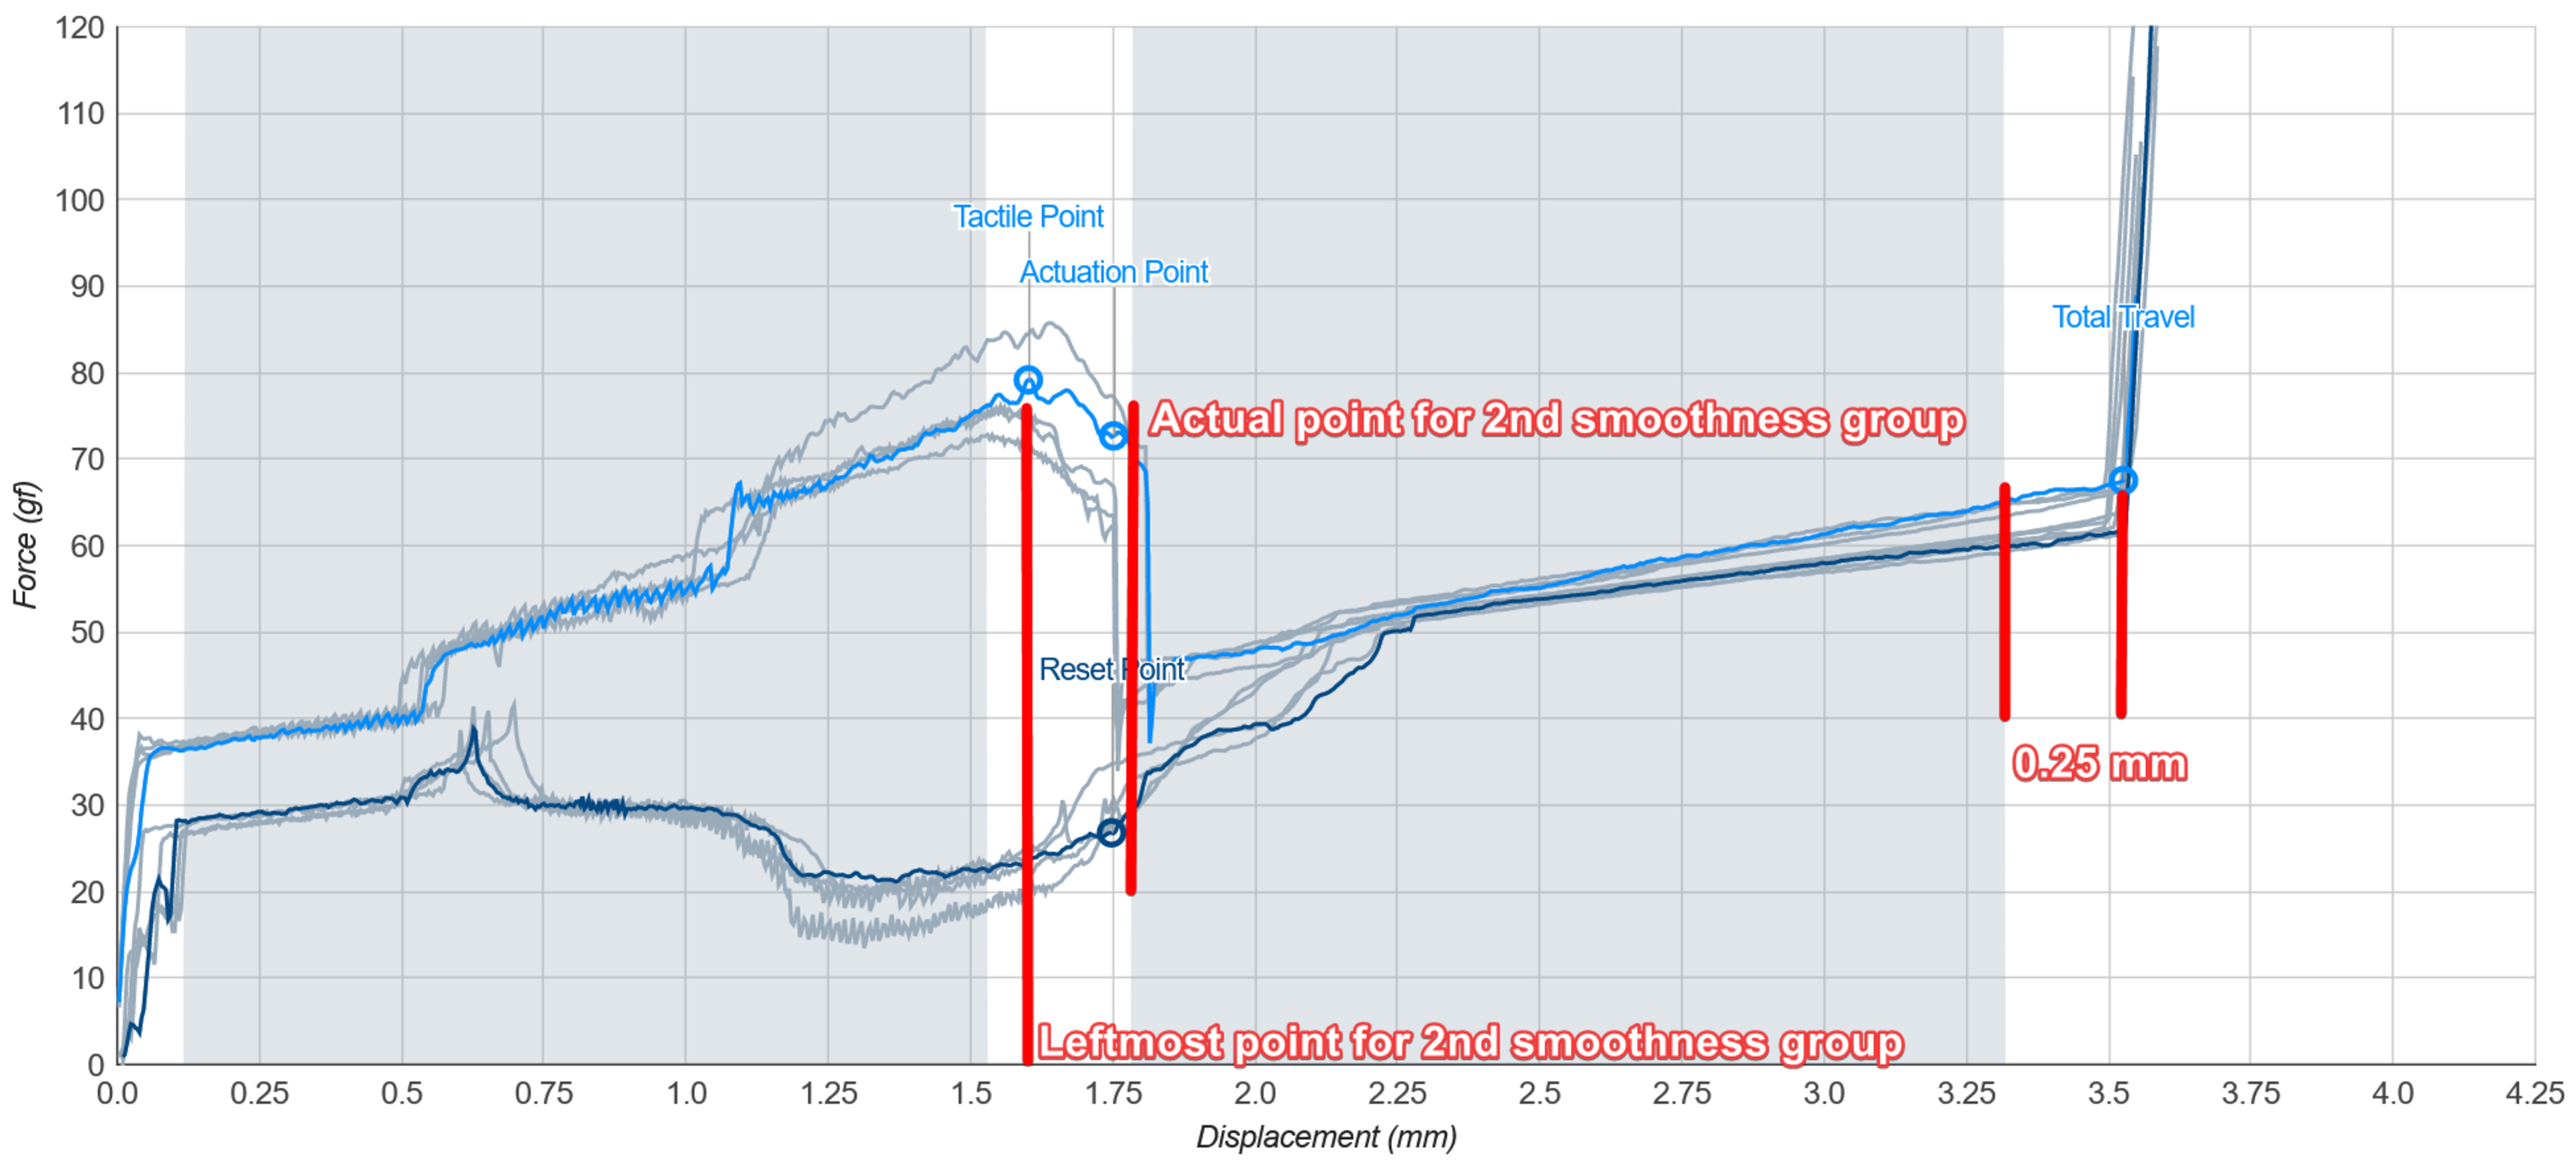
The scratchiness of the Cherry MX Speed Silver is hypothetically noticeable in the keystroke raw data.
Switches we feel are less smooth should show more noise in the keystroke graph. If we want to extract a number from the noise, we need to make the data comparable between different types of switches. For example, if we're to penalize for a higher derivative without sanitizing the data first, a clicky switch would always be worse than a linear switch.
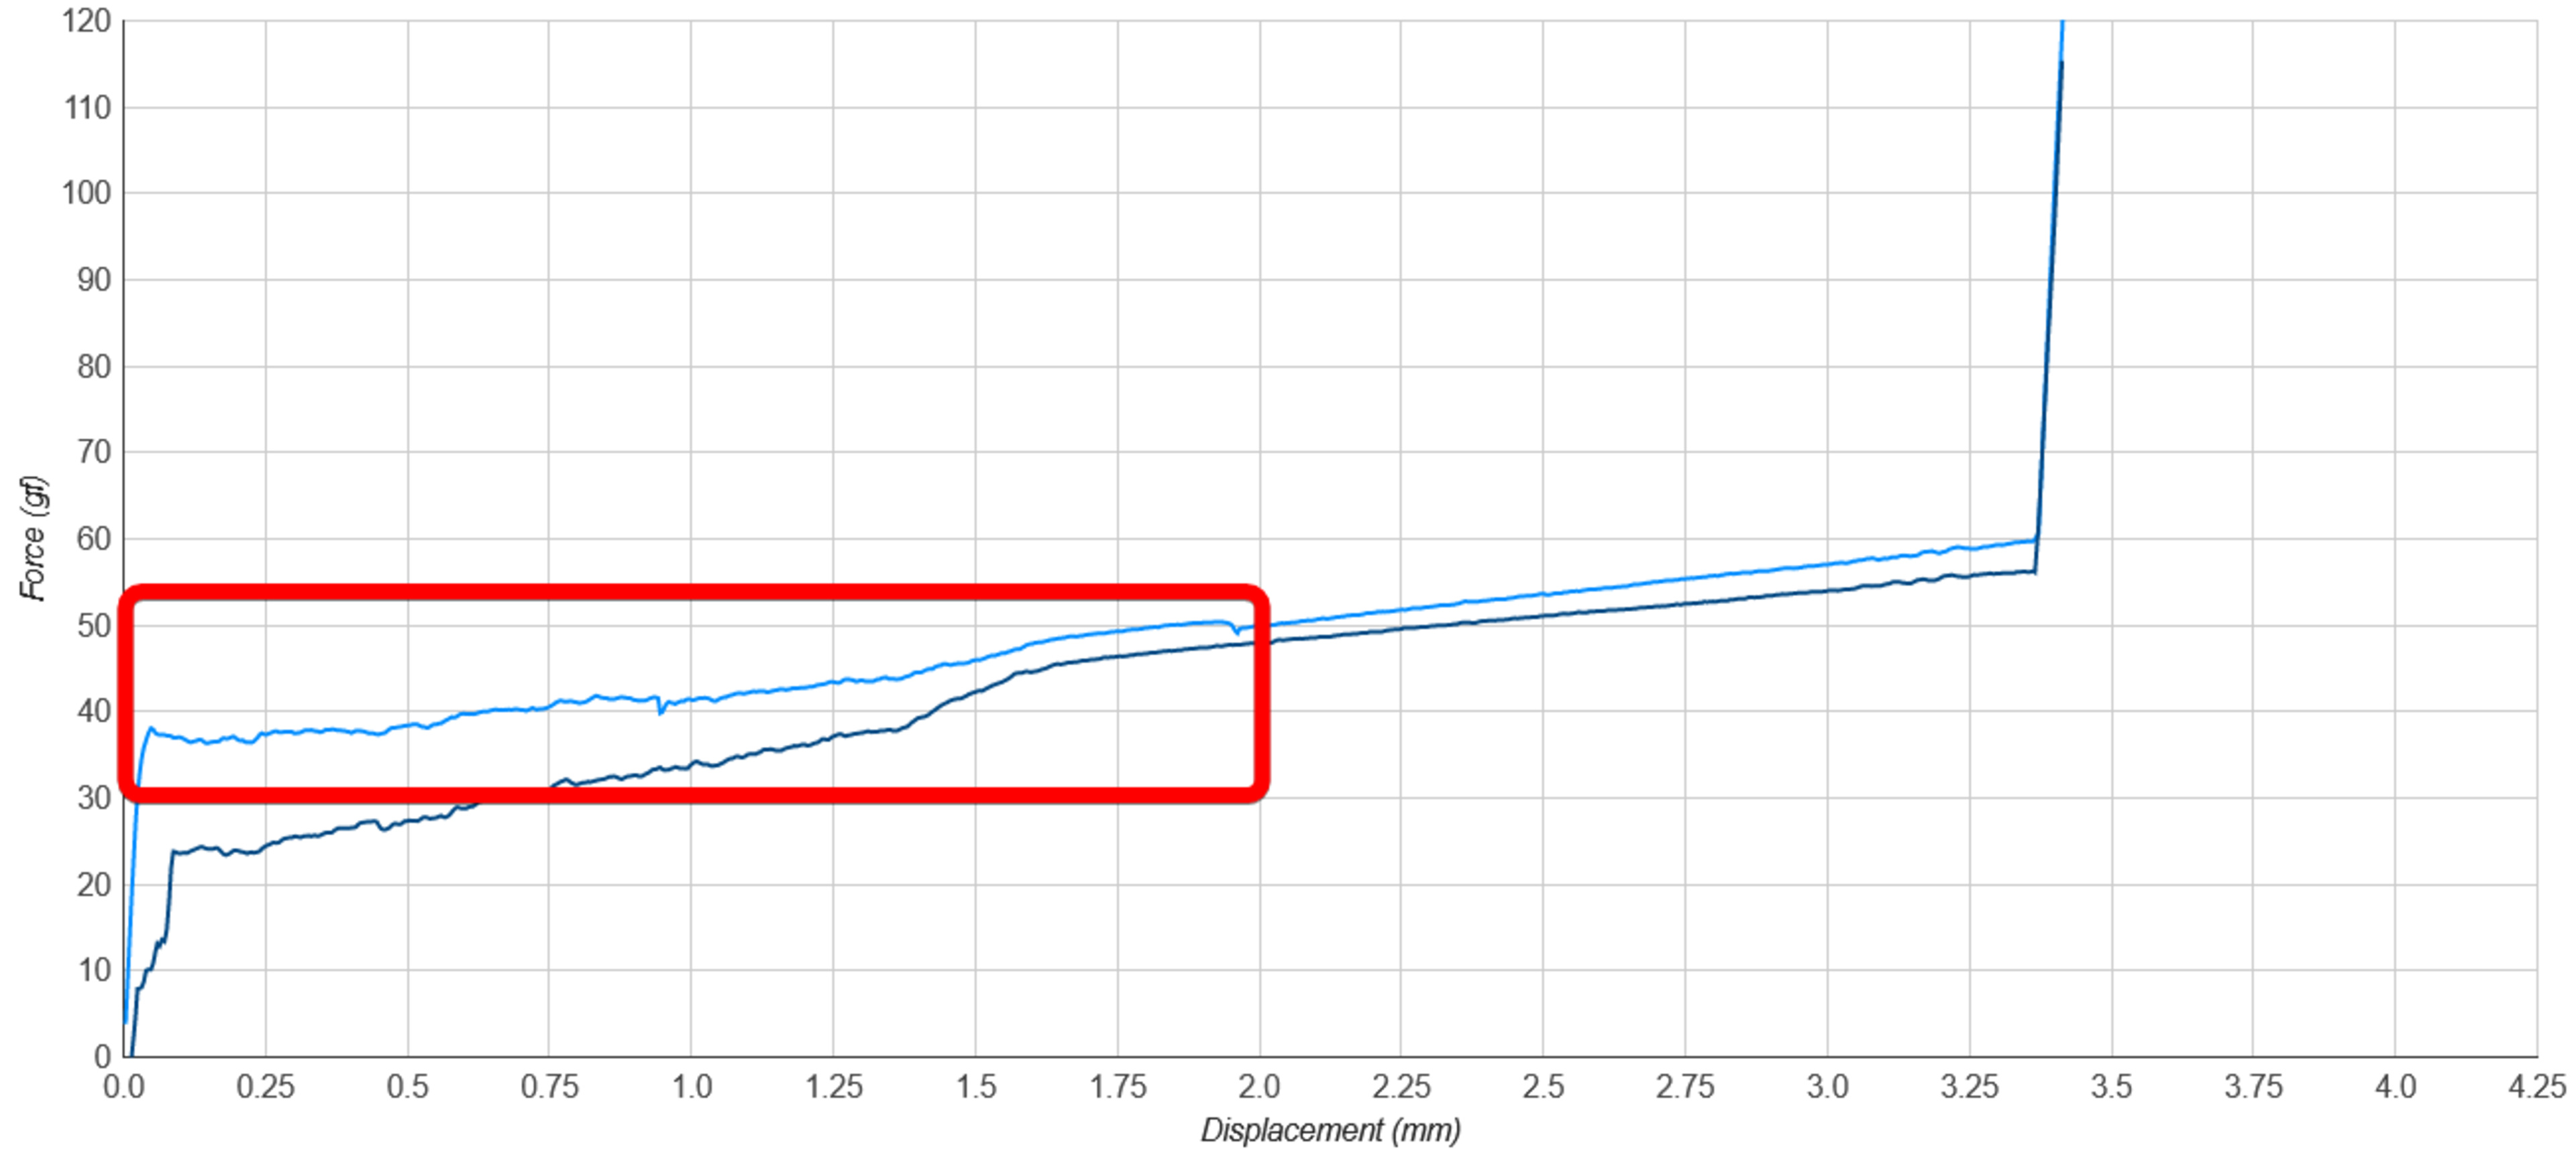
To address this risk, we want to look at the data during the smoothest phase of the switch movement. To do this, we're defining two areas:
- From 0.12mm to the tactile point, unless the area is smaller than 55 points, then the region is discarded.
- From 0.25mm from the max travel, going back as far as the tactile point until the derivative at all points is below 200 gf/mm. If it isn't, drop the leftmost point of this group and recalculate, unless the area is smaller than 55 points, then the region is discarded. This is visually described in the next figure.
Since this isn't always clear, we're adding a graph in the smoothness box to show what press data was used since this varies for every switch.
An example with the highlighted area of the Kailh White Owl Box showing data stable enough to analyze with math.
Selecting which data we'll consider is only half the job; we still need to convert this to a value.
Investigation: Scratchy Factor
From the graph data retained, we want to create a metric that correlates to smoothness. We couldn't find a popular way within the enthusiast community to measure and report switch smoothness. From our research, those who rated smoothness appeared to do it subjectively, and we want to avoid this as it will become difficult as we test upwards of 100 switches. This led us to create a metric to quantify the amount of noise in the data.
Our approach calculates a moving average on the two sections we have highlighted. This gives us a reference of what this model's theoretical "perfect" switch would be like. We then calculate the difference from the actual points to the moving average. This boils down to a cumulative deviation. Since our regions won't always be the same size, we normalize the error by the size of the highlighted area. Finally, since this is often a small value, we multiply it by 10,000 to bring it back to a range that is easier to compare.
One thing to note is that we only calculate this scratchy factor on the press data. Currently, we don't use the return data.
We compared our early results to our subjective impressions. For the most part, the scratchy factor does a good job of sorting switches, but there are some issues. Most of us felt like the Kailh Box Navy are rather smooth, but they got the worst scratchy factor score of our initial five results. The other issue is that we felt the Kailh Super Speed Silver switches were smoother than the Cherry MX Speed Silver switches, but the scratchy scores we assigned got them in the wrong order.
This test is very sensitive to noise, so we're giving ourselves the best chance, and we're averaging the scratchy factor of the five samples.
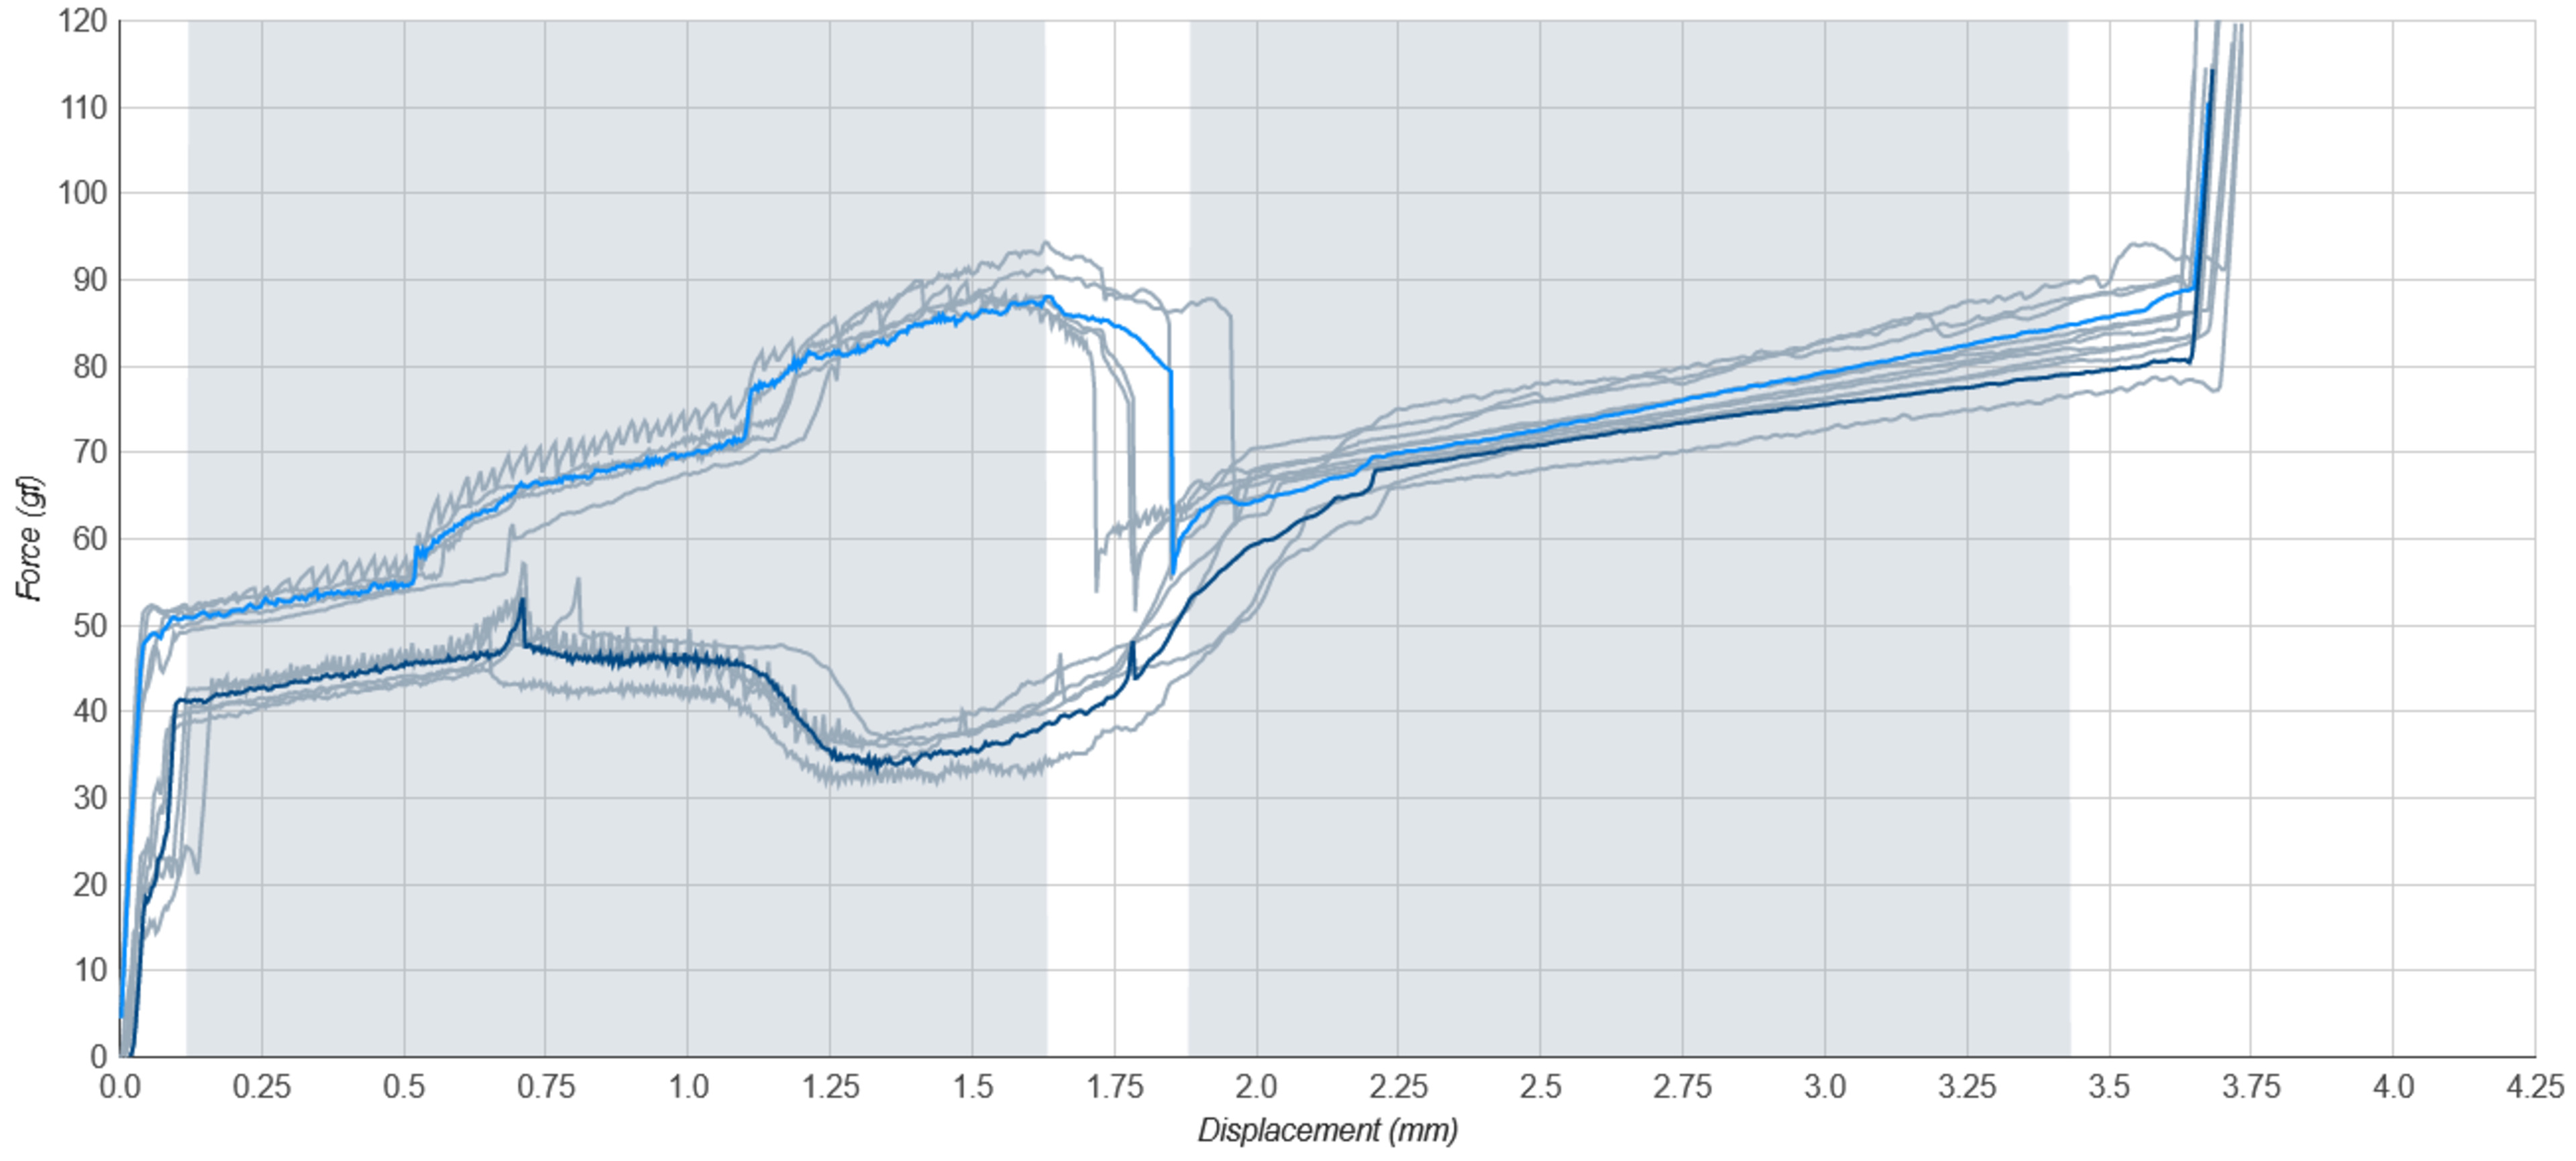
Example of a Kailh Box Thick Clicky Navy sample being much noisier than the others.
We don't think we can address this discrepancy with this metric using math alone, so another test is required to get results that better correlate to our subjective experience. We aim to evaluate smoothness by its simplest expression, even if we lose some precision with our results. We can accept a few permutations in the score order of the switches, but there should be no major outliers.
Investigation: Audible Noise
We noticed that many of the testers in our blind test brought the switch to their ear to press it a few times before making a statement about its smoothness. We did expect that switch smoothness would be more complex than just the noise in keystroke data.
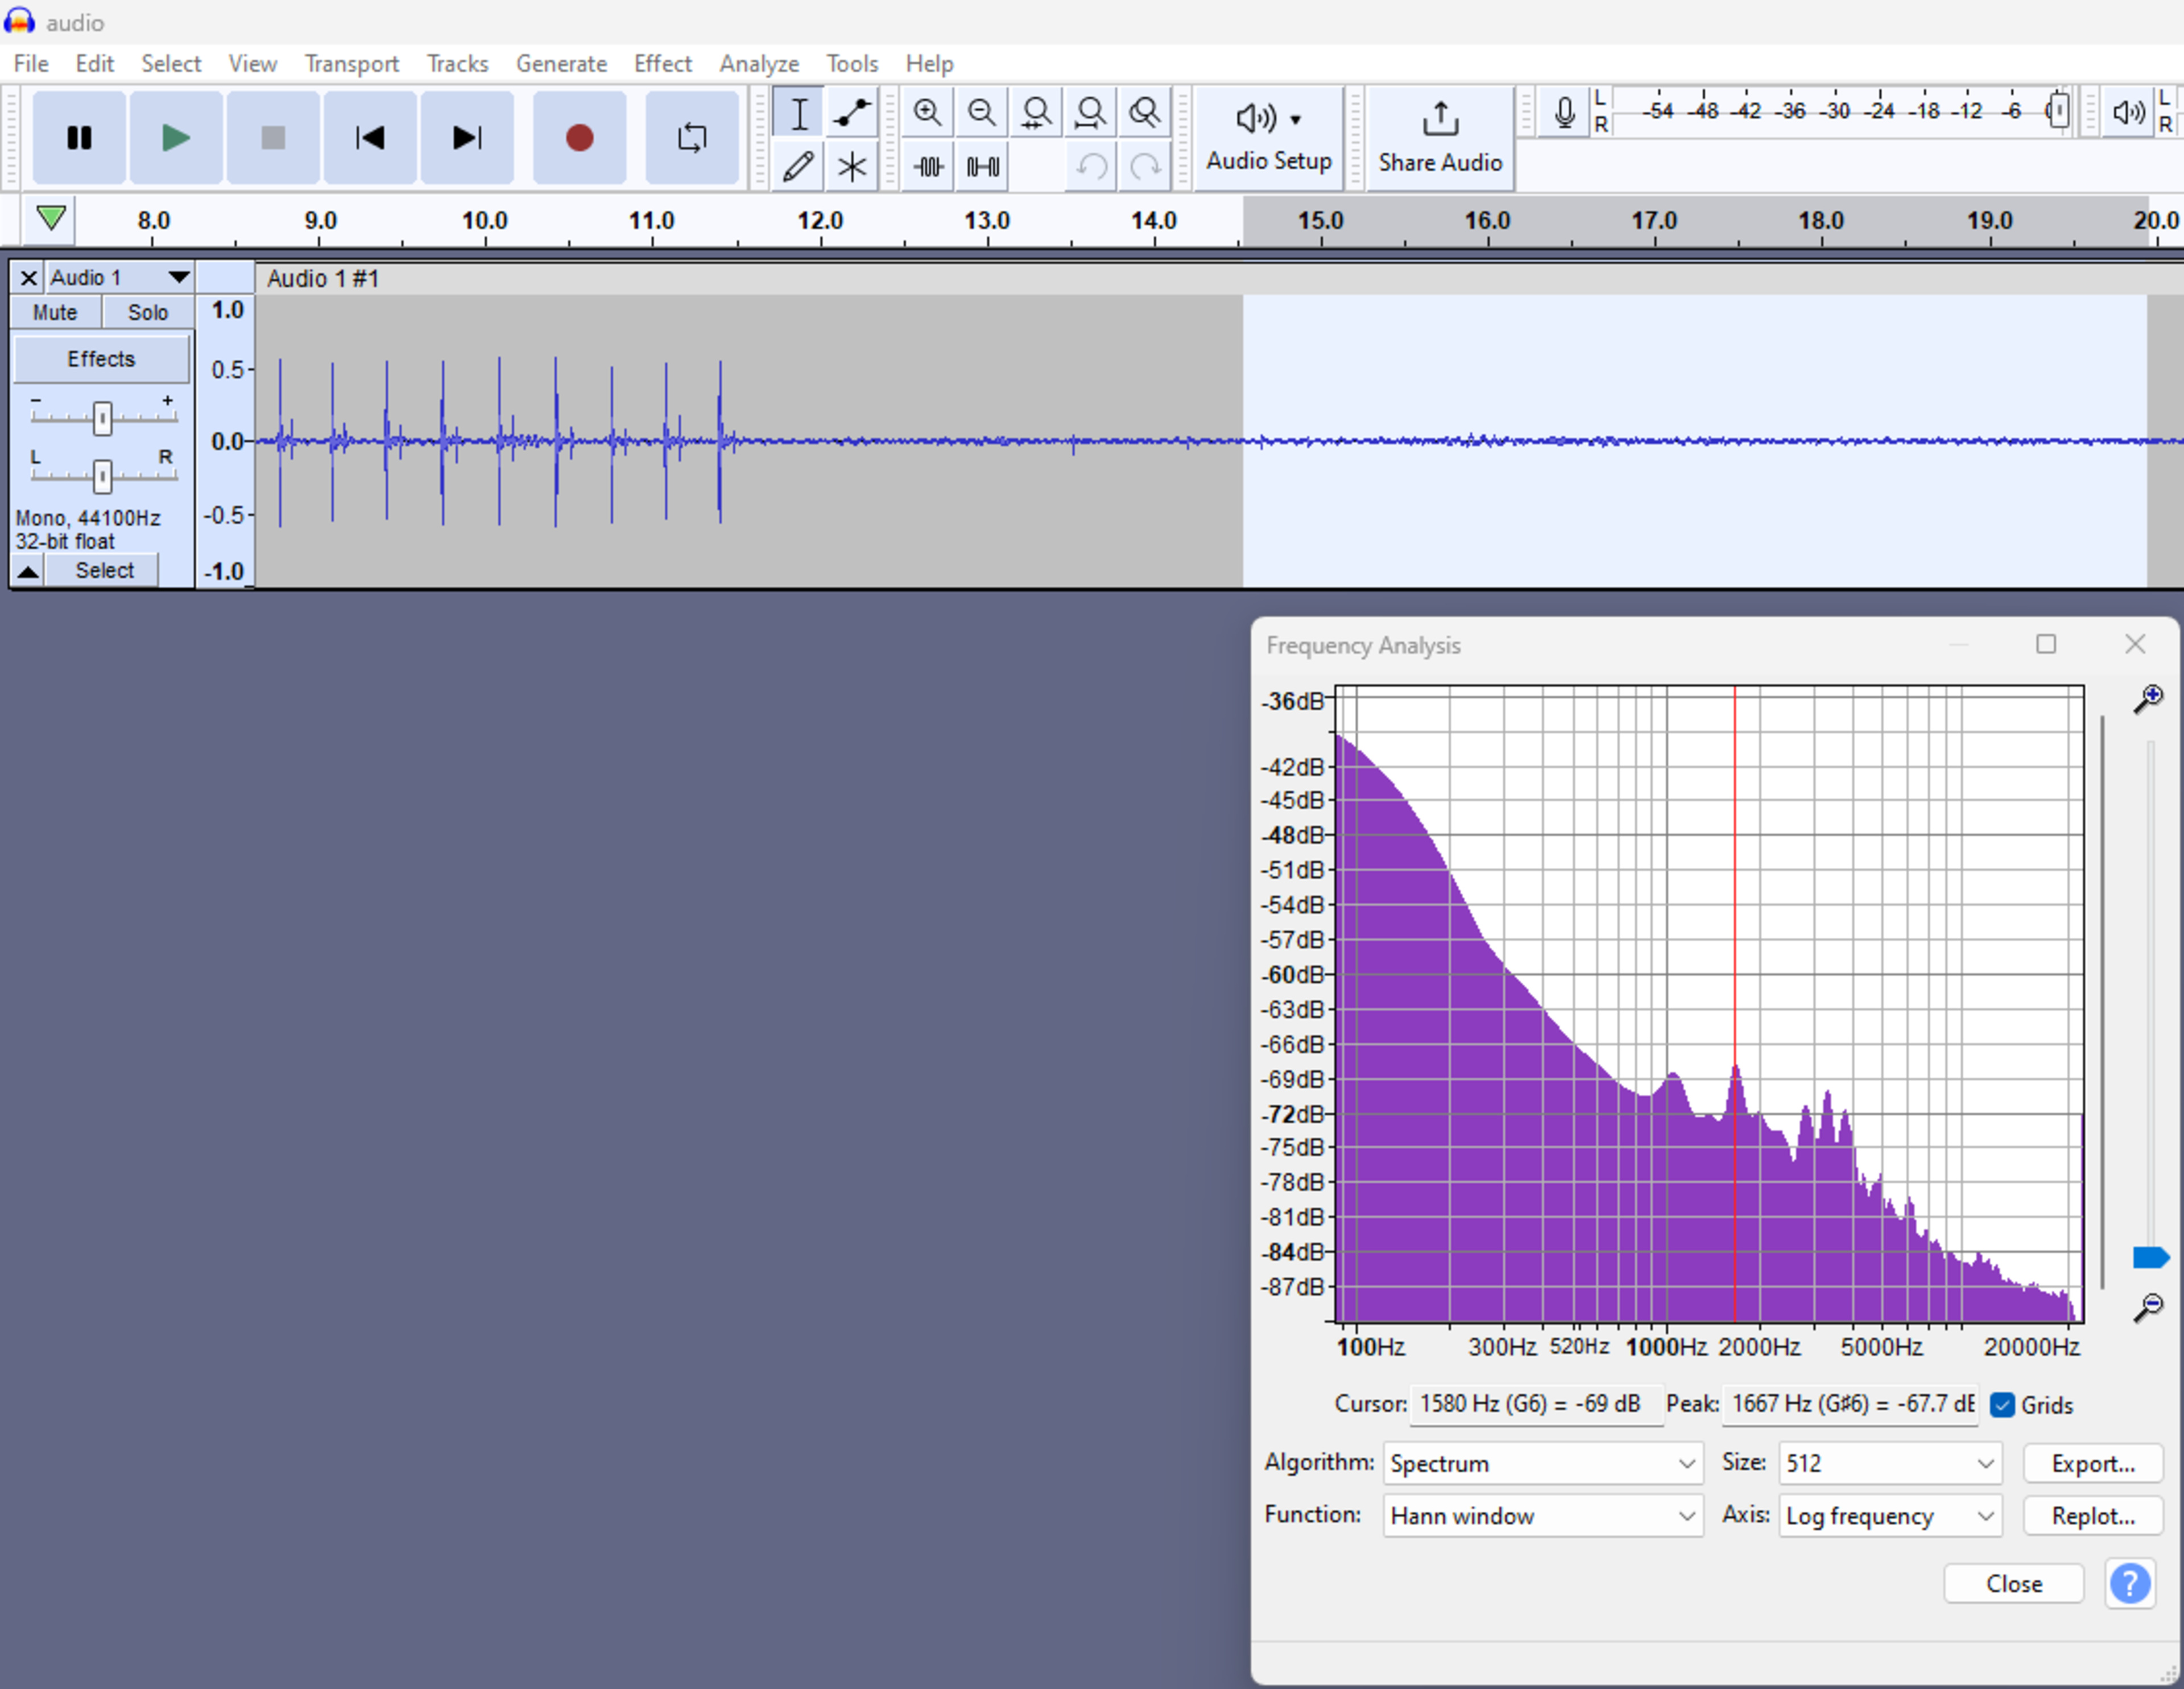
To replicate this and measure it, we place the switch into an Epomaker EP-21/TS-21 Keypad and place a keycap on top. We then place a mic (Dayton Audio) at a distance of 5cm from the switch and connect it to a Scarlett interface. We record the audio and analyze it using Audacity.
Switch smoothness noise test setup.
The audio captured using Audacity is not the audio from the video. The audio from the video is captured using an external mic plugged directly into the camera.
During the recording, we repeatedly press the switch in a normal fashion. This gives an idea of how the switch sounds. We do this for about five to eight seconds. After that, we do small partial presses and releases, oscillating the switch between any bumps that could introduce mechanical noise that isn't a product of friction between parts (top of travel, bottom of travel, and any click bars). This wiggling audio is the audio section we use for the smoothness information. See an example:
After the test, we select a large audio region of the switch wiggling in its smooth region, and we do a plot spectrum (FFT). From there, we get the highest peak between 1 and 5 kHz. We note both the frequency and the noise value. This helps us penalize for a springy/pingy sound.
Switch noise analysis of the NuPhy Polaris switch.
Solution
This is what the factory smoothness test looks like in the review:
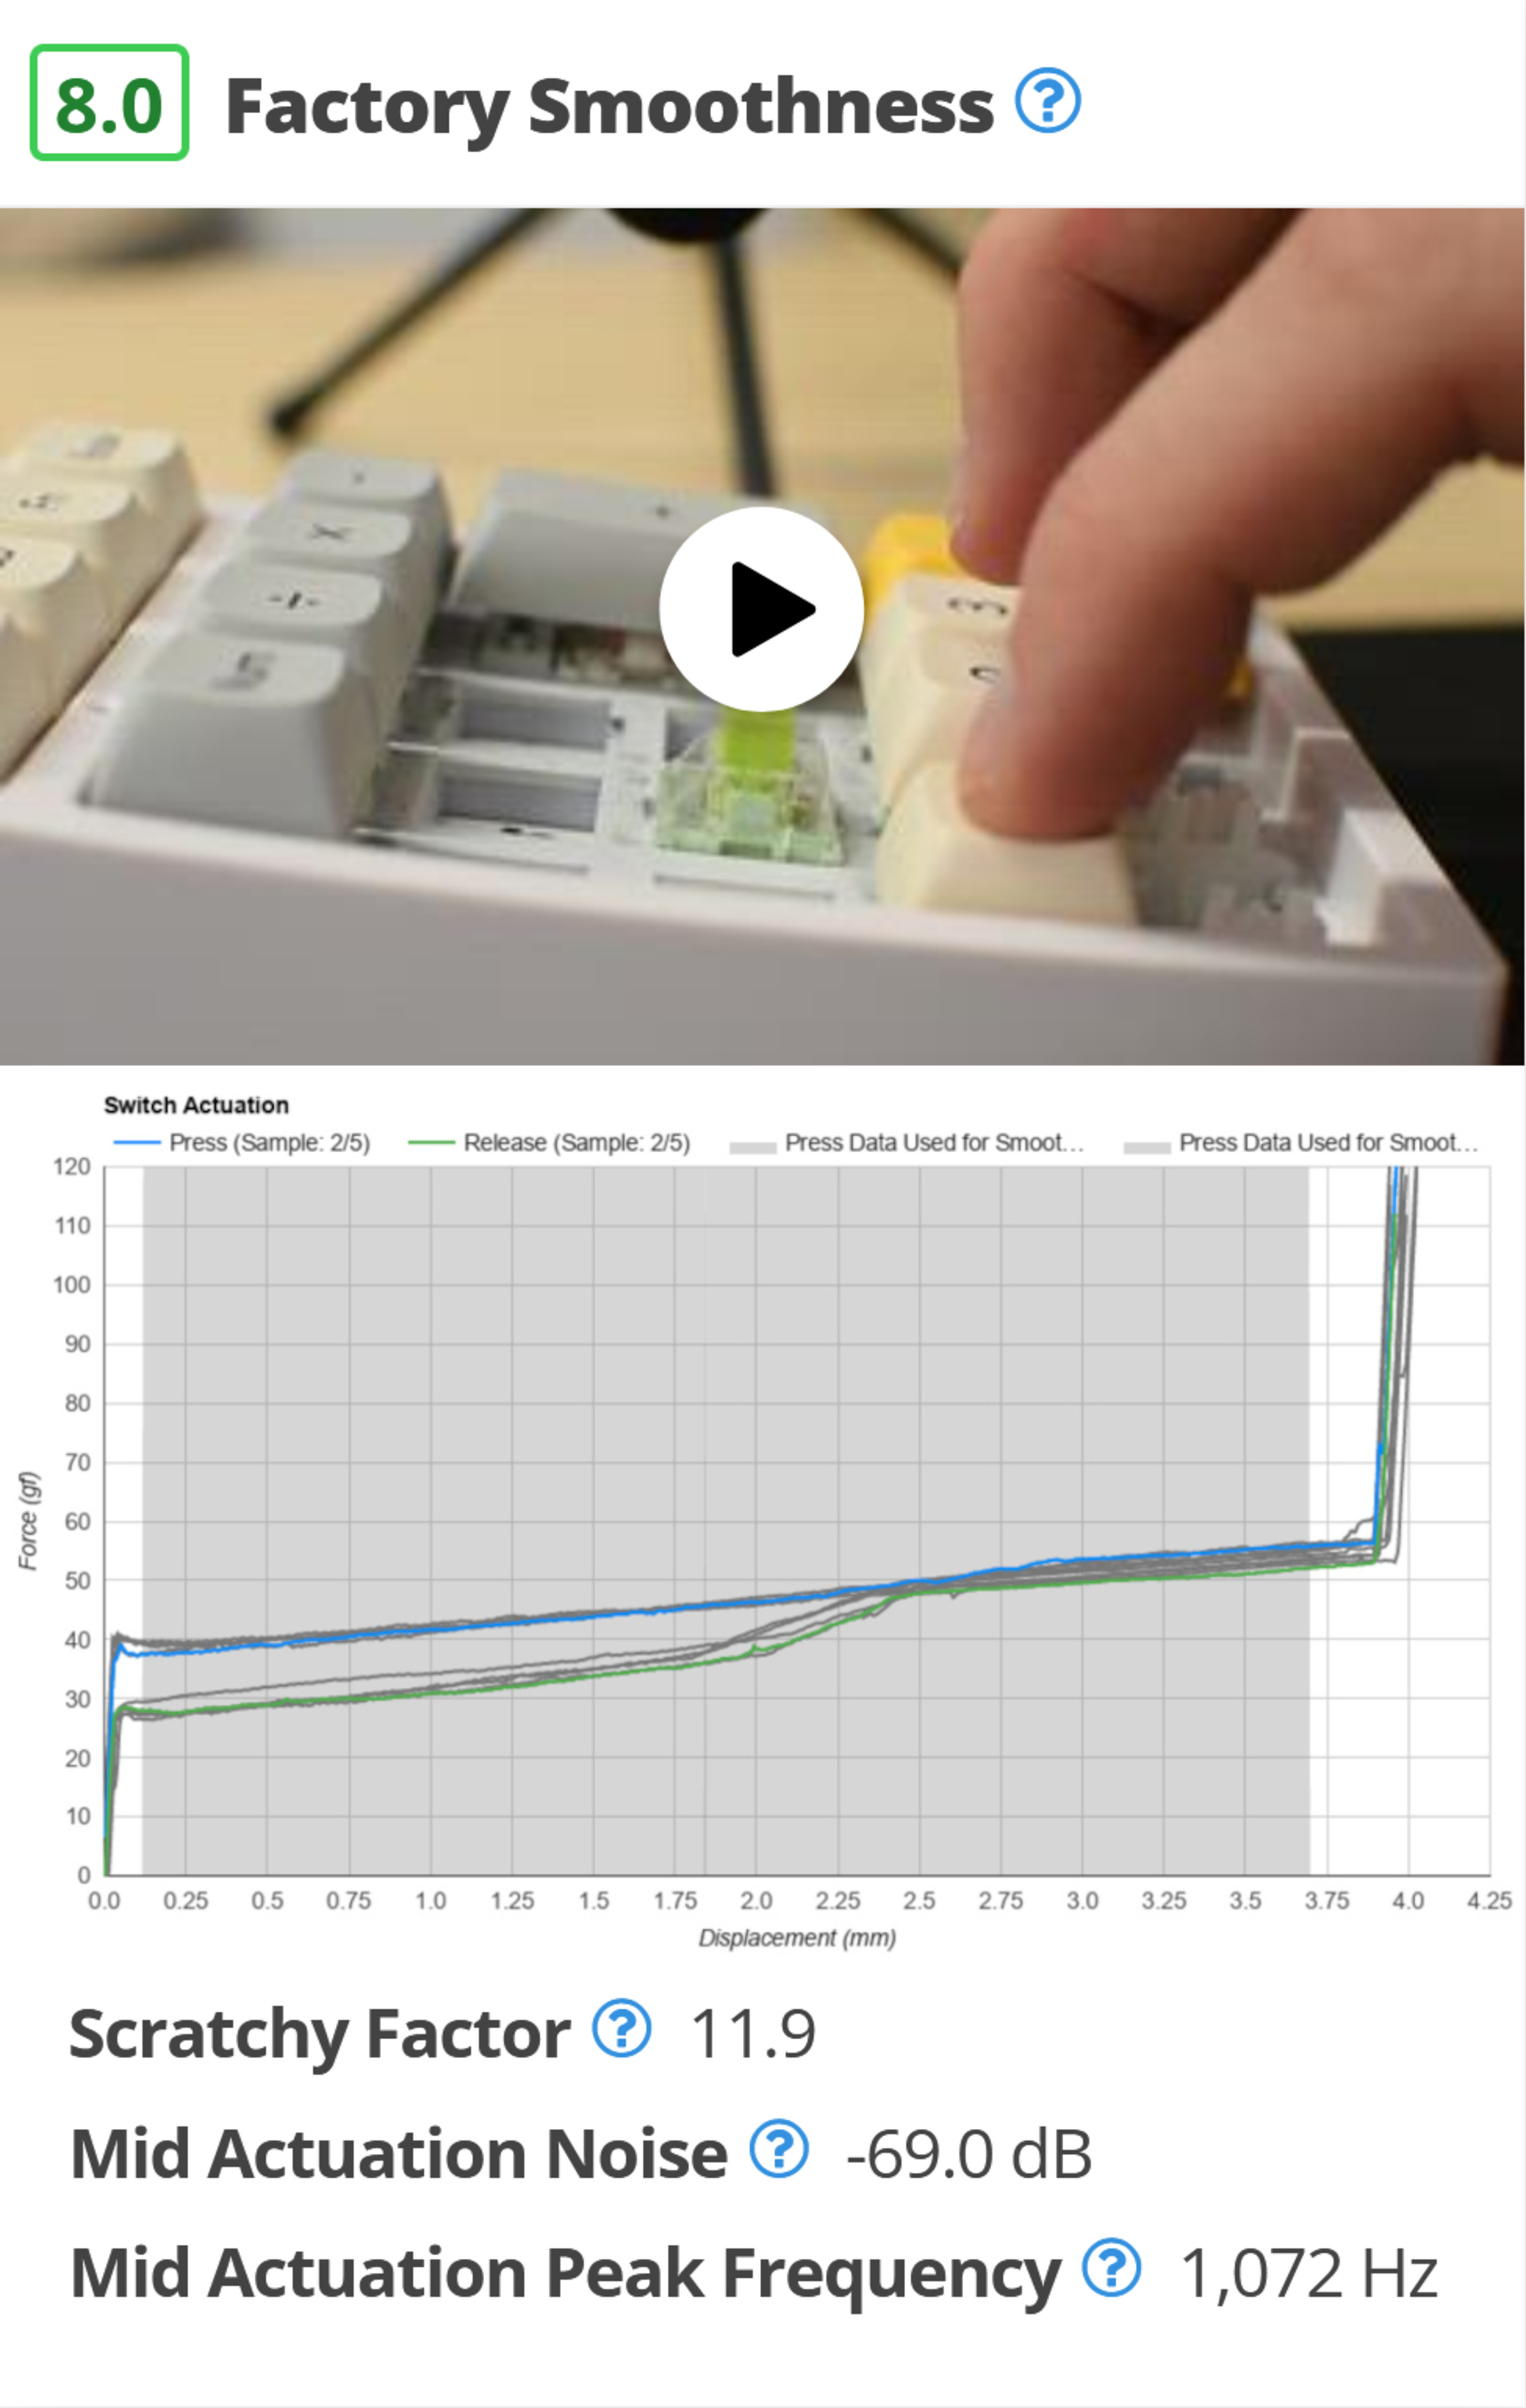
Smoothness section example from TTC Ace V2 switch review.
55% of the score is based on the noise level, 15% on the noise frequency, and 30% from the scratchy factor. The noise is measured while wiggling the switch between bars and bumps and doesn't measure the loudest noise the switch makes. This is to evaluate the smoothness only and to fairly compare all the switches; otherwise, clicky switches would fare a lot worse.
Results
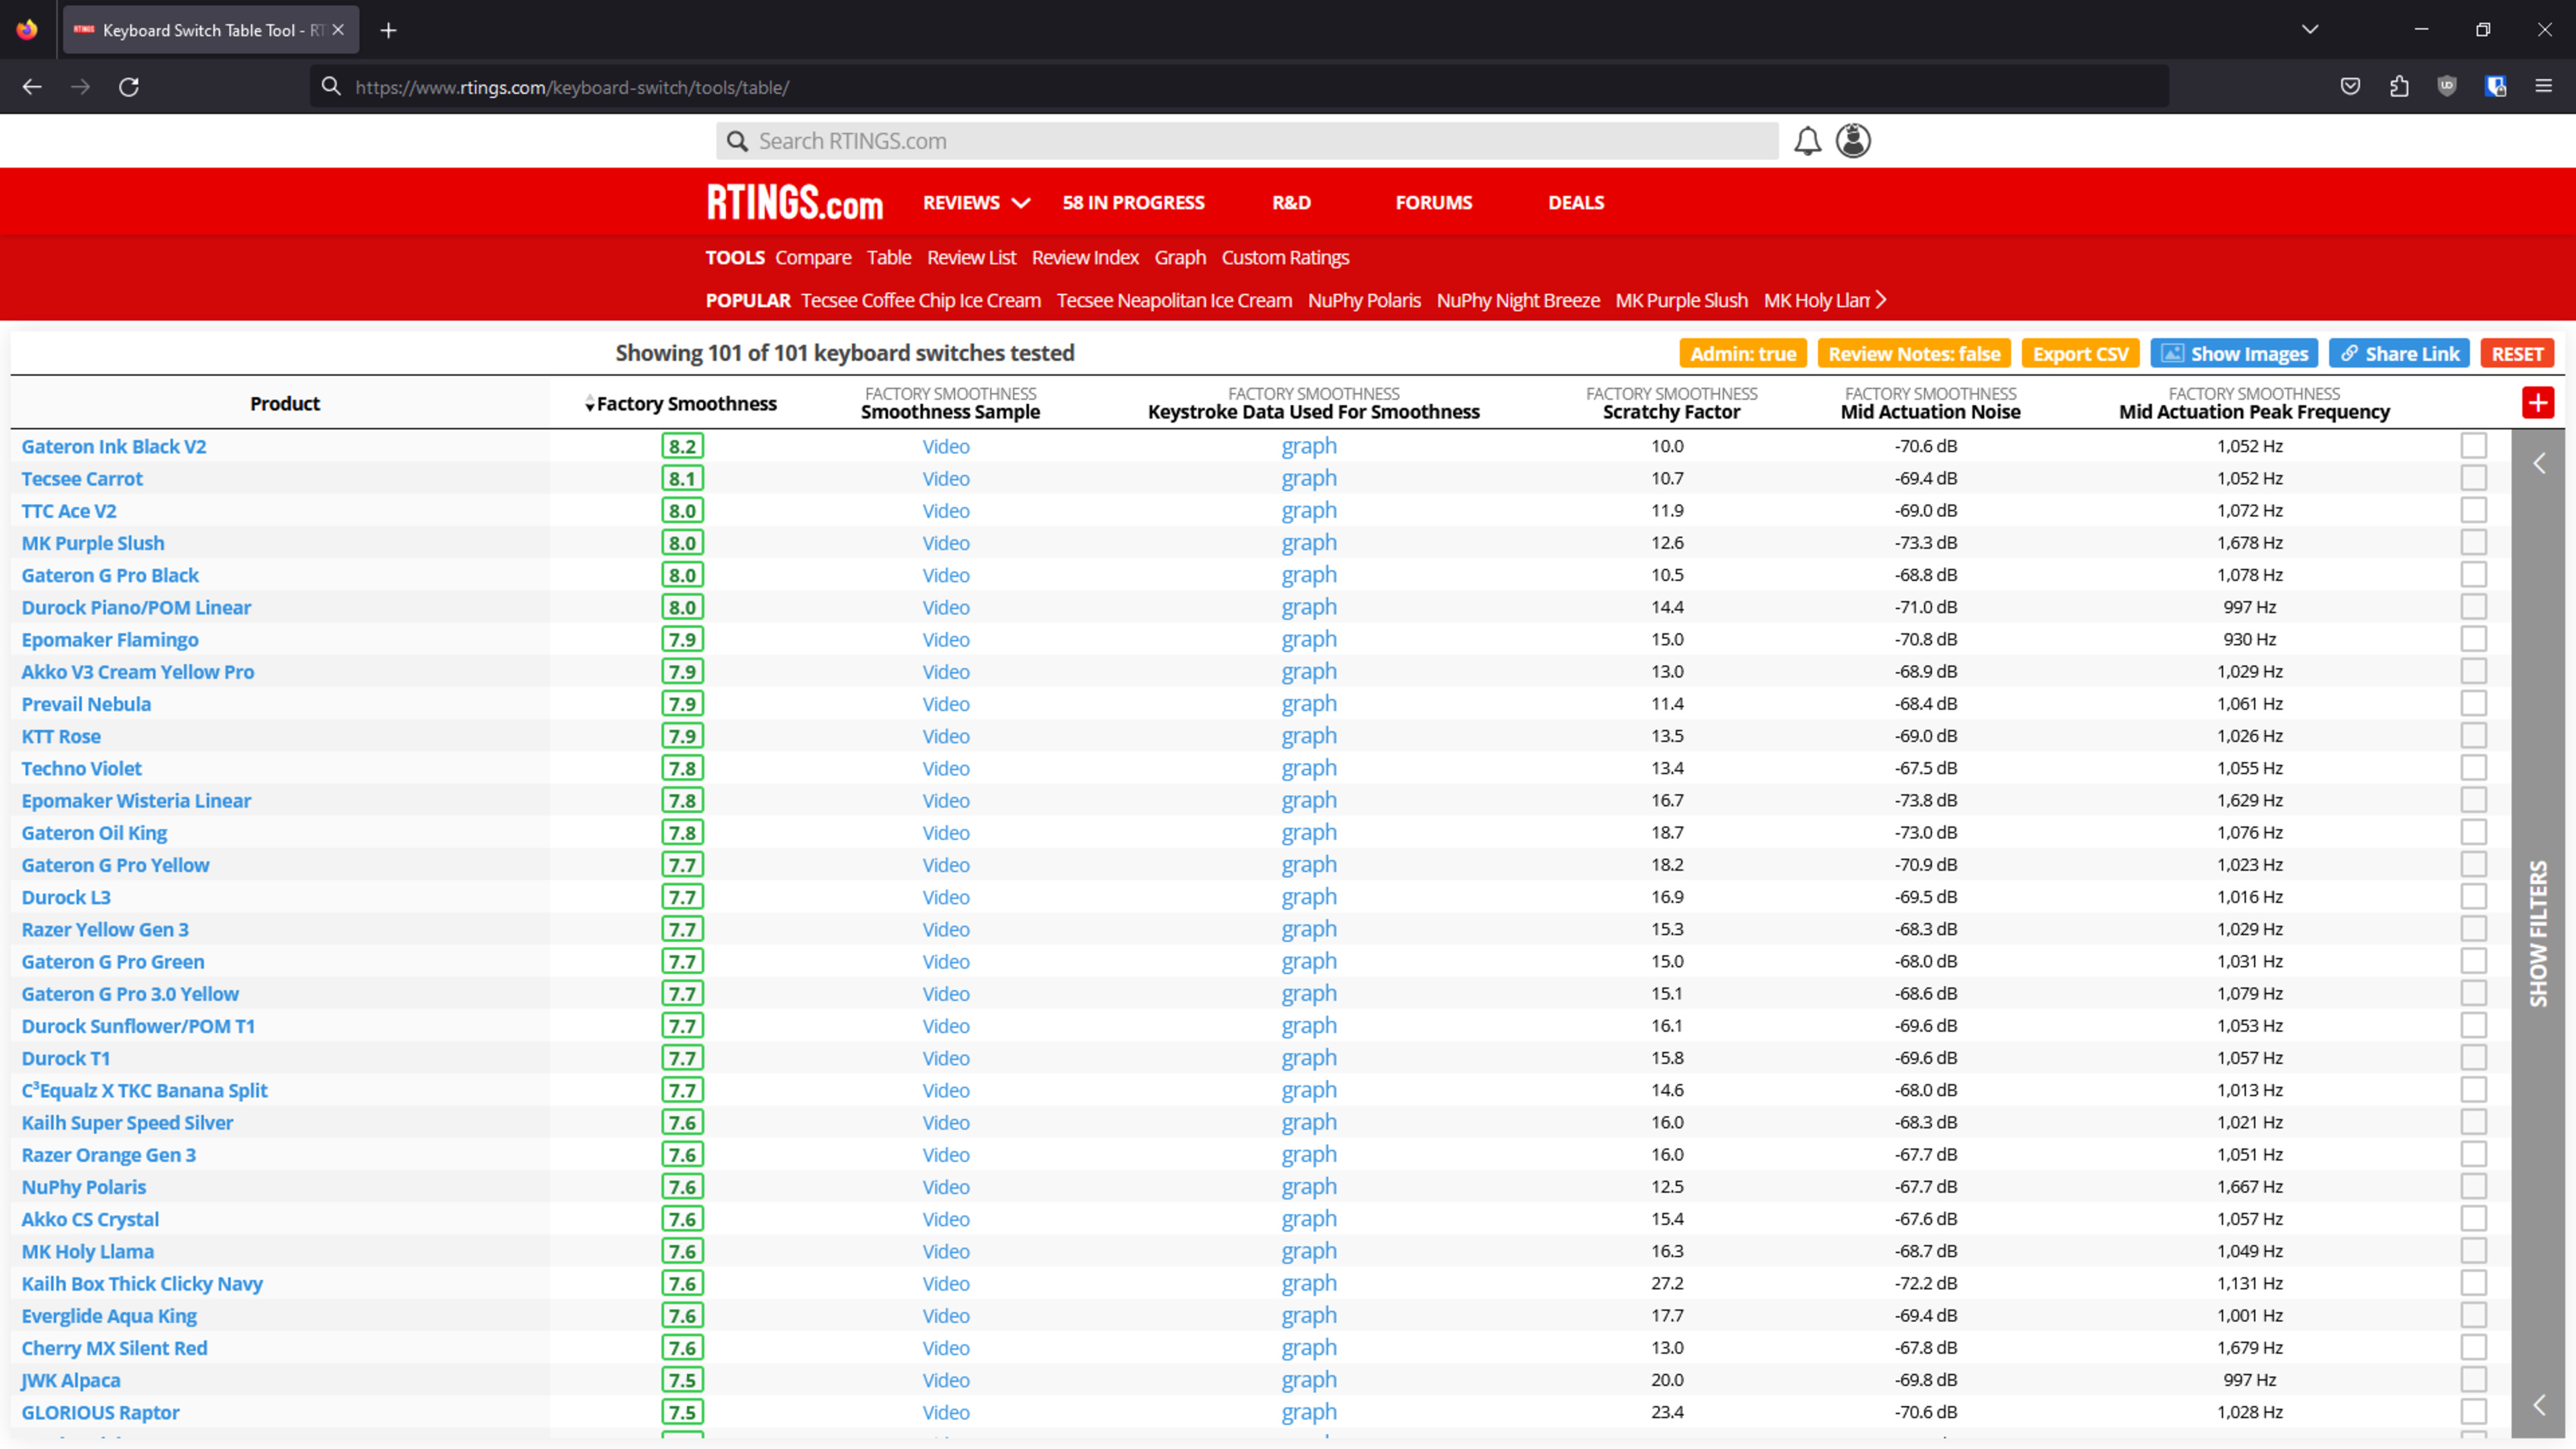
Final factory smoothness results sorted by best score.
None of the switches that we purchased should score close to 10. This is because a 10 represents the ideal switch that doesn't exist (think of a maglev switch). A score of 9 is reserved for a theoretical factory switch that comes with an amazing custom lube job. Custom lubed switches from Etsy, for example, may score around a 9.
The Gateron Oil King switches are near the top, and while they're often compared to Gateron Ink Black V2 switches, we didn't expect the Ink V2 to come out on top. Nonetheless, we're comfortable with this result. The score is close but differs by 0.4, which is small enough that it shouldn't lead anyone to think one is drastically better than the other.
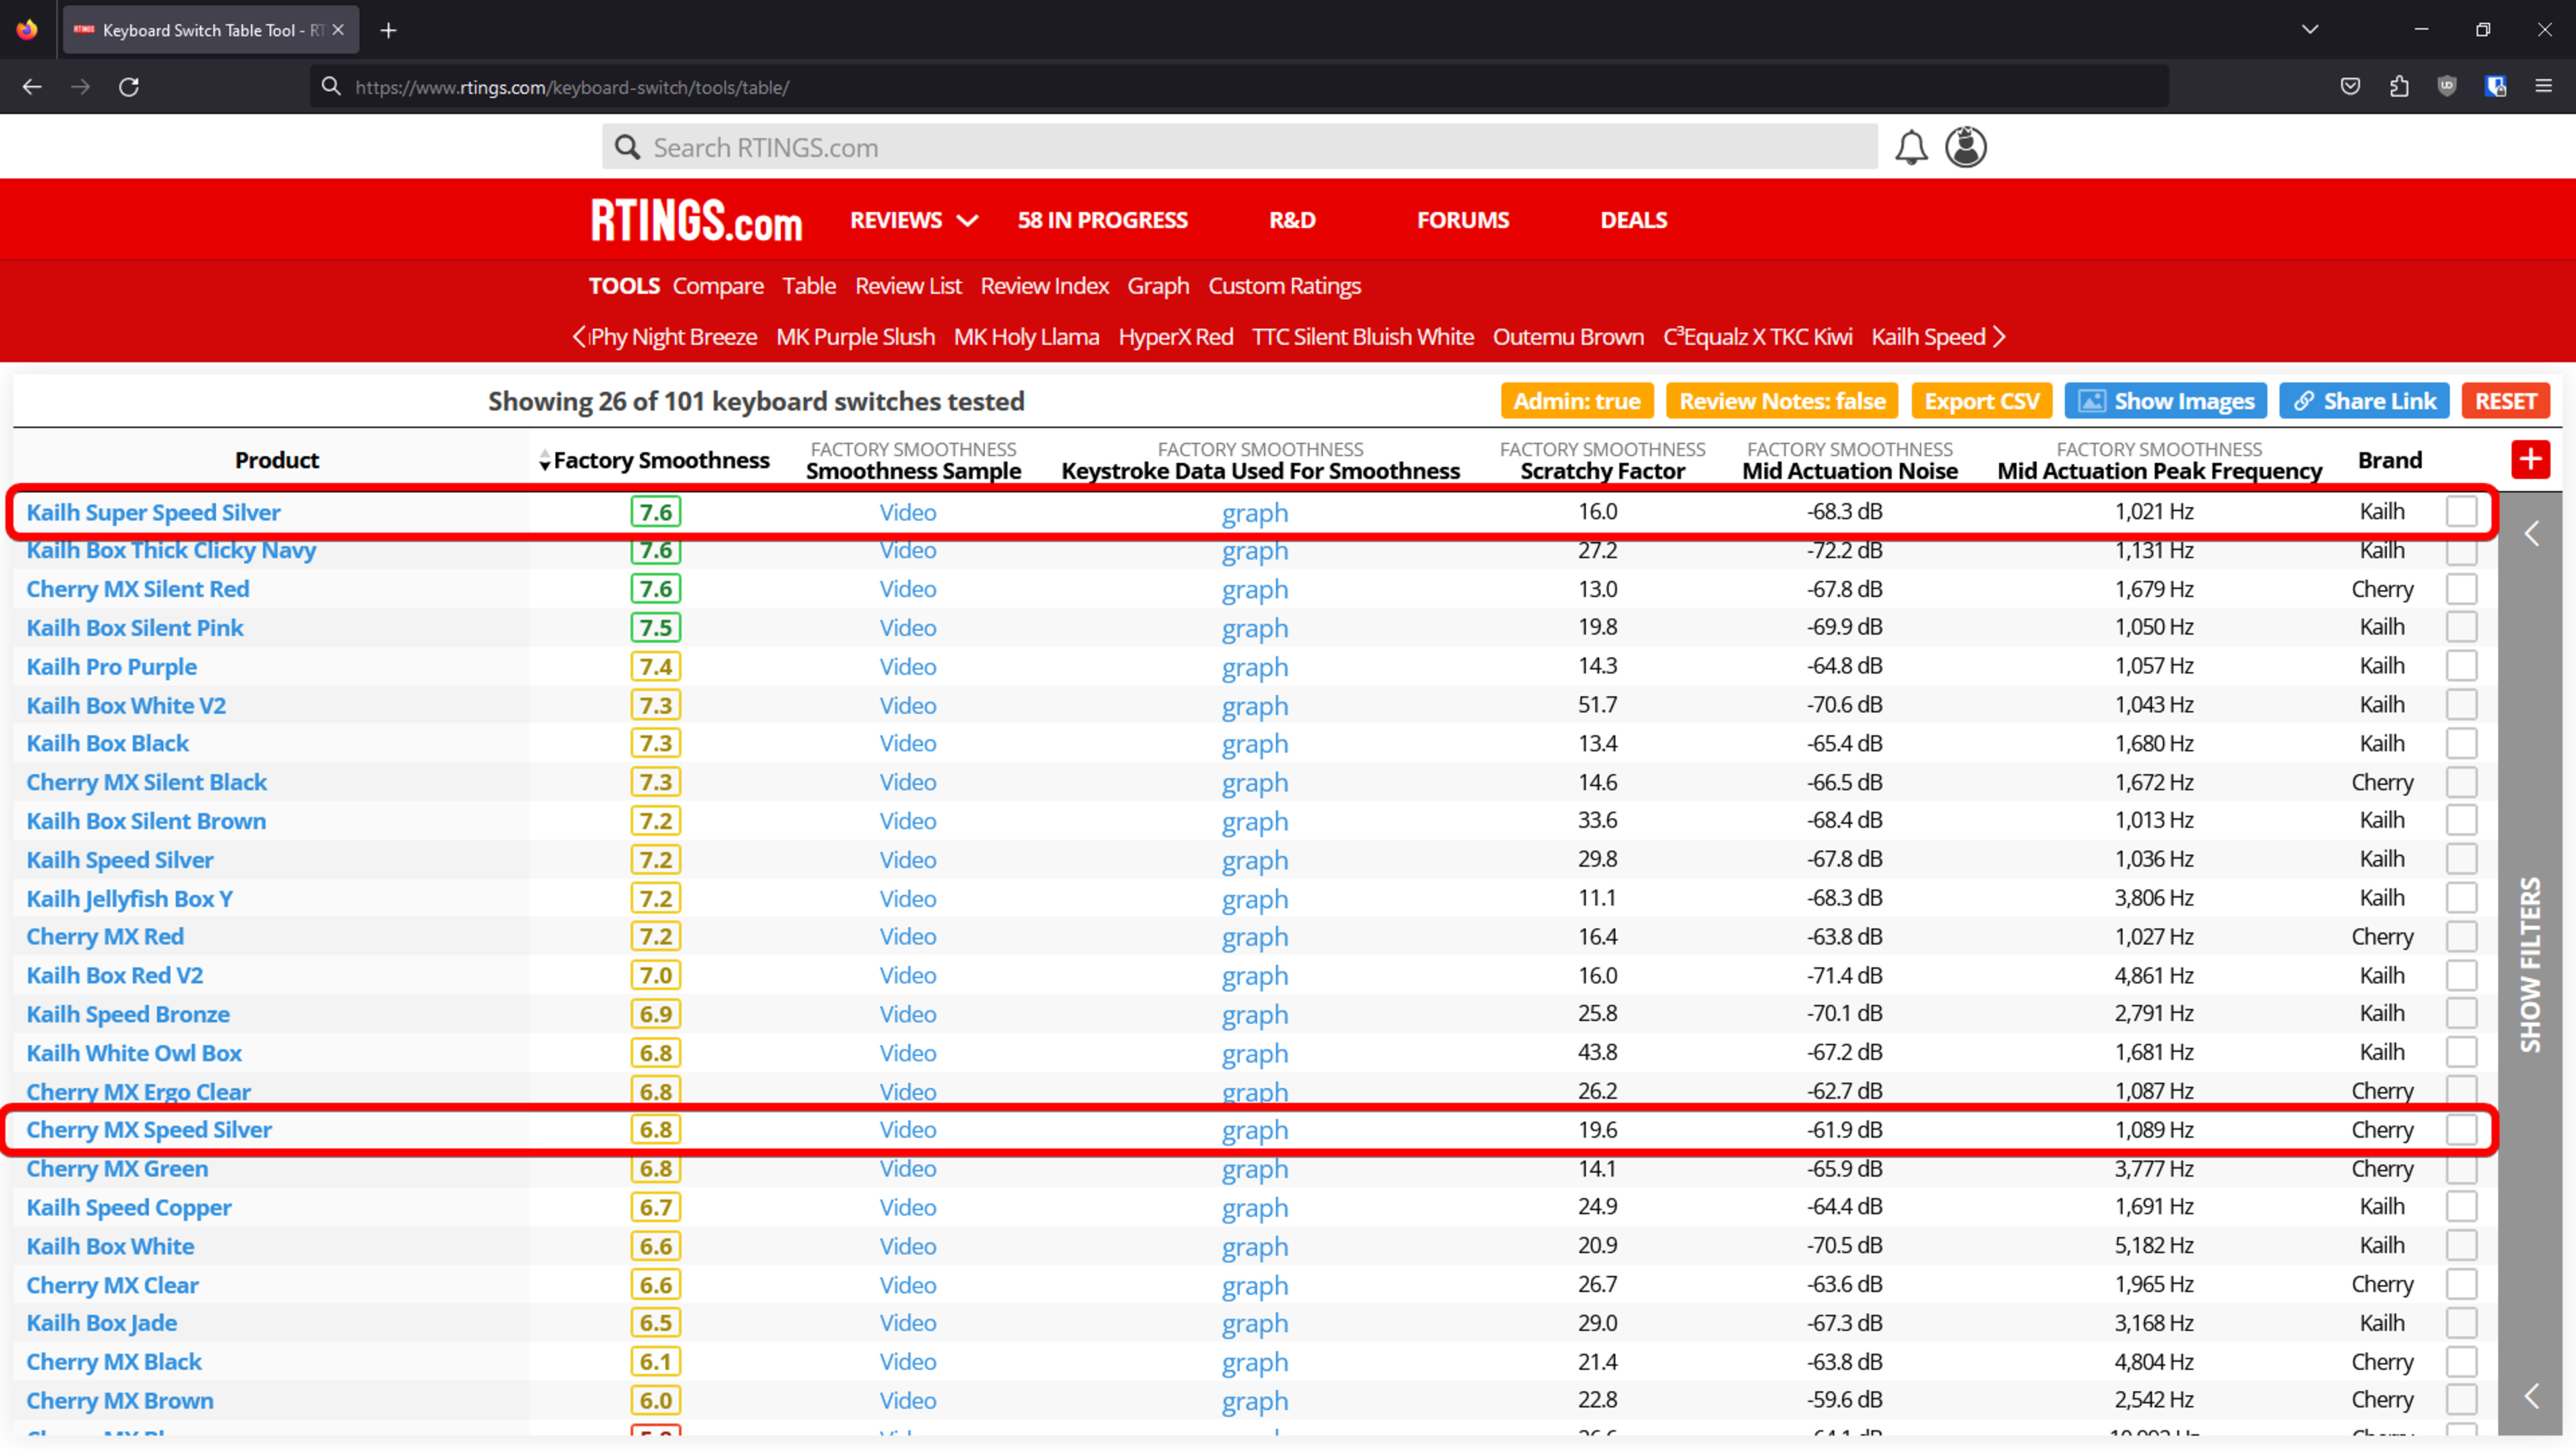
The Kailh Super Speed Silver switches are smoother than Cherry MX Speed Silver switches, which matches our subjective impressions.
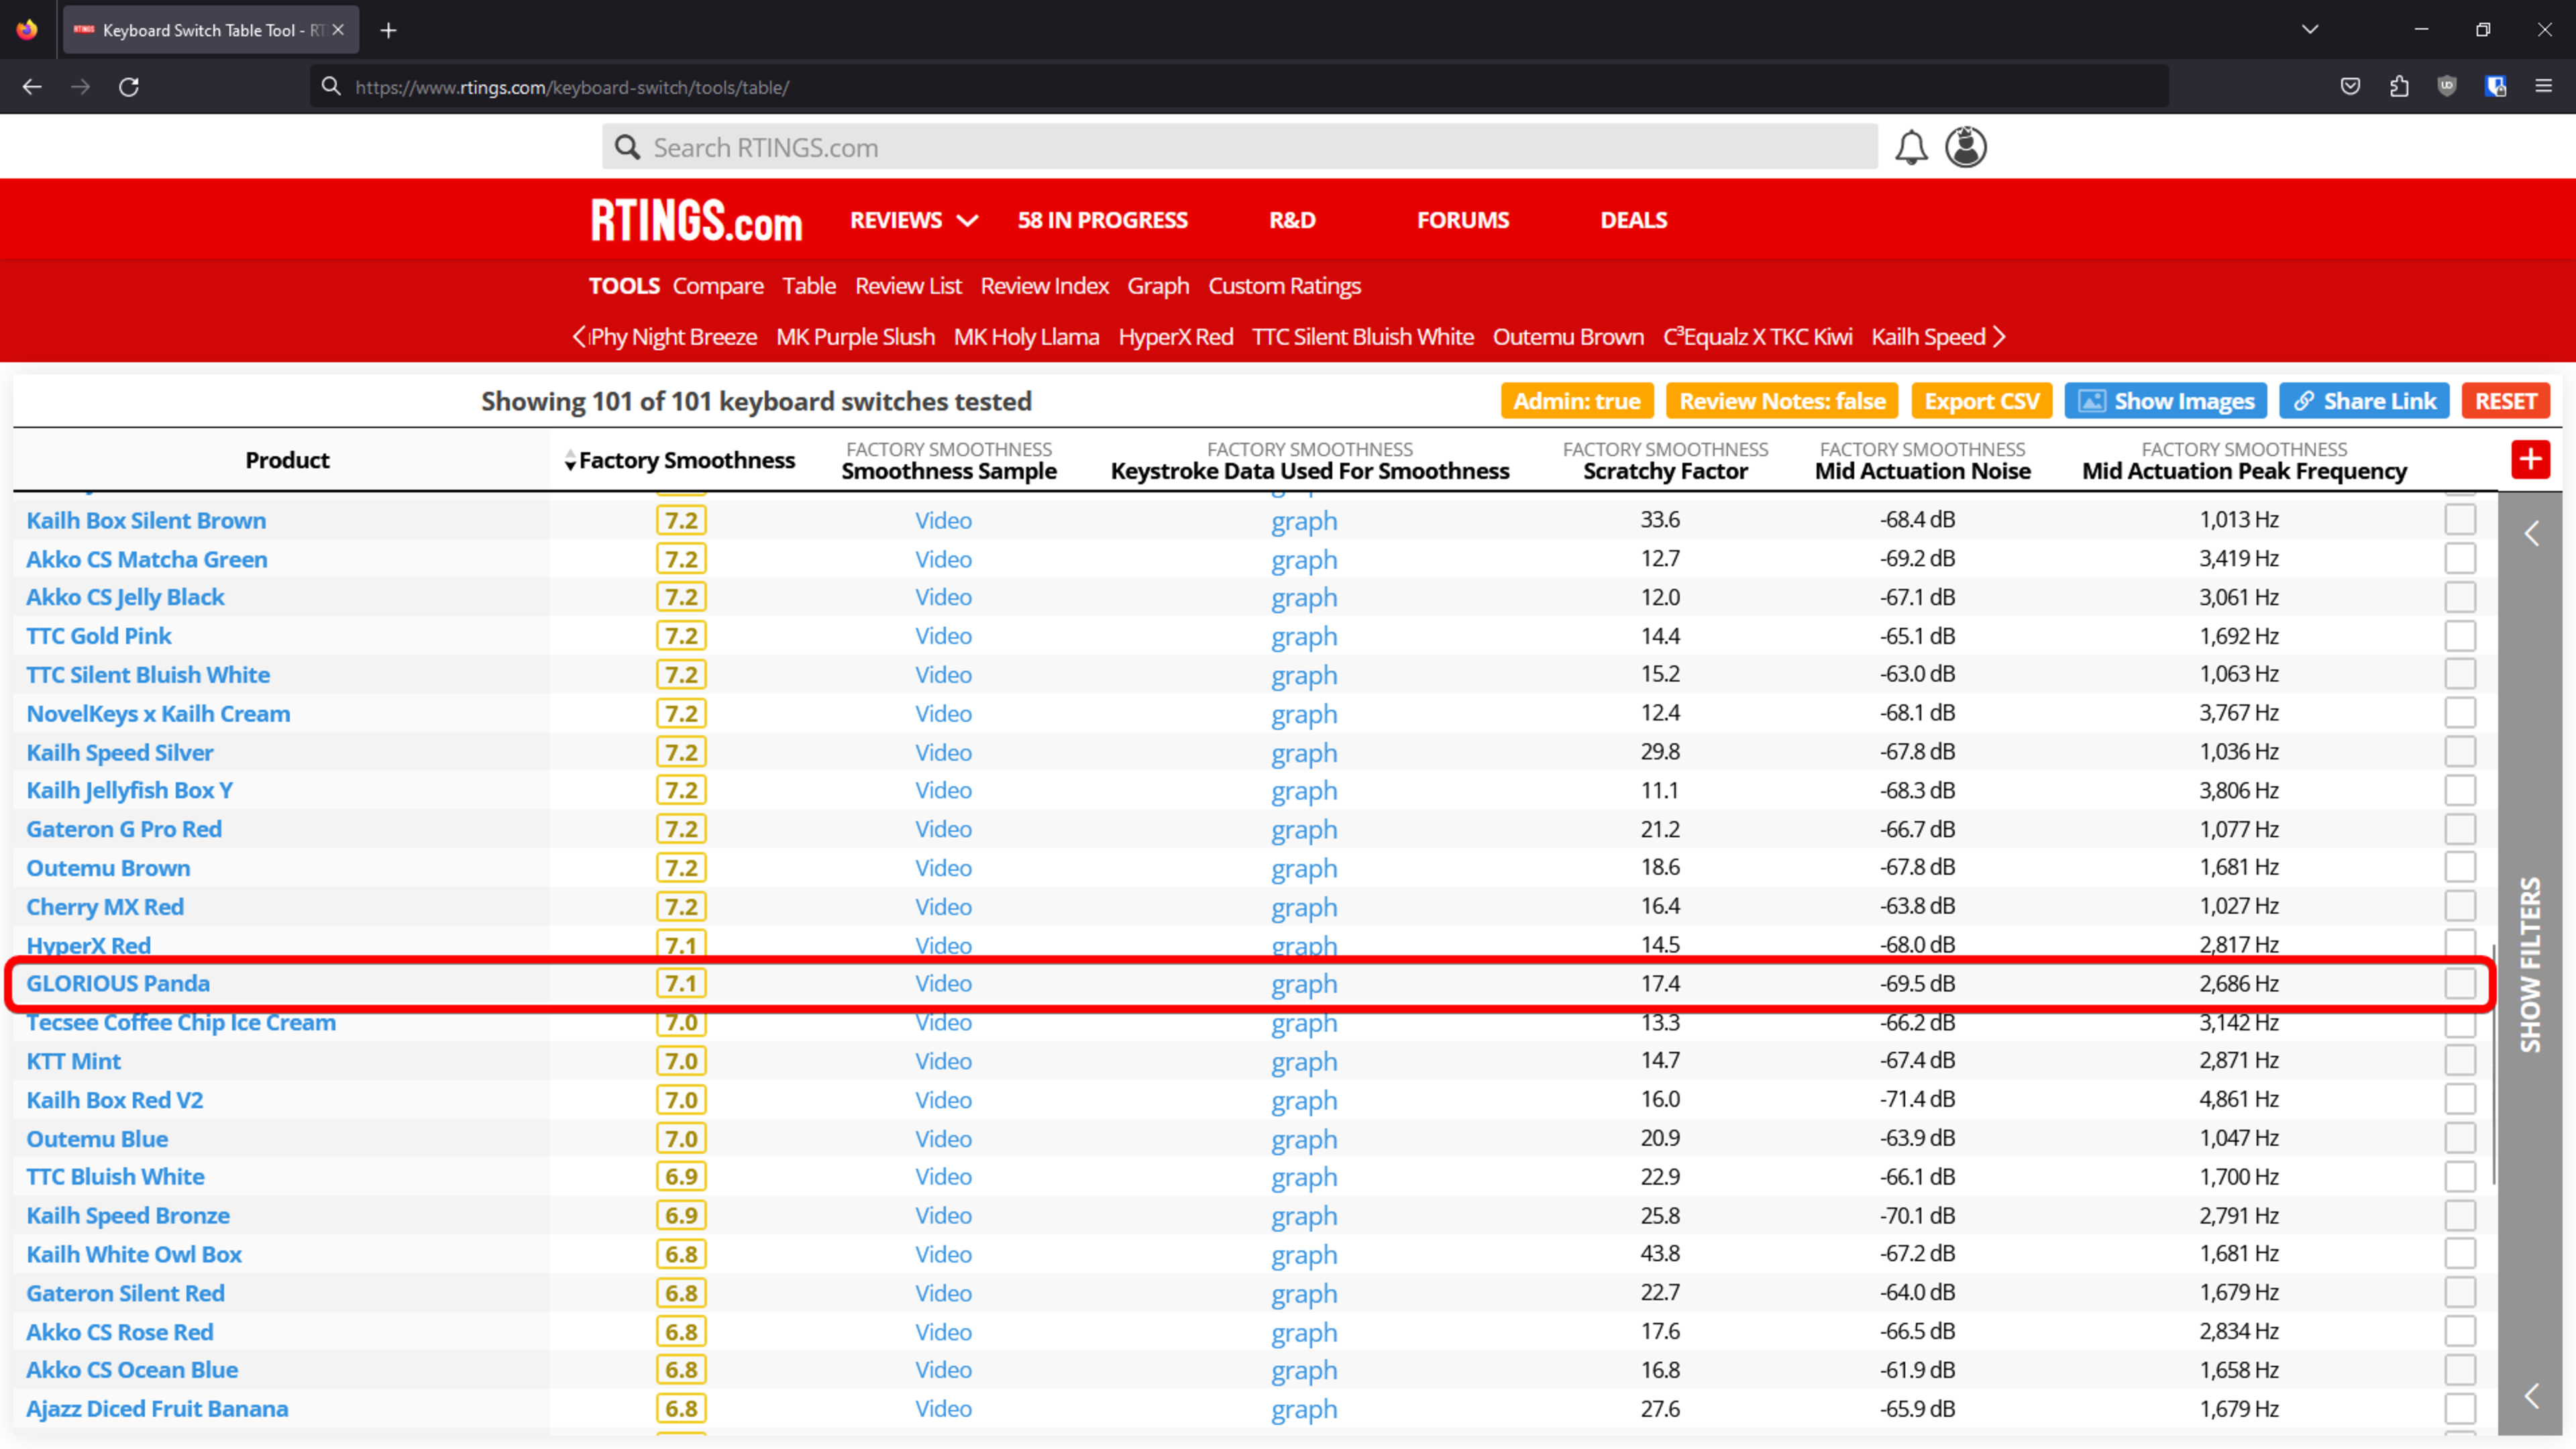
Smoothness score of the Glorious Panda.
We expected the Panda switches to be lower, but that was based on a small sample subjective test very early in the design. Subjectively comparing Panda switches and Durock T1 switches, for example, most found the Durock switches smoother. Many mentioned it was because the sound profile had less of the spring sound, which our test aims to highlight with the peak frequency.
We can compare our results to what other smoothness results scores are out there. We took an example from a Click and Thock video review for Akko's CS Crystal switches.
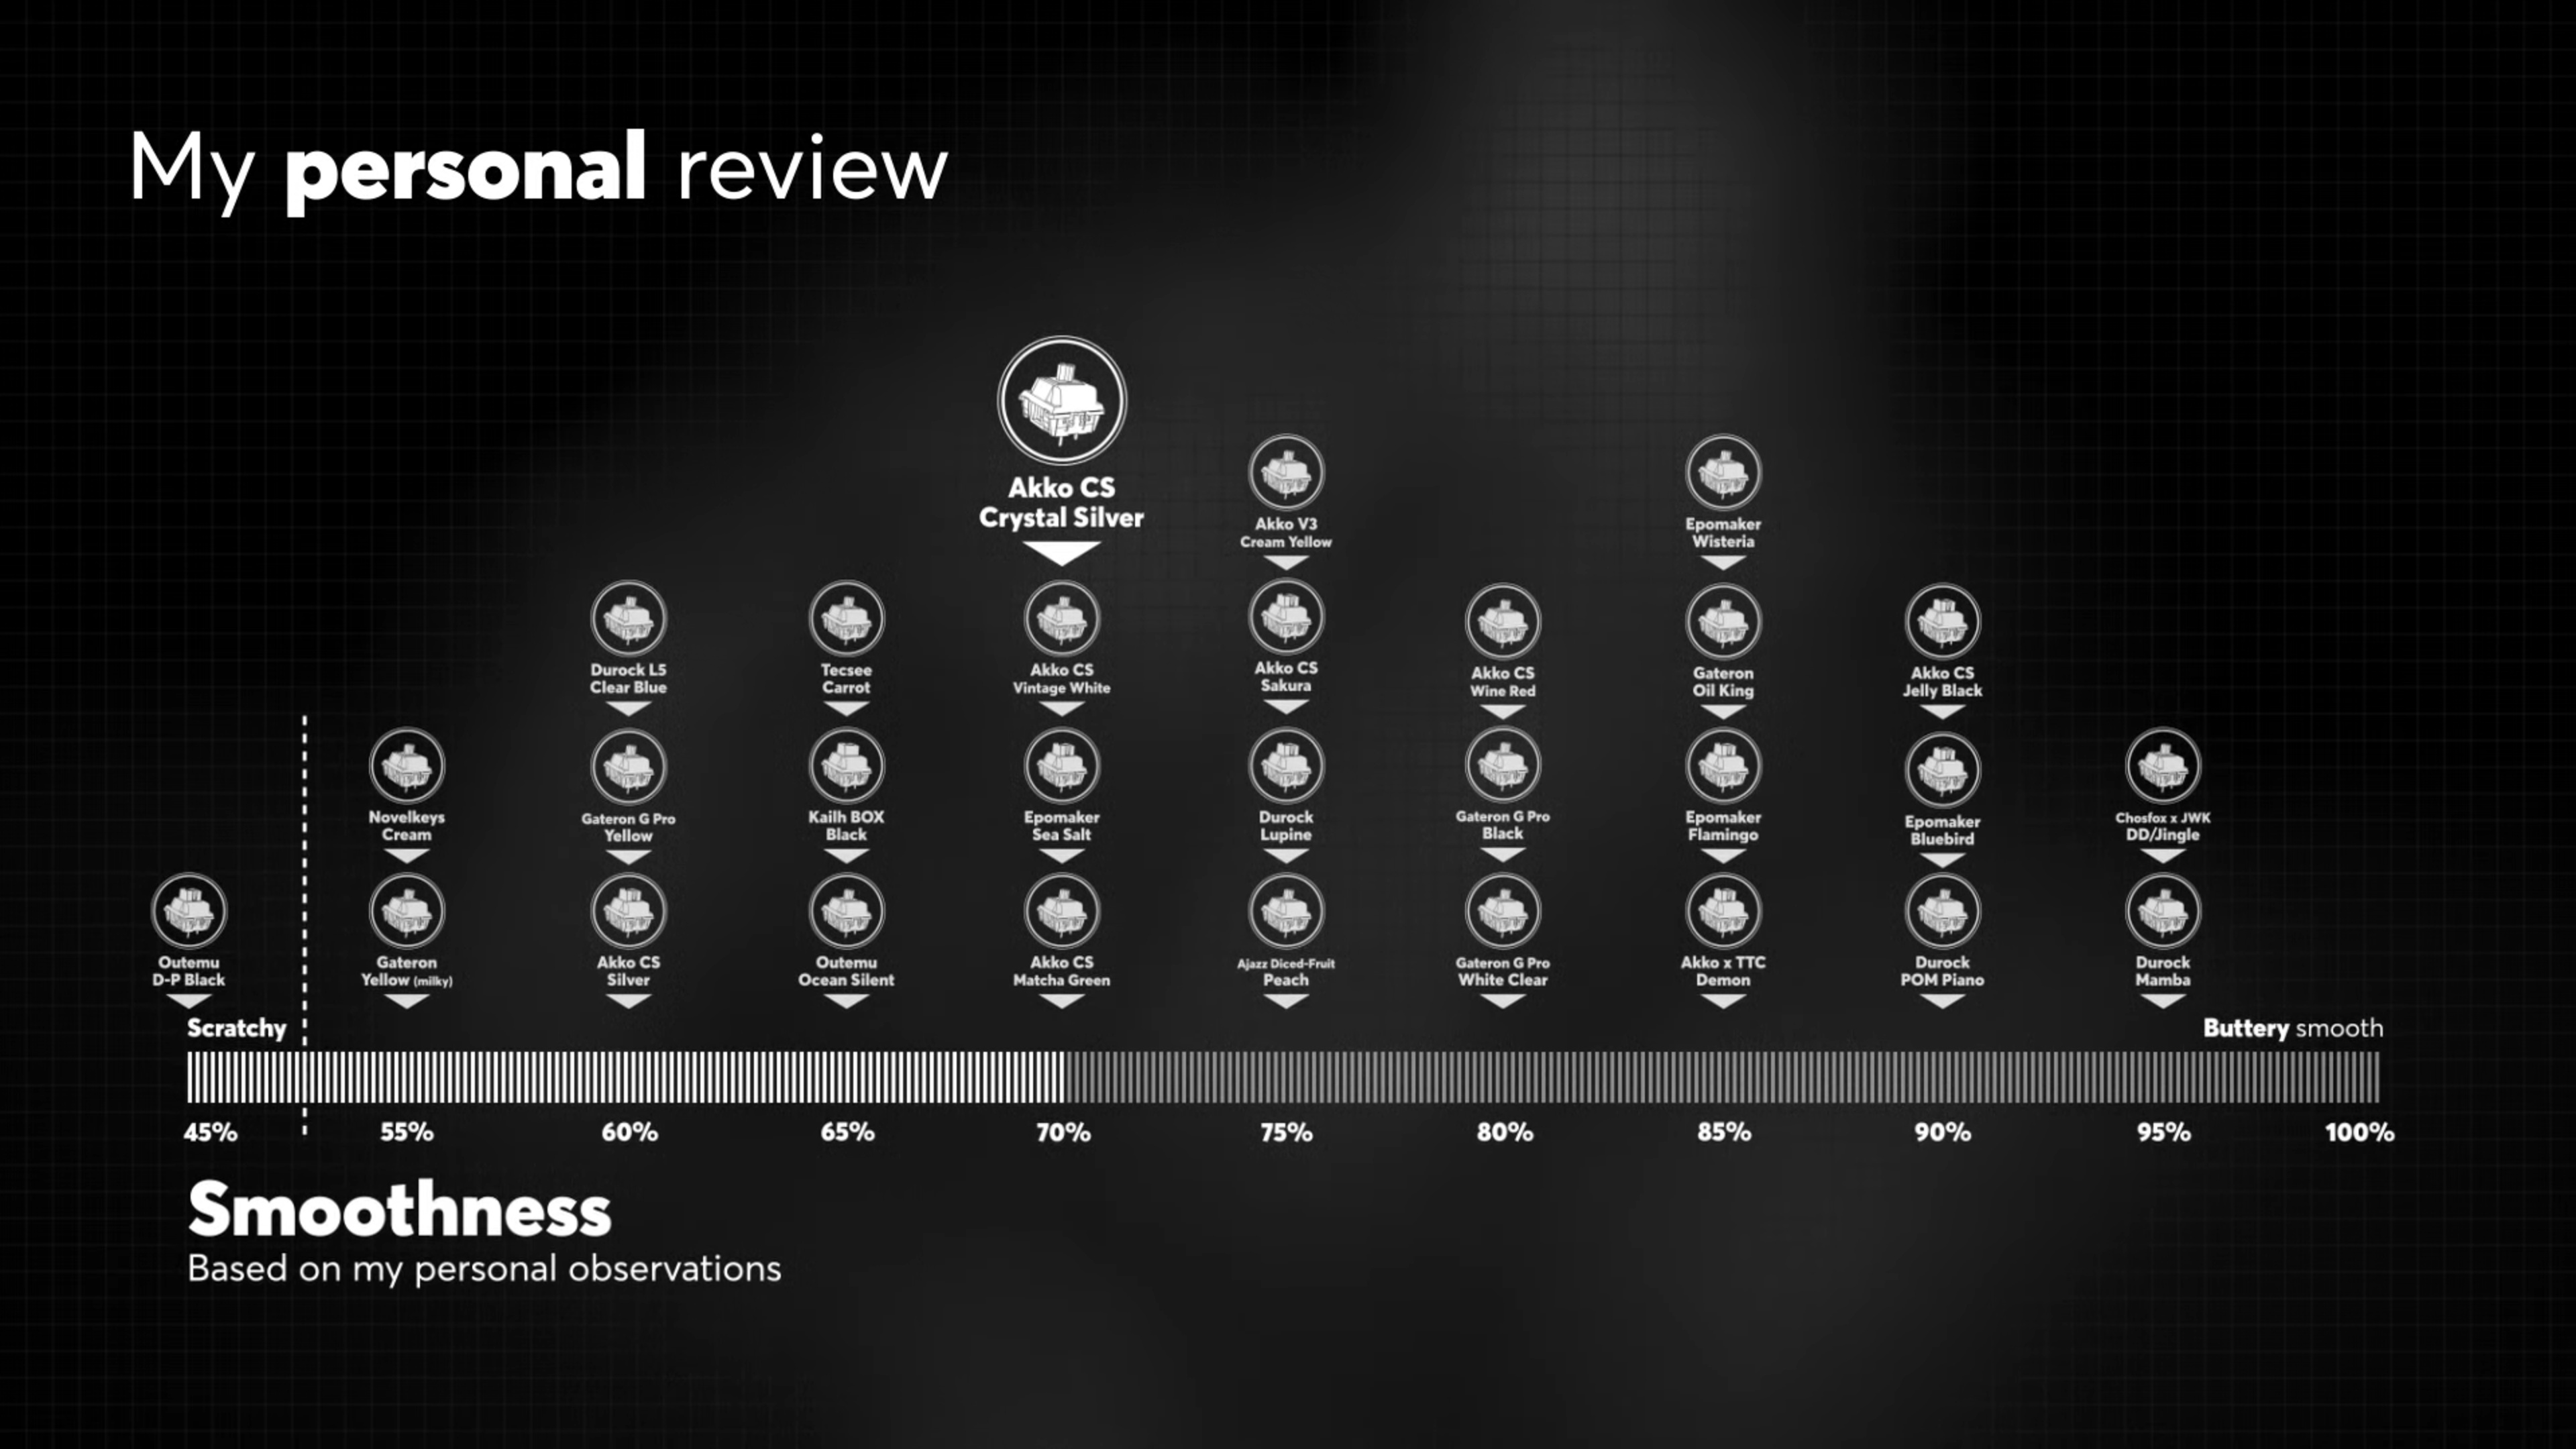
Click and Thock's Smoothness evaluation from their Akko CS Crystal Review Video.
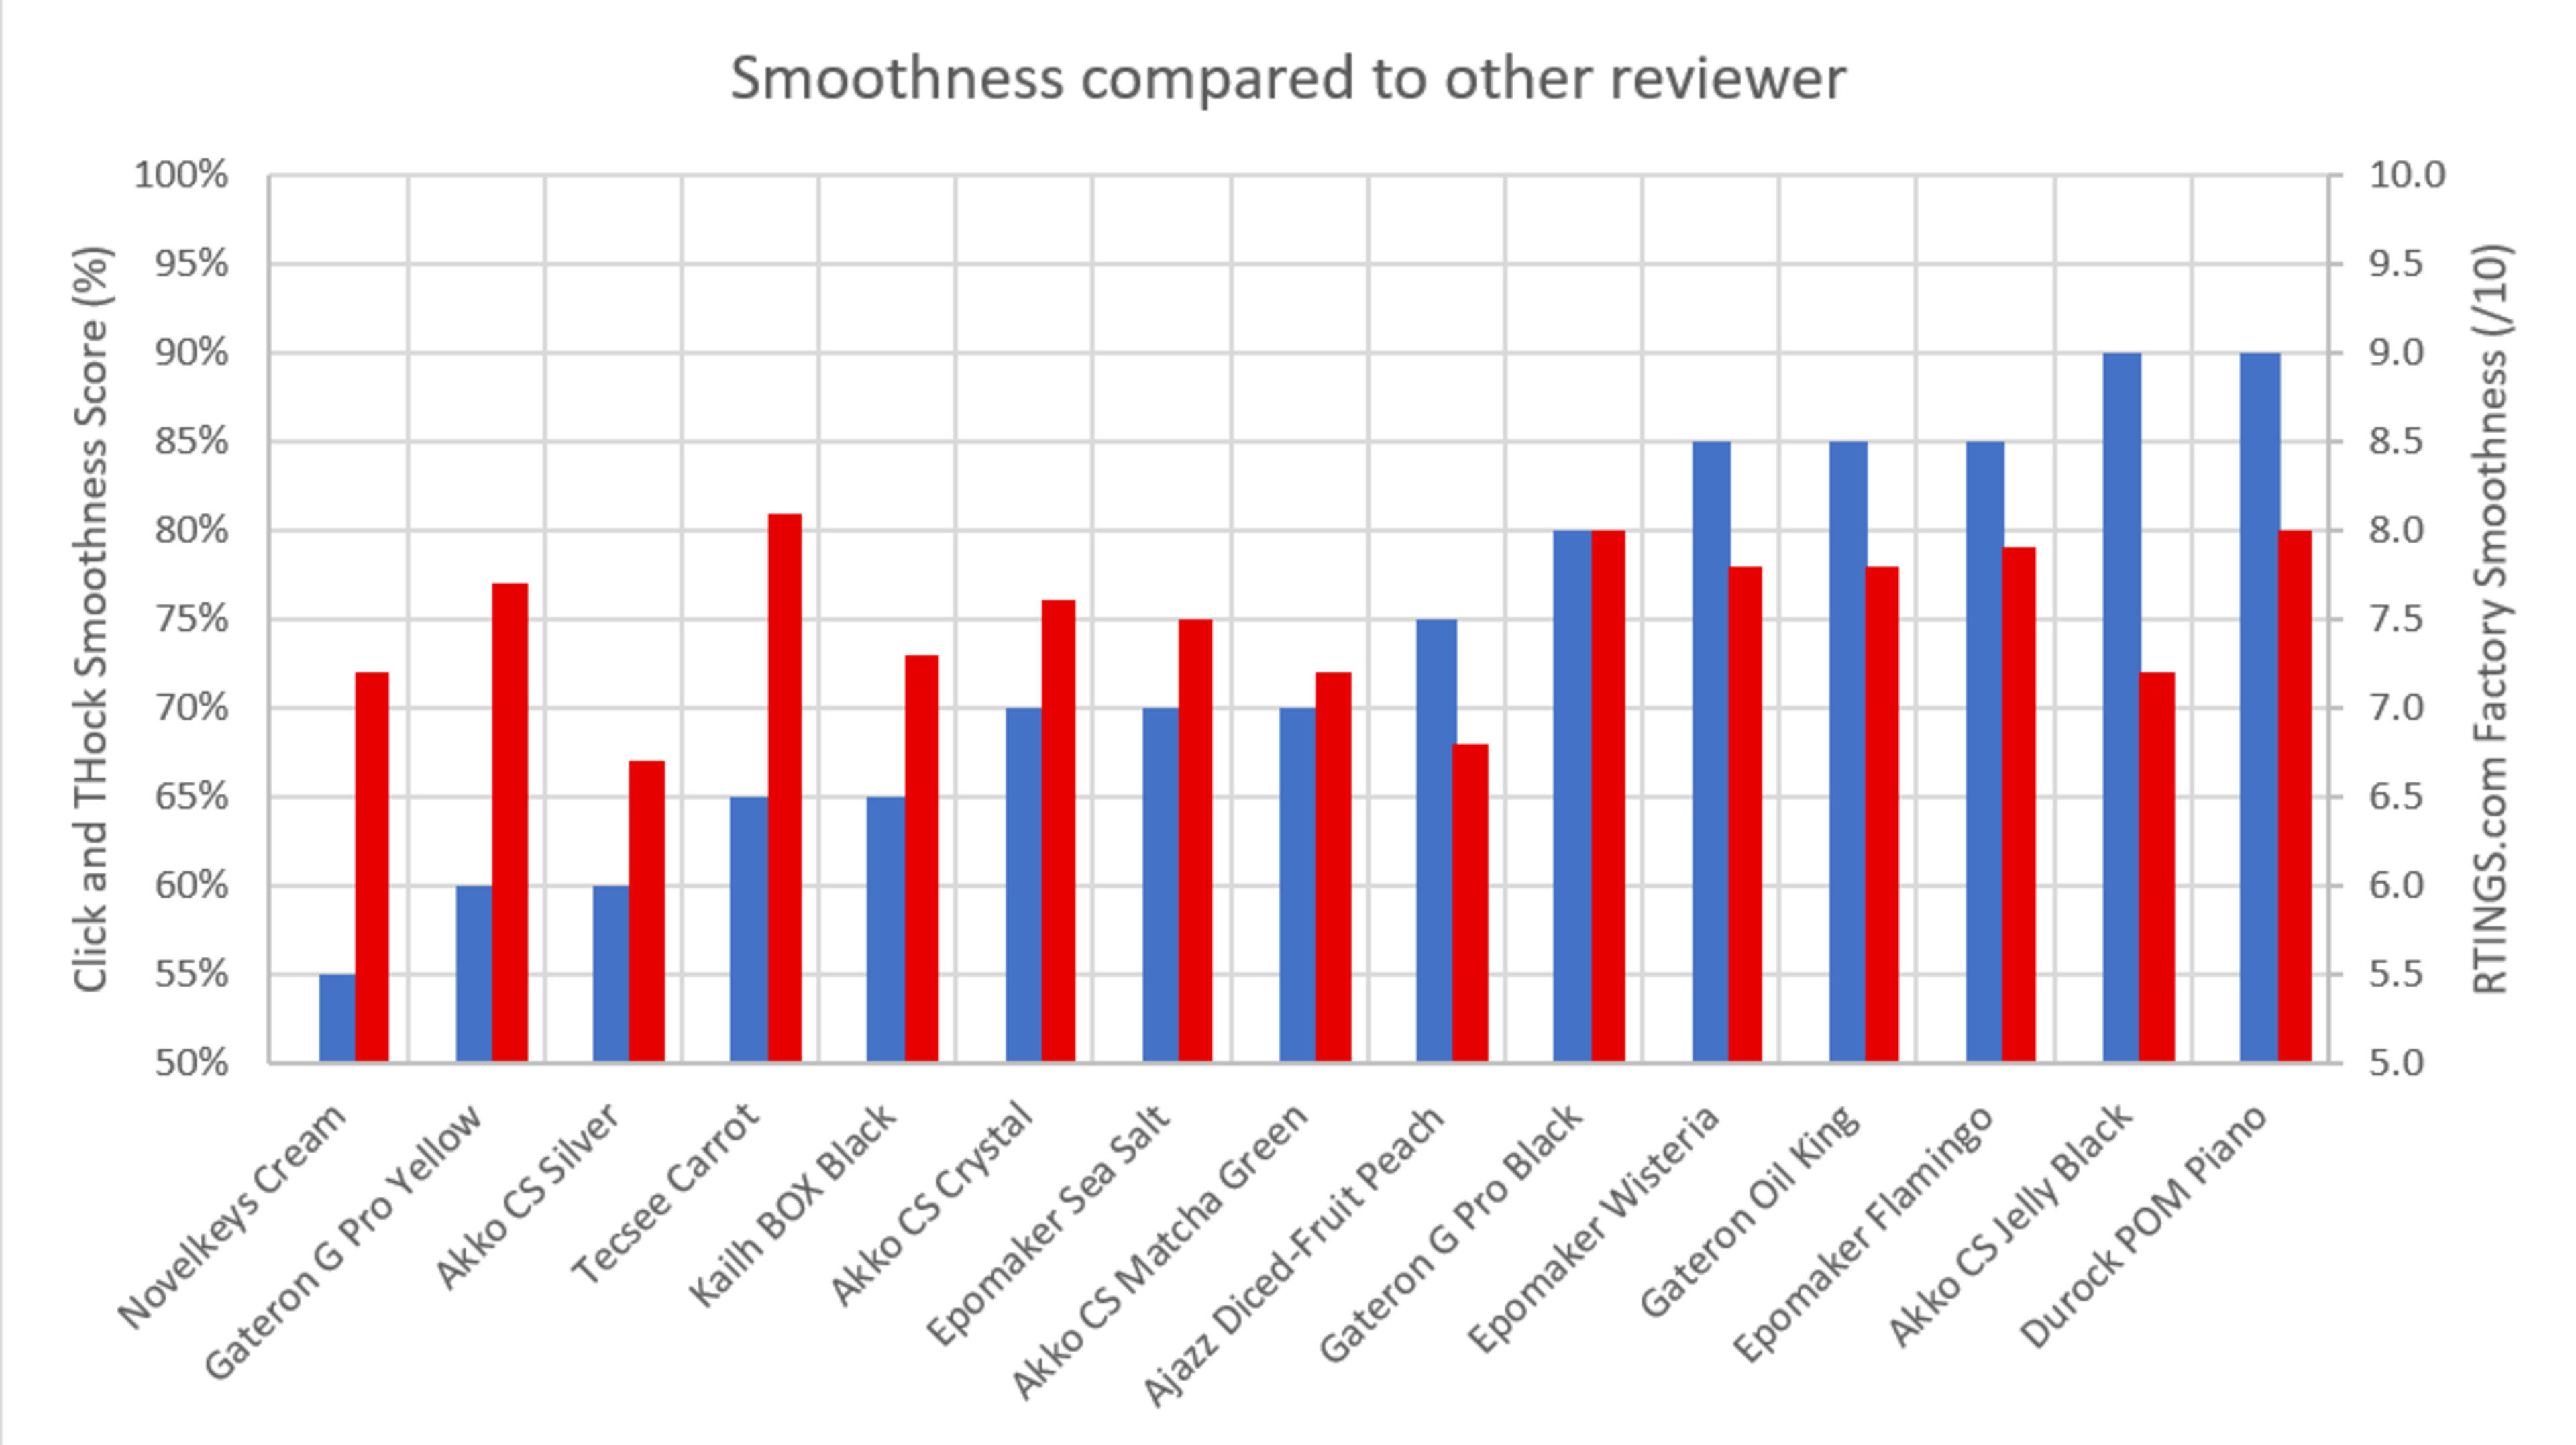
Small sample comparison between our smoothness results and those from Click and Thock's review.
Unsurprisingly, we have some big differences. This was expected due to different testing approaches. Our Novelkeys Cream, Gateron G Pro Yellow, and Tecsee Carrot samples score better, and our Ajazz Diced-Fruit Peach and Akko CS Jelly Black score worse. Those five are the big outliers. This can be due to subjective preferences and our smoothness test still lacking important smoothness aspects.
Test variance & limitations
The noise test can be impacted if the tester changes how hard they press the keys. To mitigate this, we tested over three days to avoid a slow drift of how much force the testers used to press the switch. We also limited testing to the same tester for consistency.
As displayed in the keystrokes switch-to-switch consistency investigation, the scratchy factor is very sensitive to both the load cell position and which socket is used. We average five runs, but the value is still sensitive. This is a big reason we shifted much of the score weight to noise.
Overall, we're using very small values to score smoothness, so it takes very little to shift the score significantly. We could adjust the score curves to be less sensitive, but then all switches would score similarly and over 7.5/10. We don't think all switches are smooth enough to be considered good or better.
With all this in mind, the smoothness score variance is around ±0.3 points. This means a switch that scores 6.7 can be as good as a switch that scores 7.0 and vice-versa.
Smoothness Conclusion
Overall, we're satisfied with our smoothness tests. It isn't the perfect/infallible solution we'd hoped for, but we knew that evaluating this objectively would be a big challenge. We managed to get the general order of the switches correct, and it mostly matches the subjective impression from our testing team. Generally, the older or cheaper switches are at the bottom of the order (Cherry MX, Outemu, some Gateron and Kailh products), and switches that are more widely appreciated in enthusiast circles are at the top (Gateron Oil King, Durock Piano POM, Epomaker Wisteria, etc.).
Establishing an objective test of switch smoothness is already a big achievement. We could spend additional resources, and we would eventually get to a point where the smoothness scores would be 95% in line with our subjective impressions, but increasing the complexity of the test beyond a certain point could jeopardize the trust readers place in our methodology.
Pros:
- A high smoothness difference is captured in the test
- The ballpark ranking is good
Cons:
- Variance is still high
- Other tests
We've added illumination specifications for those who care about RGB lighting. We also added the pinout information. You can now use the custom table tool to sort for these criteria.
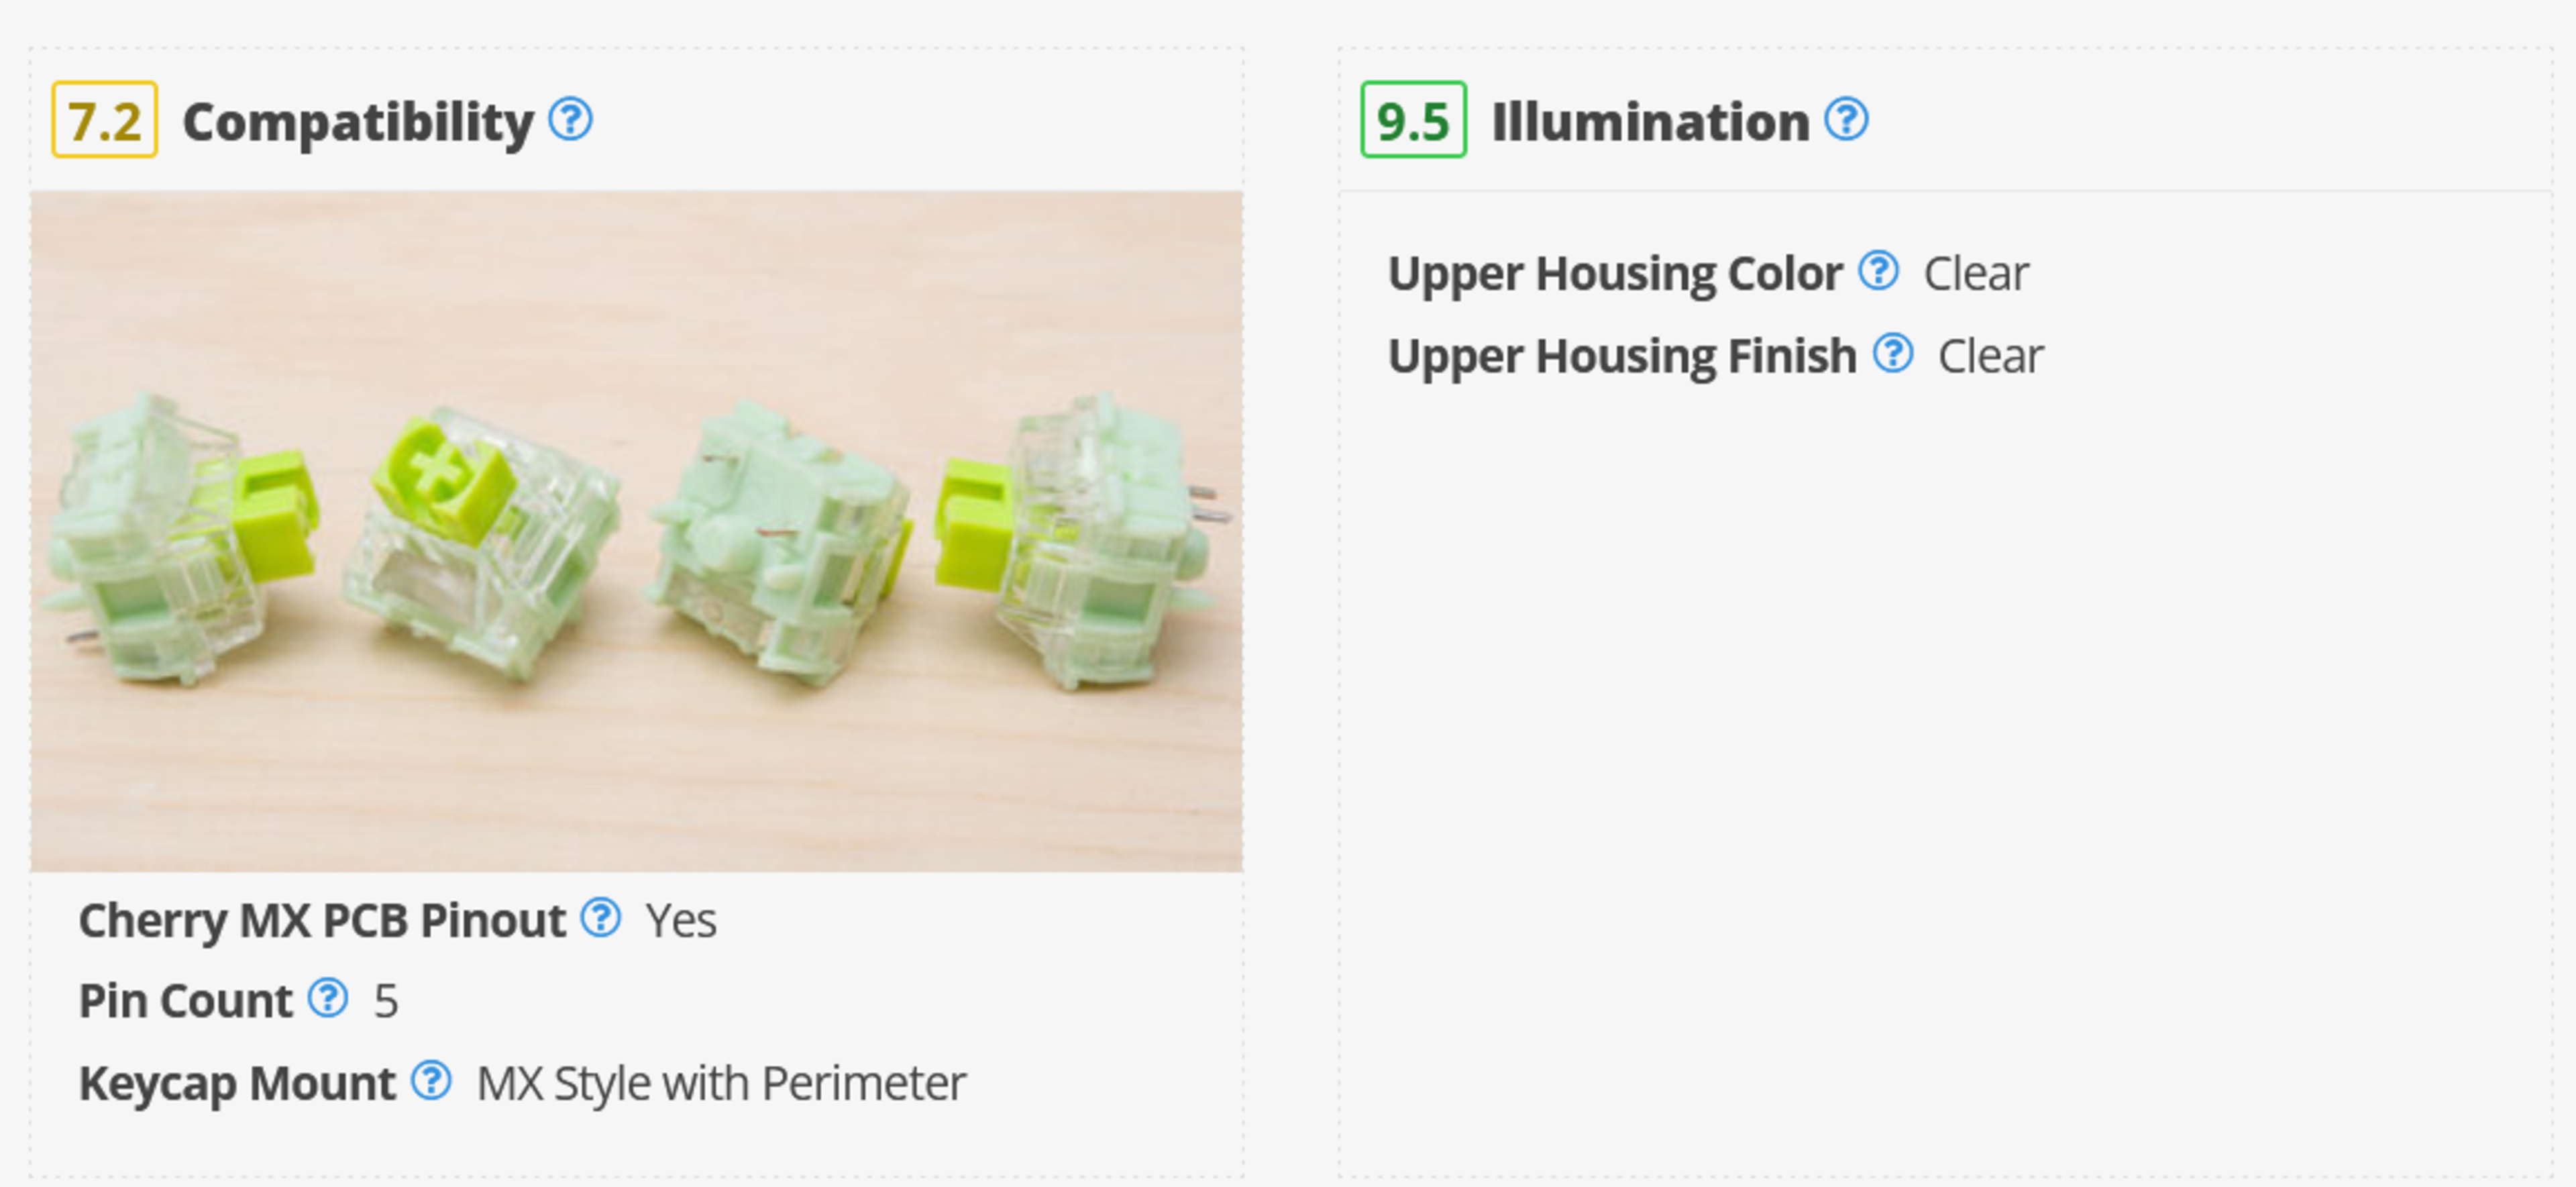
Compatibility and Illumination sections the from TTC Ace V2 switch review.
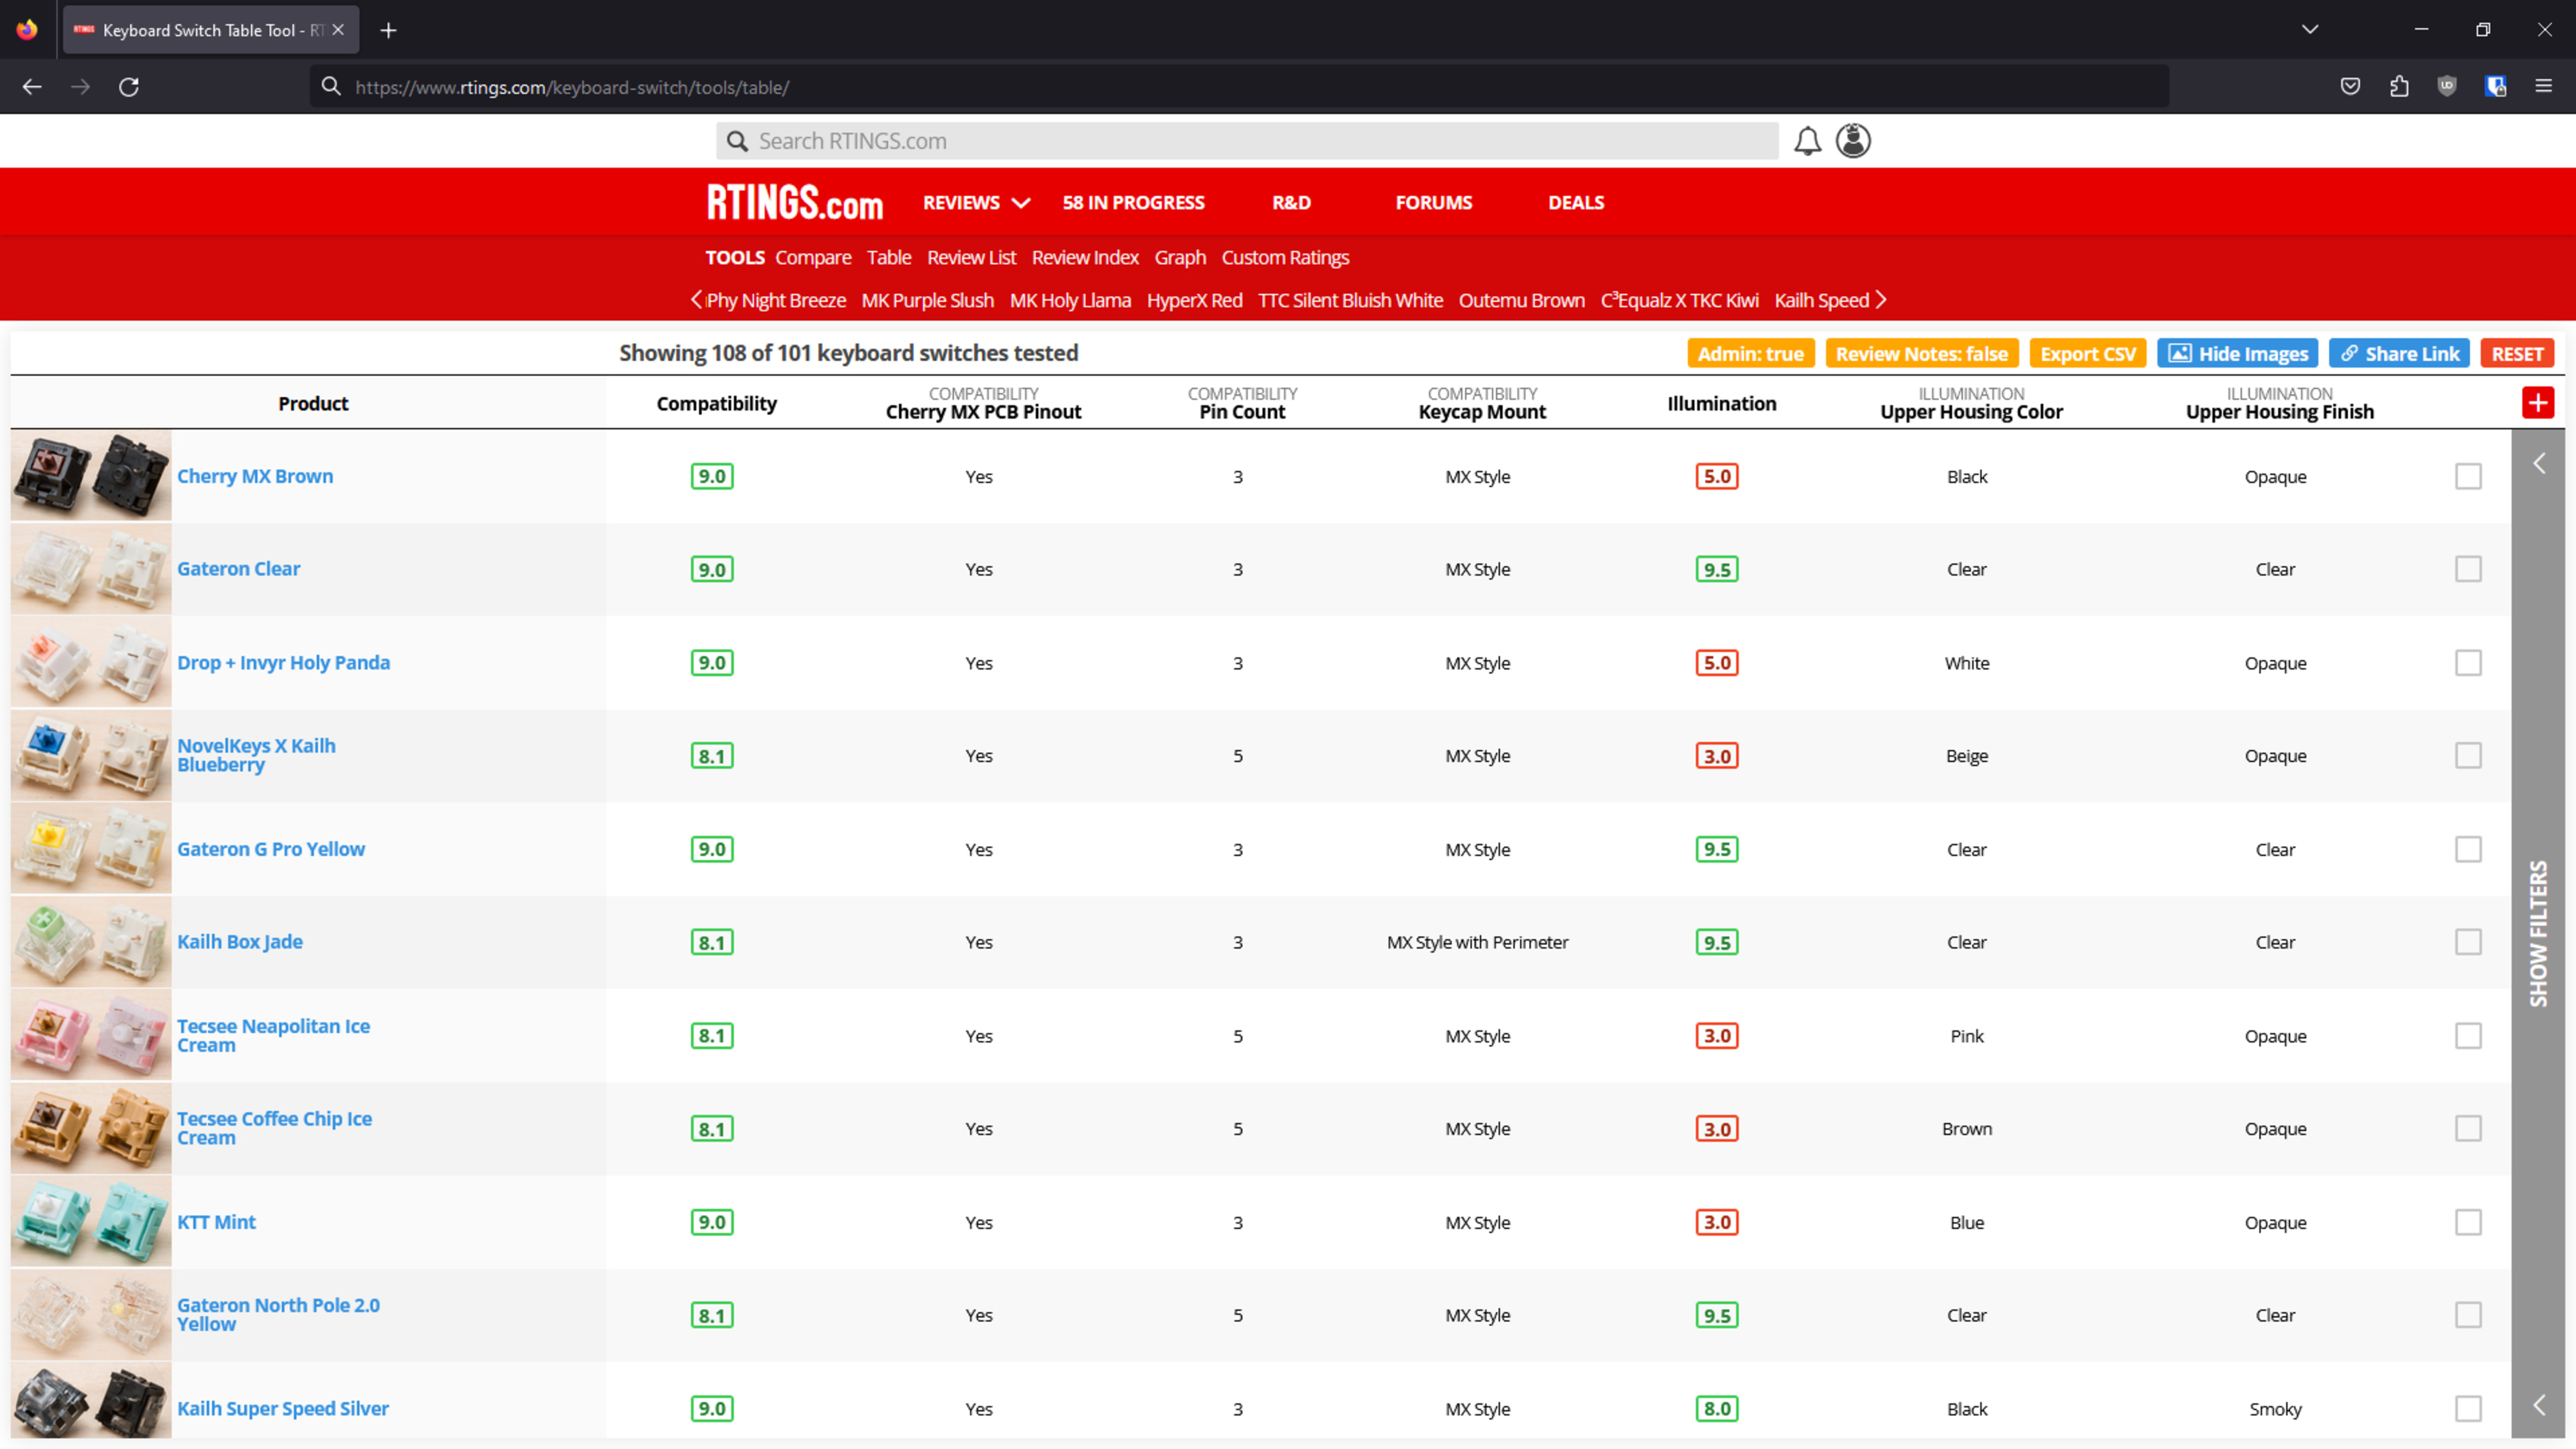
Compatibility and Illumination results.
Conclusion
The test coverage for keyboard switches is very limited by design, as testing over 100 switches takes a long time.
Our intention with these tests isn't to rival the established switch reviewers who do a better job at lubing and showcasing how different switches sound in various keyboards. We put our focus on a few select tests that are critical for switch selection, and that can positively impact our keyboard reviews.
Presenting easily accessible information for 101 switches alongside our custom table tool that can help you filter and sort switches according to parameters that are important for you can be a huge time saver. We hope our new keyboard switch reviews will provide you with a new way to find switches you might be interested in.