
Version 1.1 of our air purifier testing methodology aims to address errors in our current methodology and provide you with more accurate data on air purifier performance.
Why Are We Making These Changes?
In the development phase of this test bench update, we found that previous iterations of our testing methodology tended to produce unexpected, erroneous data regarding particle filtration performance, which often tended to be higher than manufacturer-supplied data that were calculated using the AHAM AC-1 standard testing methodology; more on the exact reasons for this later. These errors resulted from two main factors: a poorly insulated testing chamber and our own method for generating particulate matter.
Our new methodology aims to rectify these errors and provide our users with more accurate, representative data on particle filtration rate, so they can make a judgment call on whether a given air purifier is a good fit for their home.
Particle Filtration Rate
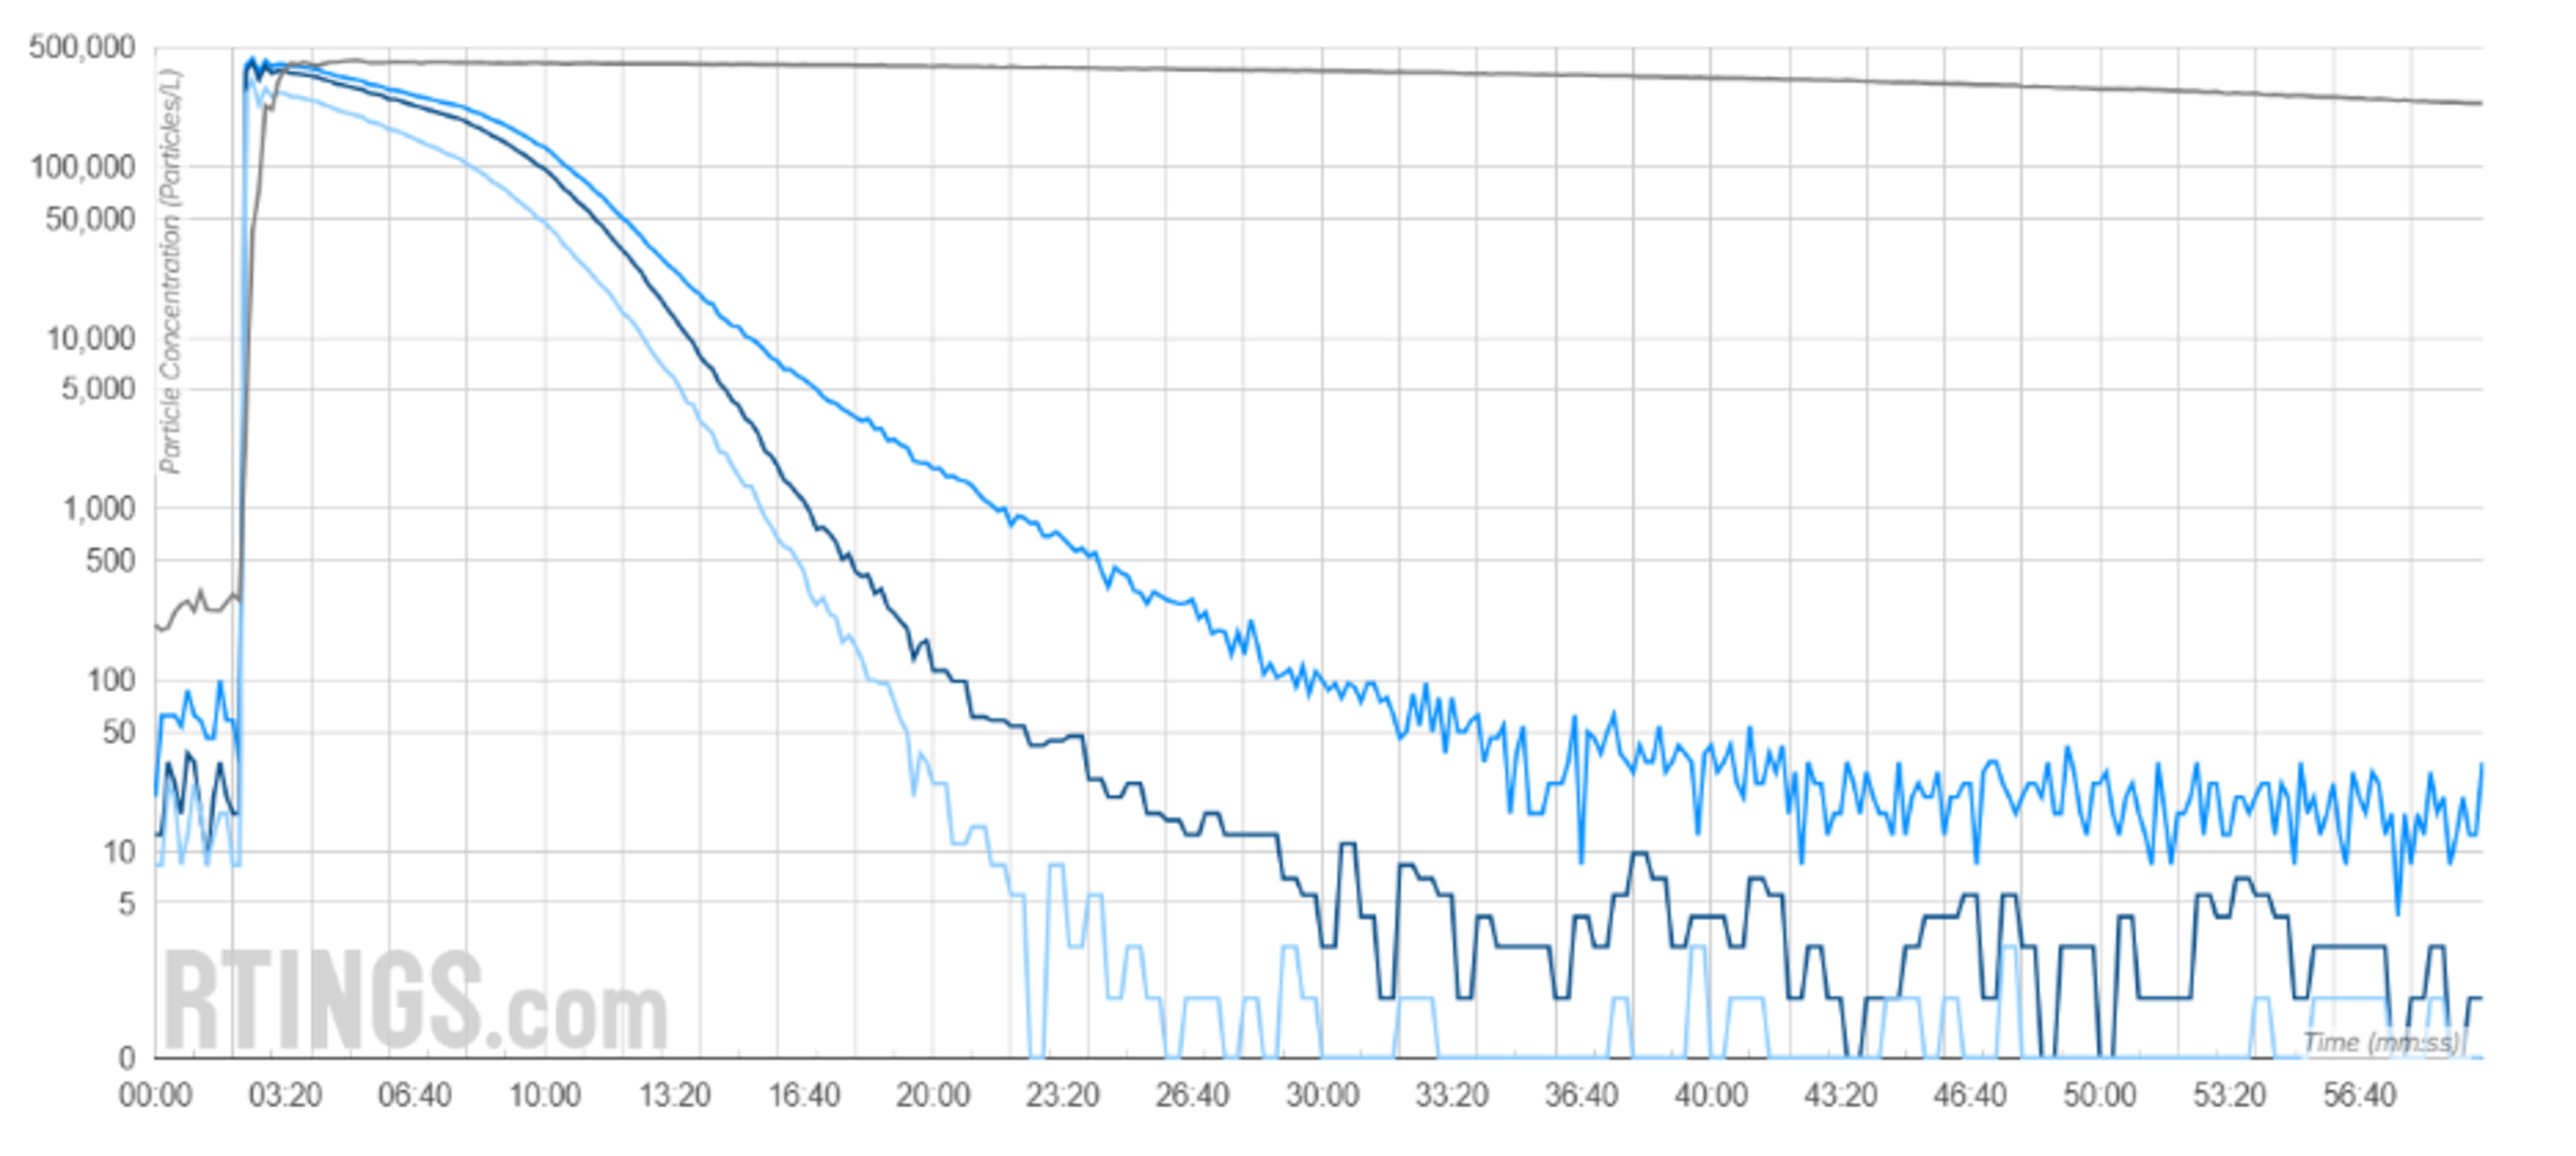
In our previous testing methodology, the liquid particles used to track filtration performance behaved unexpectedly: unlike in real-world conditions, where the decay of airborne particles can be charted exponentially, they decayed in an unnatural manner. Combined with the less-than-perfect seal for our testing chamber, the particle filtration efficiency of many of the air purifiers that we tested tended to be drastically inflated.
 |
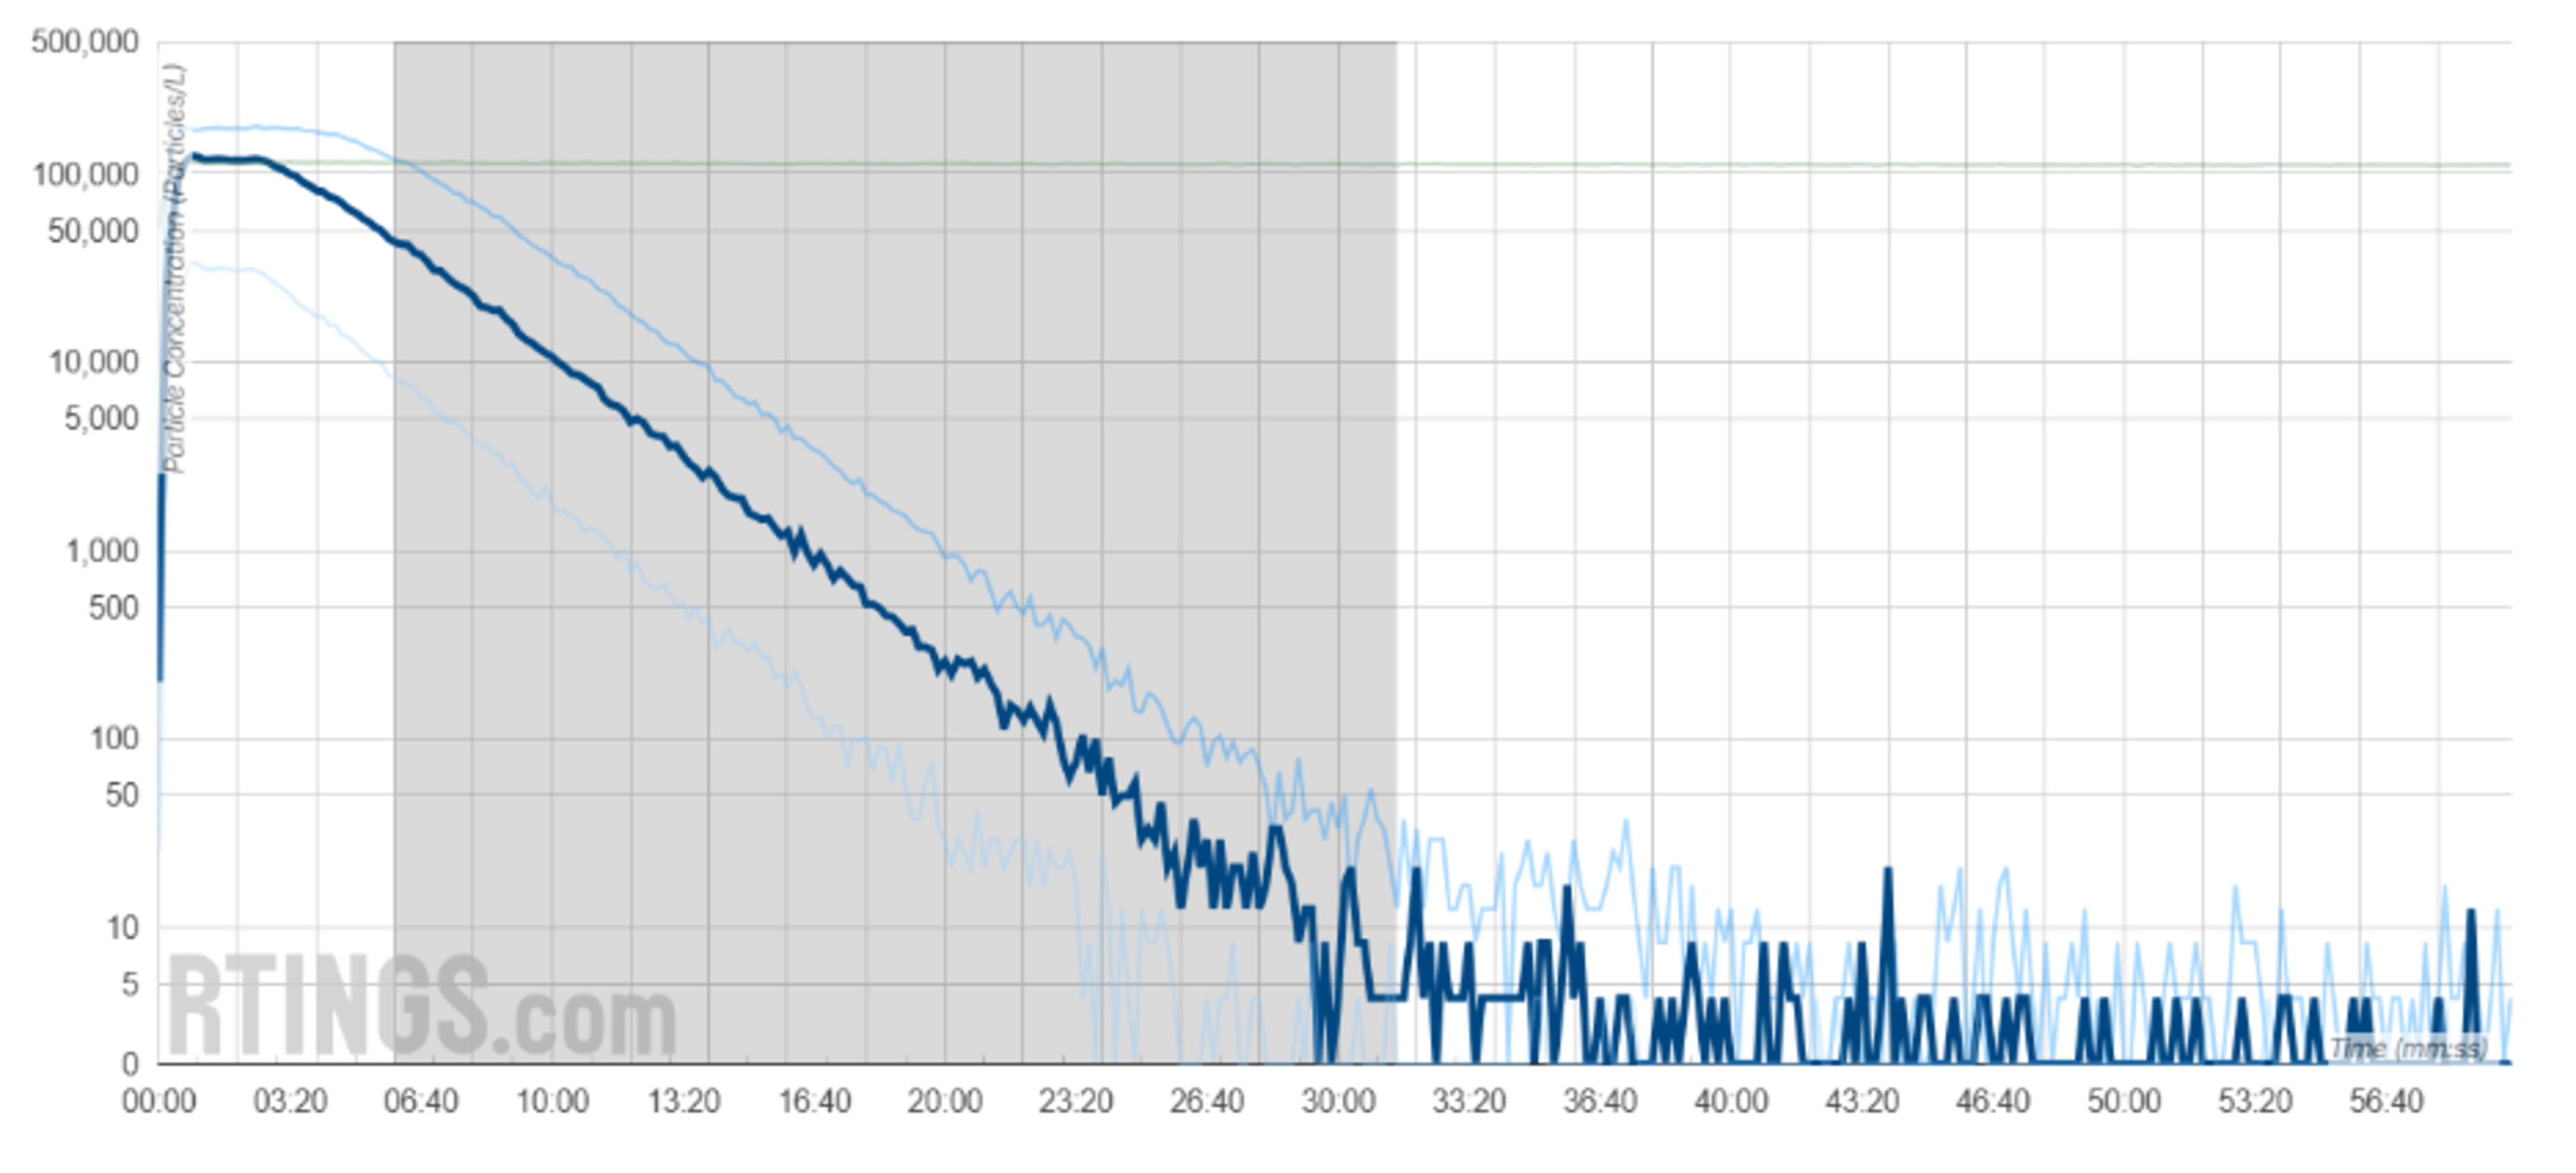 |
Our new methodology is far stricter. We generate airborne particulate matter by atomizing an aqueous saline solution into our (properly-sealed) testing room. This process generates more uniformly sized particles that are mostly in the 0.3um range, which is considered the most penetrating particle size for any type of filter medium, and tends to bring results significantly closer to AHAM AC-1 figures. We've also shifted the window used to calculate CADR, starting from the point where there's a meaningful drop in particle levels inside our testing room.
Air purifiers are run in this testing room at their highest fan speed, allowing us to provide a recommended room size metric so you'll know the upper limits of an air purifier. That said, in future iterations of our test bench, we aim to evaluate the particle filtration rate of air purifiers at a lower fan speed that generates a noise level of 45dBA or less, which is handy if you plan to run your device overnight while you get some sleep. Of course, if you have any further suggestions for future iterations of our methodology, don't hesitate to let us know in the comments. We're always looking for new ways to improve!
26 Air Purifiers Updated
We have retested popular models. The test results for the following models have been converted to the new testing methodology. However, the text might be inconsistent with the new results.
- Corsi-Rosenthal Box
- Corsi-Rosenthal Box with Single Filter
- Coway Airmega 200M
- Coway Airmega AP-1512HH Mighty
- Dyson HEPA Big+Quiet Formaldehyde BP06
- Dyson Pure Cool TP01
- Dyson Pure Hot+Cool Link HP02
- Dyson Purifier Big+Quiet Formaldehyde BP04
- Dyson Purifier Cool TP07
- Dyson Purifier Hot+Cool Formaldehyde HP09
- Dyson Purifier Hot+Cool HP07
- Dyson Purifier Hot+Cool Purifying Heating Fan HP4B
- Honeywell HPA300
- Levoit Core 200S
- Levoit Core 300
- Levoit Core 300S
- Levoit Core 400S
- Levoit Core 600S
- Levoit Vital 200S
- NuWave OxyPure
- Shark Air Purifier 4 HE402
- Shark Air Purifier HP102PET
- Shark Air Purifier MAX HP202
- Shark NeverChange Air Purifier MAX HP302
- Winix 5500-2
- Winix C545