- 40.0%Std. Err.
- 55.0%Low-Frequency Extension
- 5.0%High-Frequency Extension
If you want a speaker that can accurately reproduce a variety of audio content, you'll want one with good frequency response accuracy. Frequency response accuracy tells you how much a speaker produces sound at each frequency. Frequency is another word for pitch, and it's important that a speaker can produce the wide range of frequencies that you encounter in music, movies, podcasts, and other audio content. By testing a speaker's frequency response accuracy, we can describe its sound profile in several ways, like bass-heavy, treble-heavy, warm, or even. Although many listeners look for a neutral, balanced sound profile across the bass, mid, and treble ranges, preference varies from person to person. If you enjoy bass-heavy music genres, you may want something with more emphasis in the bass range.
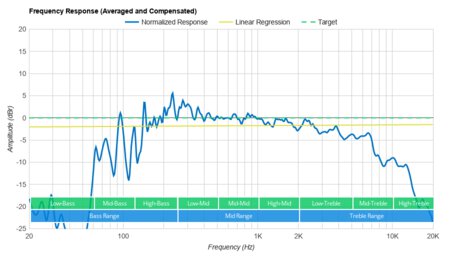
We plot a speaker's frequency response accuracy on a graph by measuring its output in decibels (dB) from 20Hz to 20kHz. This graph reveals many aspects of the sound profile. We look at four factors in particular: slope, standard error, low-frequency extension, and high-frequency extension. By understanding these factors, you can make an informed decision on which speaker is the most suitable for you.
Test results
When It Matters
Frequency response accuracy matters if you want a speaker that can reproduce audio content accurately and according to your needs. While a balanced, neutral sound profile is often desired, some listeners prefer a warm, bass-heavy sound, or even a brighter, treble-heavy sound. A speaker's frequency response accuracy tells you how it reproduces sound from the low-bass range to the high-treble range. Depending on the audio content you listen to, you may focus on different aspects of frequency response accuracy. If you listen to podcasts or other dialogue-heavy content, you'll want something with a well-balanced mid-range. If you like bass-heavy music genres, you may want one with extra emphasis in the bass range. Although frequency response accuracy doesn't tell you how loud a speaker can get or whether its soundstage is narrow or wide, it indicates how well it reproduces audio content across the spectrum of frequencies.
Our Tests
Frequency response accuracy is one of the most important tests for audio reproduction. It measures a speaker's ability to accurately reproduce audio content at a wide range of frequencies, from low-bass to high-treble. If a song is mixed to feel bass-heavy, a speaker with good frequency response accuracy will produce audio that is perceived as bass-heavy to the listener. A speaker that can produce all frequencies at their desired volumes is said to have the most neutral sound profile. Some users prefer something that has more emphasis in the bass range, making it suitable for listening to bass-heavy genres like EDM and hip-hop. Some users prefer a neutral, balanced sound profile, while others may want a speaker that sounds bright and sparkling, with extra emphasis in the treble range.
To measure a speaker's frequency response accuracy, we place it one meter away from a microphone array in a basic room with dimensions 18'x16'x9'. If possible, we test the speaker on battery power and otherwise, using its AC adapter. We calibrate 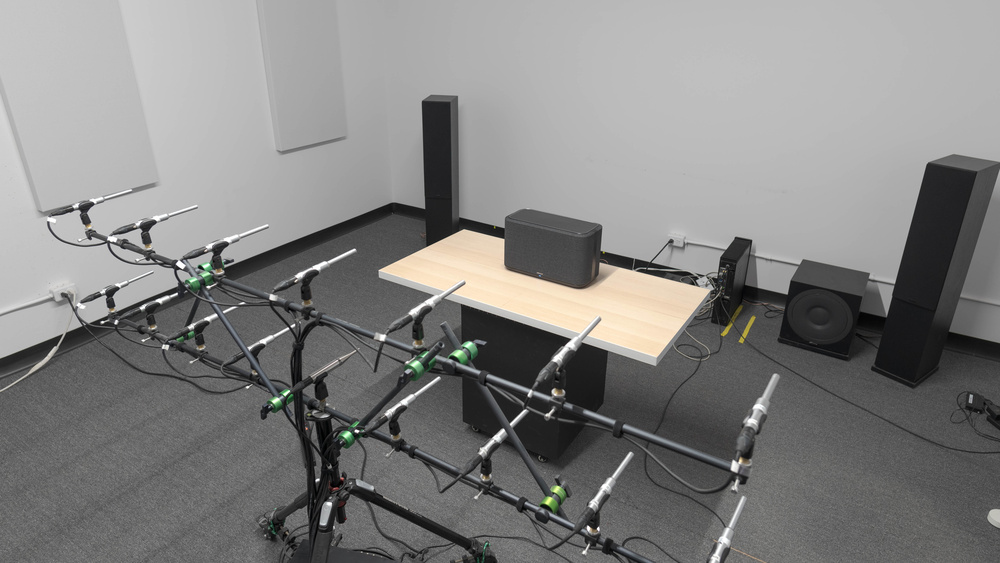 the speaker to 76 dB using a Periodic Pink Noise limited between 250Hz and 2000Hz. Then, we play a Pink ST file from 20Hz to 20kHz. The test is repeated with the speaker placed two meters away, and our 32 total passes are averaged to create the frequency response accuracy graph.
We organize the frequency spectrum into bass, mid, and treble ranges, and each of those into low, mid, and high, so we can talk about a speaker's sound profile in a specific range. As a target frequency response, we use the Harman in-room target response curve, which was designed to approximate the ideal listening experience. This Harman curve has a larger emphasis in the bass range and less emphasis in the treble range. In the final compensated frequency response graph, the Harman in-room target response curve is represented as the middle line in the graph. When a frequency response curve is above the middle line, that means the speaker is louder than the target at that particular frequency, and if the curve is below the middle line, that means it's quieter than the target.
There are a few aspects of the frequency response graph that give us information about a speaker's sound profile. The low-frequency and high-frequency extension tell us the range of the speaker—whether it can produce a thumpy low-bass and a bright high-treble. The slope of the curve, calculated using linear regression, indicates whether the speaker has a warm sound profile (negative slope) or a bright sound profile (positive slope). Finally, the standard error of the curve shows how even its sound production is across all ranges, compared to the Harman target in-room response curve. These aspects of frequency response accuracy are not always straightforward, and listeners may prefer different speakers with different sound profiles. Below, we'll go into more detail about these four factors and how to use them to find a speaker that best fits your needs.
Slope
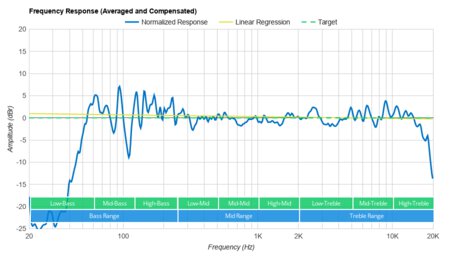
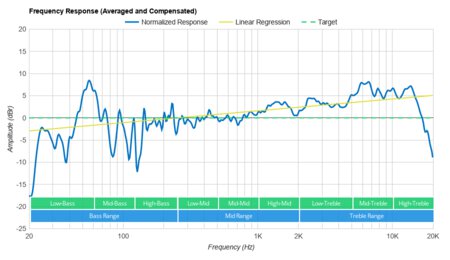
Speakers can have a wide variety of sound profiles, but they can sometimes be categorized more simply as bass-heavy or treble-heavy. Generally speaking, when the slope is positive, a speaker produces more treble than bass, and when the slope is negative, it produces more bass than treble. A speaker with a negative slope will probably sound warm, dark, or boomy, while one with a positive slope may sound bright, sharp, or harsh. The slope is calculated by taking the derivative of the linear regression of a speaker's frequency response graph. When the slope is negative, the curve in the graph usually seems to go down from left to right, whereas if the slope is positive, the curve of the graph seems to go up. Below, on the left is the frequency response graph of the Ultimate Ears BOOM 3, which has a negative slope of -1.49, and on the right is the Sonos One Gen 2, which has a positive slope of 1.34. The linear regression is the thin yellow line.
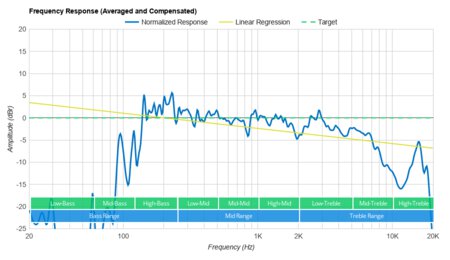
It's important to note that while a negative slope indicates that a speaker has a more emphasized bass range than treble range, this doesn't mean the speaker can necessarily produce a thumpy low-bass. Rather, it only indicates that the bass is more emphasized than the treble. The graphs above are an example of this: the Sonos on the right has a positive slope, suggesting it has a treble-heavy sound profile, but it actually produces a much more extended bass than the Ultimate Ears on the left, which has a negative slope.
Also, a speaker with a slope close to zero doesn't guarantee that it has a neutral, balanced sound profile. Some, like the DOSS SoundBox Plus, have both the bass and treble ranges underemphasized, which can result in a slope close to zero. That said, speakers with neutral sound profiles, like the Apple HomePod, tend to have slopes close to zero. The slope may not tell you everything you need to know about a speaker's sound profile, but it's a good starting point to see if it's especially warm or bright.
Std. Err.
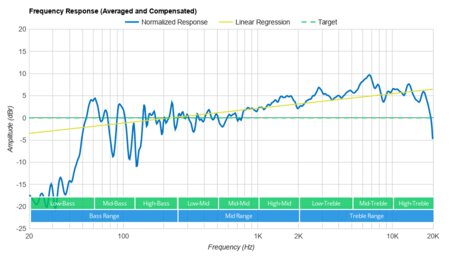
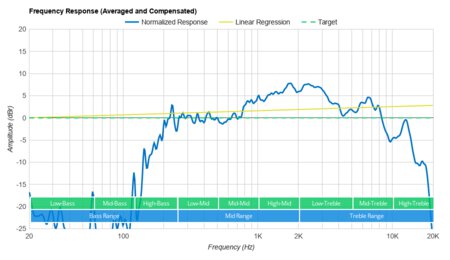
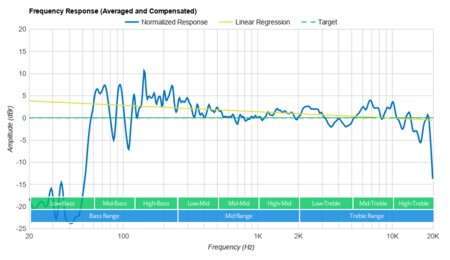
Whether you want a speaker with a warm sound profile or a brighter sound, it's important that it can accurately reproduce all types of audio content. A speaker with a lower standard error will likely have a cleaner sound, while one with a higher standard error may sound uneven. The standard error, measured in decibels (dB), is calculated by taking the standard deviation of a speaker's frequency response graph. Visually, a curve that fluctuates and deviates from the middle a lot will have a higher standard error, whereas a curve that's flatter and closer to the middle will have a lower standard error. Below are the frequency response graphs of the Theater Solutions B83GR on the left and the Sonos Move on the right. The Theater Solutions has a much higher standard error.
Depending on where the curve deviates the most, a speaker's sound profile may be uneven in different ways. If the mid-range is uneven, it won't accurately reproduce vocals, dialogue, and lead instruments. If the treble range has the most deviation from the middle, higher frequencies like cymbals and S and T sounds may either be dull or harsh. For example, the Theater Solutions has an overemphasized high-bass, making audio sound muddy, while it pushes vocals and lead instruments toward the back of the mix.
Some speakers can have a fairly low standard error while not having an overall balanced sound profile. Usually, this is due to a lack of low-bass. For example, the Sony SRS-XB01 has a balanced mid-range and treble range, but it really struggles to produce low-bass, so you may find it doesn't accurately reproduce bass-heavy music genres. That said, standard error still indicates that a speaker has an even sound production.
Low-Frequency Extension
If you're a fan of bass-heavy music genres, it's a great idea to look at a speaker's low-frequency extension. Low-frequency extension is, roughly speaking, a speaker's ability to produce low-bass. A speaker with a lower low-frequency extension value will likely have a more thumpy, rumbling bass than a speaker with a higher low-frequency extension value. The value, measured in hertz (Hz), is the lowest frequency at which a speaker's frequency response is six decibels (dB) lower than the target response. The lower a speaker can reach -6 dB from the target, the more accurately it produces the lower-bass frequencies.
Almost all speakers have a drop-off in the bass range, especially smaller models. However, some speakers can still produce a deeper bass sound than others. Below are the frequency response graphs for the Sonos Five on the left and the OontZ Angle 3 on the right. The Sonos has a much more extended low-bass.
While low-frequency extension is a great indicator of a speaker's bass performance, it doesn't always mean the bass range sounds even and clean. For example, the Bose Home Speaker 500 doesn't have as extended a low-bass as the Sonos Five, but its mid-bass and high-bass ranges are more balanced. This results in a cleaner, more even bass sound, even if it doesn't make you feel the same deep thump and rumble as the Sonos Five. Although low-frequency extension doesn't describe every aspect of a speaker's bass range, it's a great indicator of how well it can produce a deep bass sound.
High-Frequency Extension
High-frequency extension is a speaker's ability to produce a high-treble sound. For most listeners, this is less important than low-frequency extension for the overall listening experience, and quite a lot of speakers have a good high-frequency extension. Also, most instruments lie within a speaker's mid or treble range, so even if a speaker doesn't have a very extended treble range, it may still be well-suited for playing a variety of audio content. That said, high-frequency extension helps you feel the brightness and sparkle of sibilants like cymbals and S and T sounds. Also, the higher harmonics of vocals and instruments can feel more rich and present.
A speaker's high-frequency extension is measured in hertz (Hz), and it's calculated by finding the highest frequency at which a speaker's frequency response is three decibels below the target response. Below are the frequency response graphs of the Bose Portable Smart Speaker on the left and the Sony SRS-XB23 on the right. The Bose has a higher high-frequency extension.
A speaker that doesn't have a good high-frequency extension typically has an underemphasized treble range. Although some speakers with a good high-frequency extension, like the Bose above, have balanced treble ranges, others have overemphasized treble ranges. For example, the Sonos One Gen 2 has a good high-frequency extension but an overemphasized treble range, which can make higher frequencies like cymbals sound bright and piercing. While high-frequency extension may not be as important as low-frequency extension to some listeners, it still indicates that a speaker can make the higher frequencies of vocals and lead instruments sound bright and present in the mix.
Conclusion
Frequency response accuracy is one of the most important tests for a speaker's audio production. It indicates how well a speaker can produce a range of sound, from 20Hz to 20kHz. The graph of a speaker's frequency response accuracy tells us what kind of sound profile a speaker has. Preference varies from person to person, so you may want something with a neutral sound profile or one with more emphasis in the bass or treble range. By looking at the slope, standard error, low-frequency extension, and high-frequency extension of a frequency response graph, you can make an informed decision about a sound profile to see if it suits your needs.