Products
Tested using Methodology v0.8
Updated Jul 29, 2026 04:24 PM
SEE PRICE
Amazon
Tested using Methodology v1.0.1
Updated Aug 11, 2026 03:25 PM
SEE PRICE
Amazon


Bluetooth
Yes
Wi-Fi
No
Speakerphone
No
Voice Assistant
No
Battery Powered
Yes
Bluetooth
Yes
Wi-Fi
No
Speakerphone
No
Voice Assistant
No
Battery Powered
Yes
Our Verdict
Harman/Kardon Onyx Studio 8
Harman/Kardon Onyx Studio 9
The Harman/Kardon Onyx Studio 8 is the predecessor to the Harman/Kardon Onyx Studio 9. Where the Studio 8 stood out for its arresting design, with the entire speaker framed by an aluminum wraparound handle, the Studio 9 has a more traditional, laid-back oval design. Both speakers are easy to carry around your house and sound fairly similar. The main difference is the addition of companion app support to the Studio 9, giving you access to a 7-band EQ to tweak the sound to your heart's desire.
Variants
- Onyx Studio 8 (Black)
- Onyx Studio 8 (Blue)
- Onyx Studio 9 (Black)
- Onyx Studio 9 (Grey)
Check Price
Black
Onyx Studio 8
SEE PRICE
Amazon
Black
Onyx Studio 9
SEE PRICE
Amazon
Blue
Onyx Studio 8
SEE PRICE
Amazon
Grey
Onyx Studio 9
SEARCH
Amazon
Champagne
Onyx Studio 8
SEE PRICE
Amazon
Main Differences for
Music
Music
Threshold
Music
Full Comparison
Design
Style
Style Photo

RGB Lights
Portability
Dimensions Photo

Volume
Weight
Power Source
One-Hand Carry
Build Quality
Build Quality Photo

Material Quality
Water Resistance
Dust Resistance
Impact Resistance
Floats In Water
Controls
Controls Photo

Controls Photo 2

Ease Of Use
Feedback
Music Play/Pause
Call Answer/End
Volume Up/Down
Track Next/Previous
Microphone On/Off
Additional Controls
In The Box
In The Box Photo

Sound
Frequency Response Accuracy
Frequency Response Graph

Slope
Std. Err.
Low-Frequency Extension
High-Frequency Extension
Raw Frequency Response
Raw Frequency Response Graph

Binaural Recording @ 1m
Binaural Recording @ 2m
Directivity
Directivity

Directivity Graph

Directivity Index
Stereo
Loudness
Dynamic Range Compression
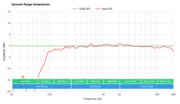
SPL @ Max Volume
DRC @ Max Volume
Active Features
Battery
Battery Life
Charge Time
Power Saving
Charging Port
Battery Powered
Voice Assistant
Alexa
Google Assistant
Speakerphone
Siri
Voice Assistant
Voice Activation
Microphone Mute
Far-Field Performance
Ambient Noise Performance
App
App Picture


App Name
iOS
Android
EQ
Stereo Pair Mode
Party Mode
Multi-Room
Connectivity
Wired
Aux Input
USB Audio
Other Ports
Bluetooth
Bluetooth
Bluetooth Version
Bluetooth iOS Latency
Bluetooth Android Latency
Bluetooth Range
Multi-Device Pairing
Wi-Fi
Wi-Fi Version
Wi-Fi Frequency Band
Wi-Fi
Apple AirPlay
AirPlay Latency
Google Chromecast
Chromecast Latency
Check Price
Black
Onyx Studio 8
SEE PRICE
Amazon
Black
Onyx Studio 9
SEE PRICE
Amazon
Blue
Onyx Studio 8
SEE PRICE
Amazon
Grey
Onyx Studio 9
SEARCH
Amazon
Champagne
Onyx Studio 8
SEE PRICE
Amazon
Harman/Kardon Onyx Studio 8
Harman/Kardon Onyx Studio 9
Comments
Harman/Kardon Onyx Studio 8 vs Harman/Kardon Onyx Studio 9: Main Discussion
What do you think of these products? Let us know below.
Looking for a personalized buying advice from the RTINGS.com experts? Members have direct access to buying advice on our member forum.
Thanks for the feedbacks Bashar. Normally all 1.0 speakers should have been brought up to 1.01, and the full batch of retest is completed, that is 96 speakers! Is there a specific model that you see still on 0.8 that is of interest to you?
For automatic room correction, normally we play Pink Noise for at least 10 minutes before measuring the speakers. We will later in the year update the test bench so hopefully we can meet more of your expectations. That said 1.1 dB difference in error to a target will always be within tolerance of speaker measurements in a semi reflective room. We can make it better but it cannot be precise to 1 dB, I would not be honest to promise that.
For the Loudness, It is also planned to update this test down the line. I think I andwered to an other comment, but the main difference you see is because we measure at 1m instead of 2.
In all cases, we’ll take good notes and hopefully will adress your concerns.
Best.
Its said “Be careful what you wish for, it may come true” :) I was criticizing some of the calculations and tests before but with new test bench, things getting even more complicated :( Now there are several different results and calculations with test v0.8, v1.0 and v1.0.1 in site and very hard to compare different speakers with different test bench results. And unfortunately so many inconsistent test results in new test bench. I have few points to mention for future: 1)There are some problems in tests of the speakers which have “room correction feature” as its commented here about Onyx 8 and 9. Its worth to test all speakers (with this feature) again after you place them in test point and use them for awhile before starting the test. (As an example, I use HK GoPlay Play3 time to time and its previous Std Error figures were 2.15 and reduced to 3.26 with new test bench which seems not so reliable) 2)New Loudness tests and weight of Max SPL seems a bit over rated especially for daily use. Let’s take Tribit Stormbox Blast for instance. It has 101.3dB Max SPL and 4.11 DRC Max. HK GoPlay3 has 98.3 Max SPL and 2.98 DRC Max. Tribit has 8.4 Loudness rating while HK Go Play has 7.8. In daily life most of the people would prefer to listen music in 98.3dB with 2.98dB DRC, rather than 101.3db with 4.11dB DRC. For future, maybe better to test DRC@90dB (like in Soundbars) and increase its weight more than 10% in Loudness ratings. In real life usage, there is not a huge difference between 98.3dB and 101.3dB because most of the time people listen music between 80 to 95 decibels. That’s why in reality, the difference between 85db and 88dB is not the same as 99dB and 102dB.
I agree, with you that the new version don’t reproduce a whole octave lower. To be honest, there are no standardized calculation of what constitute low frequency extension. Our old measurements had quite severe room interractions in the bass that made it difficult to trust assessment of extension. In the new test bench we have been able to comppensate for most of these but in the case of speakers with room correction,which the Onyx 9 have we measure at 1m to see the behaviour, basically, not removing the room modes since the speaker should compensate for them. It is possible that your experience at home could differ.
As for The LFE calculation, the shape of the response for this specific speaker may push the extension above what would be subjectively audible. For full transparency, we calculate the extension at the point in the roll off where the Bass response drop to lower than 70 dBSPL (or 6 dB below our reference Level). In some regards, it is fair to say that this speaker “tricked” our algorithm, since as you can see on the graph, it does fall below at 109 Hz, but then there’s a low frequency bump at 53 Hz, which altough technically in the rolling off part of the response still gives significant energy below our published Low Frequency extension.
I would say that you are right to not trust a single number like that, the whole curve tells a different story. It is challanging to have a number all would agree with when the roll off in the response is not a smooth continuous slope.
Hope that help and thanks for flagging this. Frequency response should not be consodered an exact universal metric. There are some quirks and it can be seen in looking at the individual responses (the grey traces), there is already large difference depending on the measurement microphone positions (we use a 15 microphones array).
It’s difficult to believe that the bass extension was reduced from 46hz to 109hz. I don’t think I really ‘believe’ 46hz (it is the result of an intermittent peak), but I don’t think I believe 109hz either.