This article was written in collaboration with Sean Olive, PhD
Why There's Still More To Explore With Distortion
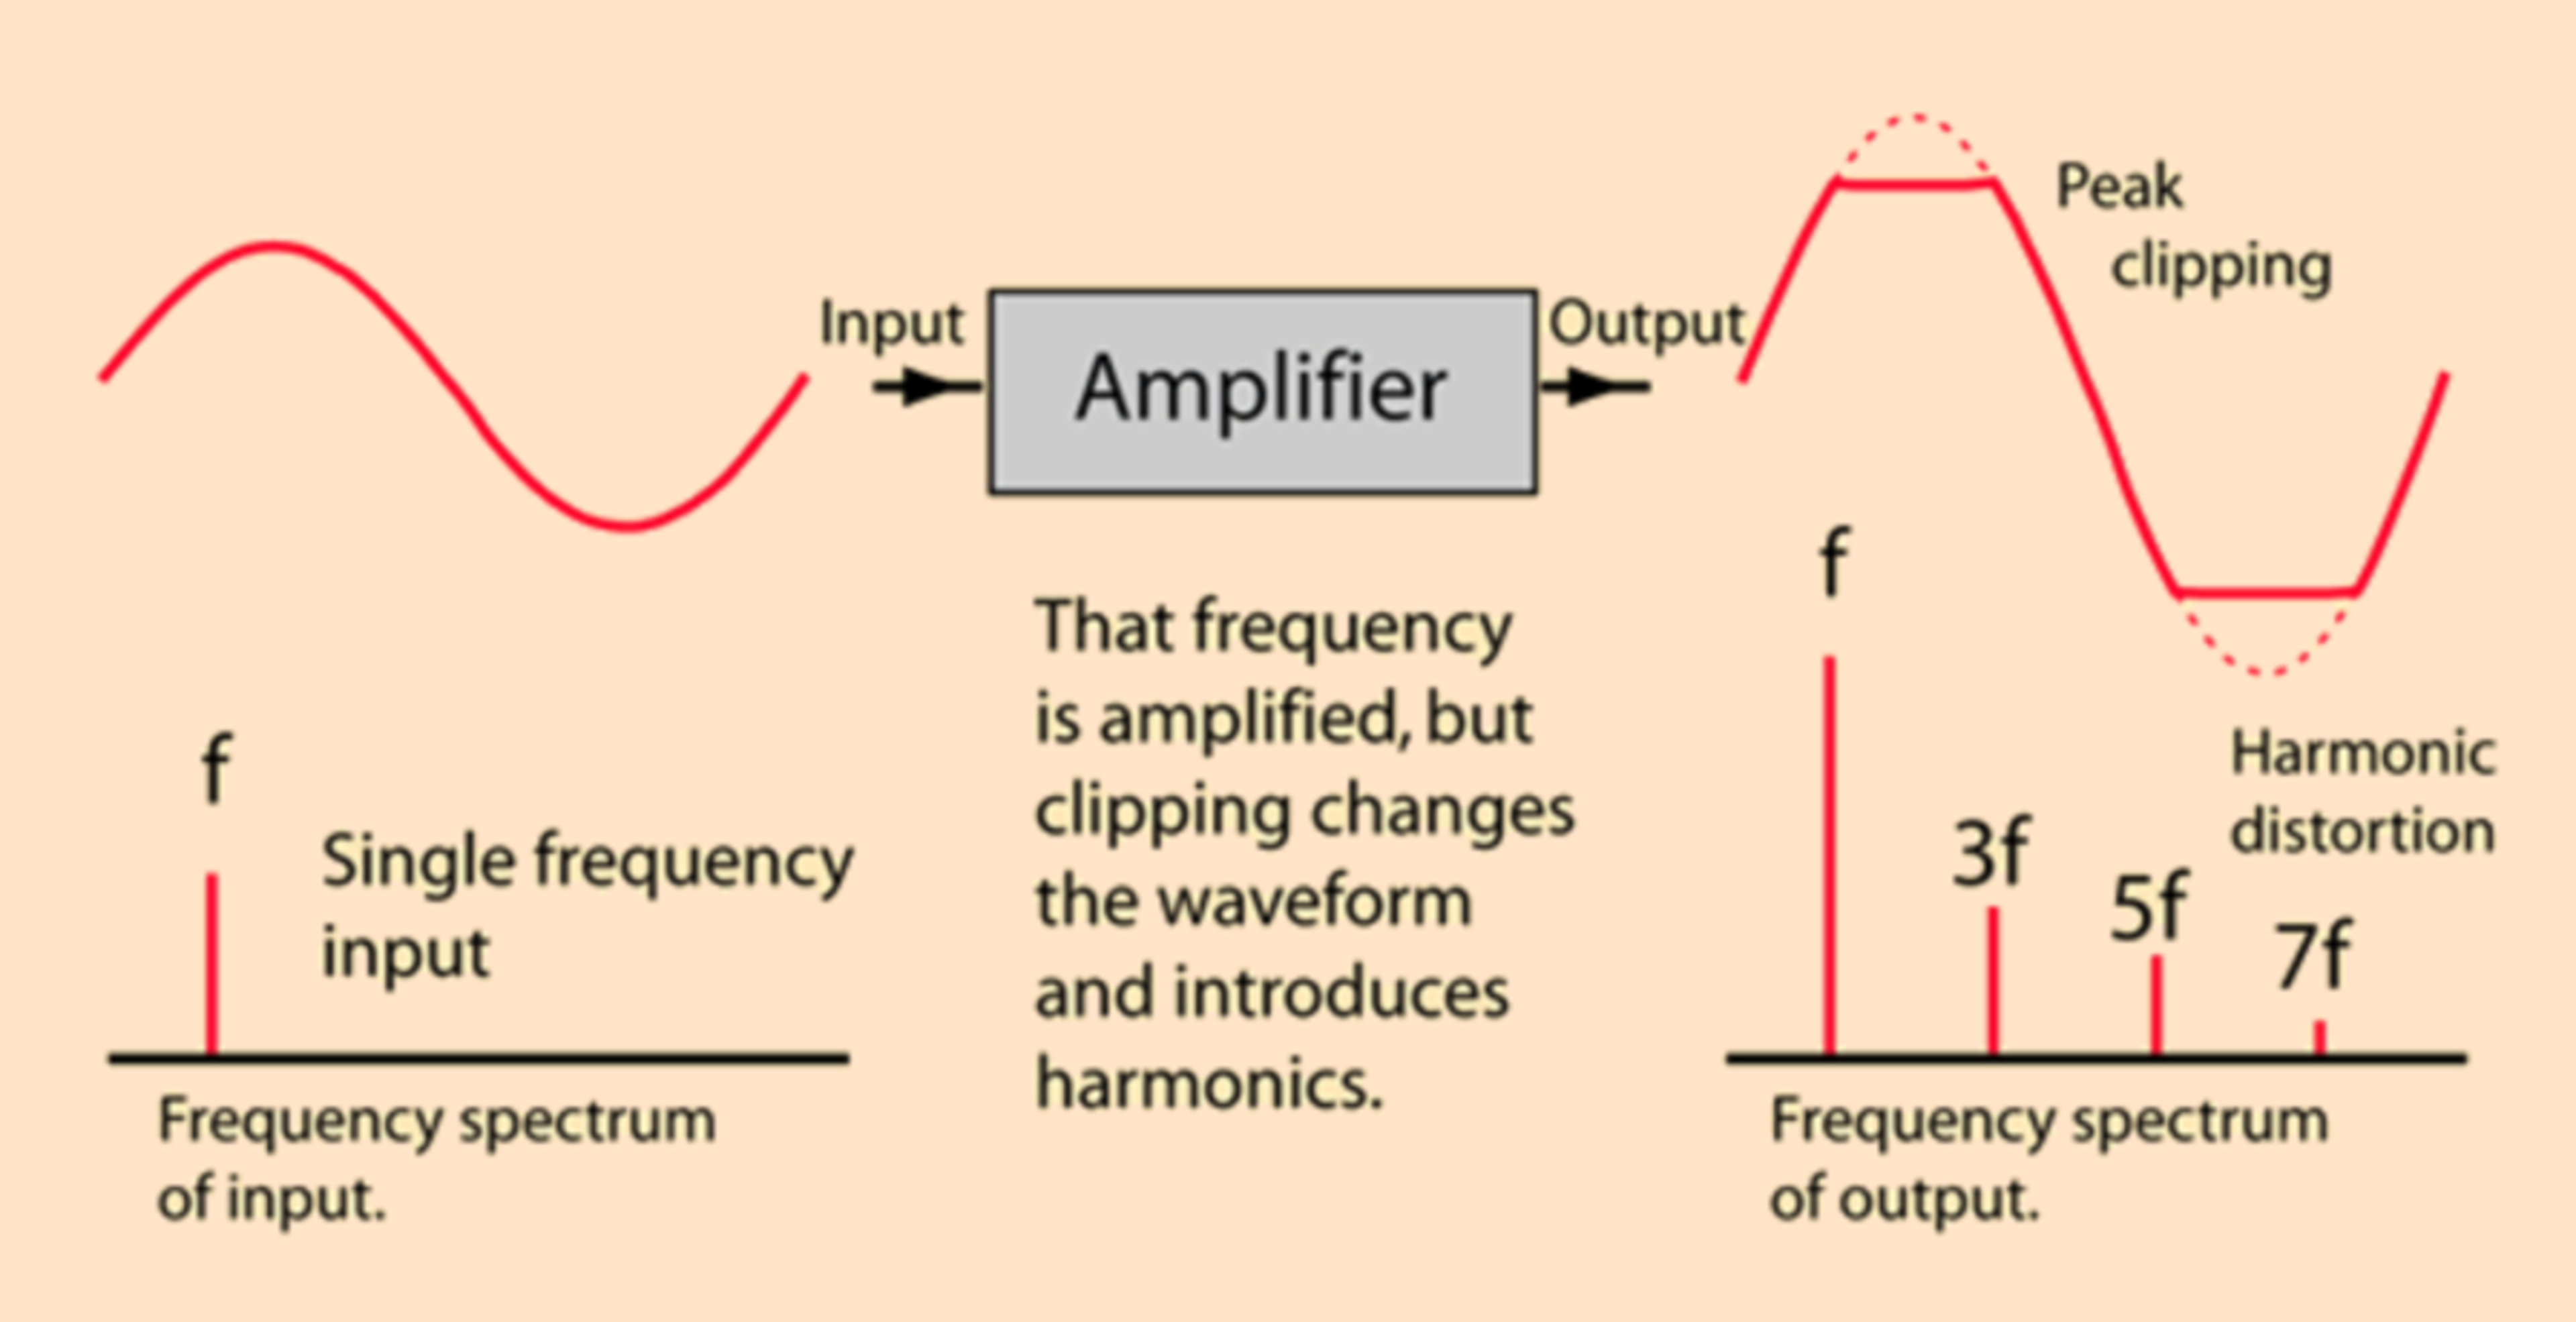
When we talk about 'distortion' in headphones, we're really talking about two different things. Linear distortion is the predictable shaping of the signal's amplitude (and phase) across frequency, which we usually call frequency response. Decades of research led by Dr. Sean Olive and colleagues have shown that frequency response explains the lion's share of how listeners judge headphone sound quality. It's also the part you can usually fix with EQ. Nonlinear distortion, by contrast, is level-dependent and creates new spectral components (such as harmonics and intermodulation products) that weren't in the original signal. These artifacts are harder to correct and can add roughness or harshness when loud enough. Any headphone, when pushed to its limits, will produce more of these overtones. The image below shows what happens in the frequency domain when a sine wave is pushed into clipping.
The question is: Do these harmonics matter at the listening levels people actually use their headphones at? It's possible that when used at reasonable playback levels, most modern headphone designs produce largely inaudible nonlinear distortion. Since we don't know the answer, we want to find out.
That's why we teamed up with Dr. Sean Olive, a leading figure in audio research with decades of experience at Harman and numerous scientific publications under his belt. Sean has been instrumental in developing methods to connect measurements with listener perception. His work has shaped how the entire industry thinks about headphone and loudspeaker design. By joining forces, we aim to accelerate progress in bridging the gap between technical distortion measurements and what listeners actually hear.
We first shared this joint effort publicly at CanJam SoCal on September 14, 2025, where Sean presented our combined talk on the Perception and Measurement of Nonlinear Distortion. This article is an overview of that seminar. It was an opportunity to highlight both the state of the art and the challenges ahead: we know how to measure distortion with sine waves and music-like signals, but we still don't know enough about audibility thresholds and whether reducing distortion consistently improves listener preference. This article is the first step in that journey. It summarizes the problem, reviews the best research so far, and explains why RTINGS is investing in this area. In a follow-up, we'll share our methodology and findings. For now, our goal is to show why distortion deserves more attention in headphone testing and why the industry needs better, perception-based ways of measuring it.
Measuring Distortion: Tools, Limits, And Listener Relevance
When evaluating headphone performance, distortion is one of the most discussed and misunderstood metrics. Engineers often rely on measurements like Total Harmonic Distortion (THD), Intermodulation Distortion (IMD), and more complex multi-tone or non-coherent analyses to quantify how faithfully a headphone reproduces sound. These measurements are grounded in physics and signal theory, but their relationship to human perception is less clear.
This disconnect between measurement and perception has been explored in published research, notably in a study presented in 2012 by Temme, Olive et al. Their work highlights a crucial point: objective distortion metrics don't always align with listener preference or audibility. In some cases, headphones with higher measured distortion were still preferred by listeners, depending on the frequency region and the nature of the distortion.
In this section, we'll review the main distortion measurement techniques used in headphone testing, explain what each one reveals, and discuss how and whether they correlate with listener experience, drawing on findings from Temme et al. and others.
THD
When people talk about distortion in headphones, the metric that almost always shows up first is Total Harmonic Distortion (THD). In plain language, THD tells you how much extra harmonic content the device adds on top of the signal you feed it. If you send a pure tone into a perfectly linear headphone, you should get the same tone back. In the real world, nonlinearities in the driver create harmonics at multiples of that tone (2×, 3×, 4×, …). THD is the sum of the energy in those harmonics relative to the input signal, expressed as a percentage. A lower THD value corresponds to less distortion.
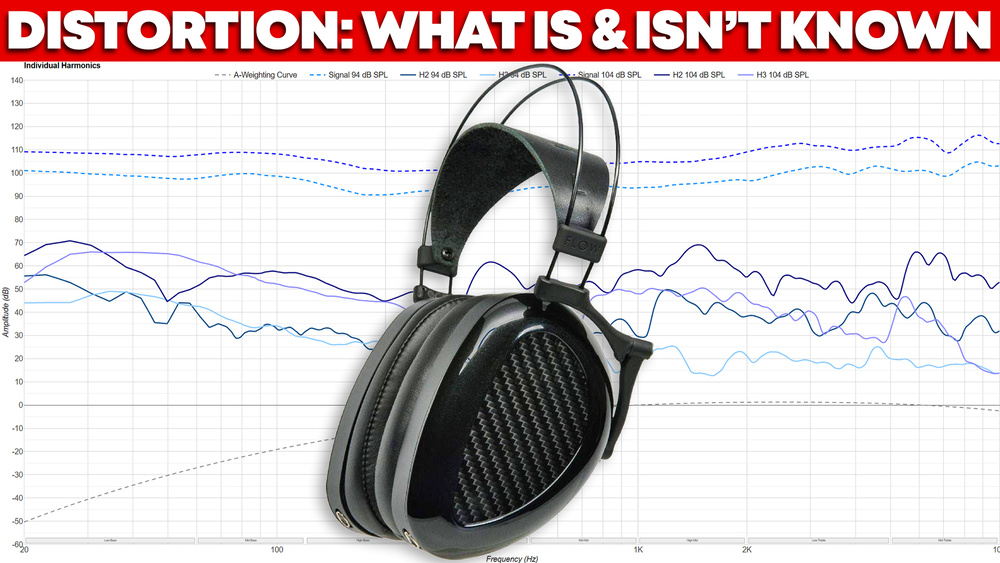
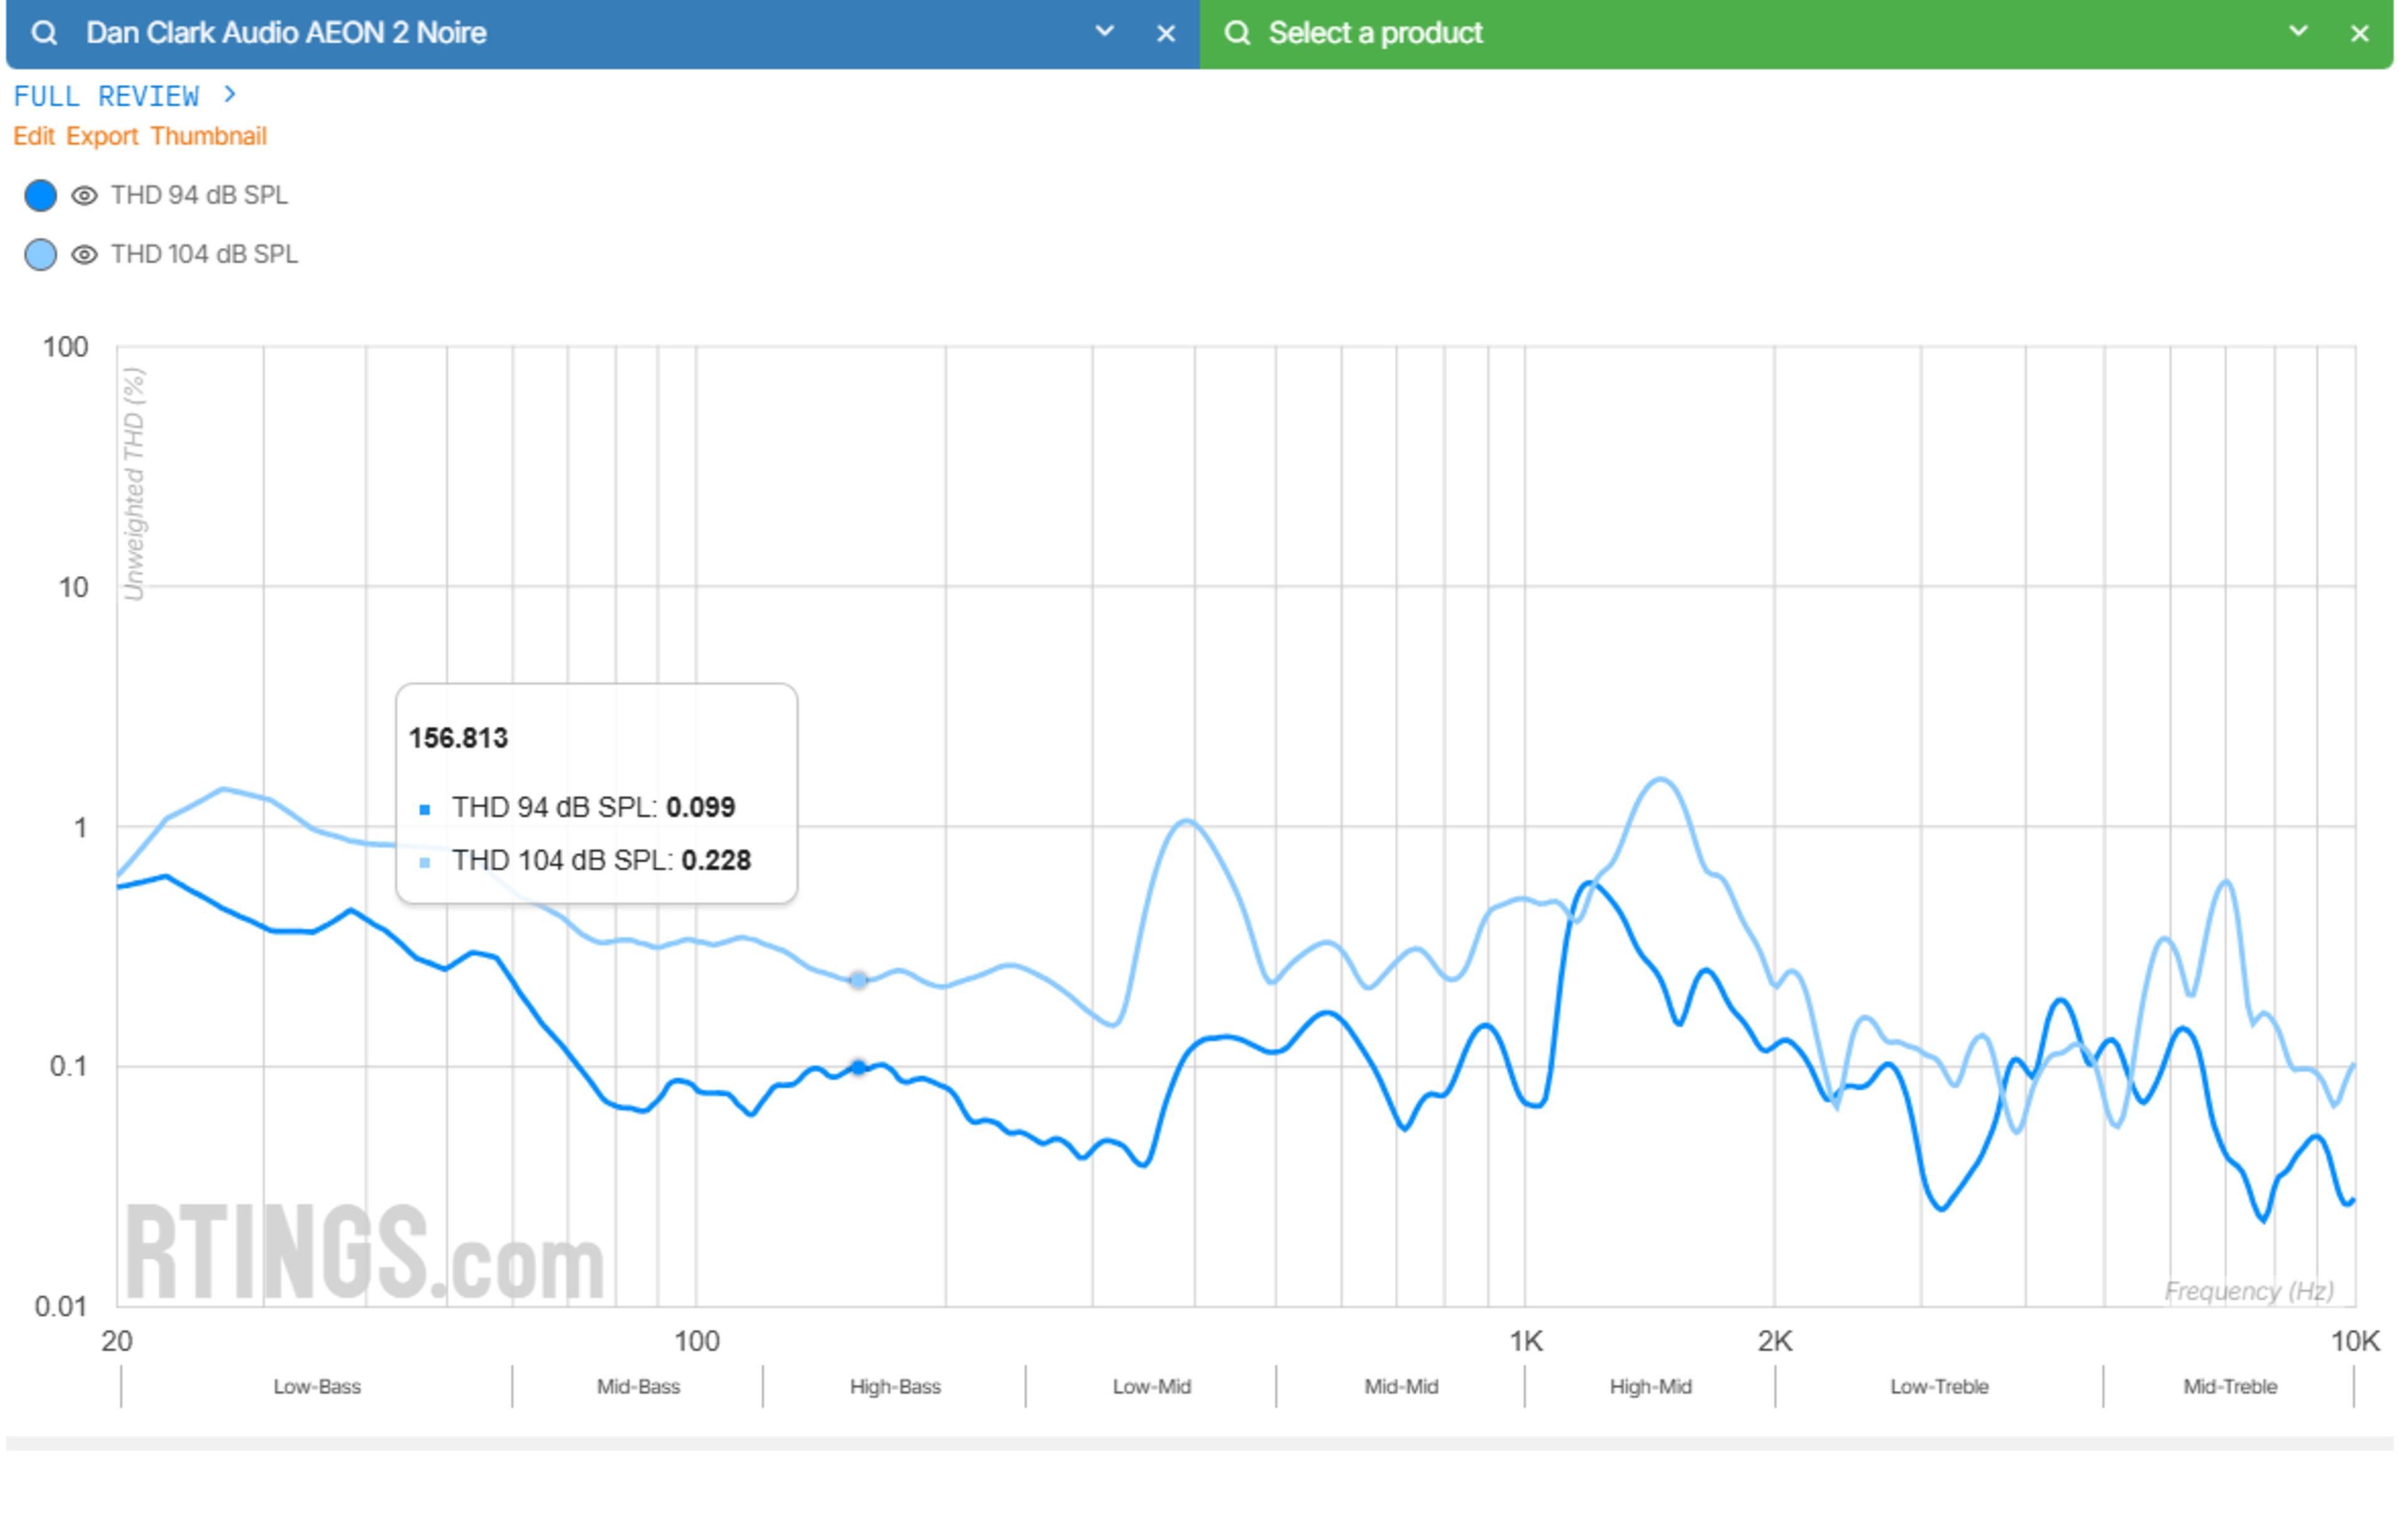
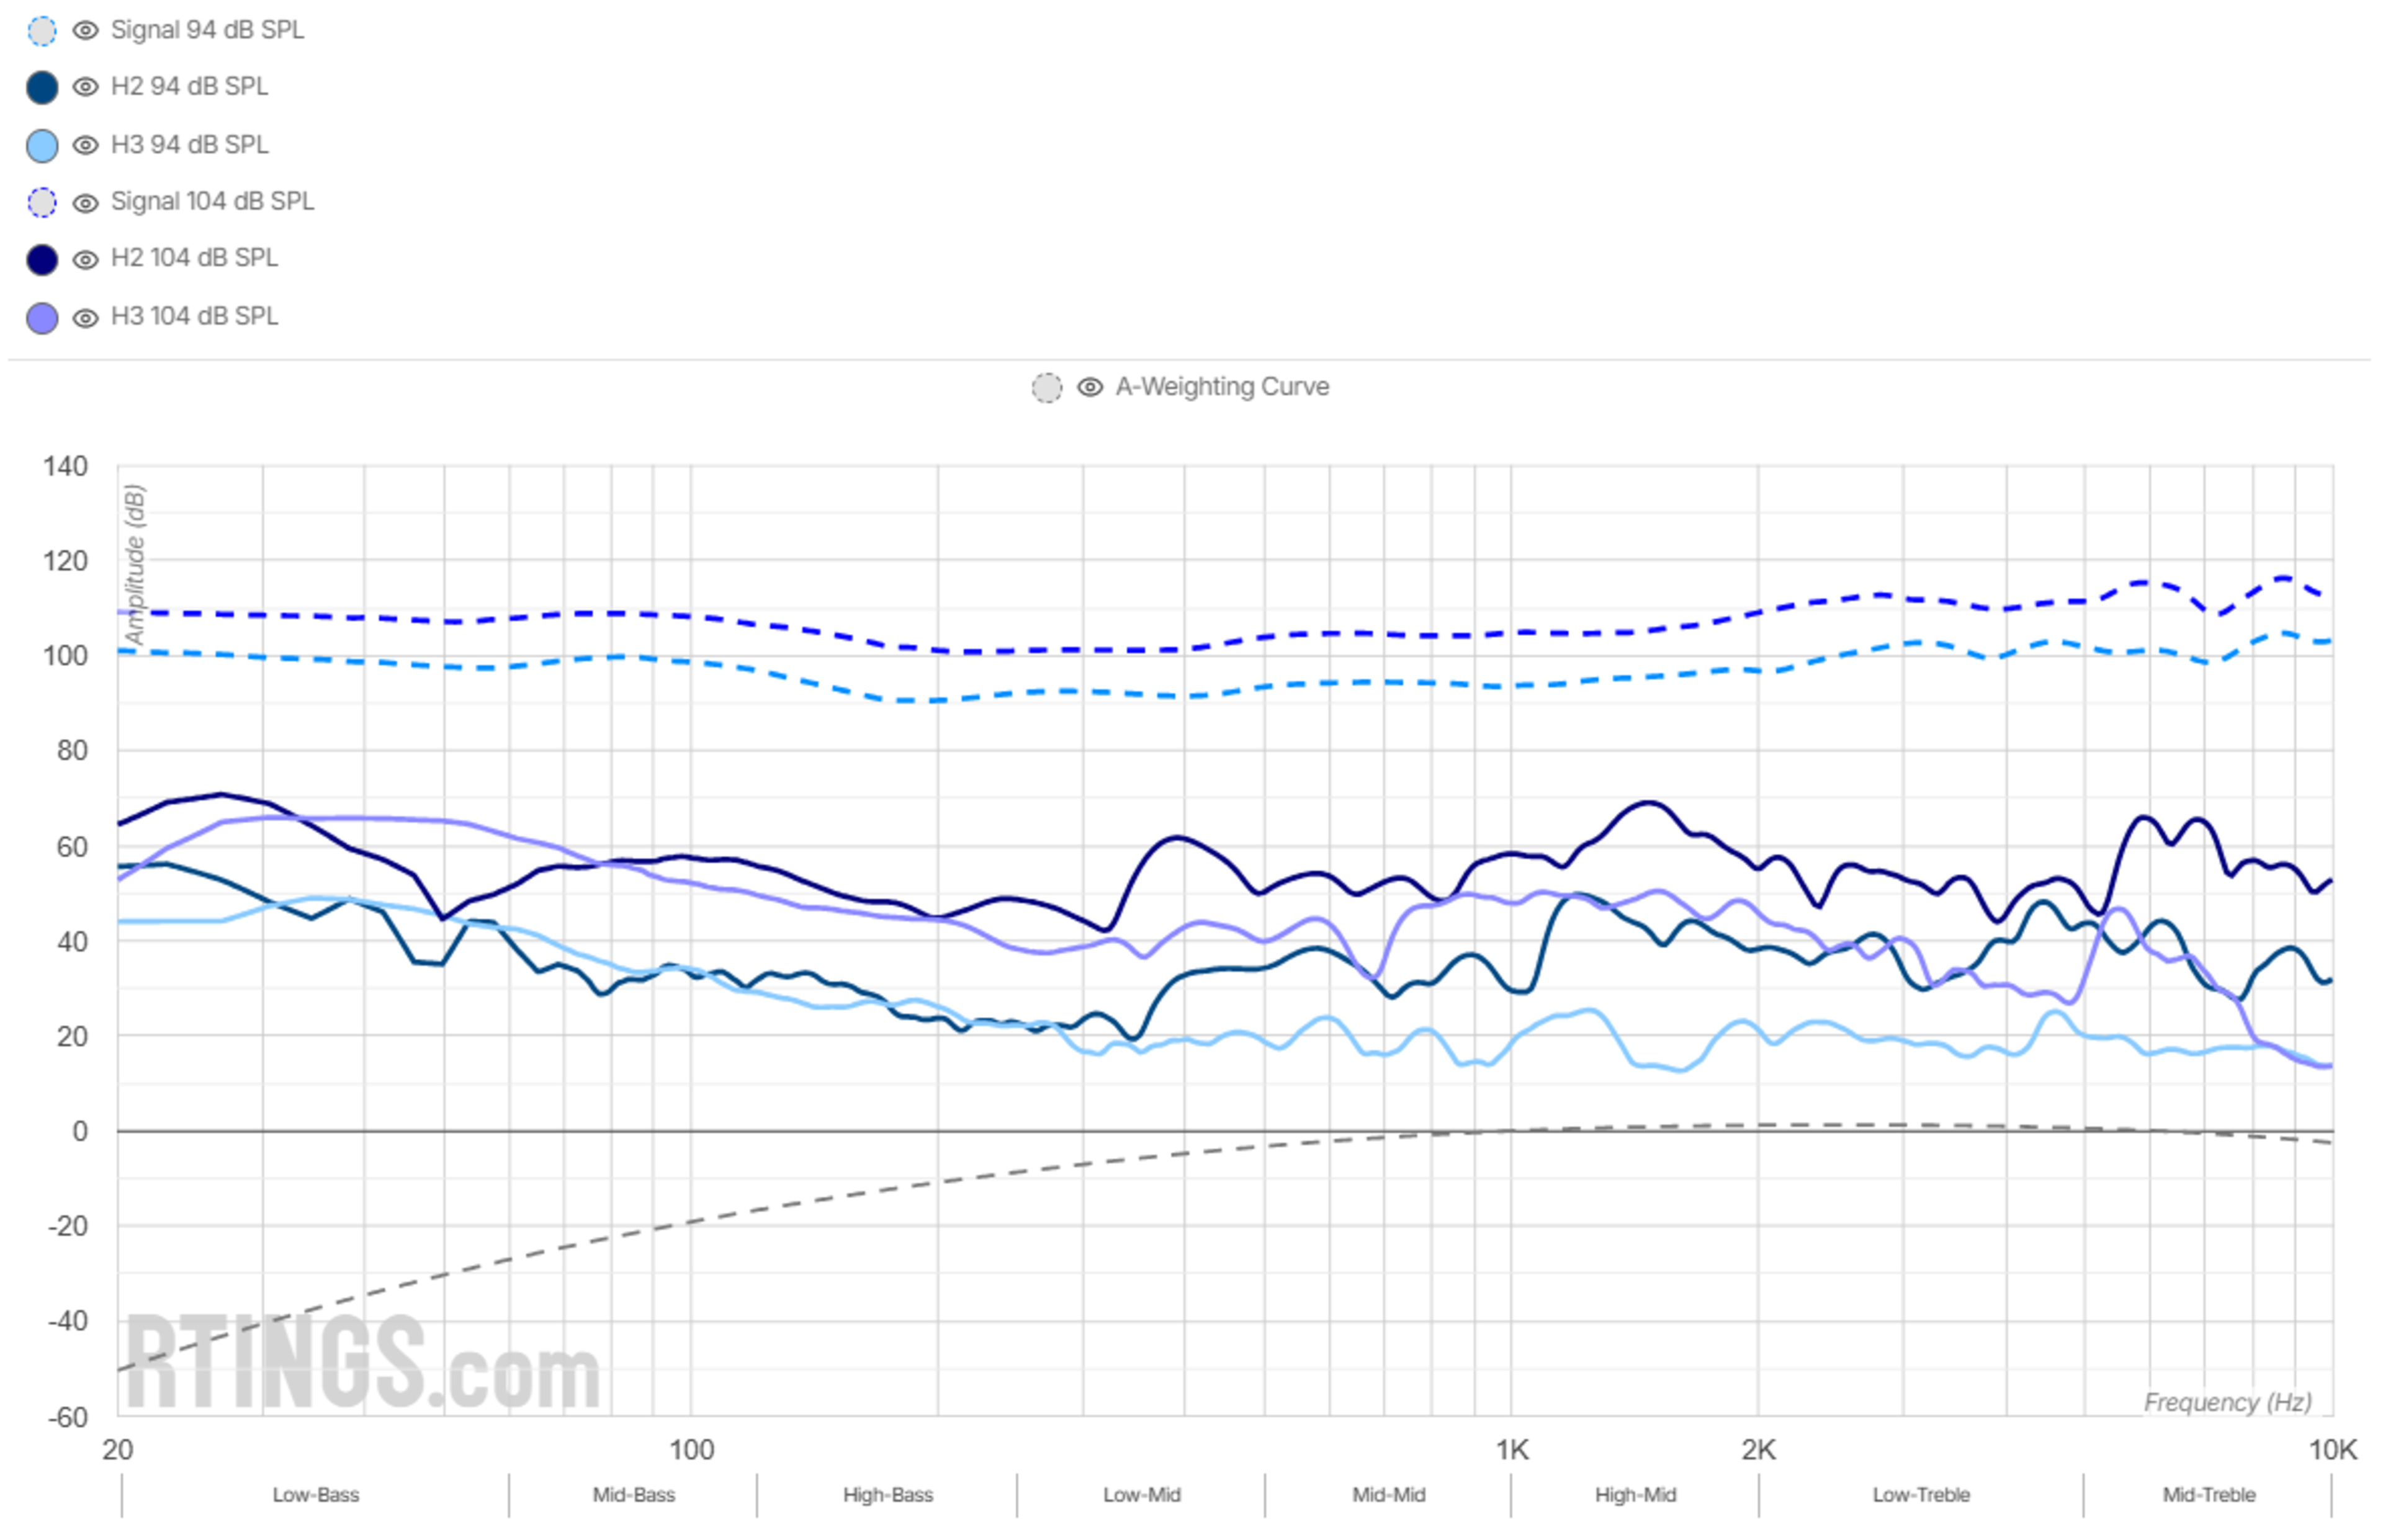
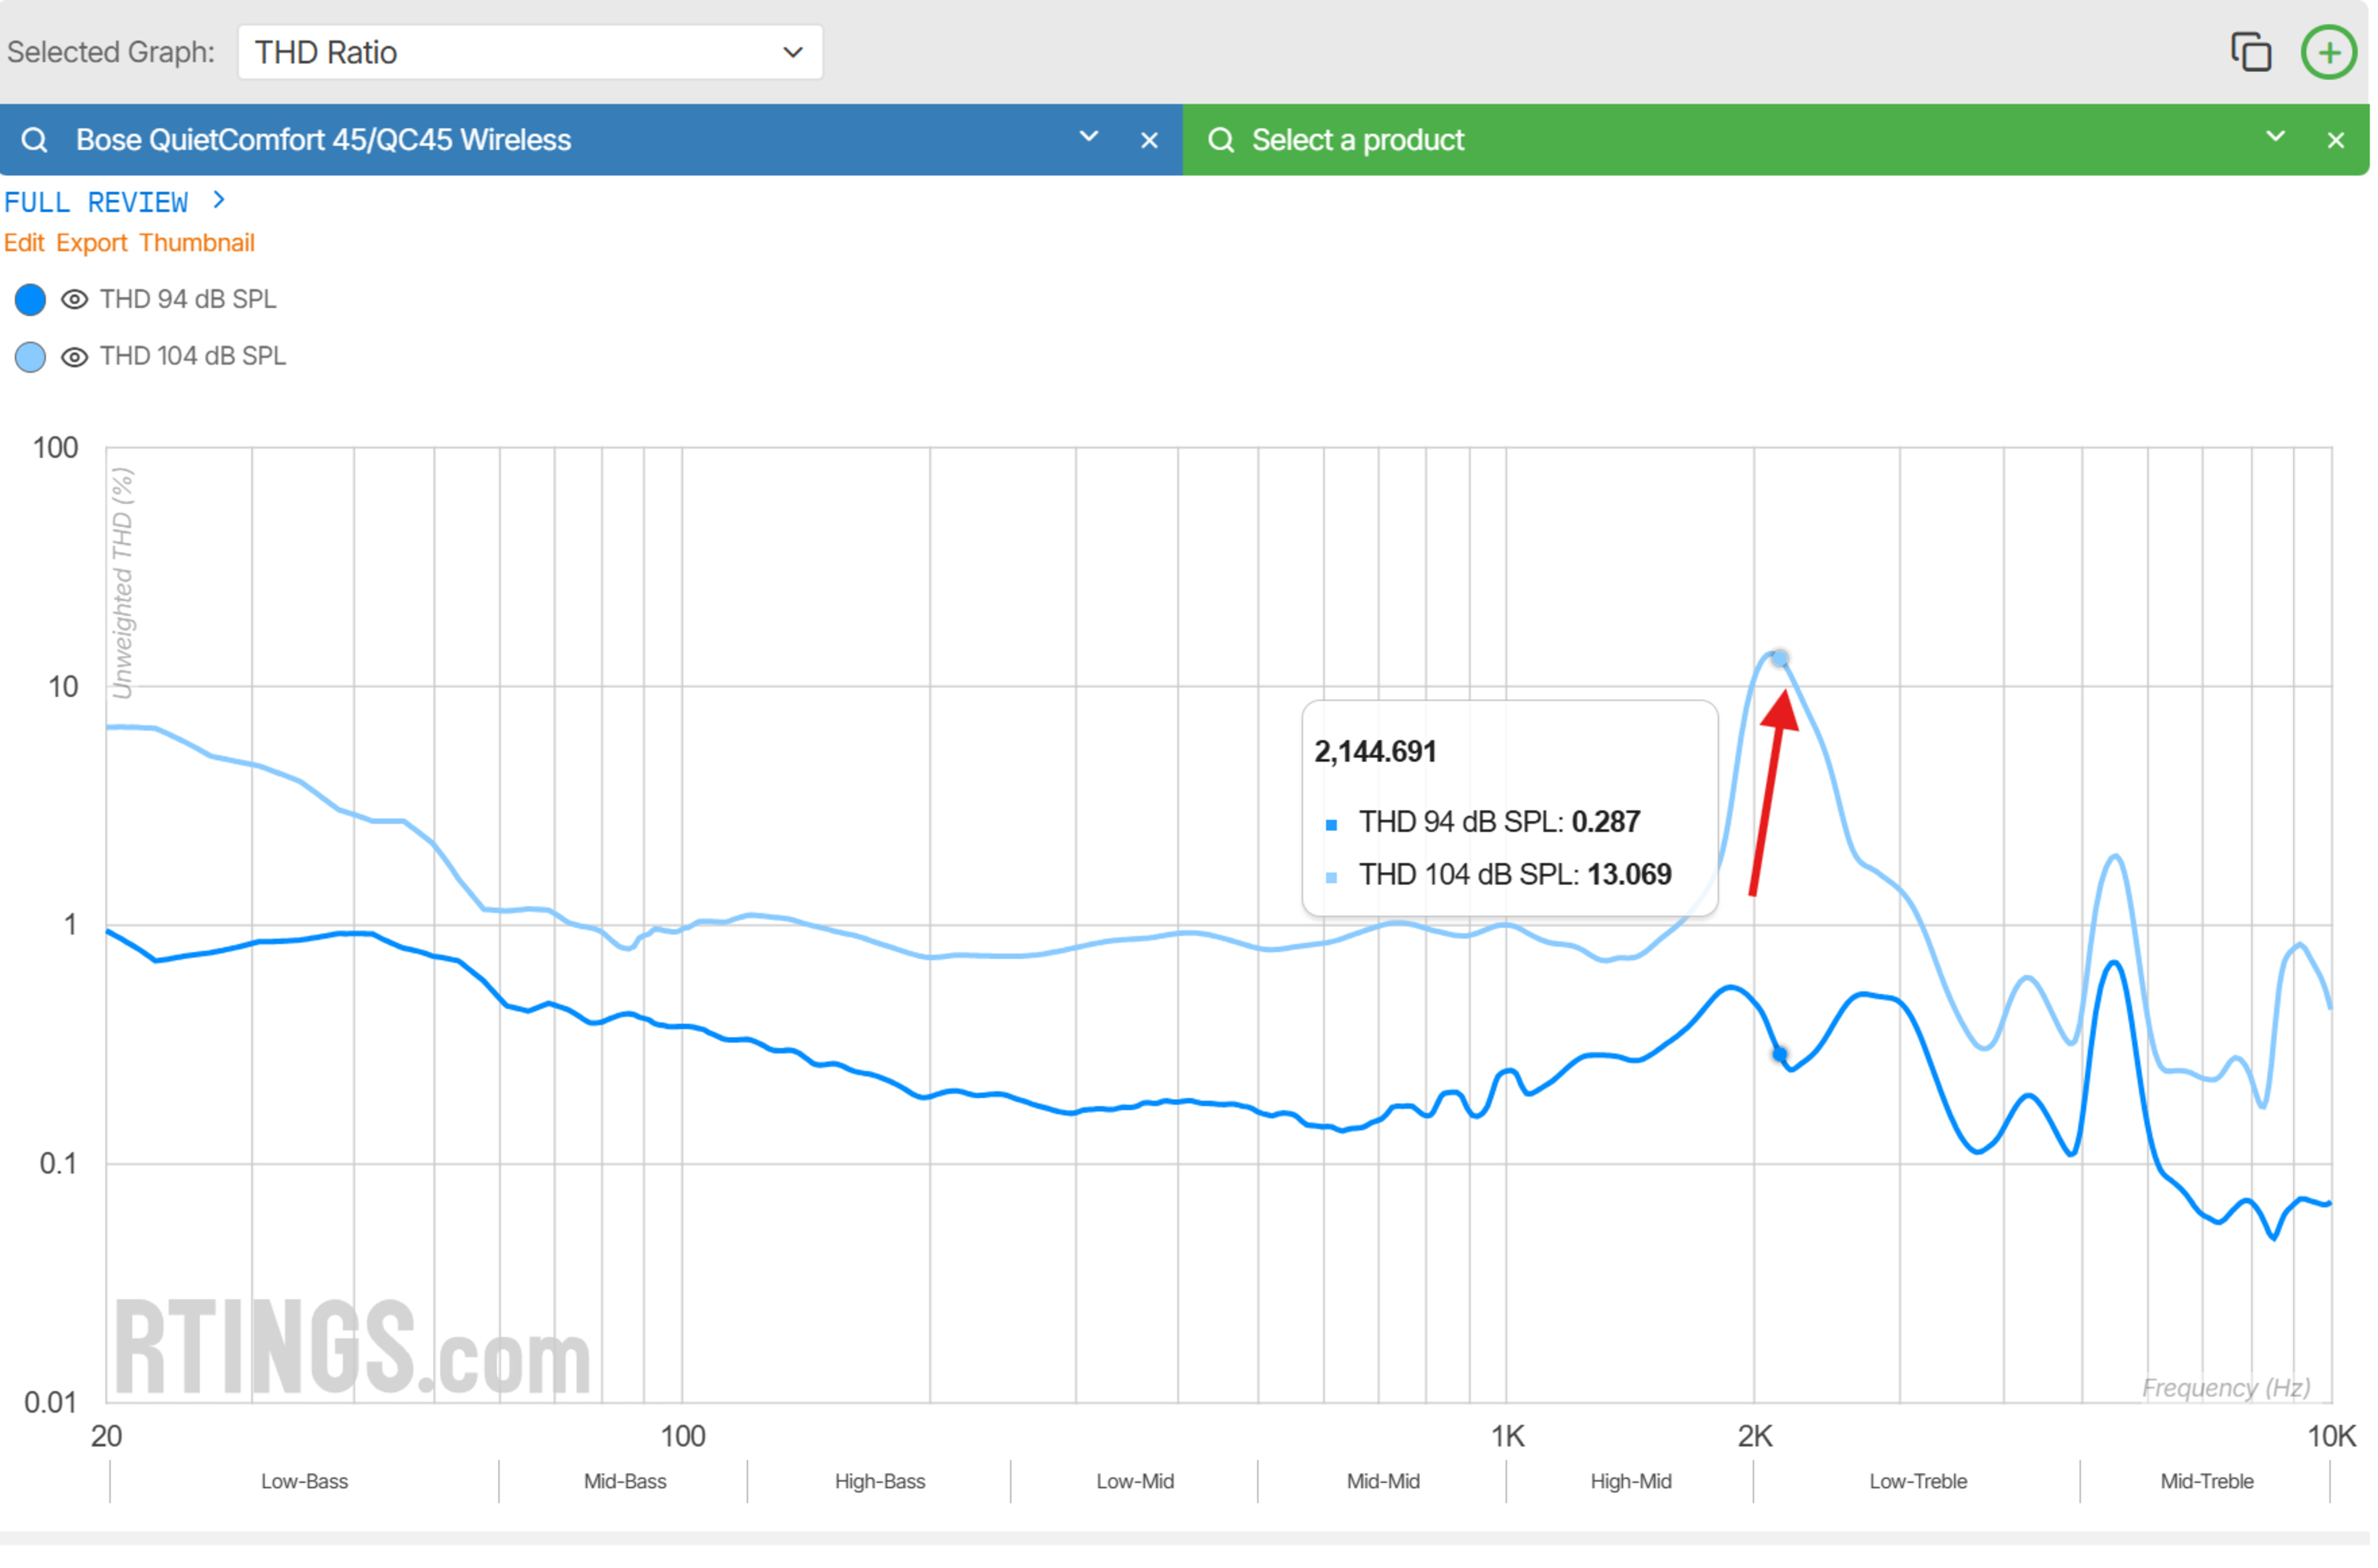
For headphone testing, most labs (including RTINGS) measure THD across frequency using a swept sine, usually in the same pass as the frequency-response sweep. You end up with a curve that shows THD vs. frequency, and because distortion tends to increase with output volume, you'll often see those curves at multiple playback levels. In our case, 94 and 104 dB SPL. Our reviews also include a graph that isolates the 2nd and 3rd harmonic components. This gives more context than a single '0.2% THD @ 1 kHz' number and helps you see where in the frequency domain a headphone's nonlinearities reside (e.g., elevated distortion below 100 Hz) and how they scale with level.
Technical Strengths and Weaknesses
Here's the catch: THD doesn't always correlate with what people hear. In the experiments of Temme et al., after normalizing the frequency response of the headphones to a common target to remove linear distortion as a variable, headphones with higher THD weren't always rated worse by listeners. In fact, some headphones with elevated THD at low frequencies were still preferred, possibly because the ear is less sensitive to distortion in that range. On the other hand, distortion in the 1–5 kHz region, where hearing is more sensitive, seemed to affect preference more strongly.
Dual-Tone IMD: Capturing Interaction
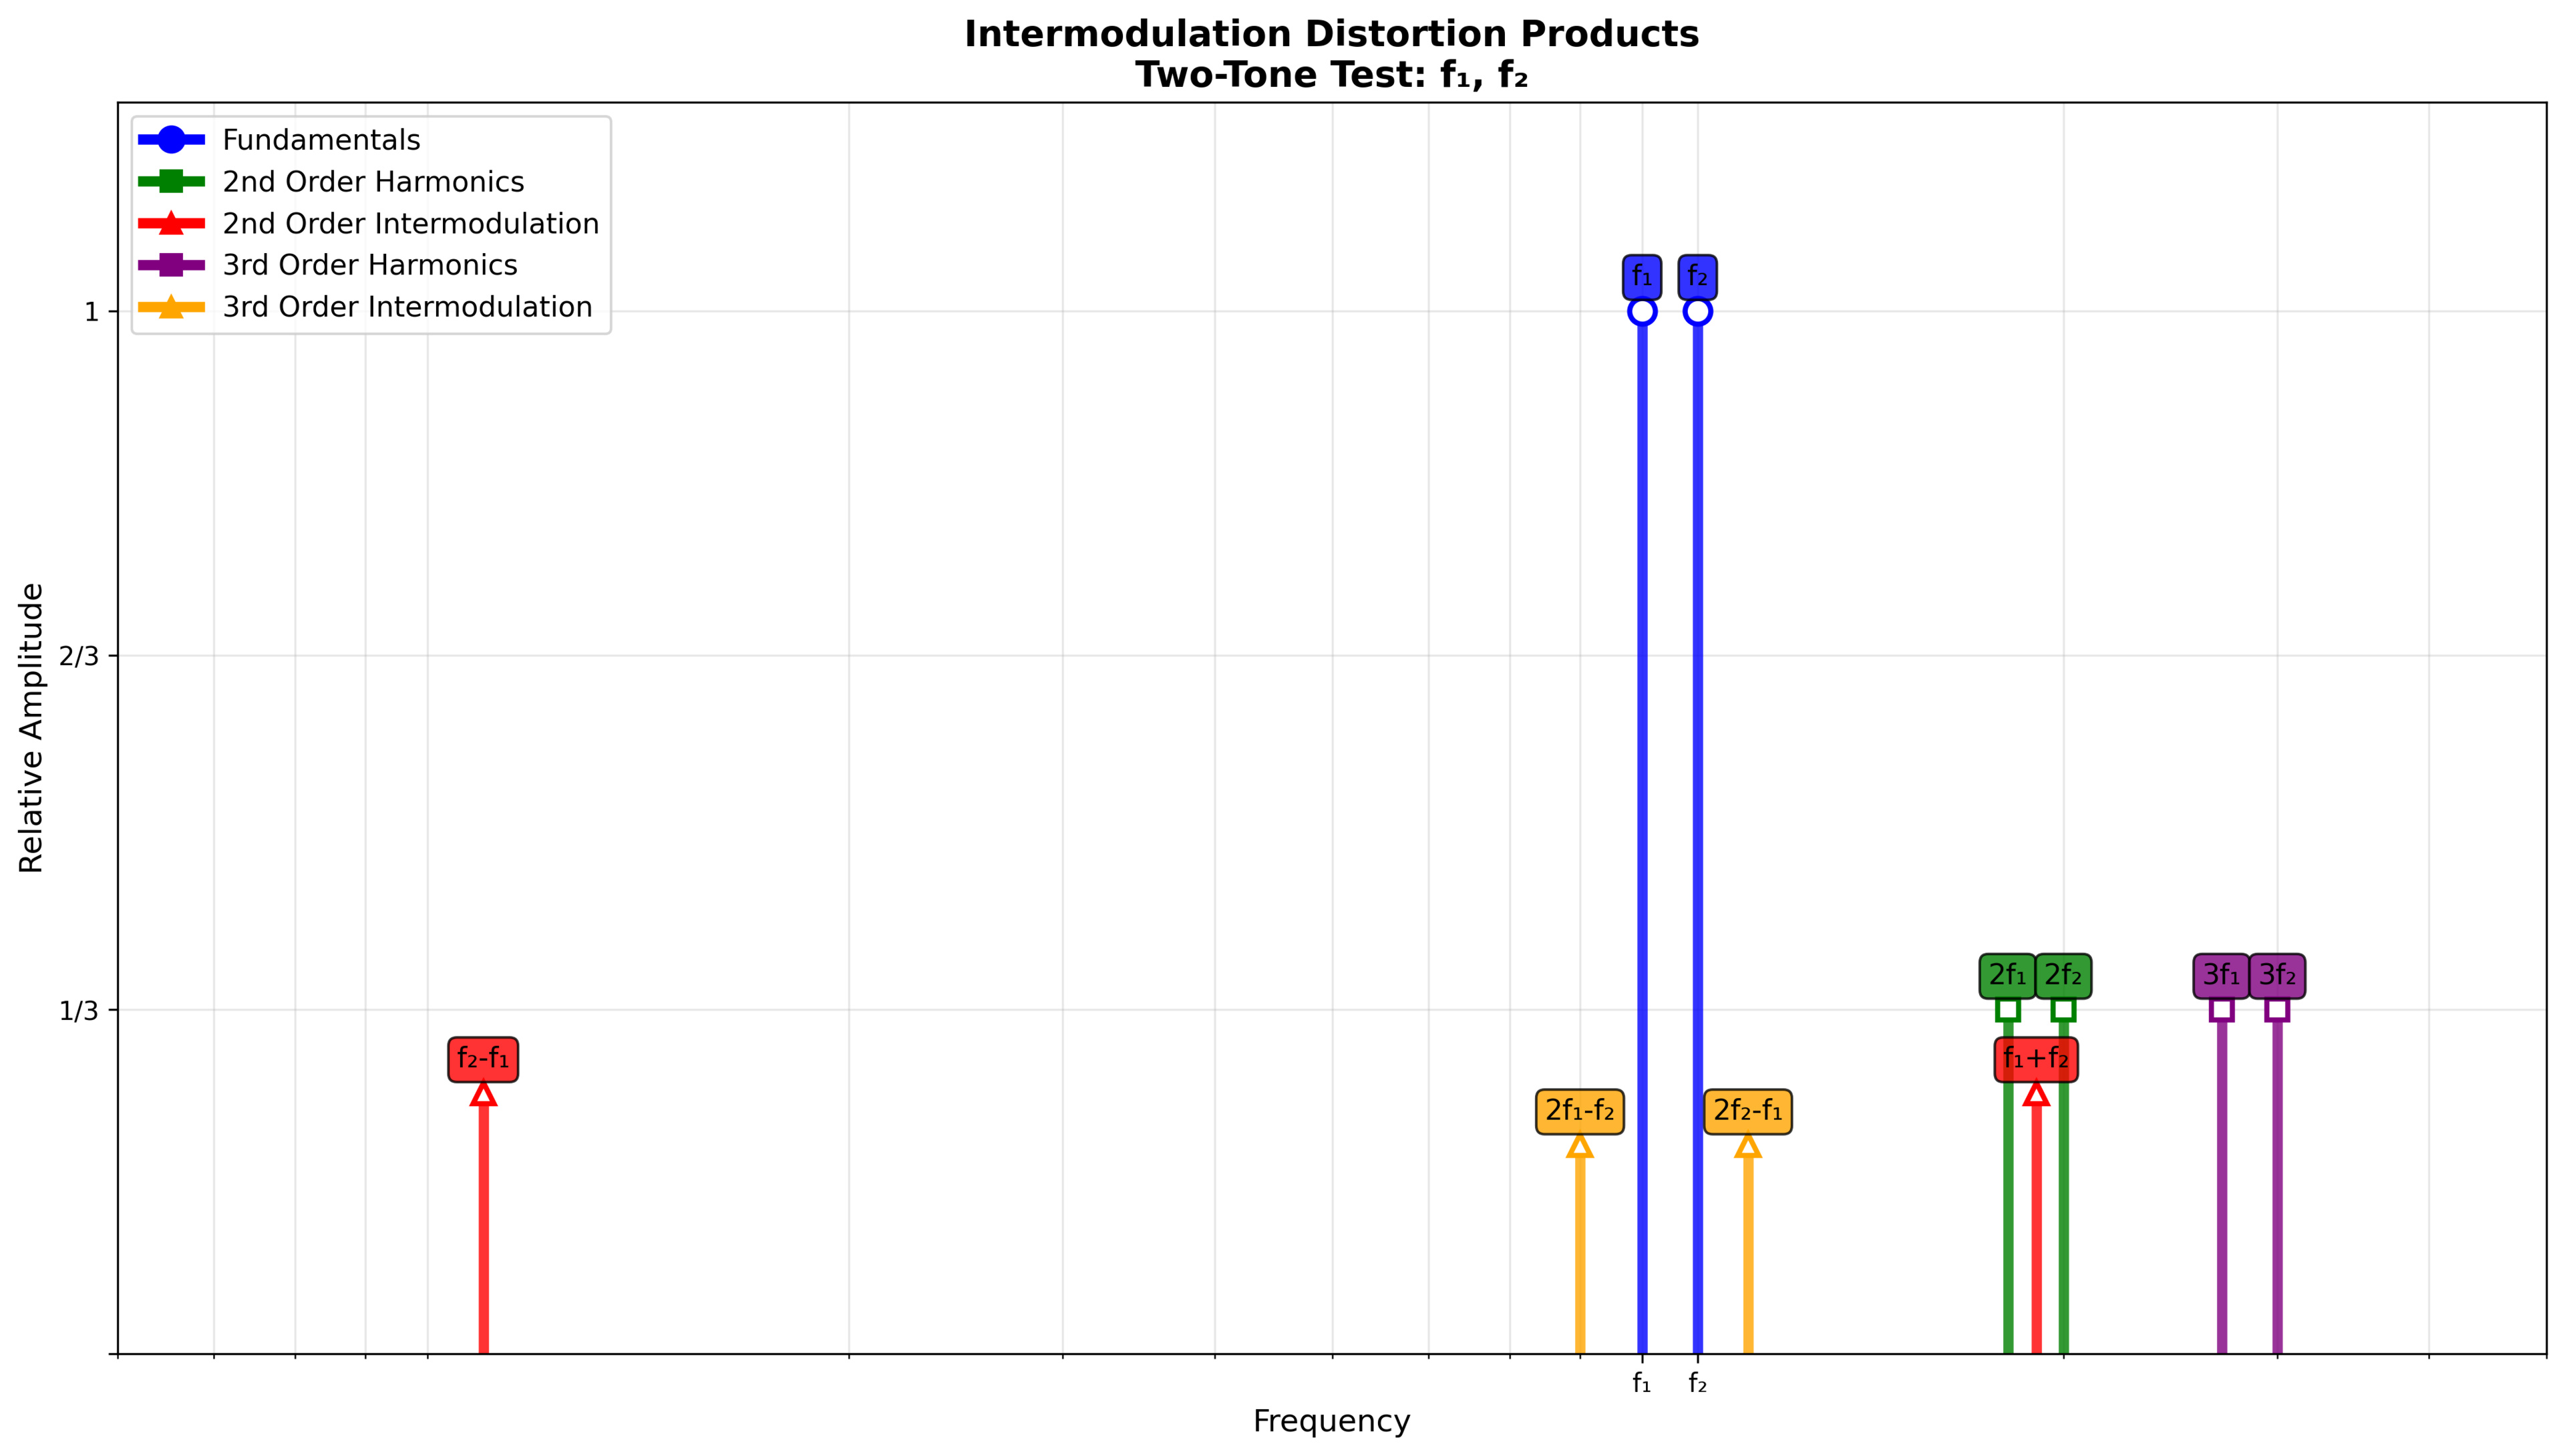
To probe how distortion behaves when multiple frequencies interact, engineers typically use dual-tone intermodulation distortion (IMD) tests. Standards like SMPTE (60 Hz and 7 kHz) and ITU-R (two tones 1 kHz apart) help us see new components that emerge at sum and difference frequencies. The idea is to simulate how bass and treble coexist in real music and stress the driver in a way that's more representative of usage than a single sine wave.
In theory, IMD should reveal modulation-like artifacts that THD misses. But in practice, the correlation with listener preference is weak. In the Temme et al. study, some headphones with high IMD were still rated highly, while others with lower IMD were disliked. Not all intermodulation products are equally audible, and whether listeners experience them as annoying depends heavily on where they land spectrally and how they interact with the masking properties of the music.
It's also a case-specific measurement. We don't know of any headphone labs that make it a metric of choice: it's far more popular in electronics and signal transmission. You can think of it more as a test to verify whether standards are respected rather than a measure used to quantify performance. The image below shows the extra harmonics produced by an IMD test.
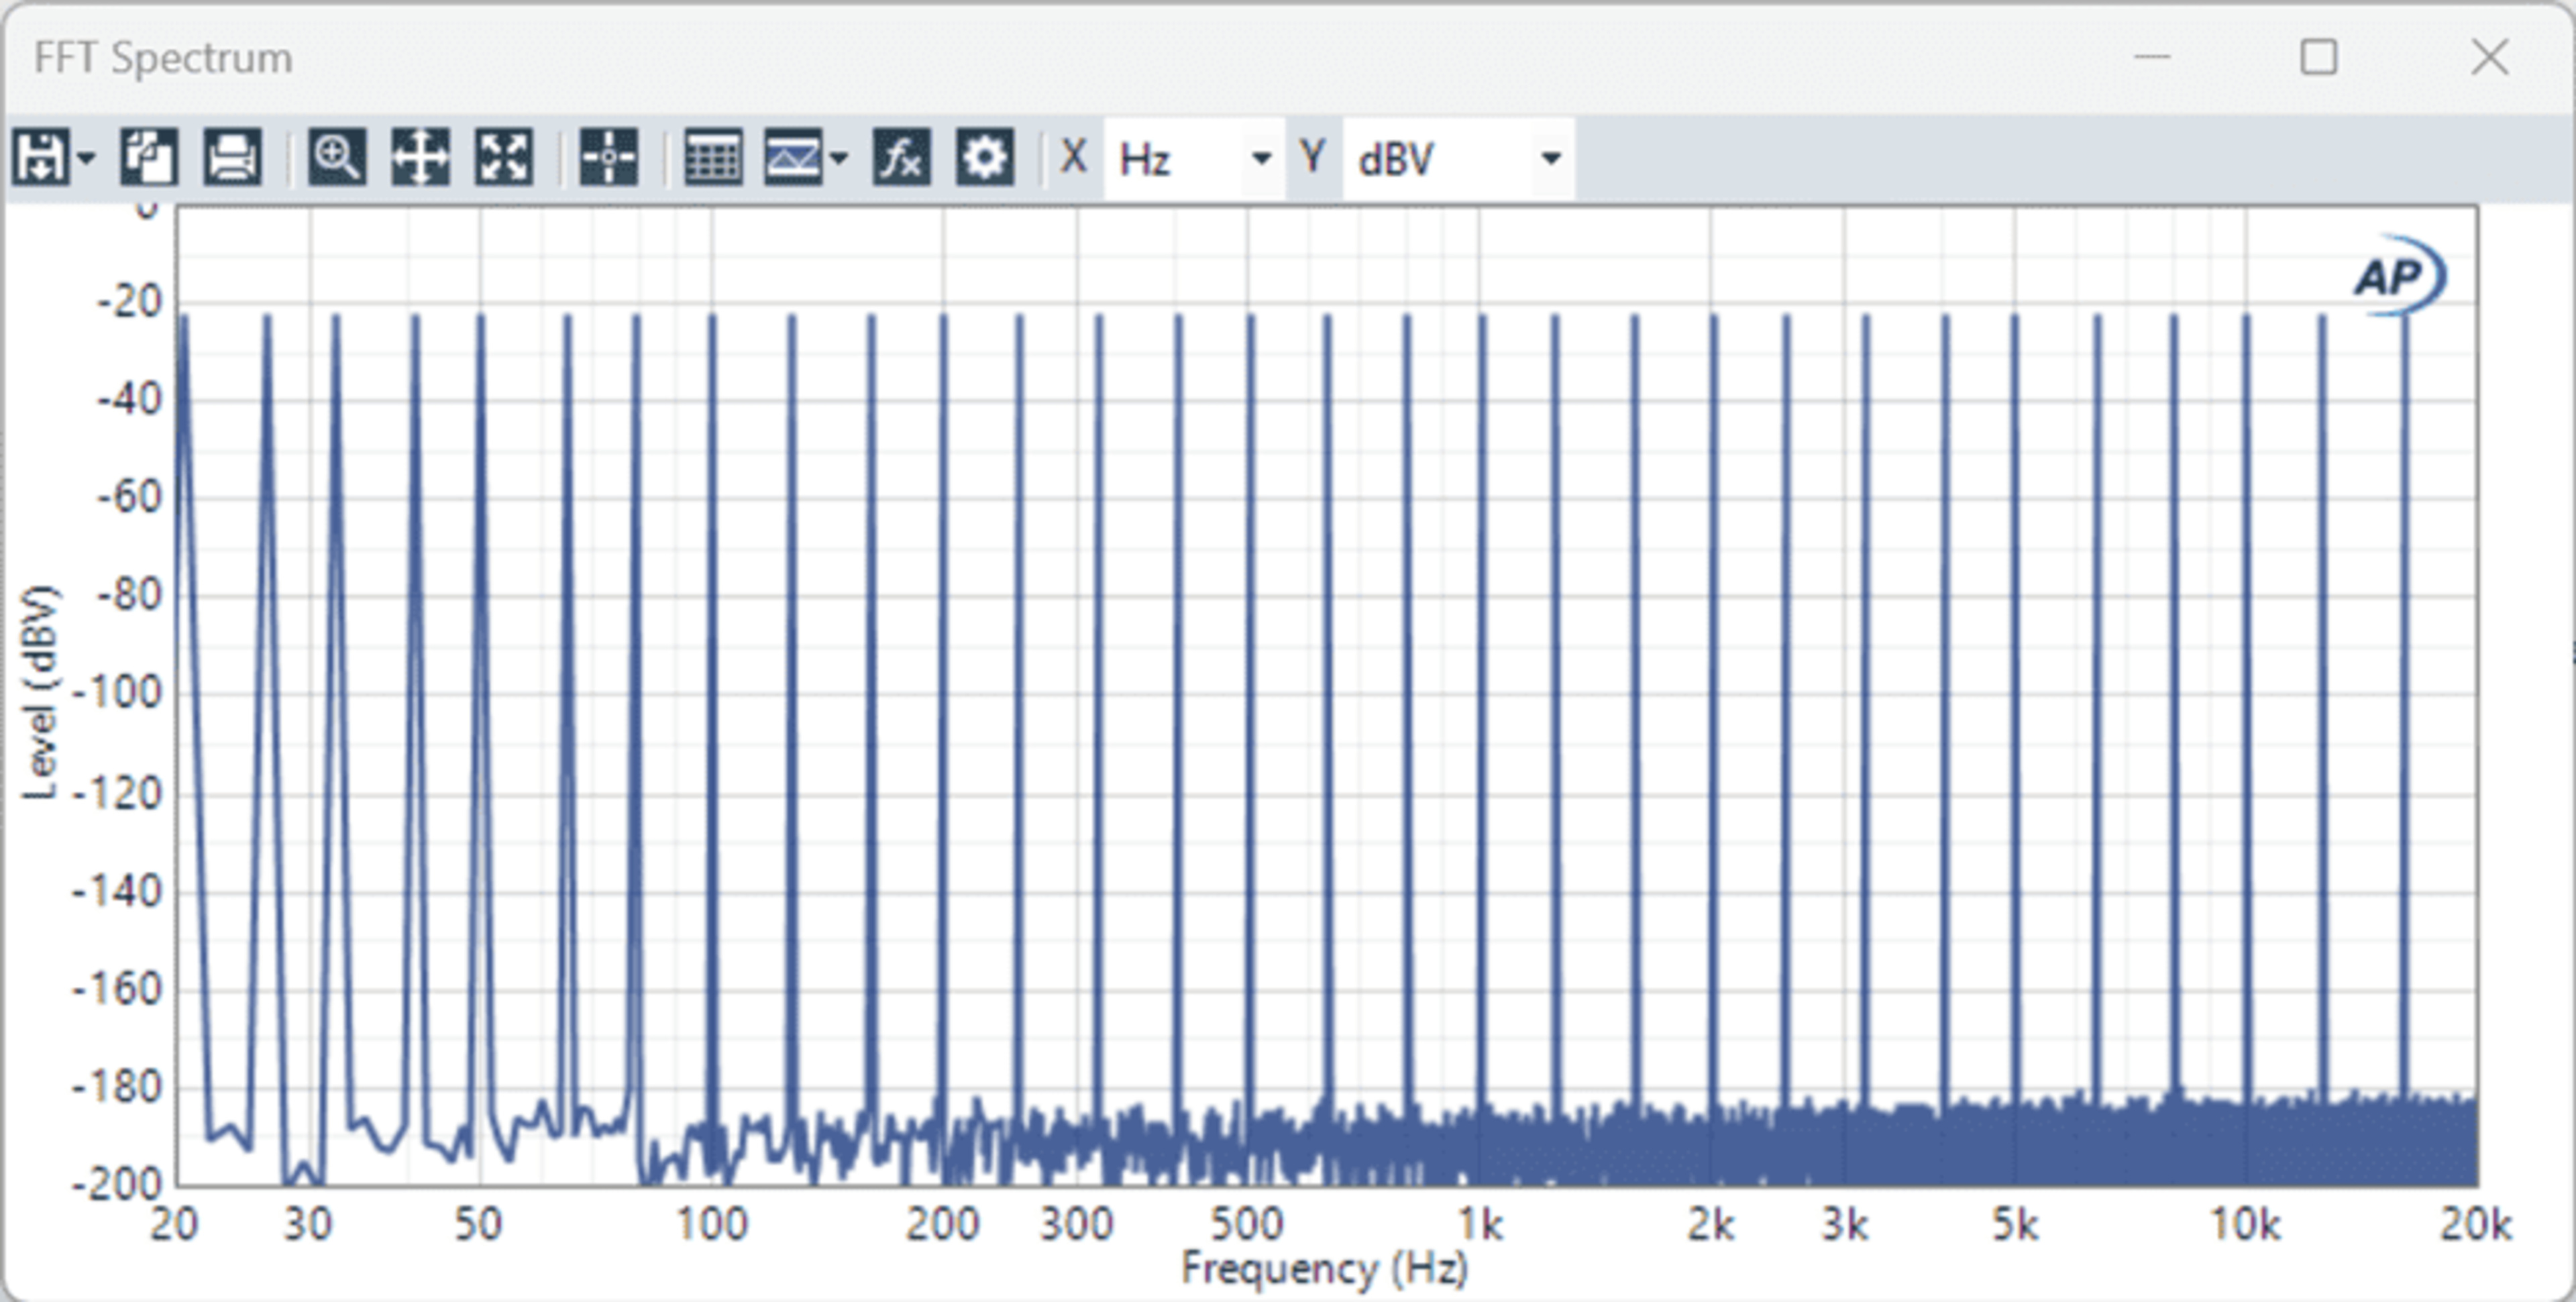
Multi-Tone Testing: Simulating Musical Complexity
Multi-tone signals take the same idea further by feeding dozens of sine waves simultaneously across the band. If a system is non-linear, this creates a dense forest of intermodulation products. These multitone signals resemble music more closely than simple sine sweeps, and they're often used to stress systems quickly and efficiently.
But again, the results don't always match what listeners report. In the same Temme et al. study, headphones with high multitone distortion weren't necessarily rated worse. Some were preferred despite measurable artifacts. This suggests that multitone tests are practical for measuring the nonlinear behavior of headphones but insufficient for predicting audibility or preference.
Non-Coherent Distortion with Complex Stimuli
A more perceptually grounded approach uses real signals (such as speech or music) and separates the linear and nonlinear parts of the response. This method, often referred to as non-coherent distortion analysis, looks at how much of the output cannot be explained by a best-fit linear model. The residual of this fit is thus treated as distortion.
This technique is particularly sensitive to noise but, when done right, is powerful. In the Temme et al. study, non-coherent distortion measured with music correlated best with listener ratings. That makes sense: it uses the same stimulus as the listening test and captures the full complexity of how distortion interacts with real content.
This technique isn't perfect: measurement noise and level normalization make it hard to trust at lower signal-to-noise ratios, but it's the closest we've come to a measured metric that reflects what people actually hear. The study suggests that measuring the non-coherent distortion in headphones can predict its audibility for certain pieces of music. However, the problem remains that no standardized pieces of music for testing exist, and the music you choose may influence the results of the test.
Critical Bands and Masking: Why a Number Isn't a Verdict
Human hearing doesn't audit every spectral line equally. It organizes sound in overlapping 'critical bands.' Energy inside a band partially masks other energy nearby, and the effect grows with level.
Our critical bands are much narrower than in the example shown below, but the general trend is right.
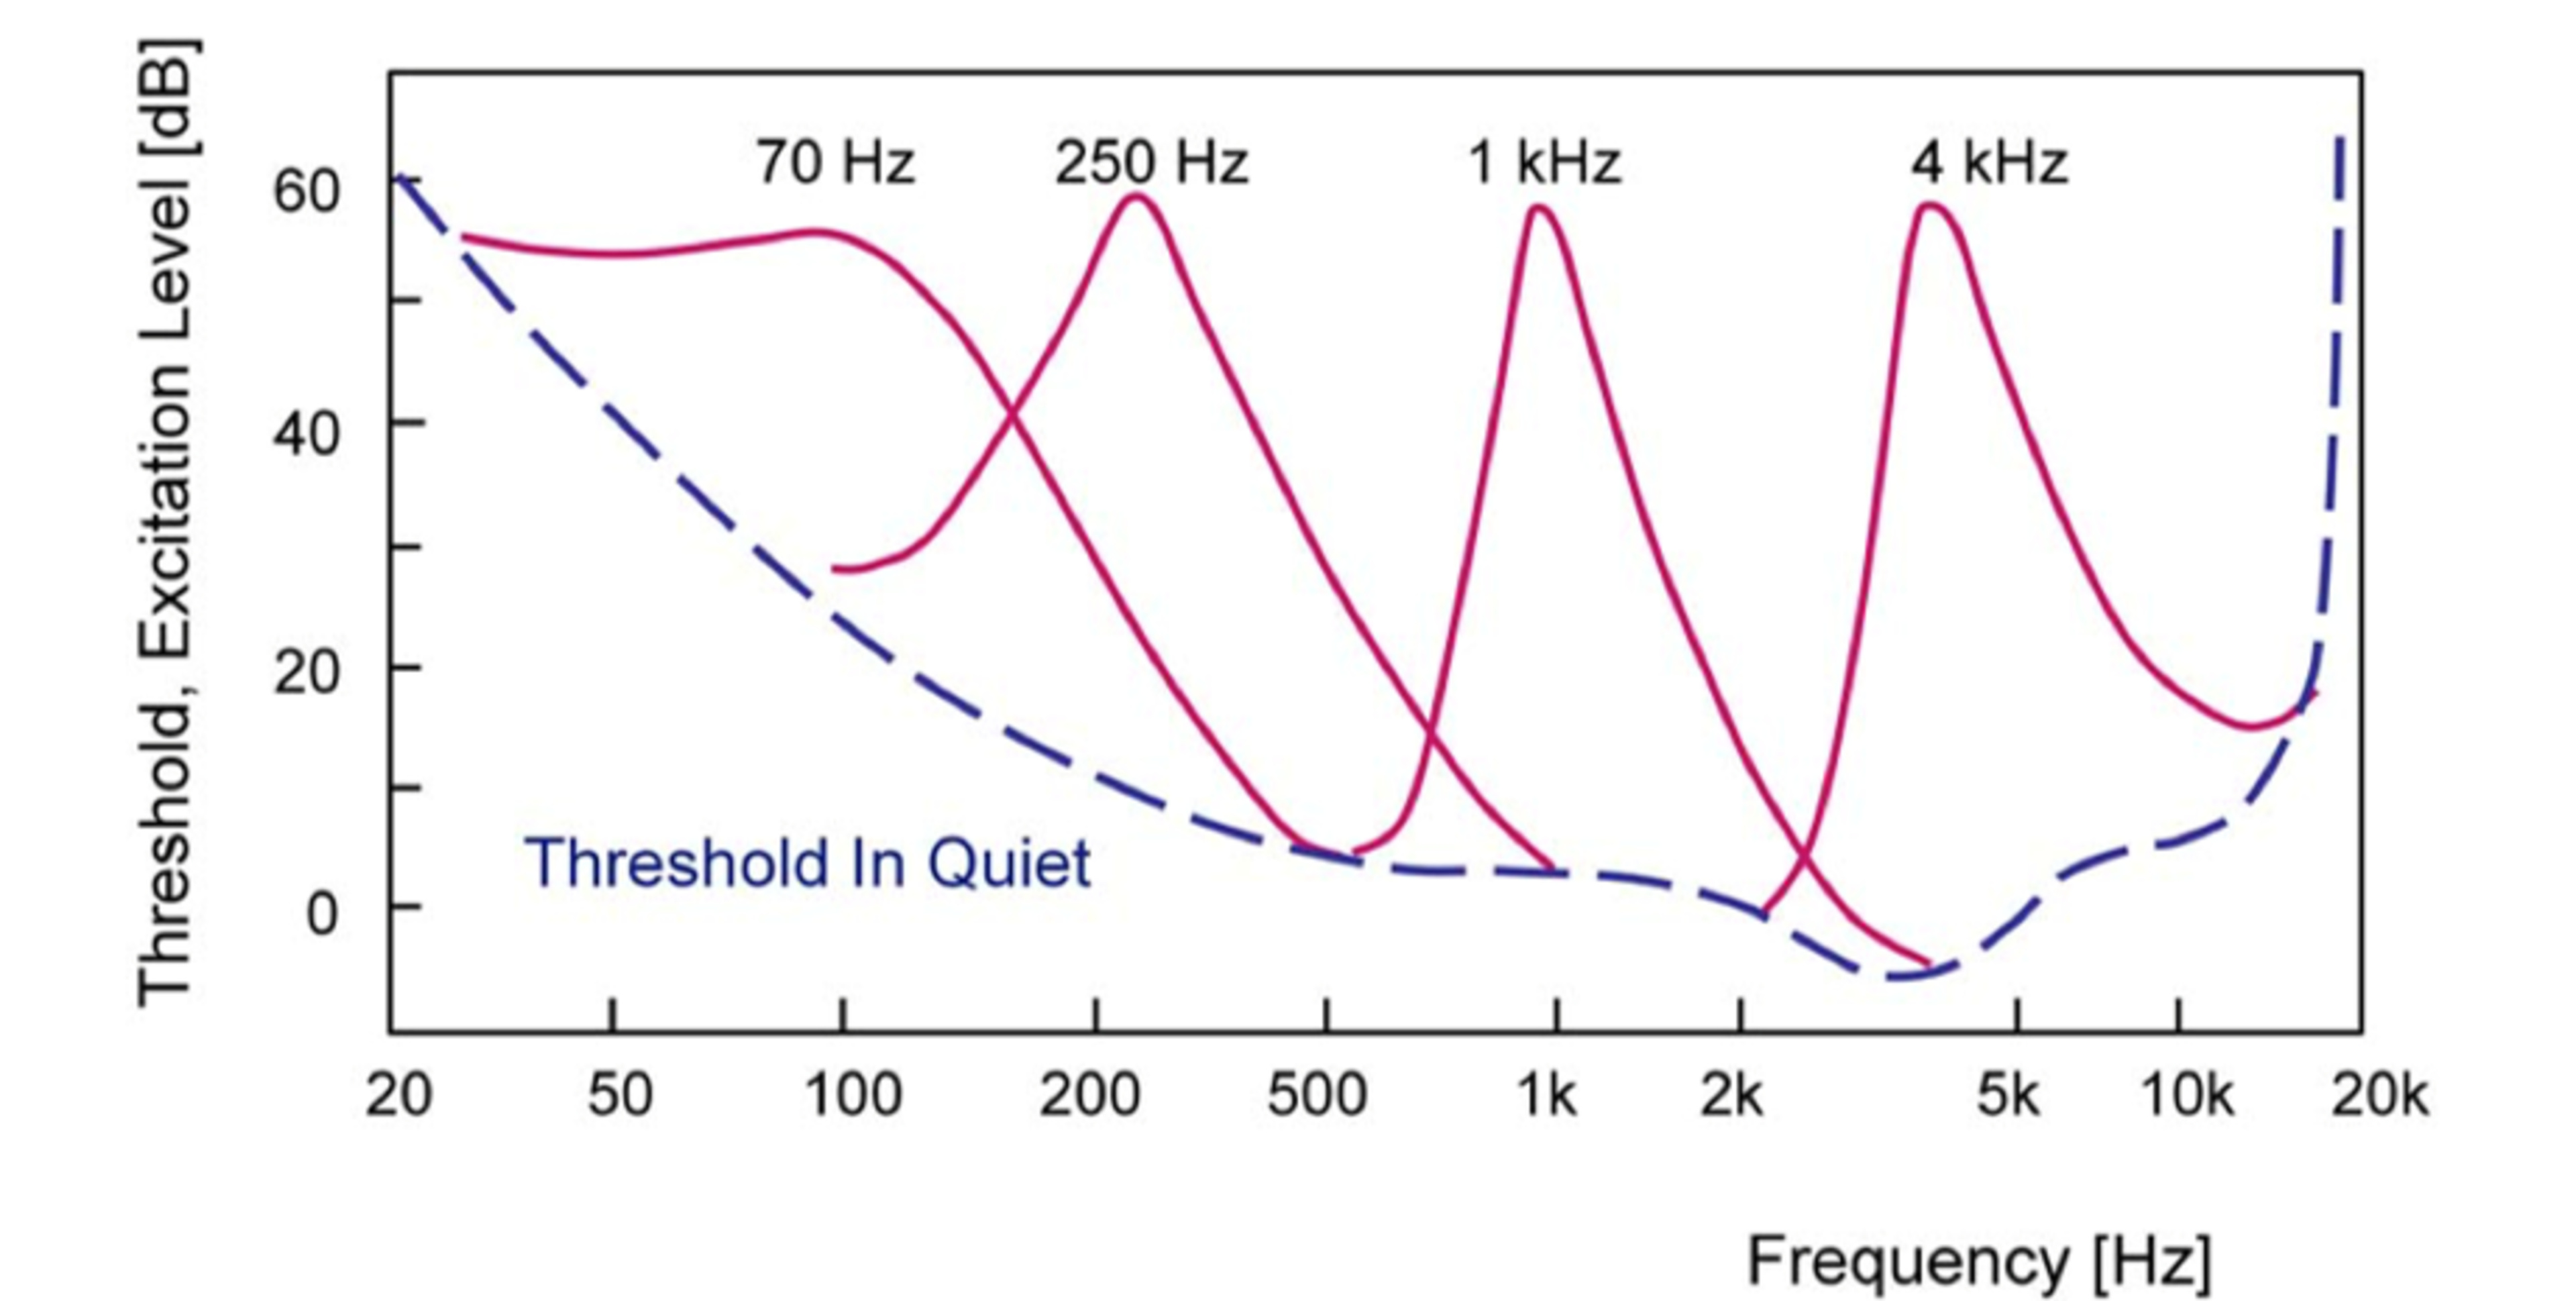
This masking matters for distortion because lower-order harmonics (like the 2nd and 3rd) are close to the fundamental, and so often inside the same or adjacent critical band. As a result, they tend to be more heavily masked. Higher order harmonics sit farther away, often outside the masker's band, so they're less masked and can poke through, despite being much lower in level. With real music, masking changes bar to bar: a dense chorus can bury artifacts that become noticeable the moment the arrangement thins out.
Here's a visual example of harmonics falling under the masking threshold:
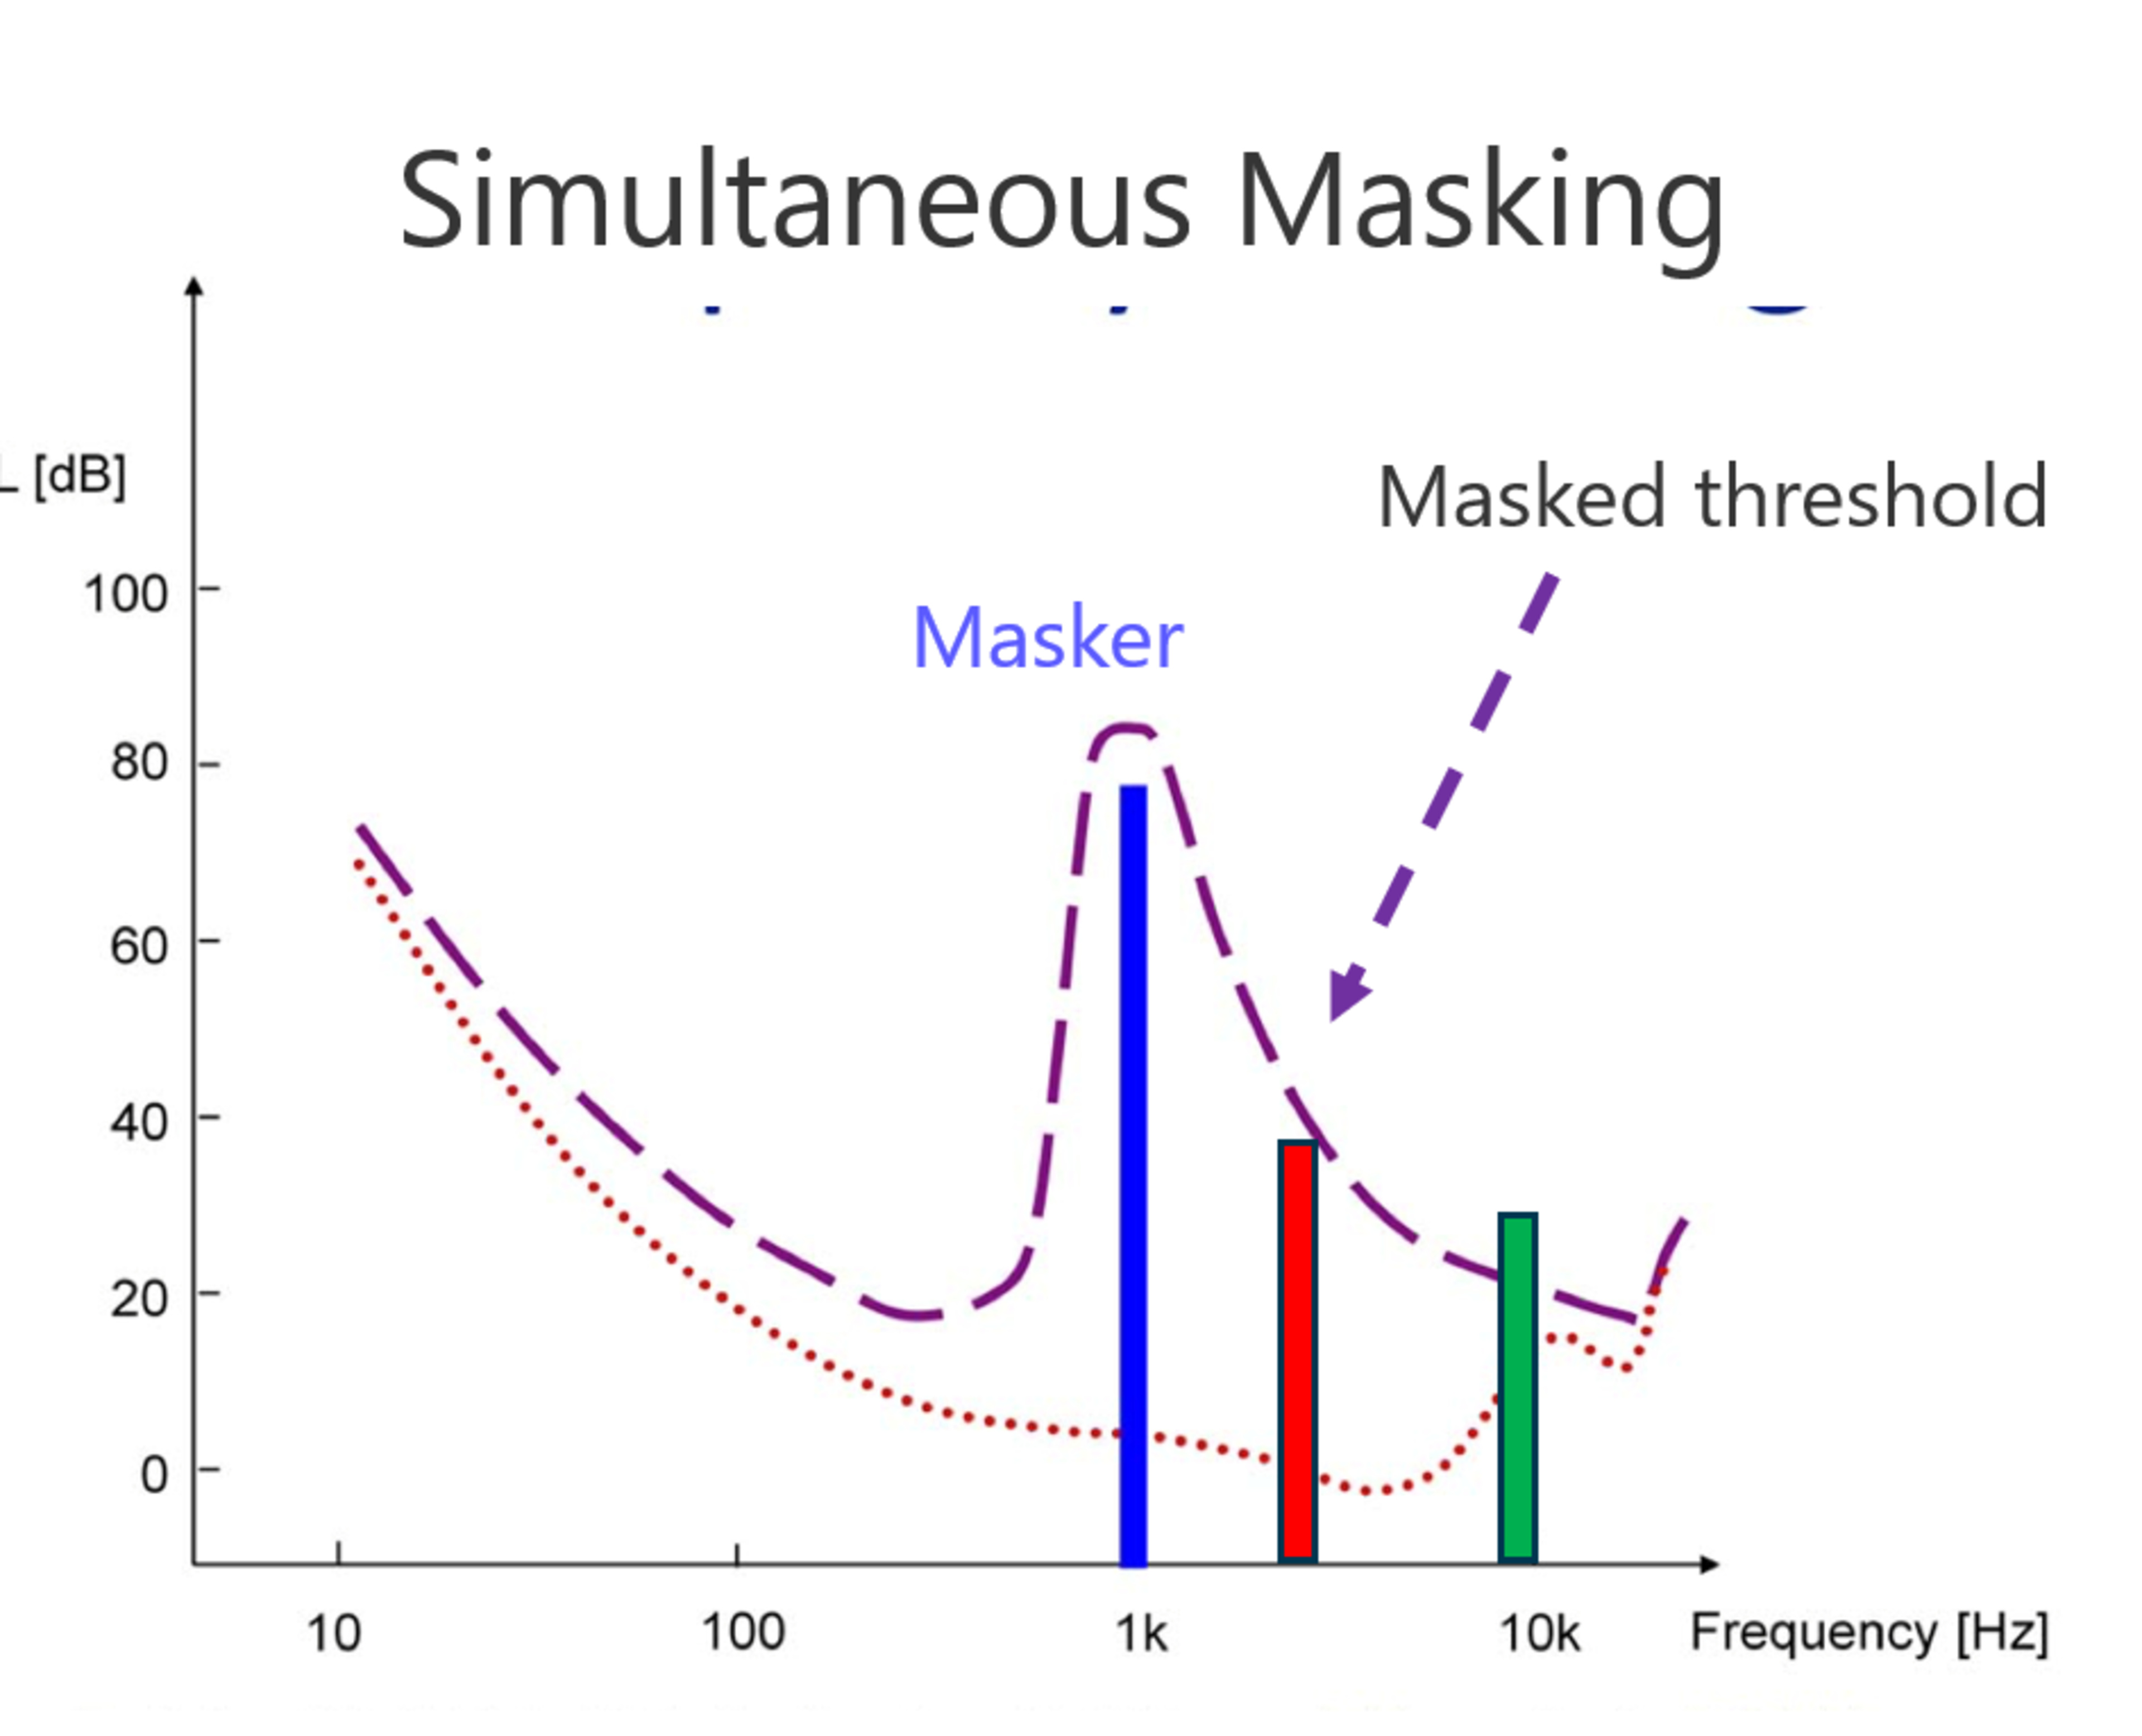
This is a big reason THD results can mislead. THD lumps every harmonic into a single ratio with no awareness of where those harmonics land relative to the ear's masking patterns. A headphone showing 'higher THD' that is dominated by 2nd/3rd harmonics near strong maskers may sound cleaner than one with a smaller THD percentage but a sprinkling of lightly masked higher-order components.
Some argue that because most headphone distortion energy is in the 2nd and 3rd harmonics, it may often be masked at normal levels. But we don't actually know where that line sits for listeners across different kinds of content and listening levels. That's one of the gaps we aim to close with our upcoming work.
Program And Level Dependence (and Why Sweeps Aren't Music)
Most headphone THD is collected during the same swept sine used for frequency response: one tone at a time across the frequency band. This is useful for quality control and for spotting obvious problems, but it doesn't produce intermodulation products, and it doesn't reflect how distortion behaves when dozens of partials are interacting. Here are a few key observations:
- SPL matters. Distortion generally rises with level. A headphone that looks squeaky clean at 94 dB SPL can look different at 104 dB SPL.
- Content matters. Dual-tone IMD tests reveal sidebands and amplitude modulation effects that are absent in a single-tone THD sweep. Multi-tone tests go further, creating the dense forest of sum/difference products you get with music.
- Time matters. Distortion is not always stationary. Transients, envelopes, and compression behavior can change what gets generated and when it becomes noticeable.
The consequence, as emphasized by Alex Voishvillo (2007), is that distortion is highly stimulus-dependent: the same transducer can behave differently depending on the signal used, and a single curve (especially one derived from swept sine) rarely captures the full perceptual context. Music and speech signals differ significantly from tonal test signals in their statistical, spectral, and temporal properties, and the distortion they evoke is often non-stationary and shaped by masking and envelope effects.
A Brief Review Of Past Research On Human Perception Of Distortion
If the goal is to measure what people hear, we don't have to start from scratch. Audio research has produced several perceptual models that try to translate signals into predicted listener judgments. Each shines a light on a different part of the problem, and each has limits when you apply it to headphones and nonlinear distortion.
Perceptual Metrics From Communications Audio
Tools like PEAQ (for coded music) and PESQ/POLQA (for speech) compare a test signal to a clean reference, align them in time and level, pass both through an auditory model (critical-band filtering, loudness, temporal integration), and then summarize the differences into a quality score. They were built to evaluate codec artifacts, bandwidth constraints, quantization noise, pre-echo, and packet loss, not transducer nonlinearity.
Still, they prove that when you have a good auditory front end and an appropriate impairment model, objective scores can track human ratings surprisingly well. But there is a catch: these methods are intended for use only with electrical signals, and not with signals that have been passed through electroacoustic transducers. Their ability to predict degradations in quality produced by nonlinear distortion in transducers has not been assessed.
So while the architecture is promising, we cannot use these scores directly unless we redo the experiments with headphone-specific distortions and stimuli.
Geddes And Lee: Weighting What's Annoying
Geddes and Lee (2003) took a different route. Instead of comparing input and output signals, they proposed a metric based on the shape of the nonlinear transfer function itself. Their idea was to emphasize what listeners tend to find objectionable: higher-order nonlinearities and low-level distortions that sneak past masking.
Their proposed metric, 'Gm,' uses the second derivative of the transfer function (to emphasize higher orders), weighted by a cosine-squared function that favors low-level signals, and integrates the result. It's an elegant approach, but it's also theoretical. Without a way to extract high-order transfer functions from real headphones, it's not a plug-and-play solution. And while the metric is designed to reflect audibility, it still needs listener validation in headphone contexts.
MDAQS: Looking In The Modulation Domain
HEAD acoustics GmbH takes a different angle with their MDAQS (Modulation-Domain Audio Quality Score) metric. Instead of just looking at spectral differences, it compares envelope modulations of the test and reference after auditory filtering. That's smart, because many audible distortions show up not just as extra spectral lines, but as changes in how energy is modulated over time.
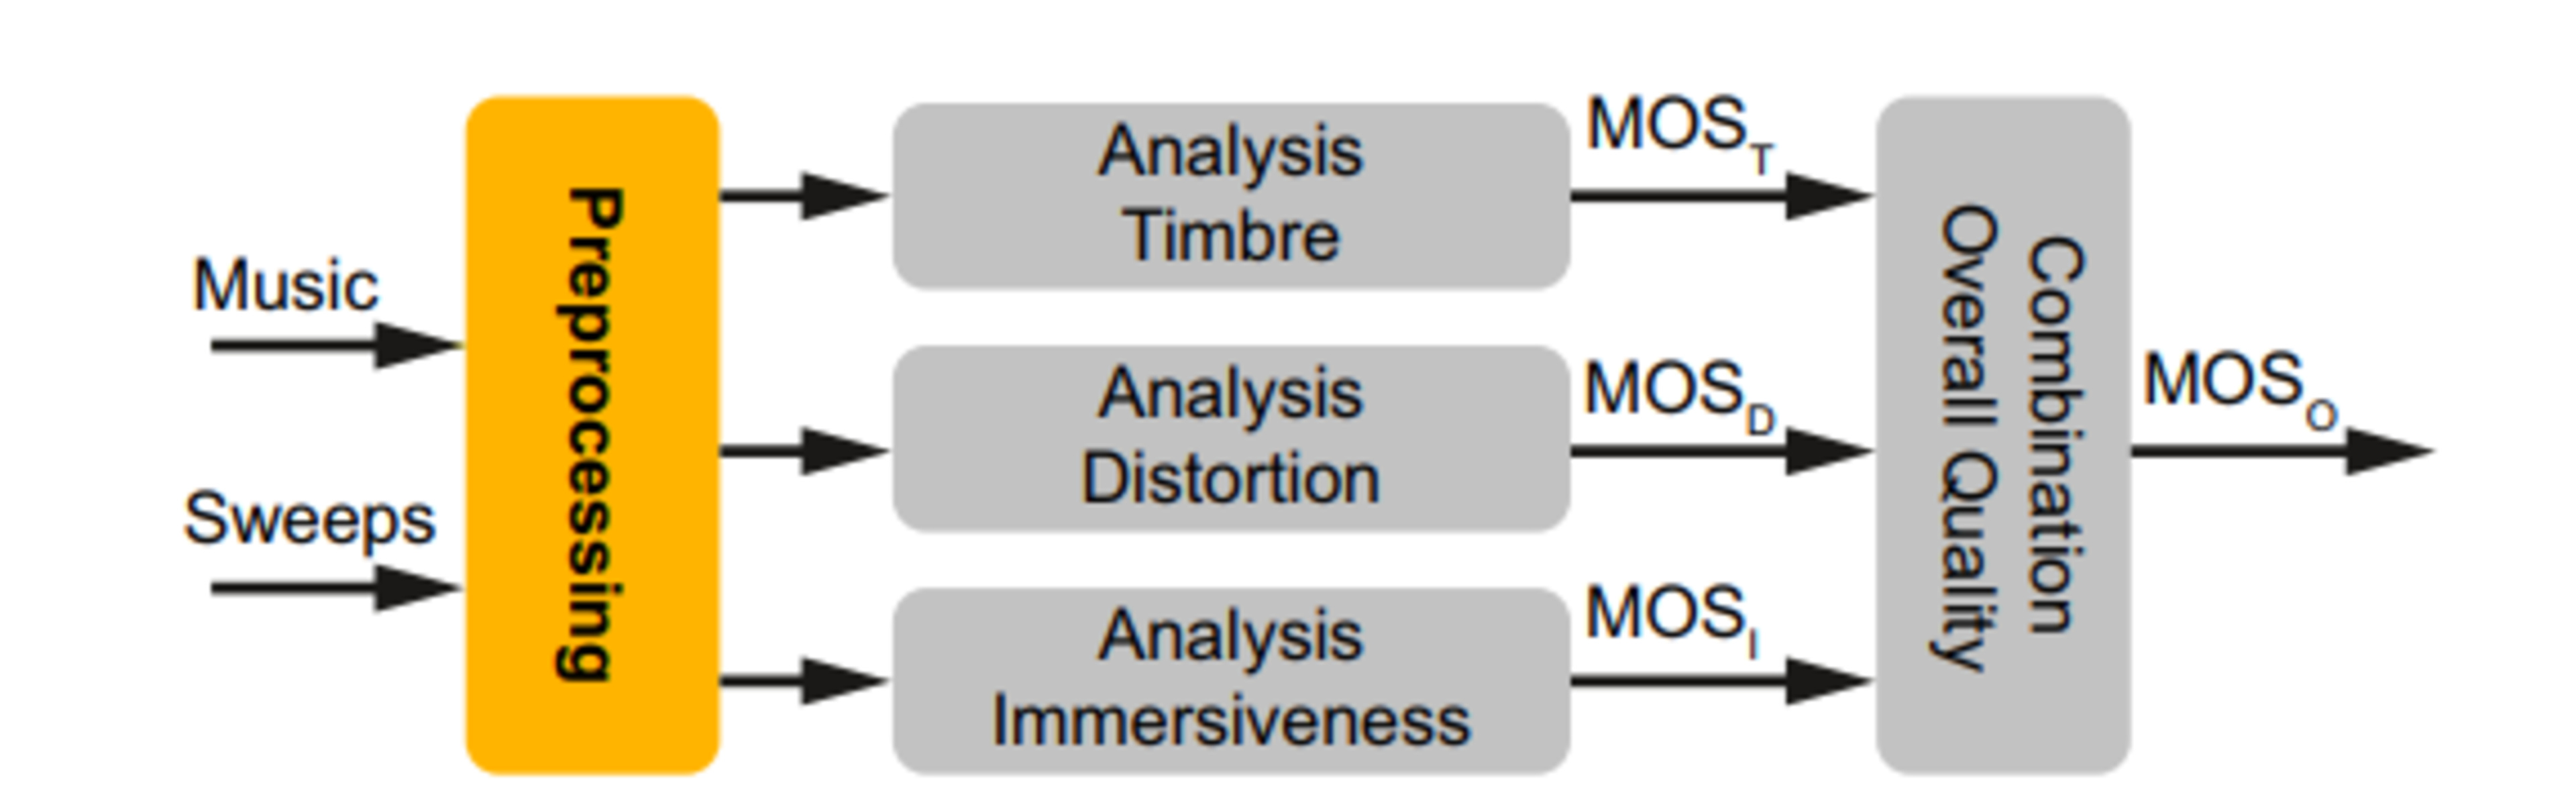
MDAQS merges the key criteria for perceived audio playback quality (timbre, distortion, and immersiveness) into one single Mean Opinion Score (MOS) value.
But here's the limitation: MDAQS is a proprietary metric. We don't know exactly how the distortion score is calculated, or which weighting functions are used.
According to their published technical note, in all three of their sound quality scores, the first differentiator is 'delta in frequency response.' That's in line with current knowledge that frequency response is the primary predictor of perceived sound quality, but we are trying to quantify the impact of non-linear distortion. Whether right or wrong, this score does not give us that. While we recognize the great advancement of being able to measure sound quality relative to three key aspects, we are missing a lot of information to confirm that HEAD acoustics' laboratory analyses can be applied universally to any transducer and that these scores would always correlate with a better listening experience.
Moore–Tan Auditory Model
A perceptually grounded model that aligns closely with our goals is the work by Brian Moore and Chin-Tuan Tan (2004), which introduces the 'Rnonlin' metric. This model simulates the auditory system using a bank of ERB-spaced gammatone filters and computes short-time cross-correlations between the original and distorted signals. The goal is to isolate nonlinear artifacts from linear spectral differences and quantify their perceptual impact. The model was validated through extensive listening tests using both artificial distortions (e.g., clipping, power-law transformations) and real transducer distortions. It achieved exceptionally high correlations with listener ratings: up to 0.98 for both music and speech stimuli. Importantly, the model also predicts how distortion will be perceived.
According to their paper, "There is not a unique relationship between the Rnonlin values and subjective distortion ratings [so] the model can be used to give reliable predictions of the rank ordering of the ratings of different nonlinear systems." This makes Rnonlin particularly useful for ranking systems by perceptual distortion, even if it doesn't yet provide absolute thresholds for audibility or preference.
While this model is promising, it's important to recognize its current scope. Model validation was done using Moore and Tan's own experiments, with specific types of distortion stimuli and listeners. It's not yet known how well Rnonlin generalizes to headphone-specific nonlinearities. Furthermore, the metric is stimulus-dependent: different music or speech content may yield different Rnonlin values for the same system.
The model provides relative rankings, but not a calibrated scale for how much difference in Rnonlin corresponds to a perceptible or preferred change, and this scale can only be assessed through listening tests. These limitations don't undermine the model's value; they simply highlight the need for further study in headphone contexts.
Bridging The Gap Between Measurement And Listening Experience
Despite decades of progress, two fundamental gaps keep headphone distortion from being as actionable as frequency response:
-
Audibility thresholds remain undefined.
While we can quote figures like '0.5% THD at 1 kHz,' we still lack content and level-aware thresholds that reliably predict whether listeners will actually hear distortion in music. -
Preference impact is unclear.
Even when distortion is audible, it's not obvious whether reducing it improves listener preference. Studies show mixed results, influenced by content, playback level, listener training, and (critically) whether the frequency response is already well tuned.
Perceptual models offer promising ingredients: auditory filters, loudness growth, modulation sensitivity, and temporal windows, but none yet serve as a drop-in standard for headphone distortion. They often optimize for other impairments, assume perfect references, or lack thresholds tied to real-world listening.
That's the gap our joint project aims to close. As you'd expect from Sean Olive-led research, we'll leave no stone unturned: rigorous blind listening tests, trained listeners, statistical analysis, and more.
Next Steps
Our next steps focus on three outcomes:
- Audibility thresholds for nonlinear distortion in headphones that are grounded in human perception and sensitive to program material and playback level.
- Understanding preference, so we can separate what's detectable from what's desirable.
- Identifying the best objective predictors, including perceptual, ERB-based, and noncoherent metrics that generalize to real listening.
We'll share methods, datasets, and results in a follow-up article. The goal is simple: replace raw distortion numbers with perceptually anchored metrics that reflect what listeners actually experience. That way, reviews become more meaningful, and manufacturers can optimize for what truly matters.
Of course, that is if distortion even matters at all.
Updates
3/18/2026: We've completed our investigation into audibility and adjusted how we approach our Harmonic Distortion test and its scoring in Test Bench 2.1.