Products
TCL S551G
TCL Q651G
Tested using Methodology v2.0.1
Updated Sep 24, 2025 08:56 PM
SEE PRICE
BestBuy.com
Tested using Methodology v2.0.1
Updated Nov 18, 2025 06:50 PM
SEE PRICE
BestBuy.com


Resolution4k
Native Refresh Rate
60Hz
TypeLED
Sub-Type
VA
Dolby Vision
Yes
Screen Finish
Glossy
Resolution4k
Native Refresh Rate
60Hz
TypeLED
Sub-Type
VA
Dolby Vision
Yes
Screen Finish
Glossy
Our Verdict
TCL S551G
TCL Q651G
The TCL S551G and the TCL Q651G are similar overall, but the Q6 is better, mostly due to it being the brighter model. The Q6 displays brighter highlights in HDR content, so it delivers a more impactful HDR experience, even though it's still not great. The Q6 also has the better SDR brightness, meaning it fights a bit more glare in a room with the lights on. Regarding color accuracy, the Q6 has better SDR pre-calibration results, so it doesn't require calibration if you care about accurate colors.
Variants
- 43S551G (43")
- 50S551G (50")
- 55S551G (55")
- 65S551G (65")
- 75S551G (75")
- 85S551G (85")
- 43Q651G (43")
- 50Q651G (50")
- 55Q651G (55")
- 65Q651G (65")
- 75Q651G (75")
- 85Q651G (85")
- 98Q651G (98")
Check Price
43"
43S551G
SEE PRICE
BestBuy.com
43"
43Q651G
SEE PRICE
BestBuy.com
50"
50S551G
SEE PRICE
BestBuy.com
50"
50Q651G
SEE PRICE
BestBuy.com
55"
55S551G
SEE PRICE
BestBuy.com
55"
55Q651G
SEE PRICE
BestBuy.com
65"
65S551G
SEE PRICE
BestBuy.com
65"
65Q651G
SEE PRICE
BestBuy.com
75"
75S551G
SEE PRICE
BestBuy.com
75"
75Q651G
SEE PRICE
BestBuy.com
85"
85S551G
SEE PRICE
Amazon.com
85"
85Q651G
SEE PRICE
BestBuy.com
98"
98"
98Q651G
SEE PRICE
BestBuy.com
Main Differences for
Mixed Usage
Mixed Usage
Threshold
Mixed Usage
5.9
5.9
HDR Brightness
4.5
5.0
Full Comparison
Brightness
HDR Brightness
4.5
5.0
HDR Hallway Photo


HDR Cityscape Photo


HDR Landscape Photo


Hallway Lights (~1950 cd/m²)
304 cd/m²
367 cd/m²
Yellow Skyscraper (~700 cd/m²)
217 cd/m²
291 cd/m²
Landscape Pool (~300 cd/m²)
159 cd/m²
170 cd/m²
Peak 2% Window
355 cd/m²
368 cd/m²
Peak 10% Window
355 cd/m²
367 cd/m²
Peak 25% Window
355 cd/m²
368 cd/m²
Peak 50% Window
355 cd/m²
367 cd/m²
Peak 100% Window
355 cd/m²
367 cd/m²
Sustained 2% Window
355 cd/m²
367 cd/m²
Sustained 10% Window
355 cd/m²
367 cd/m²
Sustained 25% Window
355 cd/m²
367 cd/m²
Sustained 50% Window
355 cd/m²
367 cd/m²
Sustained 100% Window
355 cd/m²
366 cd/m²
Automatic Brightness Limiting (ABL)
0.000
0.000
HDR Brightness In Game Mode
4.5
5.0
HDR Hallway Photo


HDR Cityscape Photo


HDR Landscape Photo


Hallway Lights (~1950 cd/m²)
306 cd/m²
367 cd/m²
Yellow Skyscraper (~700 cd/m²)
217 cd/m²
289 cd/m²
Landscape Pool (~300 cd/m²)
161 cd/m²
168 cd/m²
Peak 2% Window
355 cd/m²
373 cd/m²
Peak 10% Window
356 cd/m²
371 cd/m²
Peak 25% Window
356 cd/m²
370 cd/m²
Peak 50% Window
356 cd/m²
369 cd/m²
Peak 100% Window
355 cd/m²
368 cd/m²
Sustained 2% Window
355 cd/m²
371 cd/m²
Sustained 10% Window
356 cd/m²
370 cd/m²
Sustained 25% Window
356 cd/m²
369 cd/m²
Sustained 50% Window
355 cd/m²
368 cd/m²
Sustained 100% Window
355 cd/m²
367 cd/m²
Automatic Brightness Limiting (ABL)
0.000
0.001
SDR Brightness
5.8
6.1
Real Scene Peak Brightness
310 cd/m²
350 cd/m²
Peak 2% Window
358 cd/m²
374 cd/m²
Peak 10% Window
353 cd/m²
372 cd/m²
Peak 25% Window
350 cd/m²
371 cd/m²
Peak 50% Window
347 cd/m²
370 cd/m²
Peak 100% Window
346 cd/m²
370 cd/m²
Sustained 2% Window
356 cd/m²
372 cd/m²
Sustained 10% Window
352 cd/m²
371 cd/m²
Sustained 25% Window
348 cd/m²
370 cd/m²
Sustained 50% Window
347 cd/m²
369 cd/m²
Sustained 100% Window
345 cd/m²
369 cd/m²
Automatic Brightness Limiting (ABL)
0.002
0.001
Black Level
Contrast
4.7
5.4
Contrast Picture

Contrast
5,083 : 1
6,647 : 1
Native Contrast
5,083 : 1
6,647 : 1
Lighting Zone Precision
0.0
0.0
Lighting Zone Precision Picture


Lighting Zone Transitions
10
0.0
Preferred LD Video, Moving Object
Local Dimming
No
No
Backlight
Direct
Direct
Dimming Zone Count Of The Tested TV
N/A
N/A
Contrast And Dark Details In Game Mode
5.0
4.5
Lighting Zone Precision Photo In Game Mode


Preferred LD Video, Moving Object In Game Mode
Game Transitions With VRR And Preferred LD
Black Uniformity
9.9
9.0
Black Uniformity Picture With Preferred Local Dimming

Std. Dev.
N/A
N/A
Native Black Uniformity Picture


Native Std. Dev.
0.284%
0.419%
Color
SDR Color Volume
6.7
6.6
DCI-P3 Gamut Rings
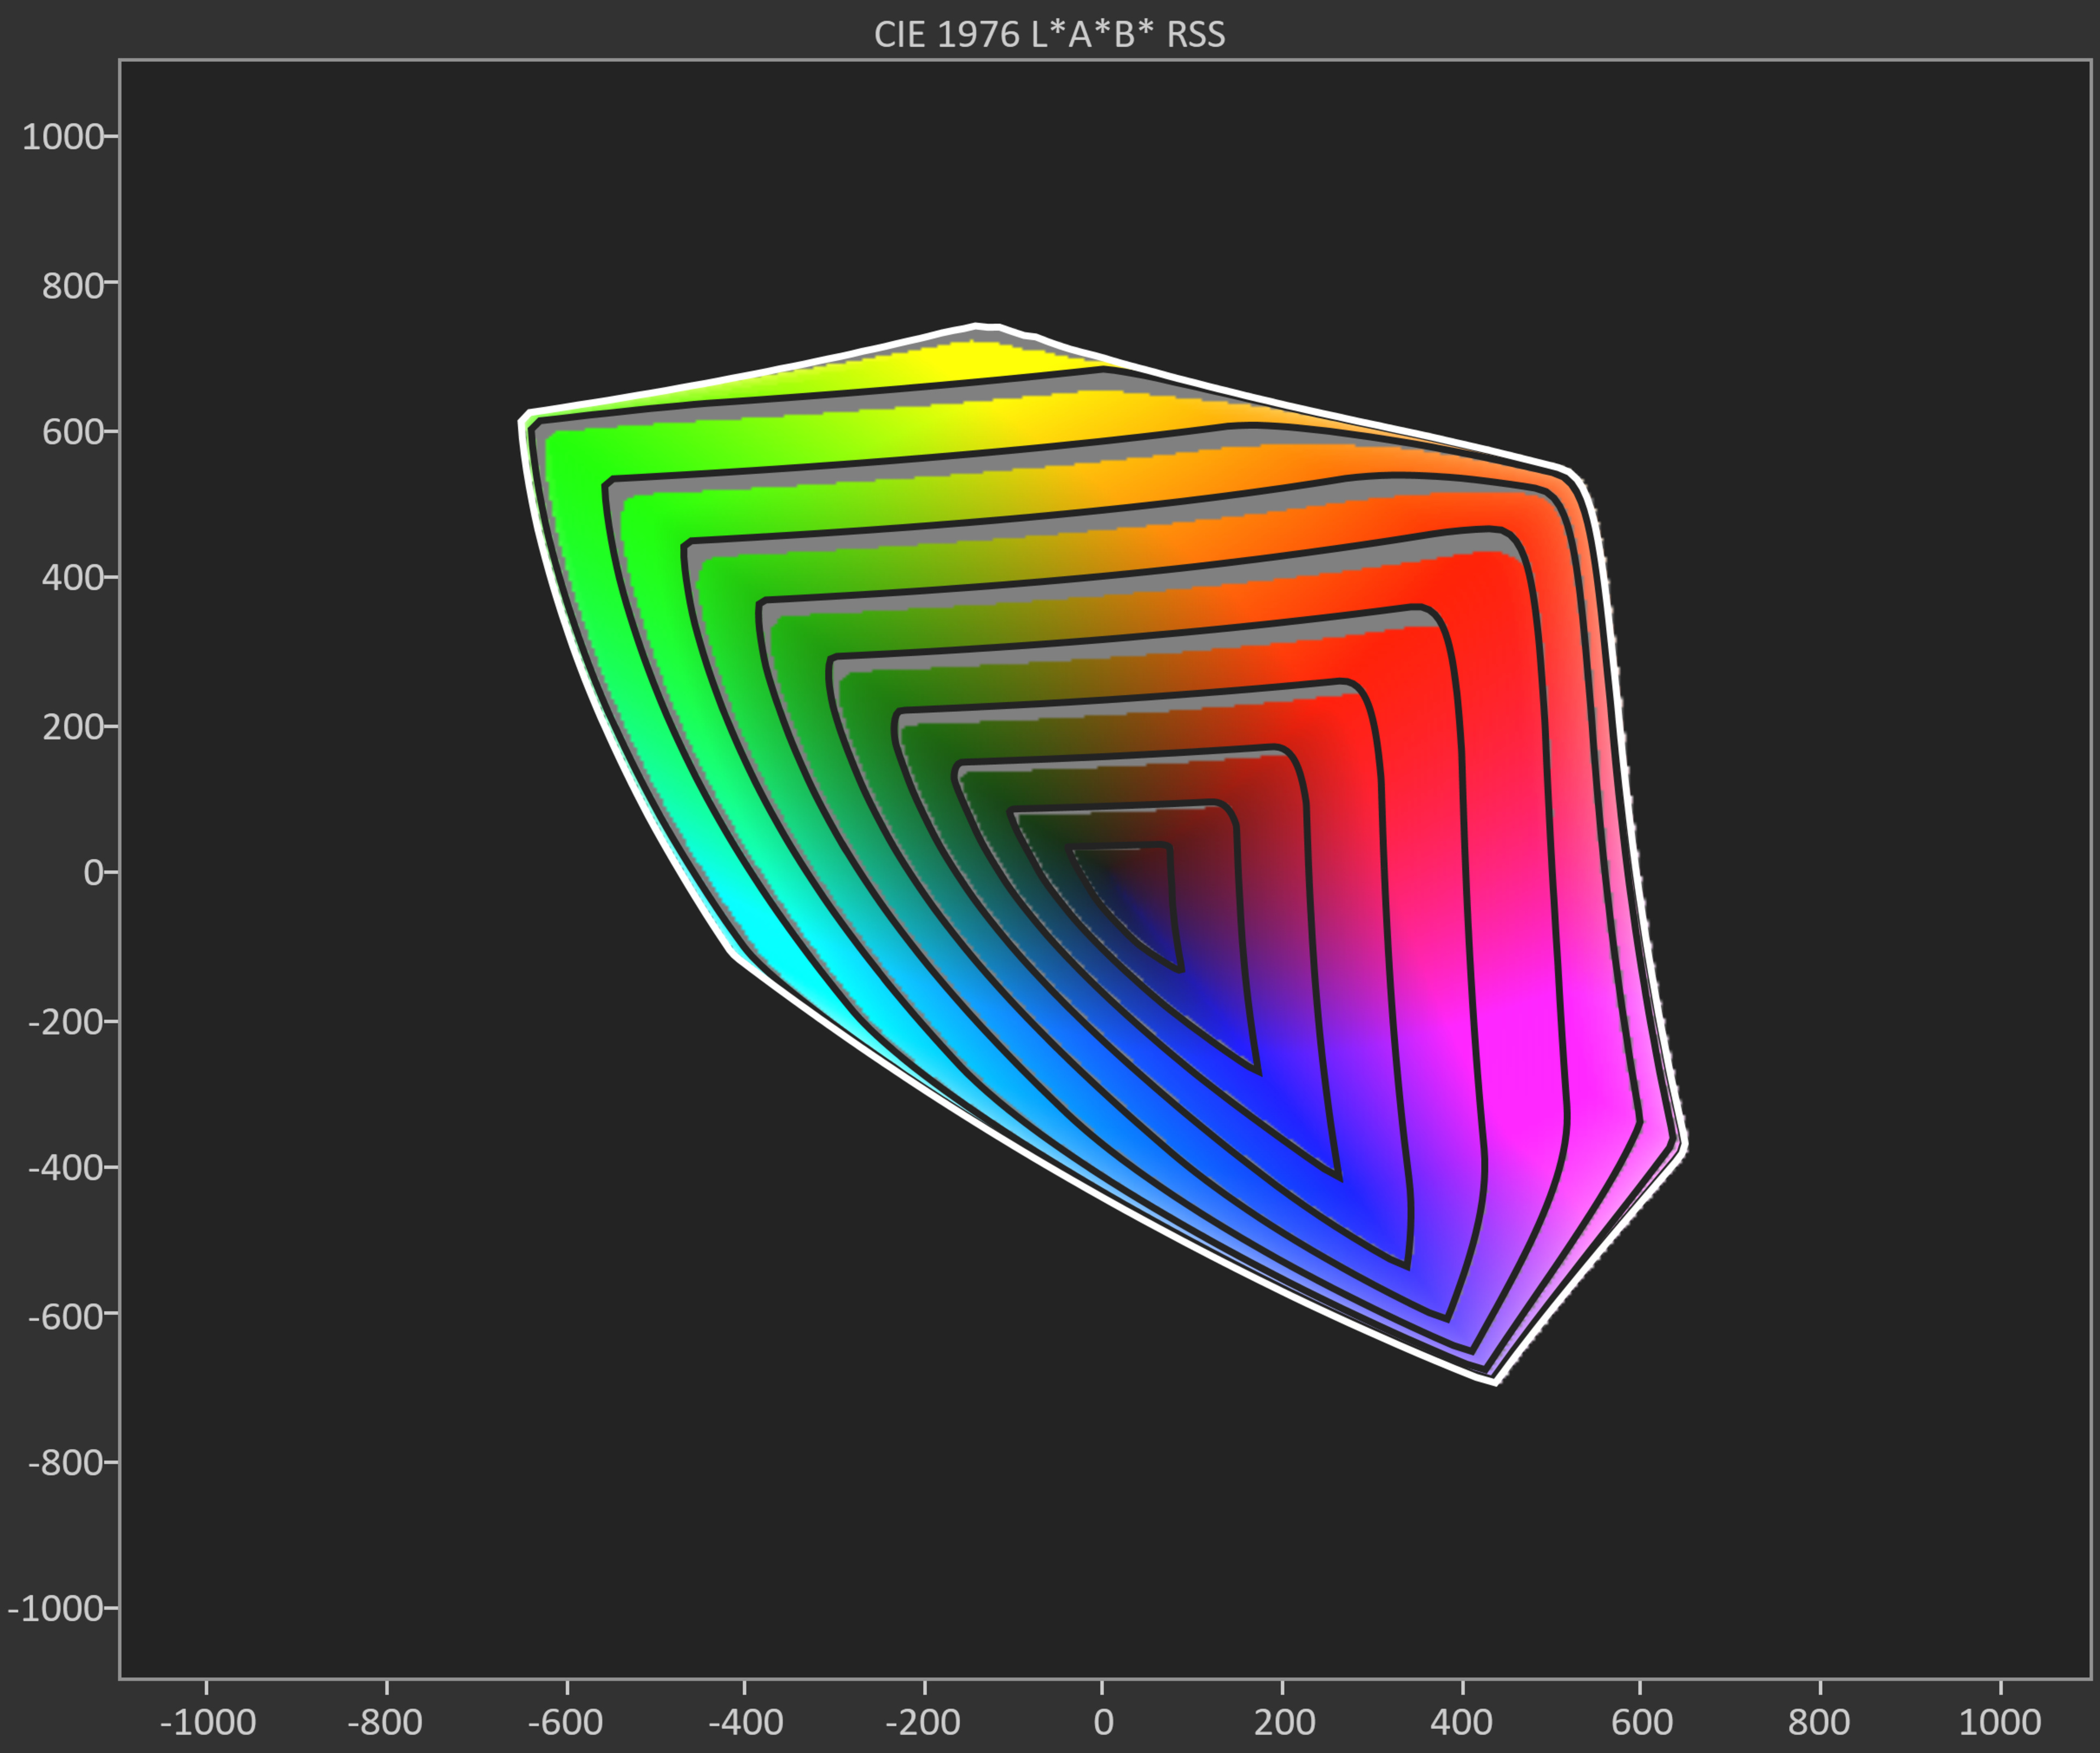

CIELAB DCI-P3 Coverage
83.72%
83.01%
BT.2020 Gamut Rings
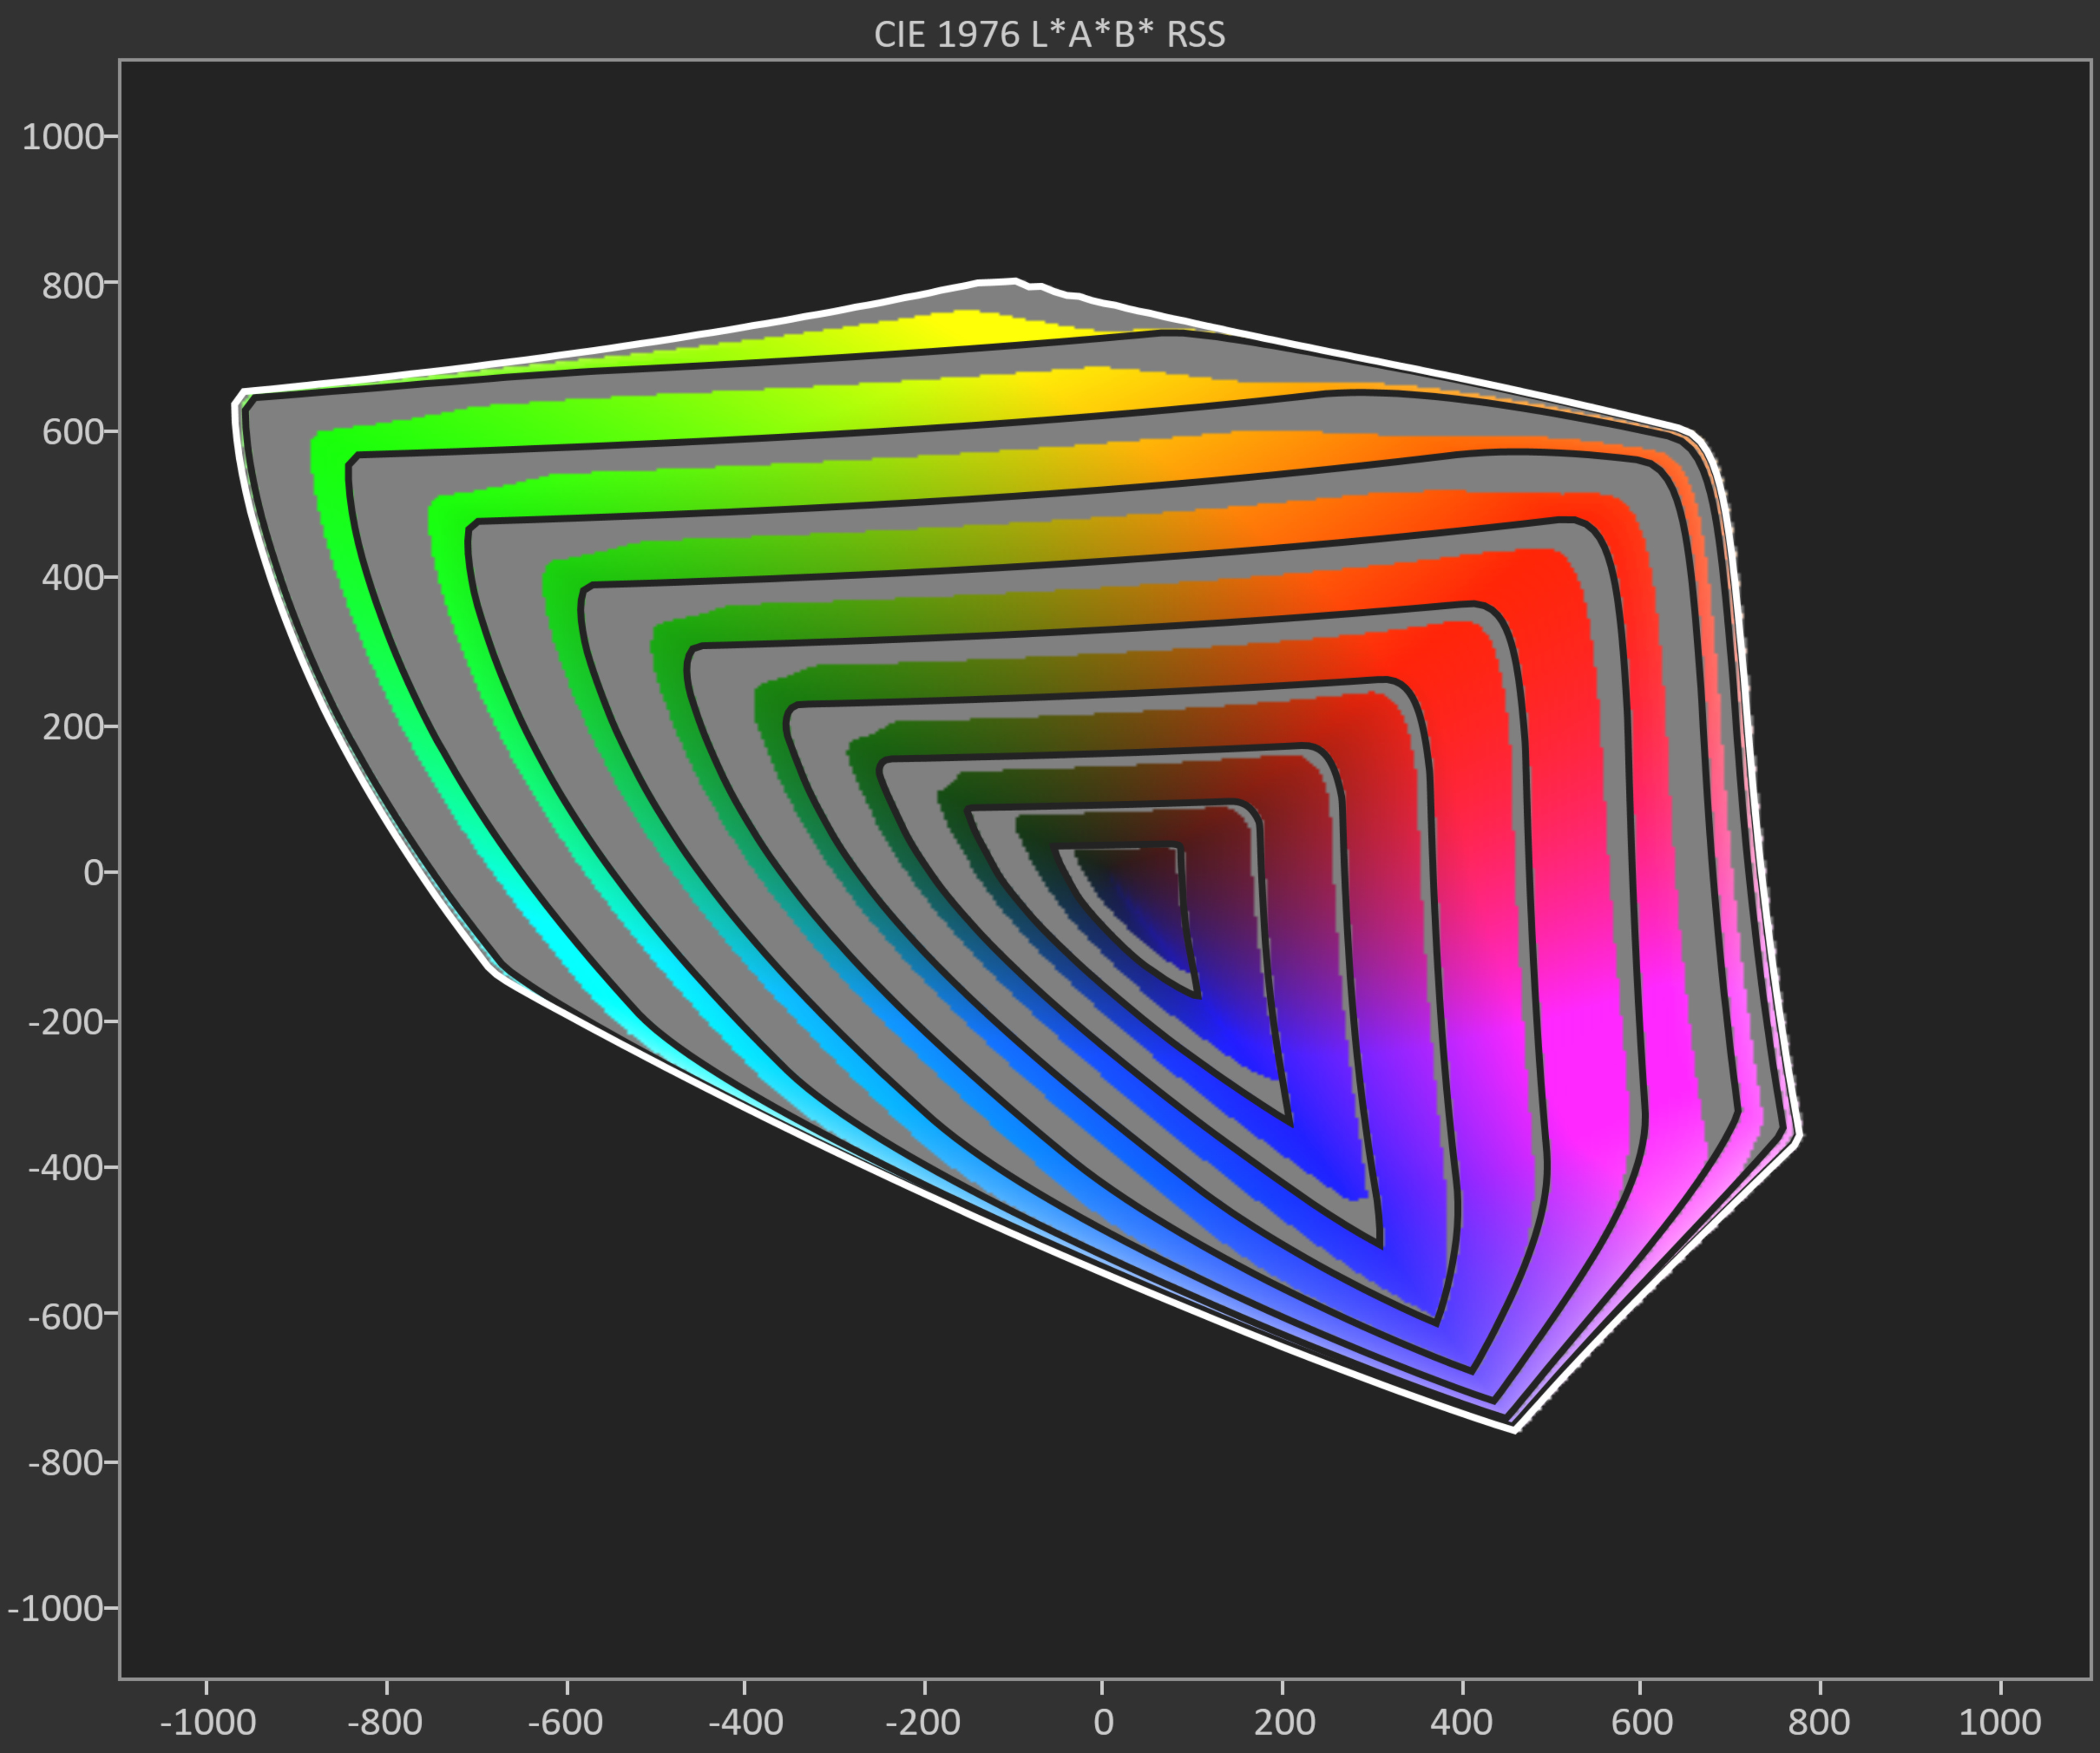

CIELAB BT.2020 Coverage
56.80%
56.48%
HDR Color Volume
6.3
6.3
P3 Color Volume ITP Picture


1,000 cd/m² DCI P3 Coverage ITP
57.8%
58.3%
2020 Color Volume ITP Picture


10,000 cd/m² BT.2020 Coverage ITP
26.2%
26.3%
White Luminance
355 cd/m²
367 cd/m²
Red Luminance
75 cd/m²
77 cd/m²
Green Luminance
253 cd/m²
263 cd/m²
Blue Luminance
26 cd/m²
26 cd/m²
Cyan Luminance
279 cd/m²
289 cd/m²
Magenta Luminance
101 cd/m²
103 cd/m²
Yellow Luminance
327 cd/m²
339 cd/m²
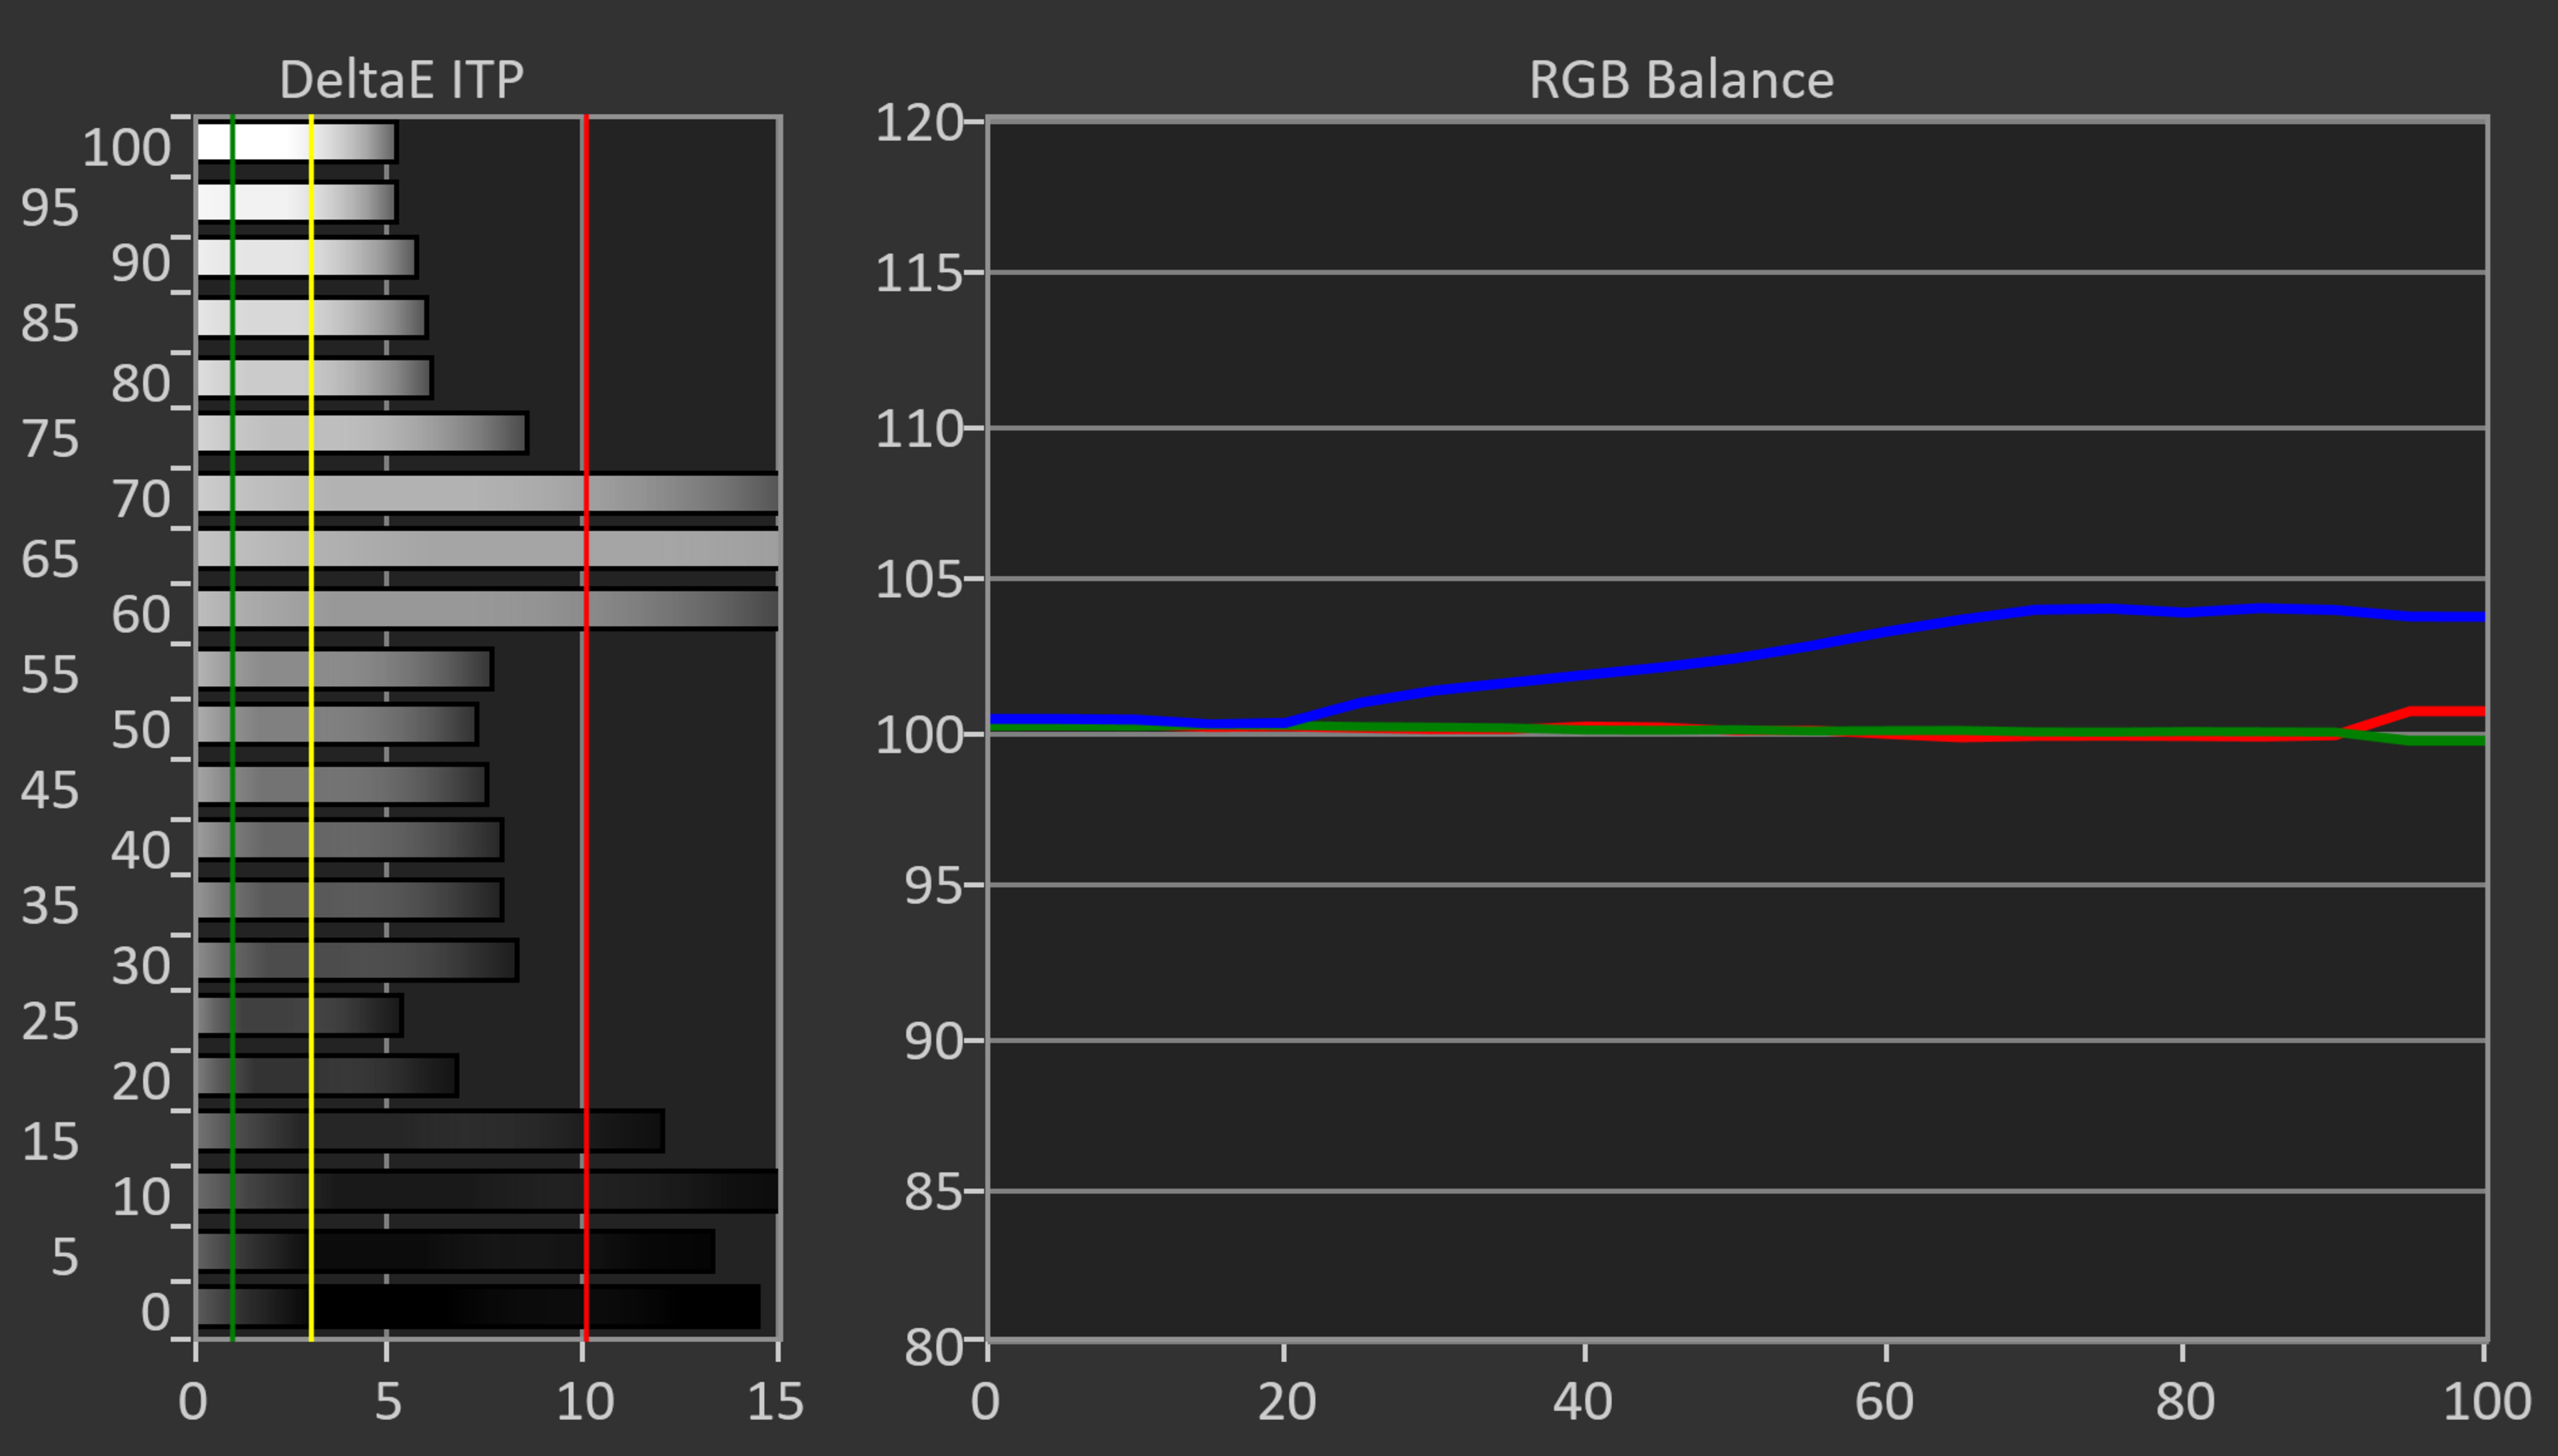
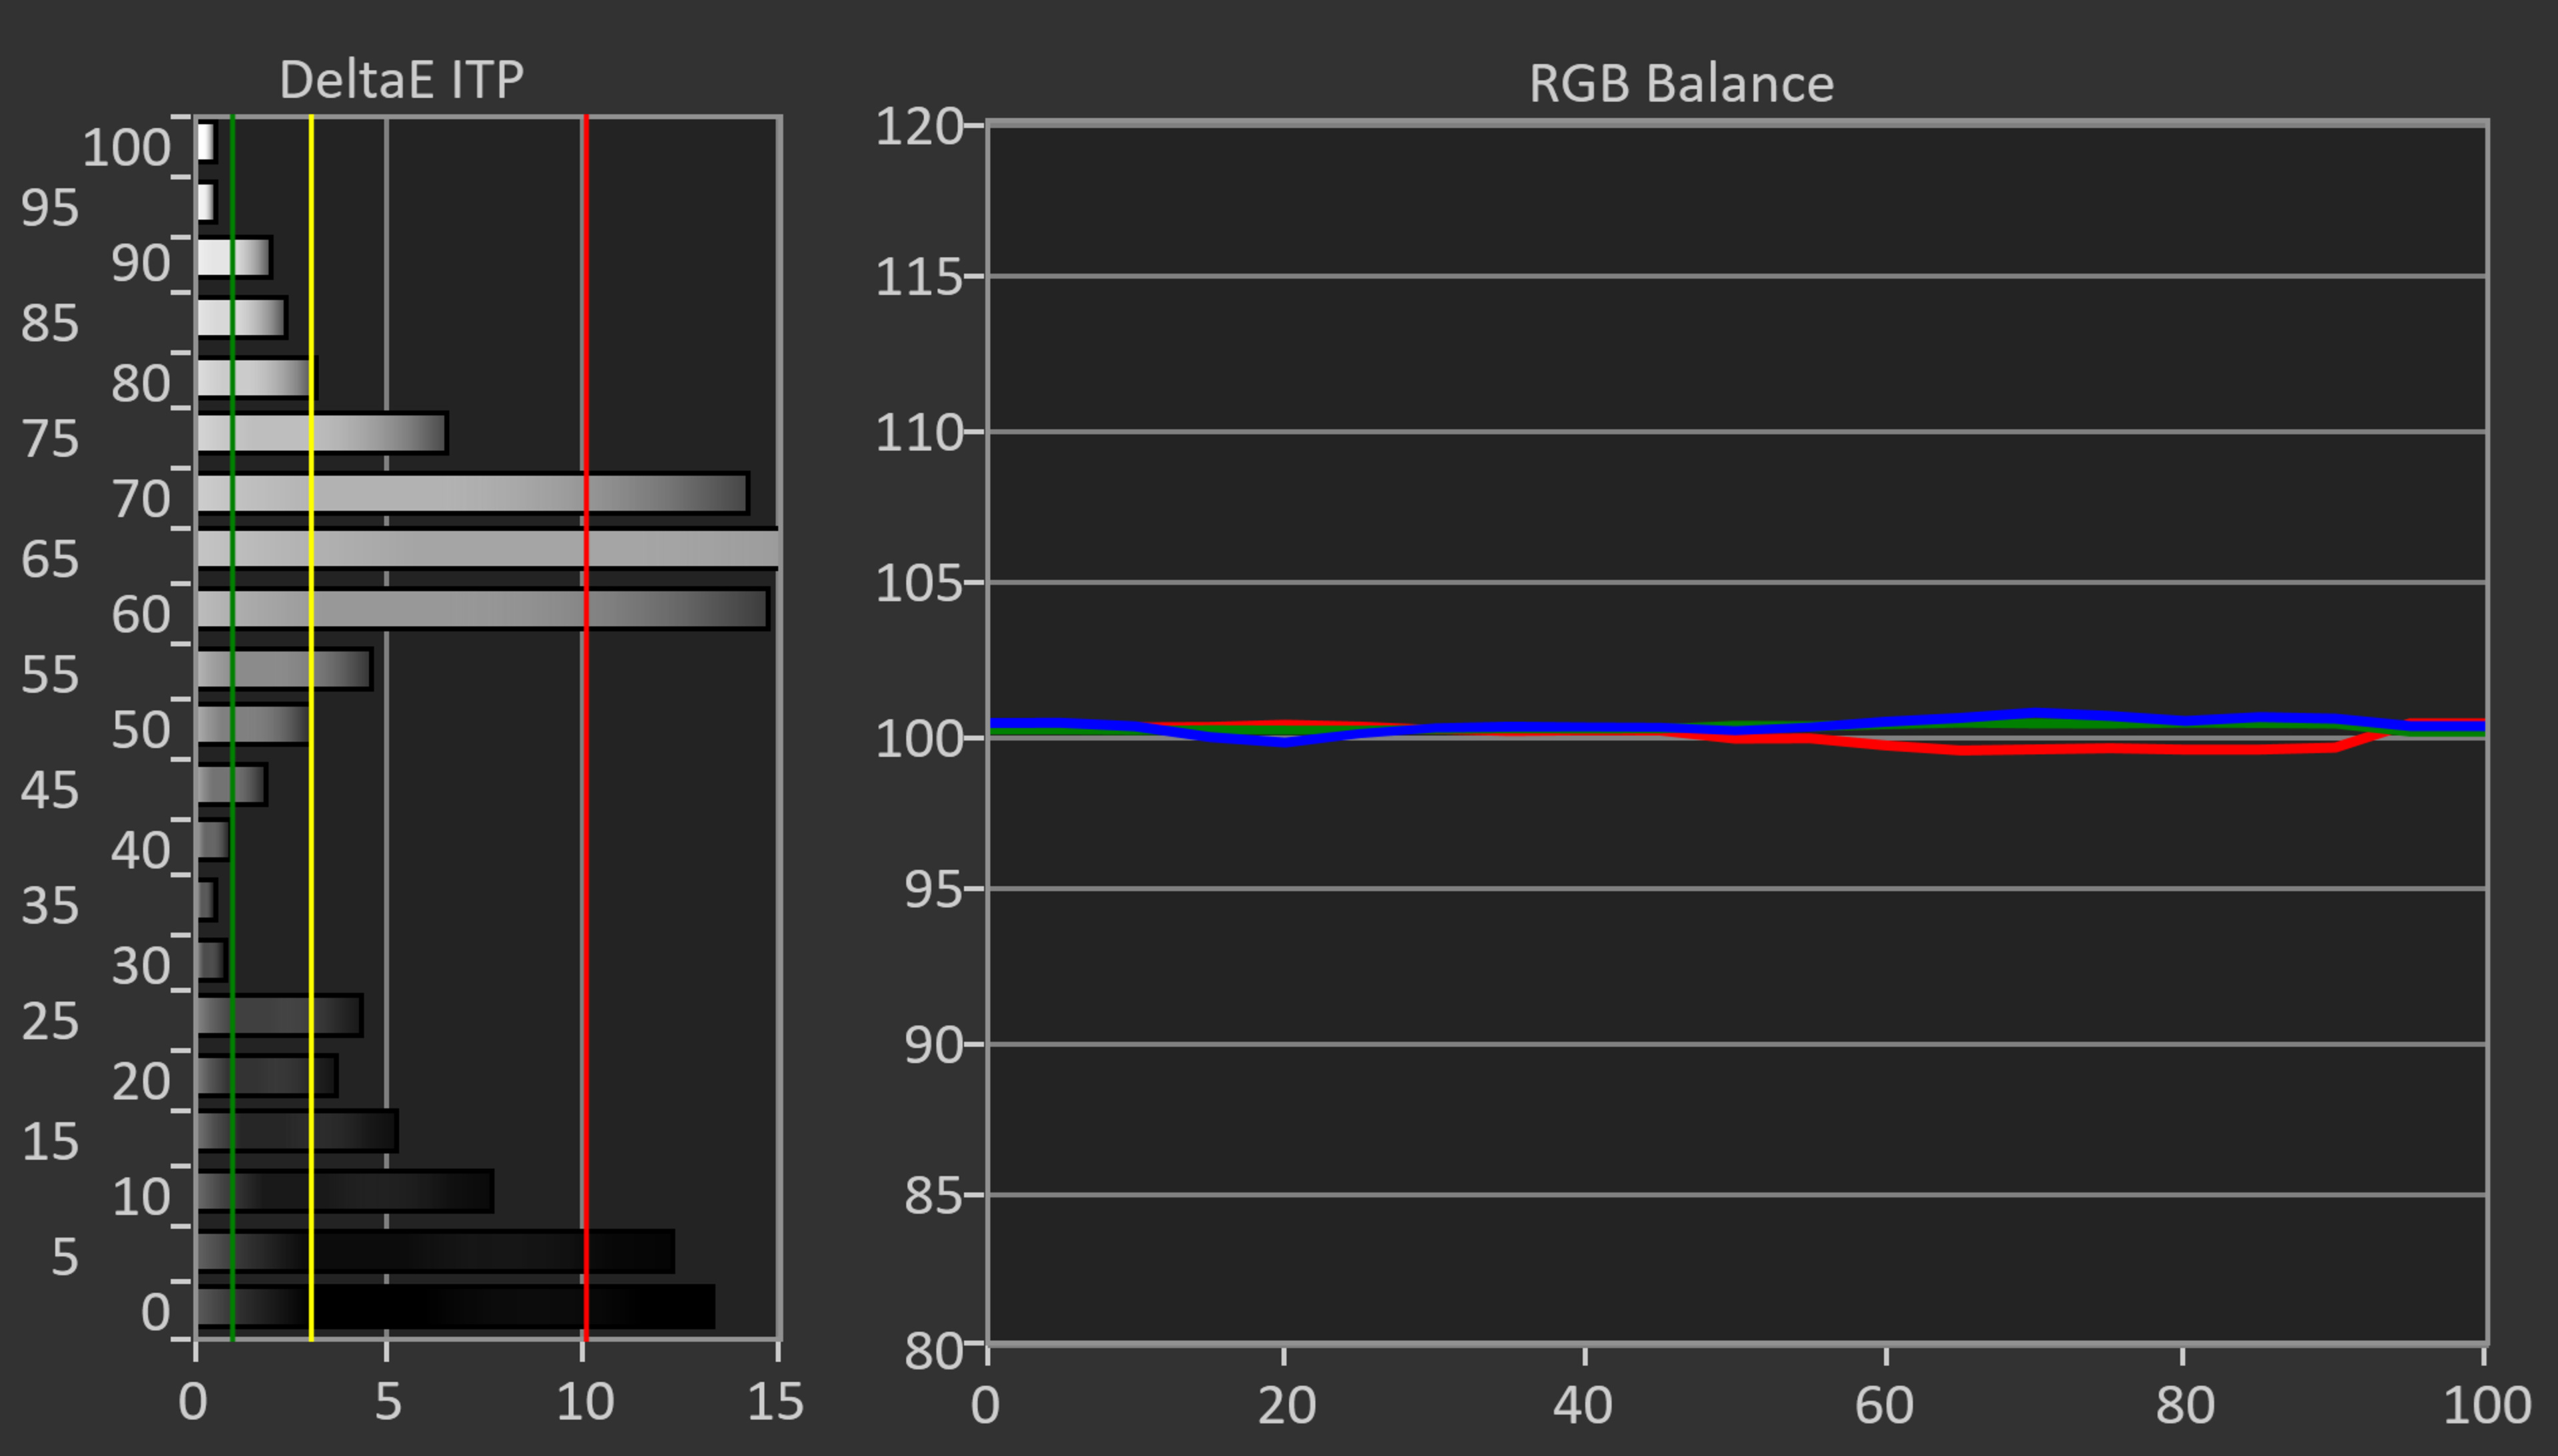
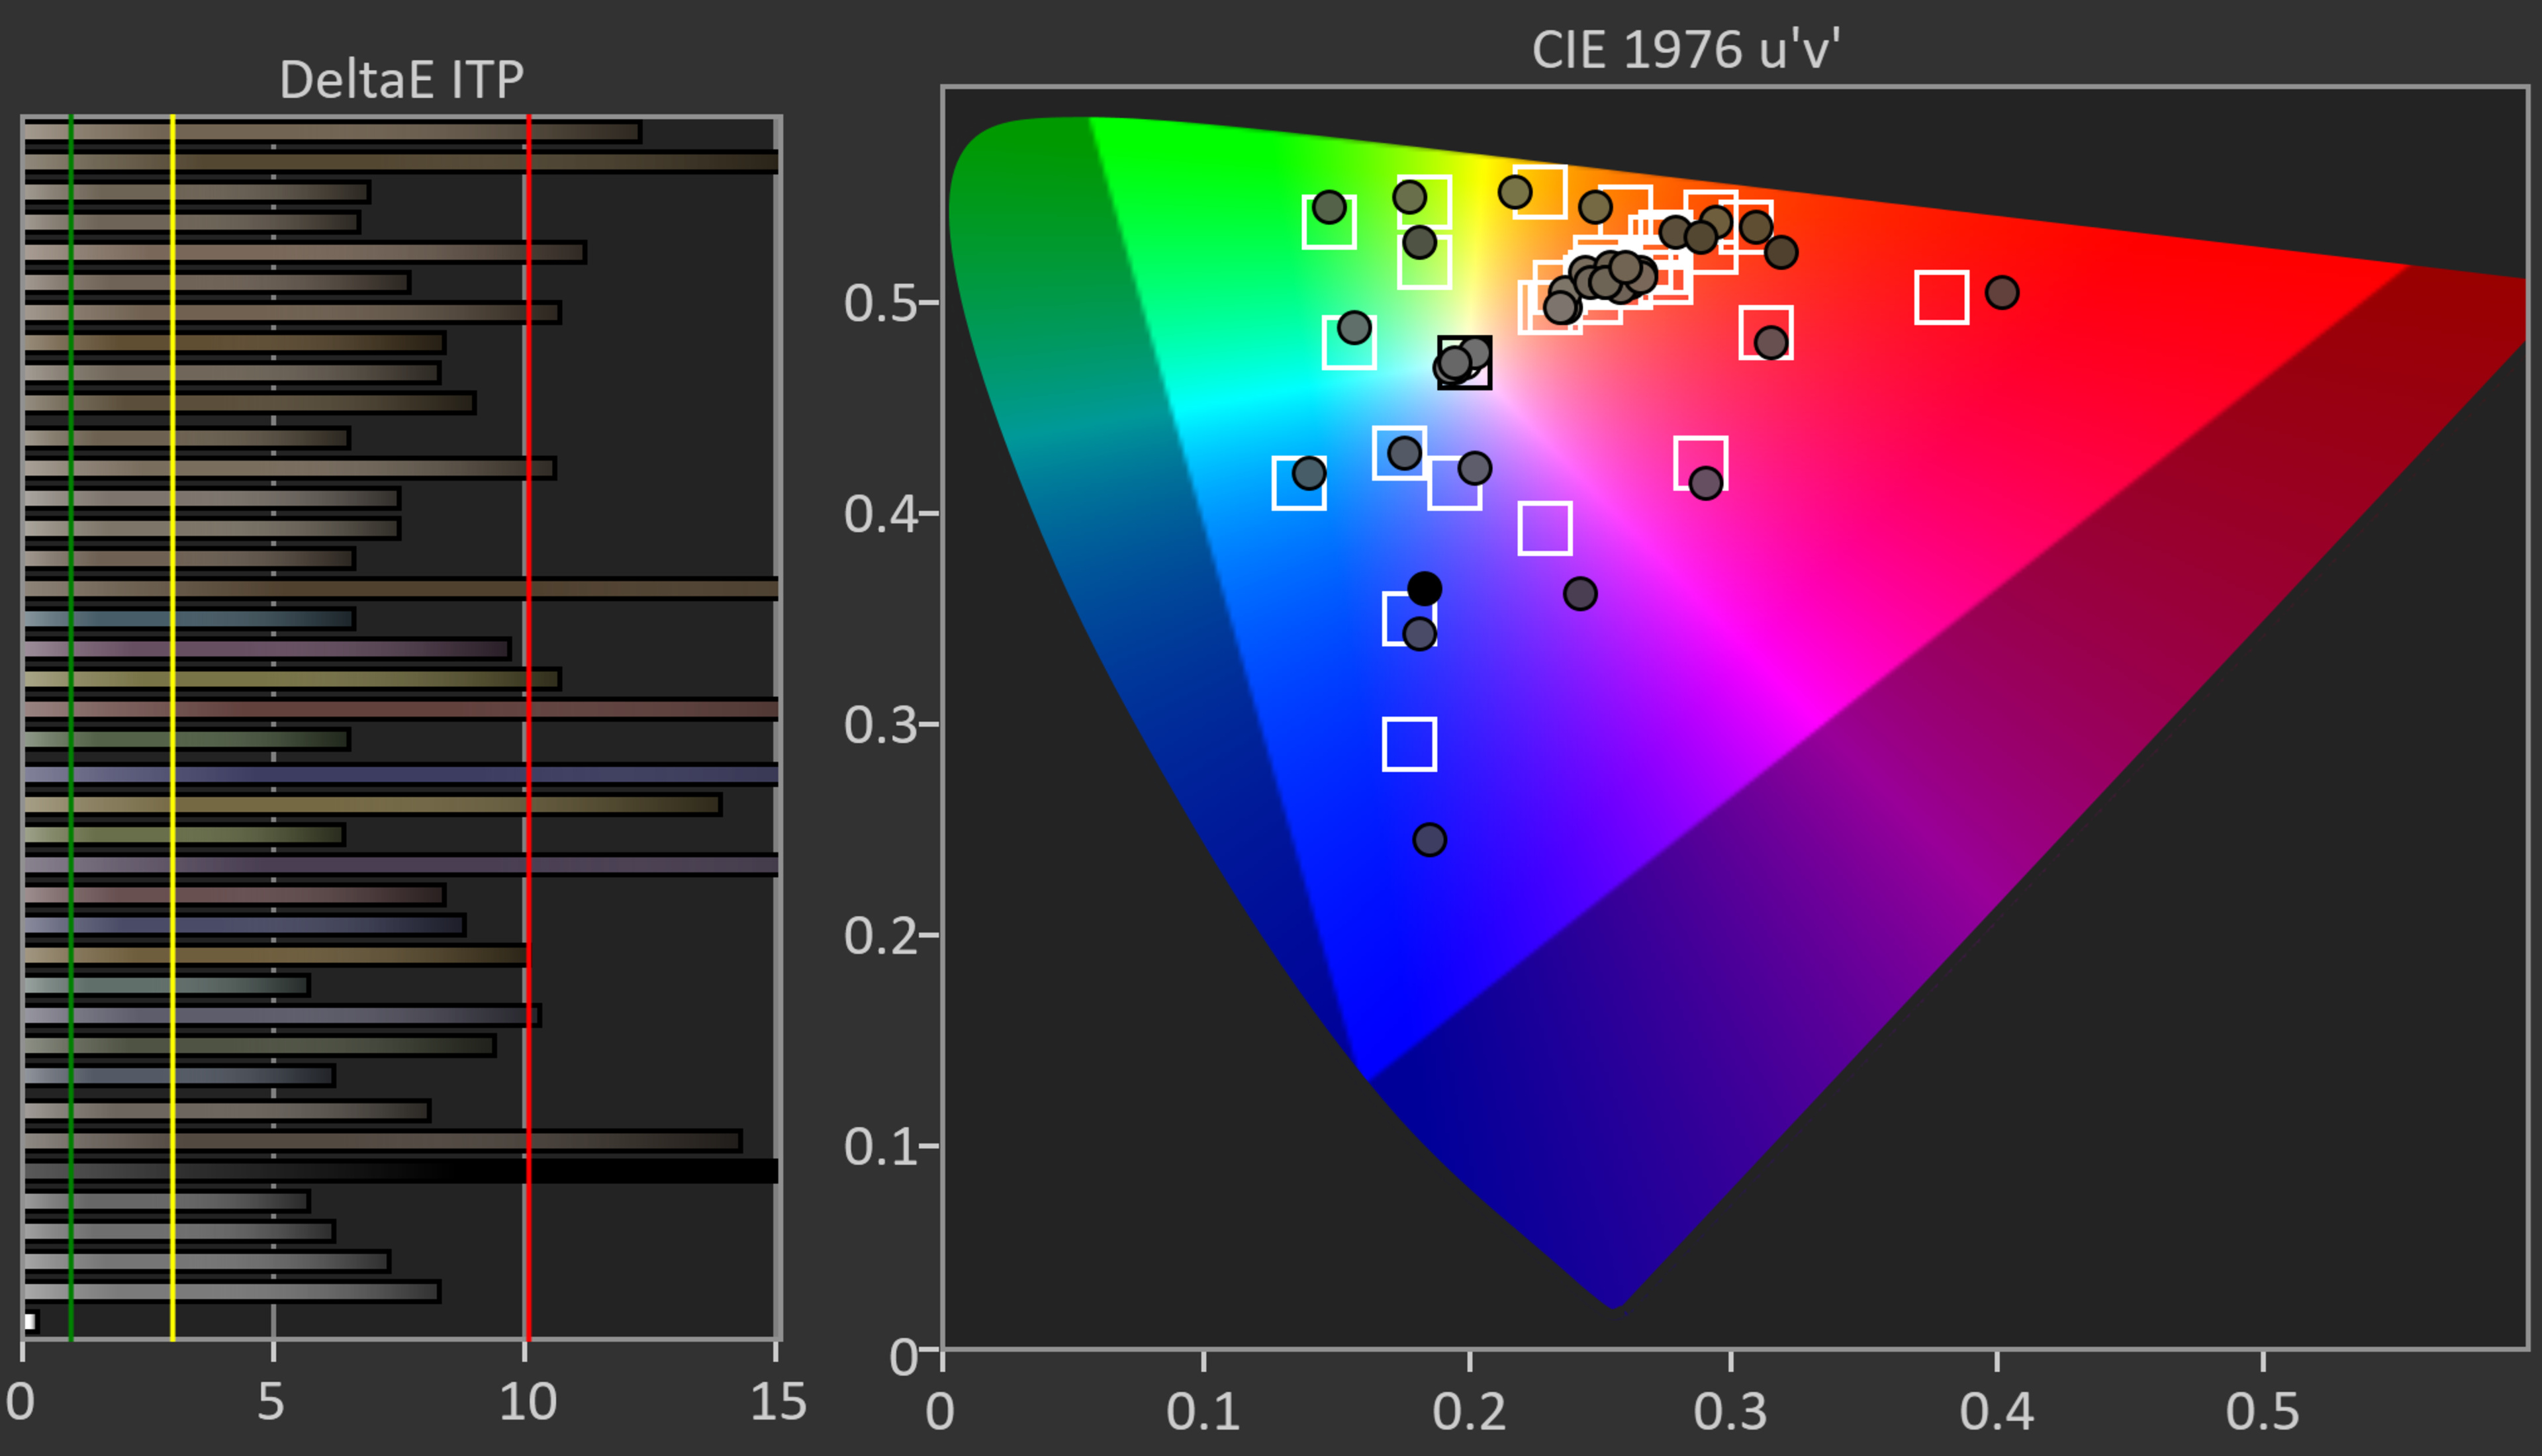
SDR Pre-Calibration Color Accuracy
6.1
8.3
Pre White Balance Picture


Pre Gamma Curve Picture


Pre Color Picture


White Balance dE 2000
5.82
3.31
Color dE 2000
2.79
1.96
Gamma
2.15
2.25
Color Temperature
6,199 K
6,473 K
Picture Mode
Movie
Movie
Color Temp Setting
Warm -5
Warm -5
Gamma Setting
2.2
2.2
SDR Post-Calibration Color Accuracy
9.5
9.4
Post White Balance Picture


Post Gamma Curve Picture


Post Color Picture


White Balance dE 2000
0.15
0.45
Color dE 2000
1.35
1.26
Gamma
2.20
2.15
Color Temperature
6,509 K
6,501 K
White Balance Calibration
20 point
20 point
Color Calibration
Yes
Yes
HDR Pre-Calibration Color Accuracy
7.1
5.9
HDR Pre White Balance Picture

HDR Pre Color Picture


White Balance dE ITP
9.70
13.19
Color dE ITP
8.9
11.2
Color Temperature
7,046 K
7,633 K
Picture Mode
Movie
Movie
HDR Post-Calibration Color Accuracy
9.1
7.2
HDR Post White Balance Picture

HDR Post Color Picture

White Balance dE ITP
5.70
10.66
Color dE ITP
5.30
9.80
Color Temperature
6,540 K
6,804 K
Processing
PQ EOTF Tracking
7.5
5.6
PQ EOTF Graph
600 Nit Tracking Delta
0.0067
0.0139
1000 Nit Tracking Delta
0.0067
0.0139
4000 Nit Tracking Delta
0.0067
0.0139
Low-Quality Content Smoothing
6.0
6.0
Low-Quality Content Smoothing Picture


Smoothing
5.5
5.5
Detail Preservation
7.0
7.0
Upscaling: Sharpness Processing
5.5
5.5
Sharpness Picture - 480p


HDR Native Gradient
6.8
7.0
HDR Gradient Picture


100% Black To 50% Gray
6.0
4.0
50% Gray To 100% White
8.0
8.0
100% Black To 50% Red
6.0
6.0
50% Red To 100% Red
8.0
8.0
100% Black To 50% Green
4.0
6.0
50% Green To 100% Green
8.0
8.0
100% Black To 50% Blue
6.0
8.0
50% Blue To 100% Blue
8.0
8.0
Game Mode Responsiveness
Input Lag
8.2
8.3
1080p @ 60Hz
10.5 ms
10.4 ms
1080p @ 60Hz Outside Game Mode
161.7 ms
161.4 ms
1080p @ 120Hz
6.6 ms
6.2 ms
1080p @ Max Refresh Rate
6.6 ms
6.2 ms
4k @ 60Hz
10.5 ms
10.2 ms
4k @ 60Hz @ 4:4:4
10.5 ms
10.7 ms
4k @ 60Hz Outside Game Mode
160.9 ms
160.6 ms
4k @ 60Hz With Interpolation
160.8 ms
160.6 ms
4k @ 120Hz
N/A
N/A
4k @ Max Refresh Rate
10.5 ms
10.2 ms
8k @ 60Hz
N/A
N/A
Supported Resolutions
7.2
7.2
Resolution
4k
4k
480p @ 59.94Hz (Widescreen)
Yes
Yes
720p @ 59.94Hz
Yes
Yes
1080p @ 60Hz @ 4:4:4
Yes
Yes
1080p @ 120Hz
Yes
Yes
1080p Maximum Refresh Rate
120 Hz
120 Hz
4k @ 60Hz
Yes
Yes
4k @ 60Hz @ 4:4:4
Yes
Yes
4k @ 120Hz
No
No
4k @ 120Hz @ 4:4:4
No
No
4k Maximum Refresh Rate
60 Hz
60 Hz
8k @ 30Hz Or 24Hz
No
No
8k @ 60Hz
No
No
Variable Refresh Rate
6.4
6.4
Native Refresh Rate
60Hz
60Hz
Variable Refresh Rate
Yes
Yes
HDMI Forum VRR
Yes
Yes
FreeSync
Yes
Yes
G-SYNC Compatible
Yes
Yes
4k VRR Maximum
60 Hz
60 Hz
4k VRR Minimum
48 Hz
48 Hz
1080p VRR Maximum
120 Hz
120 Hz
1080p VRR Minimum
< 20 Hz
< 20 Hz
VRR + Local Dimming
No Local Dimming
No Local Dimming
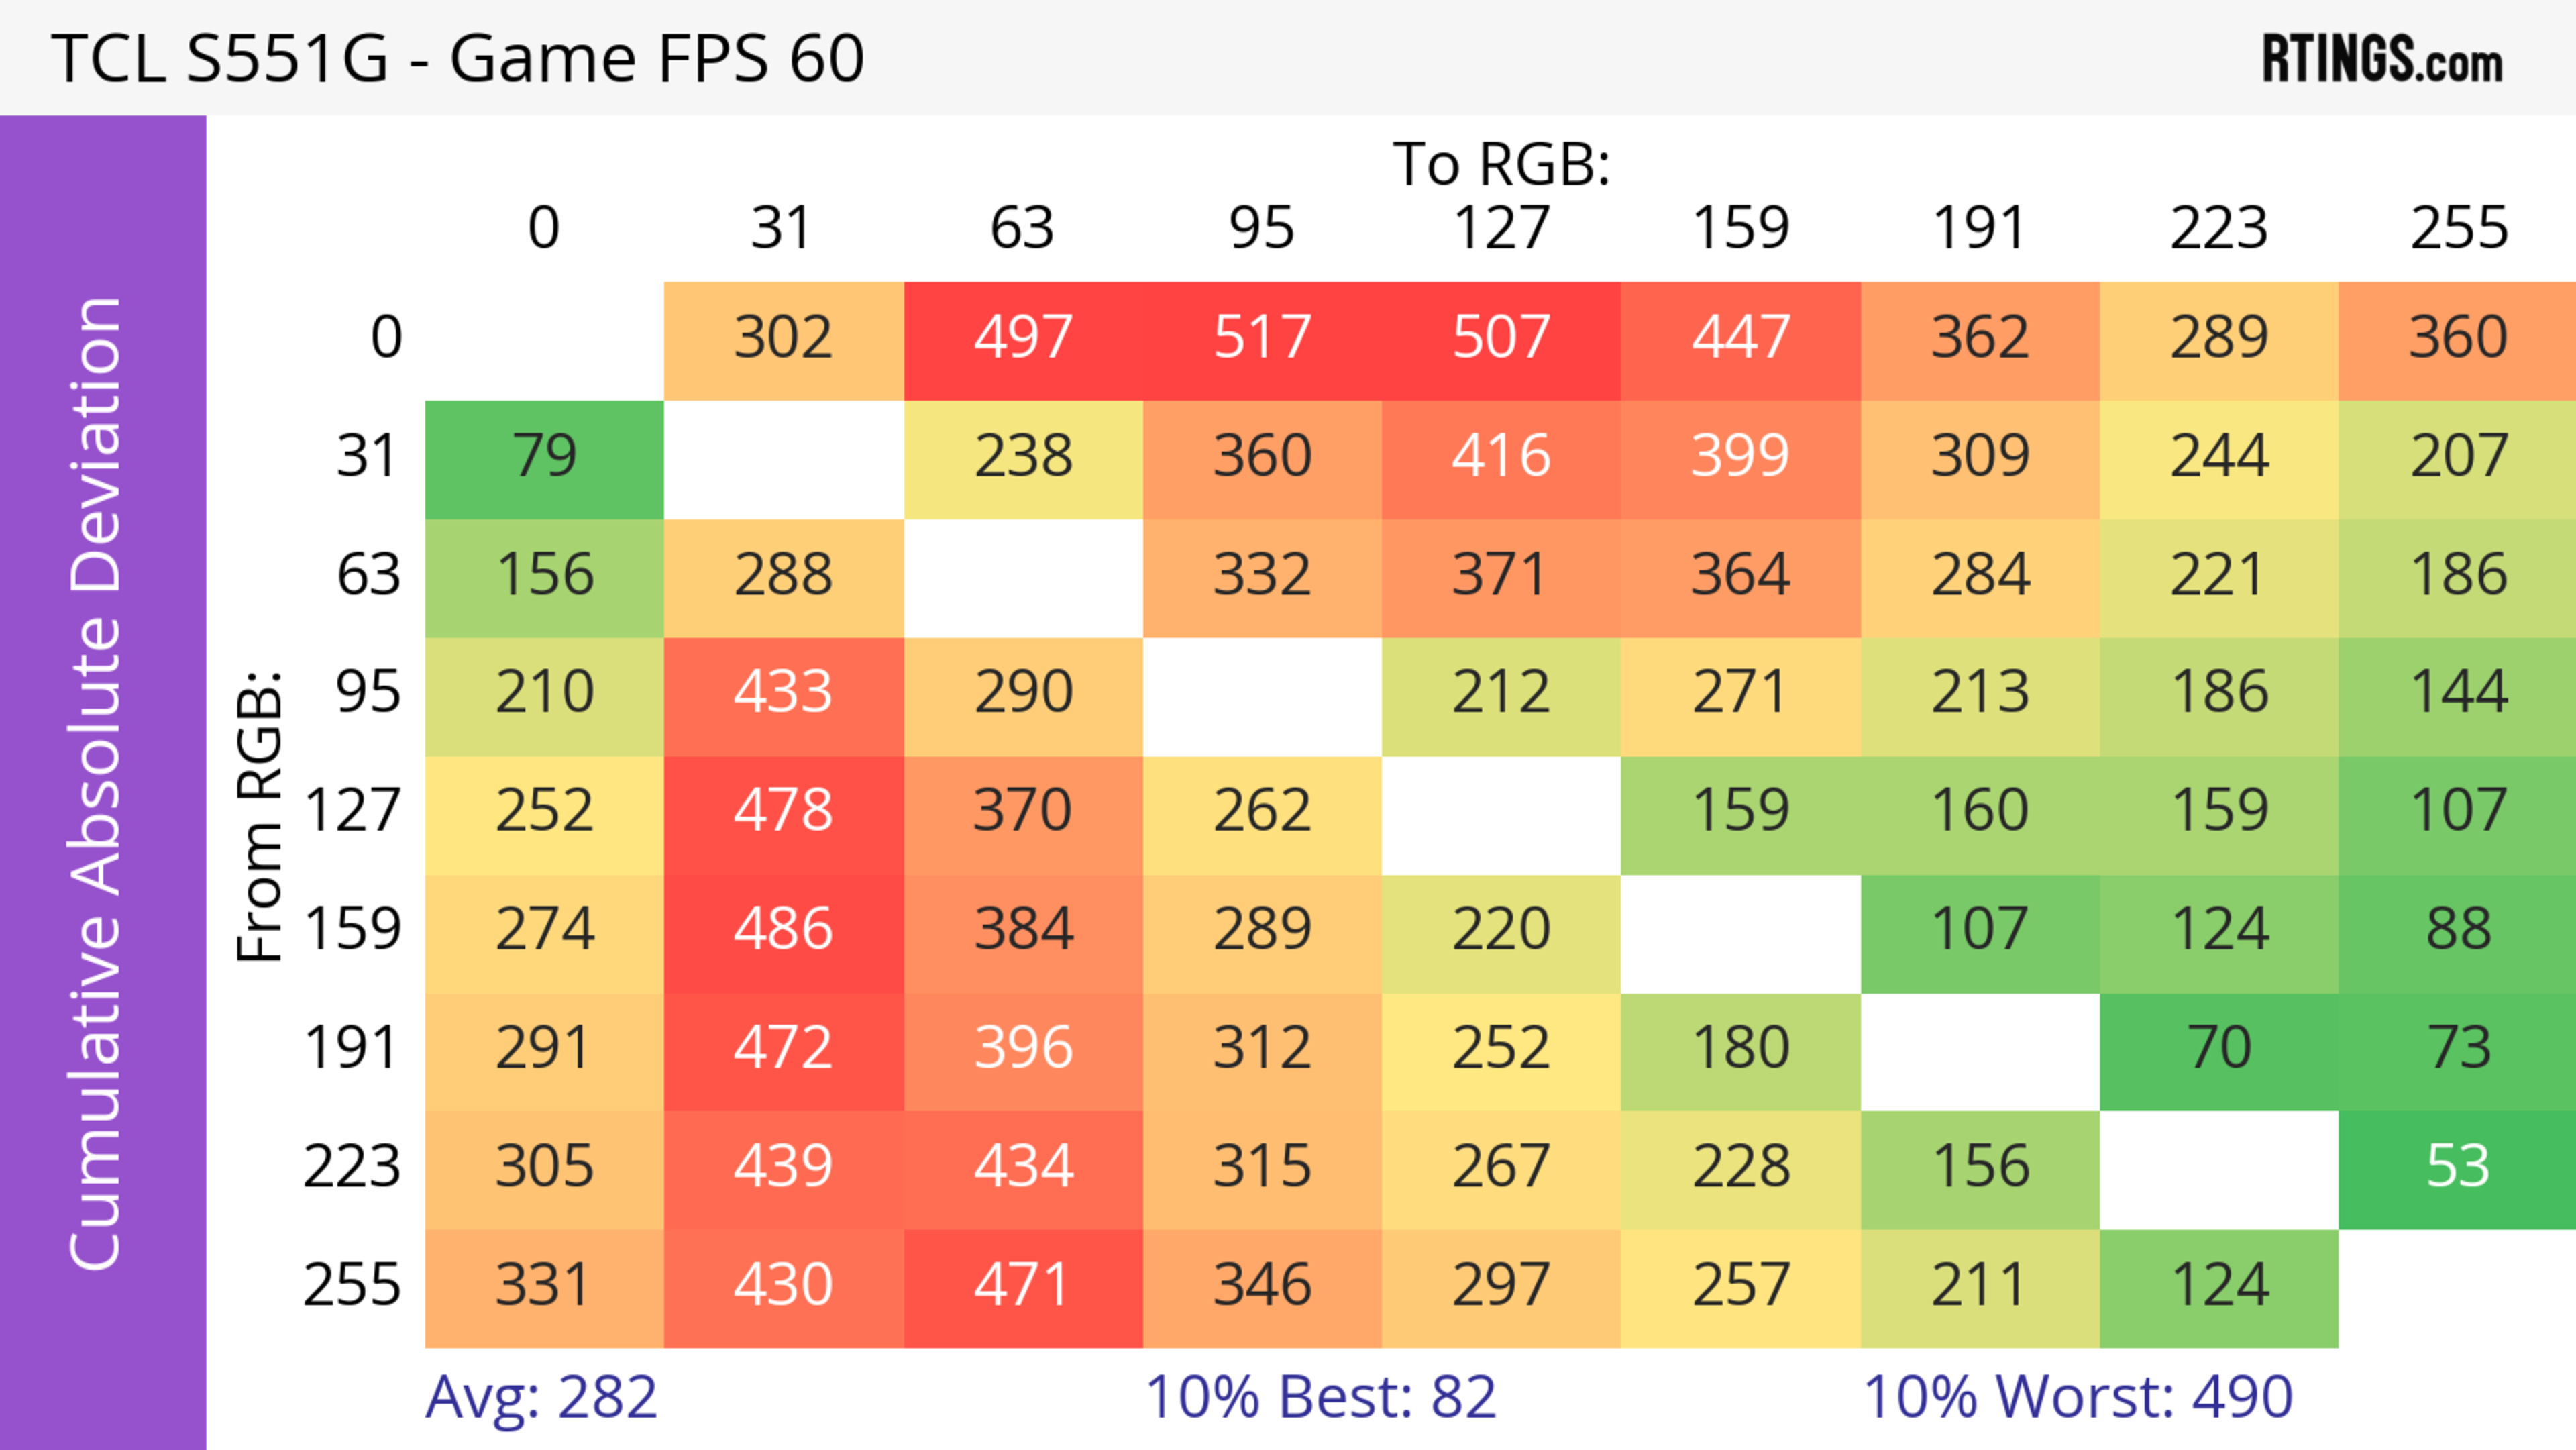
CAD In Game Mode @ Max Refresh Rate
6.2
2.2
Pursuit Photo Max Refresh
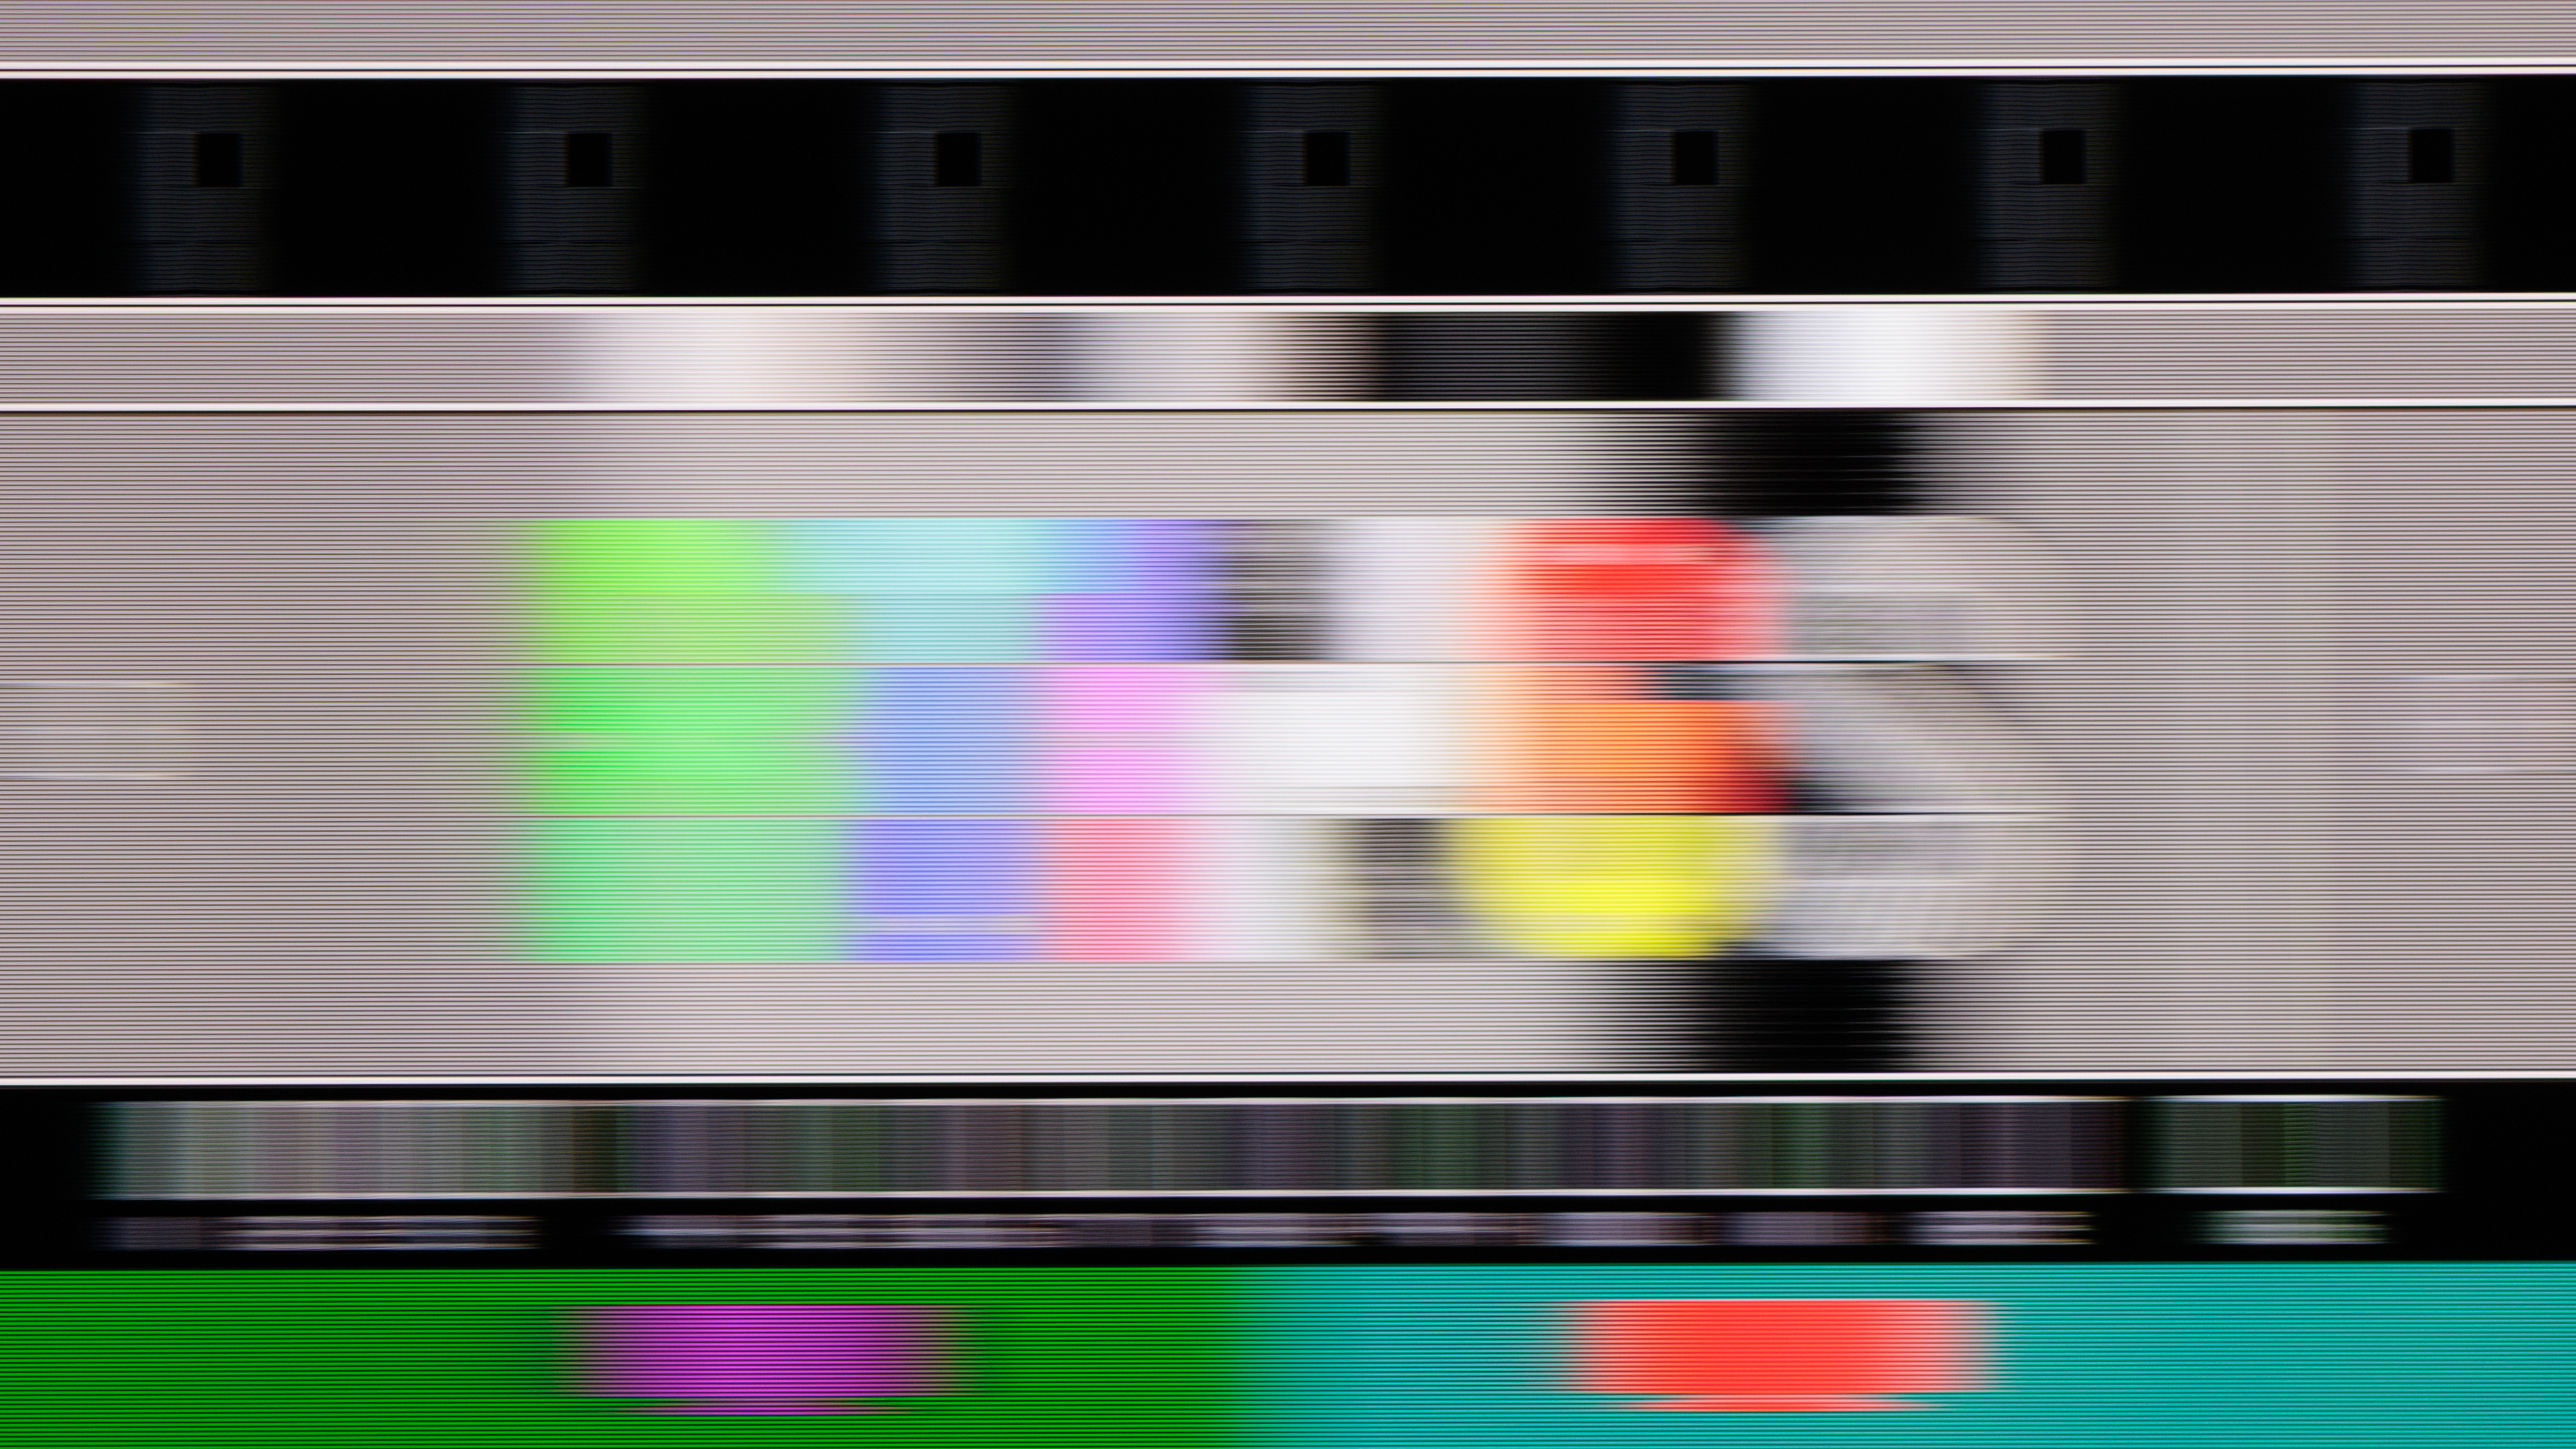

CAD Heatmap Max Refresh

Transition At Max Refresh

0 to 31

0 to 31
Avg. CAD
282
590
Best 10% CAD
82
188
Worst 10% CAD
490
909
CAD In Game Mode @ 120Hz
0.0
0.0
Pursuit Photo 120Hz
CAD Heatmap 120Hz
Transition At 120Hz

Avg. CAD
N/A
N/A
Best 10% CAD
N/A
N/A
Worst 10% CAD
N/A
N/A
CAD In Game Mode @ 60Hz
6.2
2.2
Pursuit Photo 60Hz


CAD Heatmap 60Hz


Transition 60Hz
0 to 31

0 to 31
Avg. CAD
282
590
Best 10% CAD
82
188
Worst 10% CAD
490
909
PS5 Compatibility
PS5 Screenshot


Auto Low Latency Mode (ALLM)
Yes
Yes
4k @ 120Hz
No
No
1440p @ 120Hz
Yes
Yes
1080p @ 120Hz
Yes
Yes
HDR
Yes
Yes
VRR
Yes
Yes
Xbox Series X|S Compatibility
Xbox Series X Screenshot


Auto Low Latency Mode (ALLM)
Yes
Yes
4k @ 120Hz
No
No
1440p @ 120Hz
Yes
Yes
1080p @ 120Hz
Yes
Yes
HDR
Yes
Yes
VRR
Yes
Yes
Motion Handling
Stutter
7.3
8.8
Frame Hold Time @ 24 fps
31.3 ms
15.9 ms
Frame Hold Time @ 60 fps
6.3 ms
0.0 ms
24p Judder
10
10
Judder-Free 24p
Yes
Yes
Judder-Free 24p via 60p
Yes
Yes
Judder-Free 24p via 60i
Yes
Yes
Judder-Free 24p via Native Apps
Yes
Yes
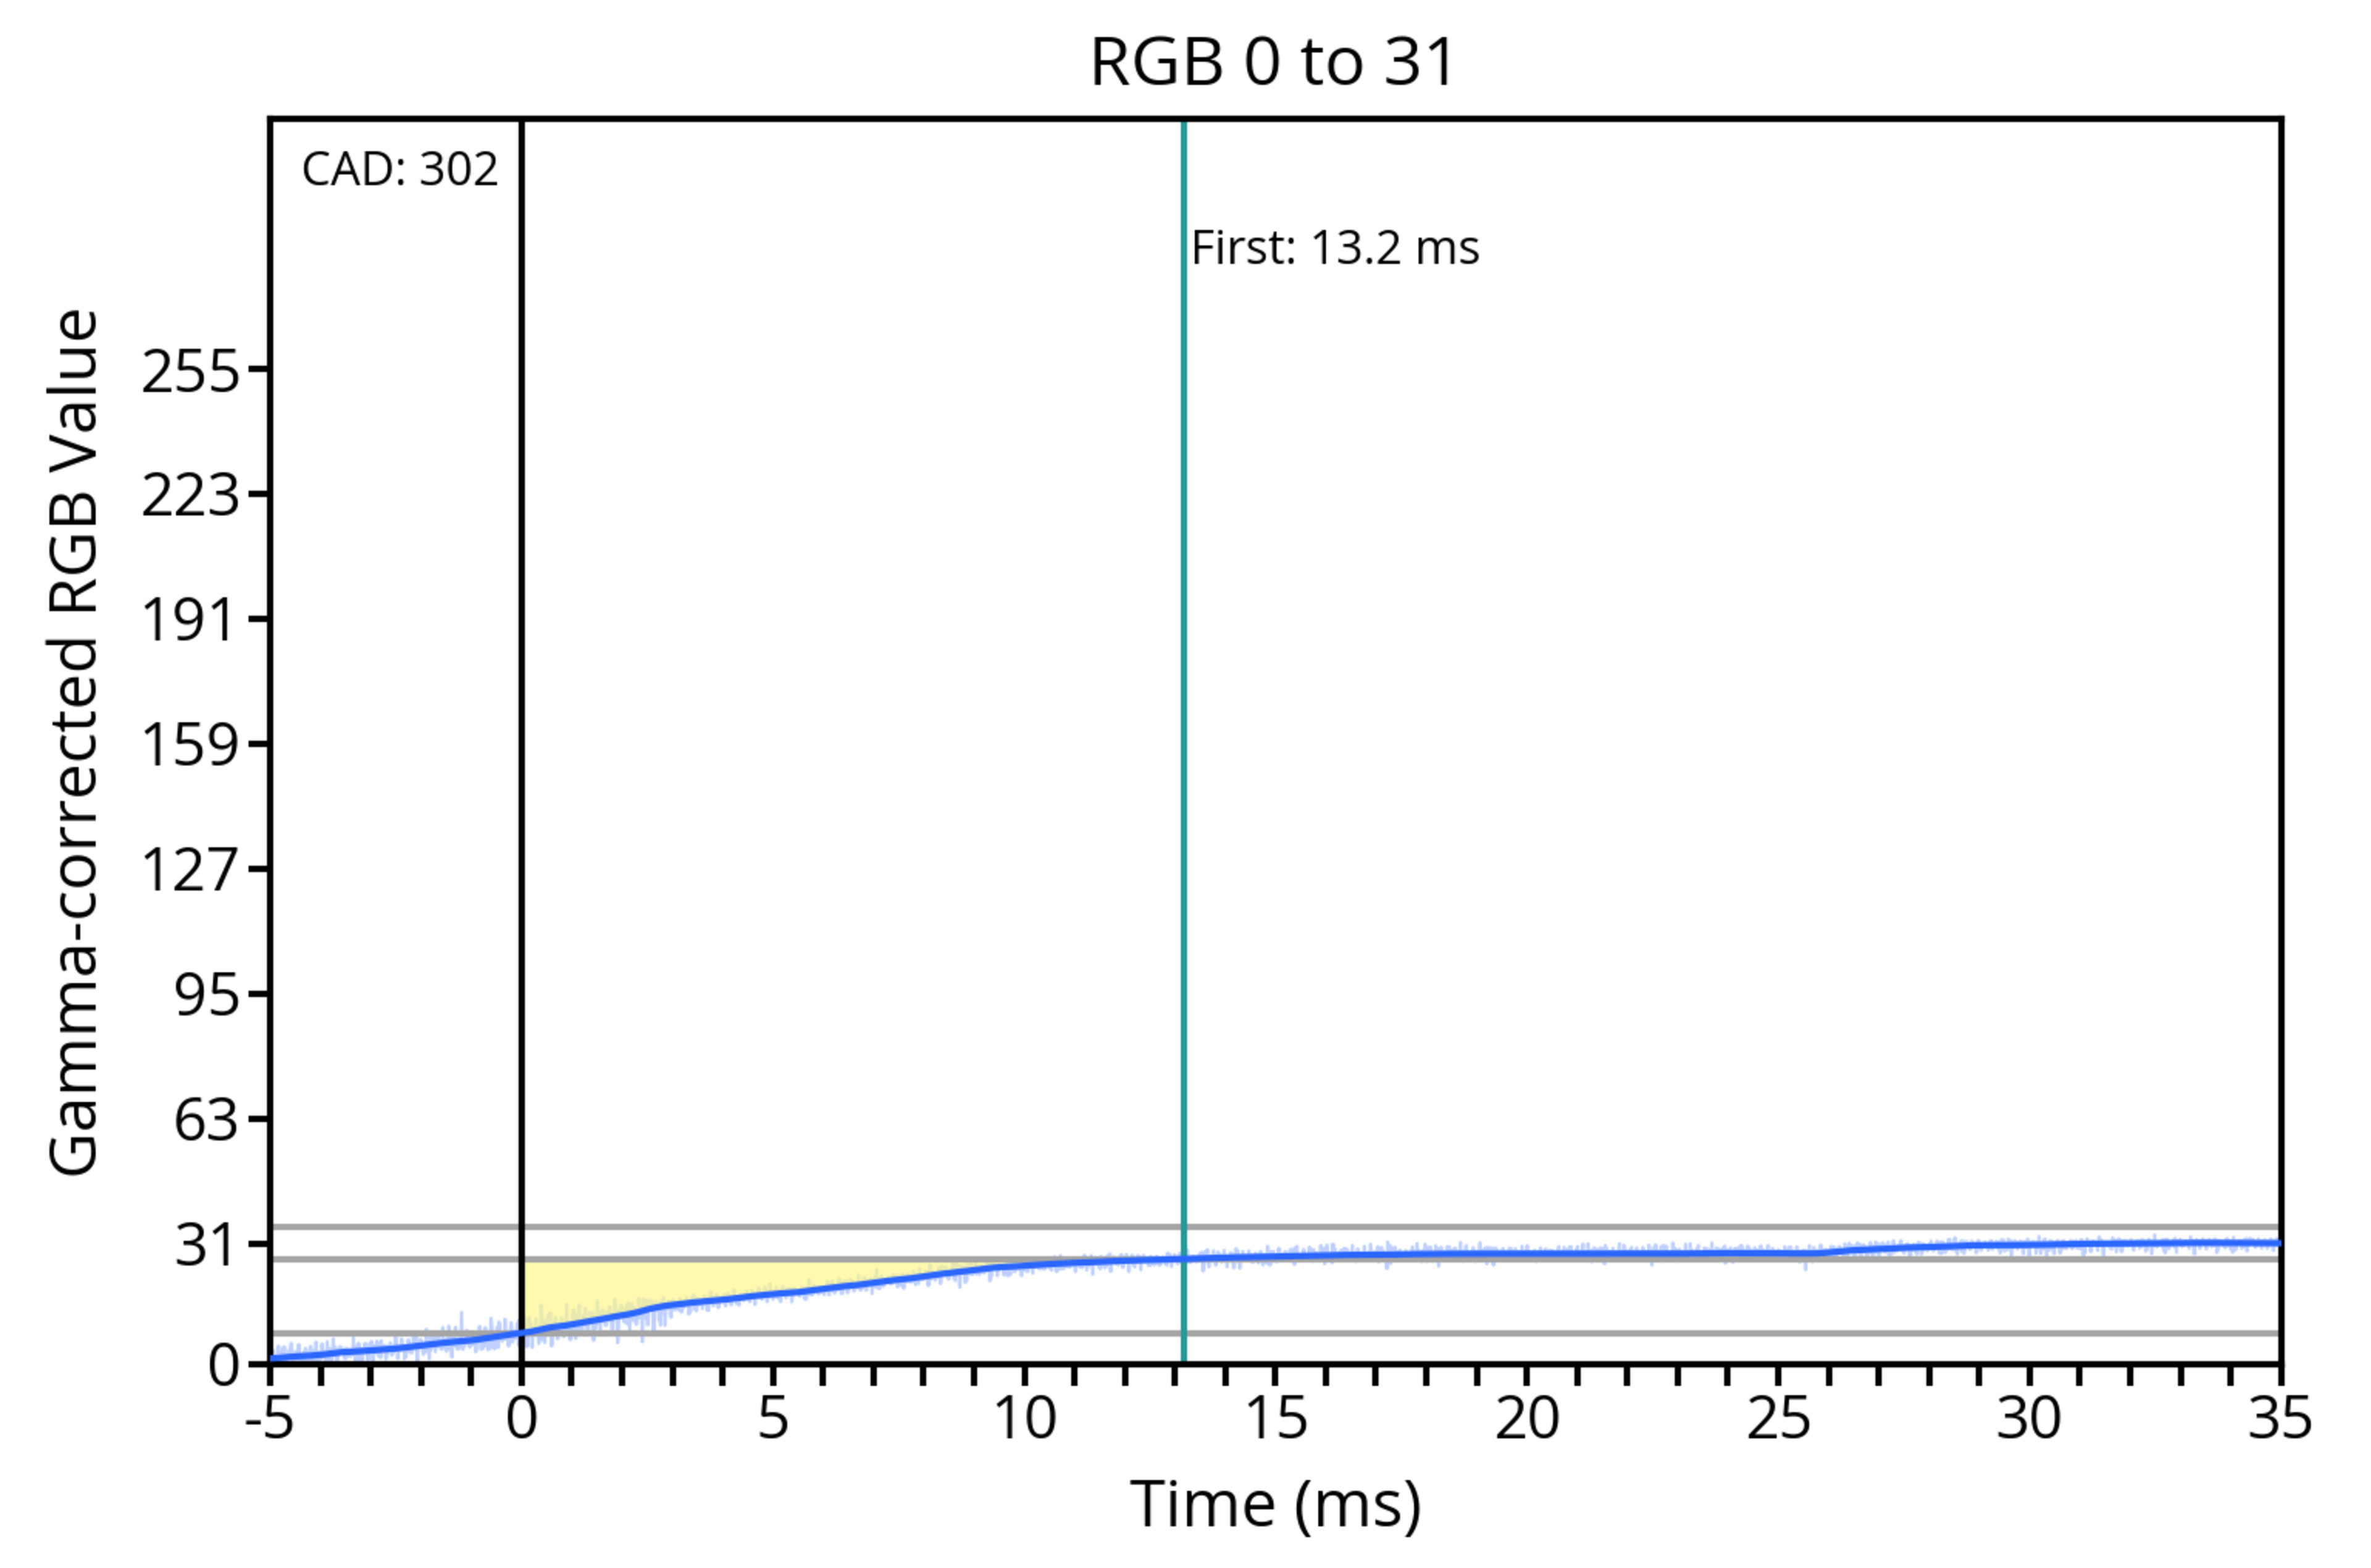
Response Time
7.1
4.9
Pursuit Photo 60Hz

Response Time Heatmap 60Hz
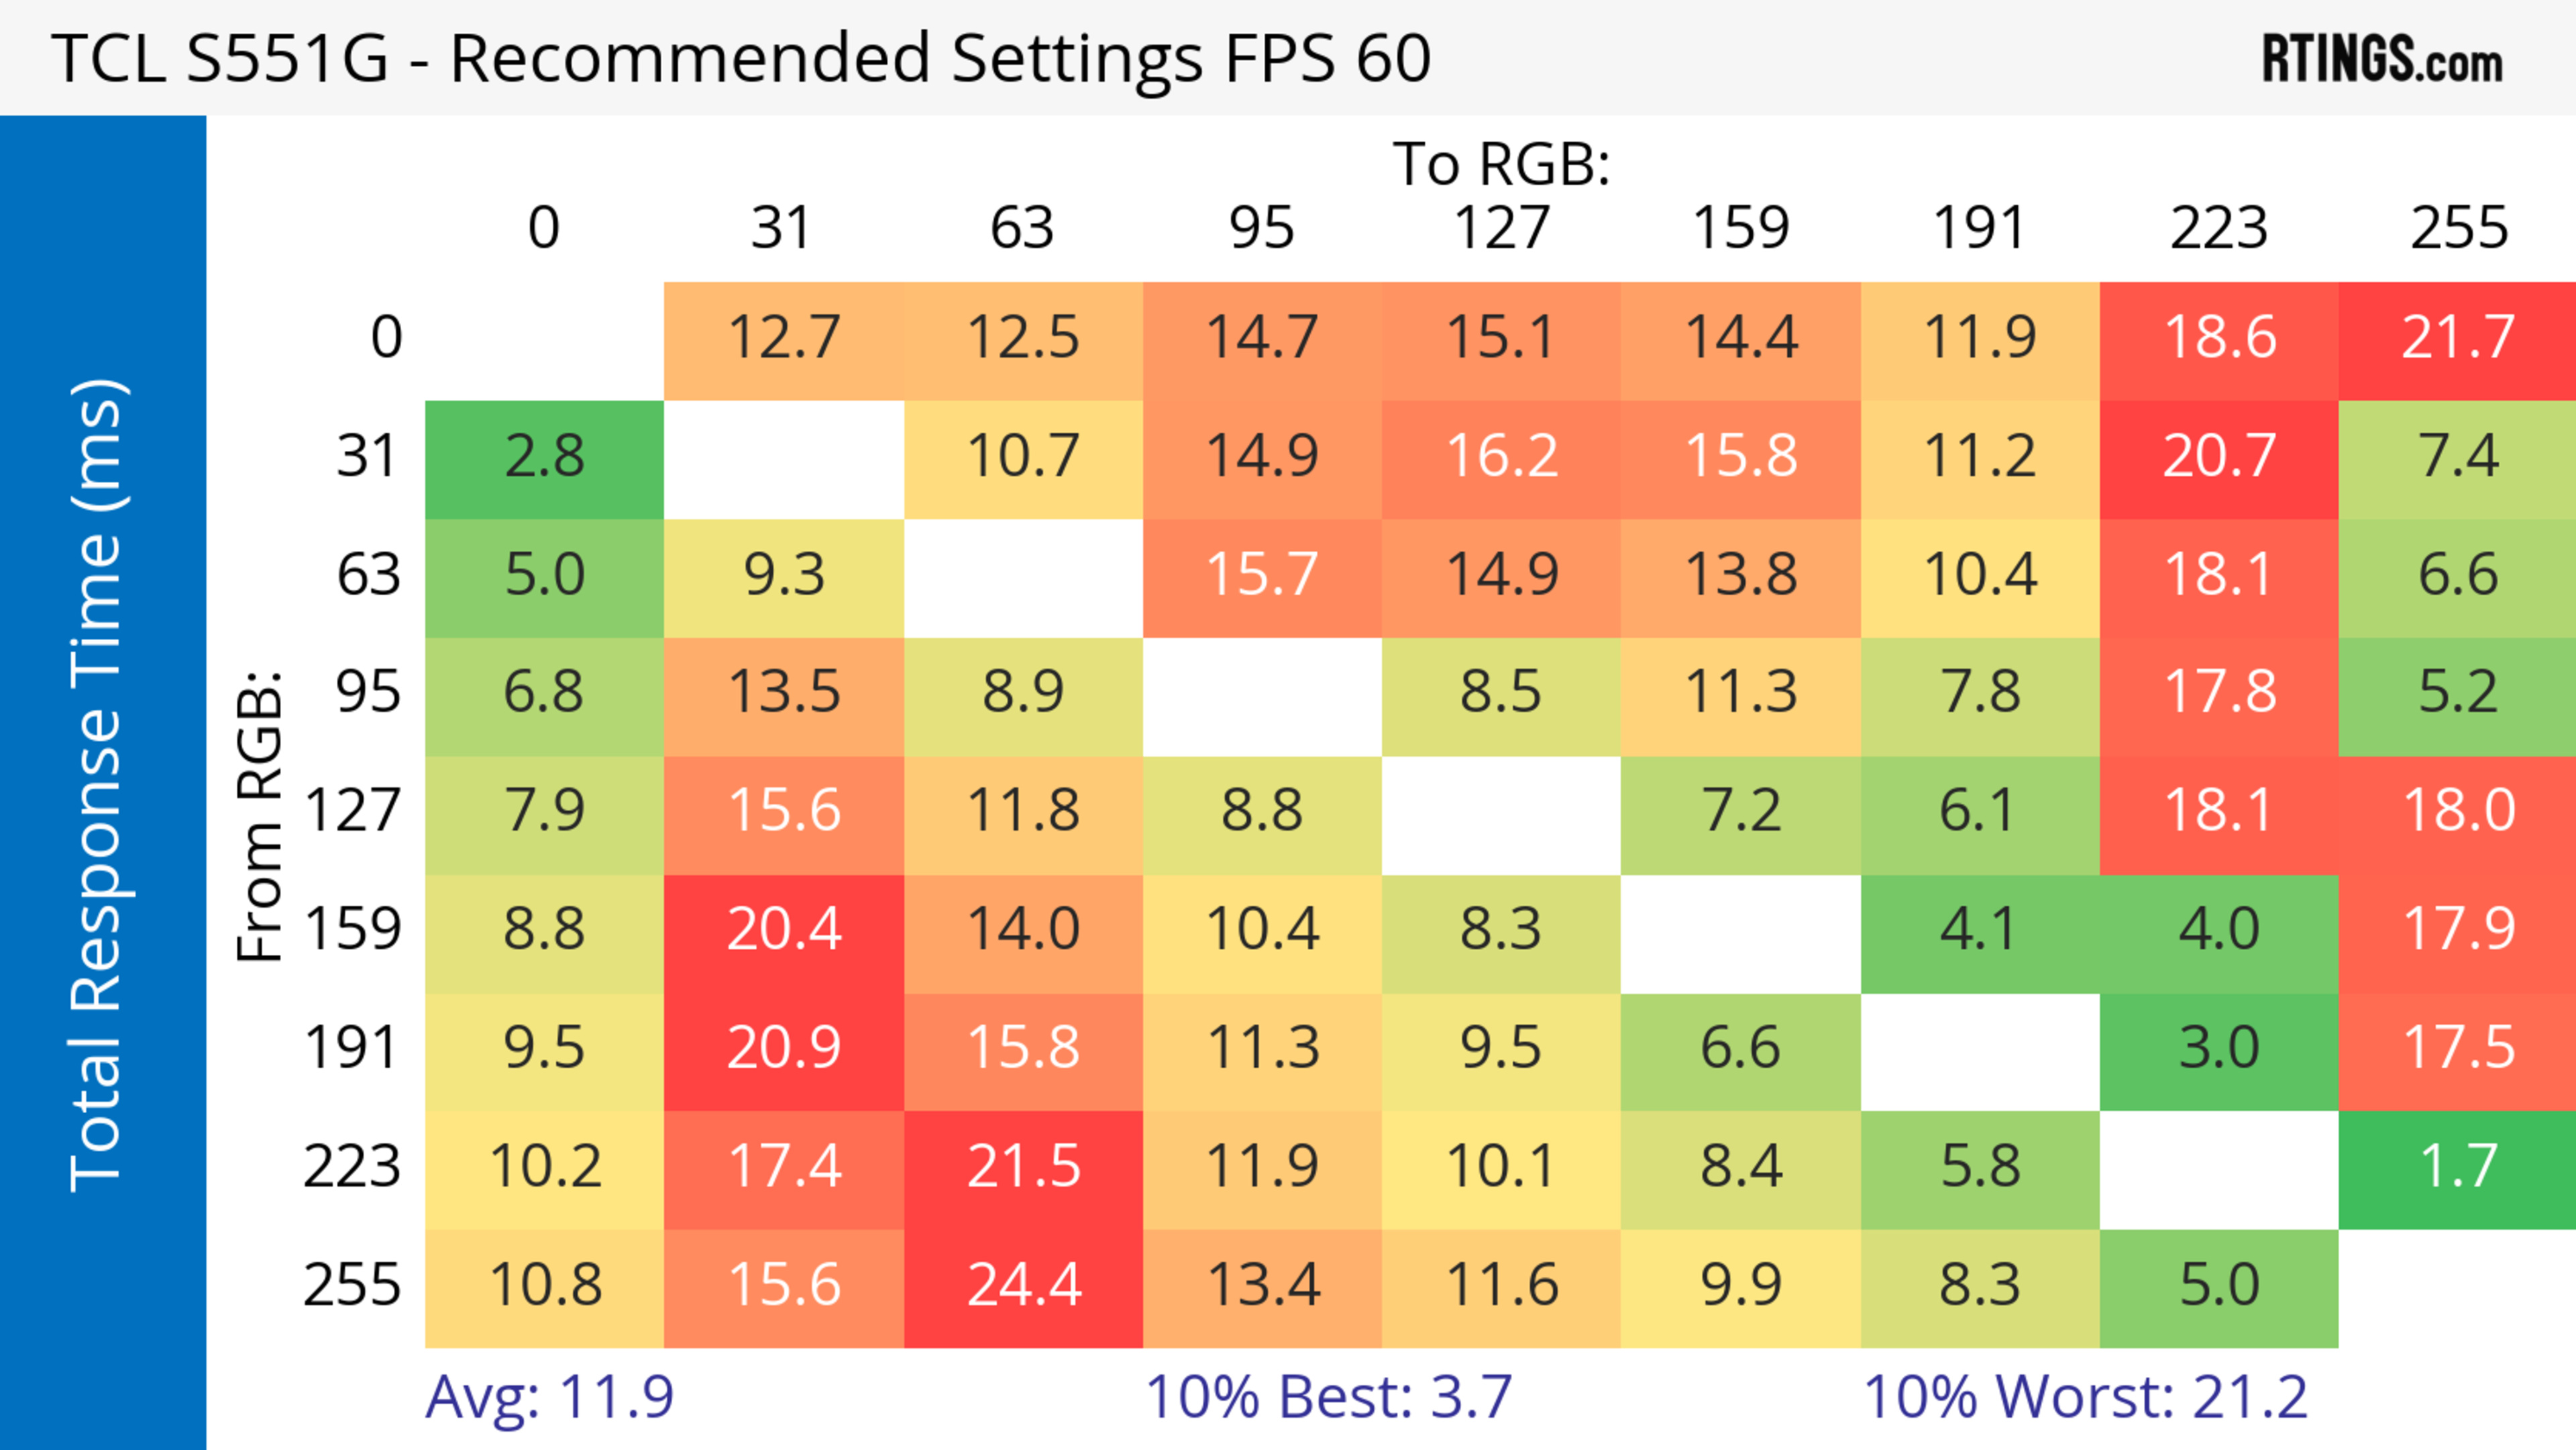

Transition At 60Hz
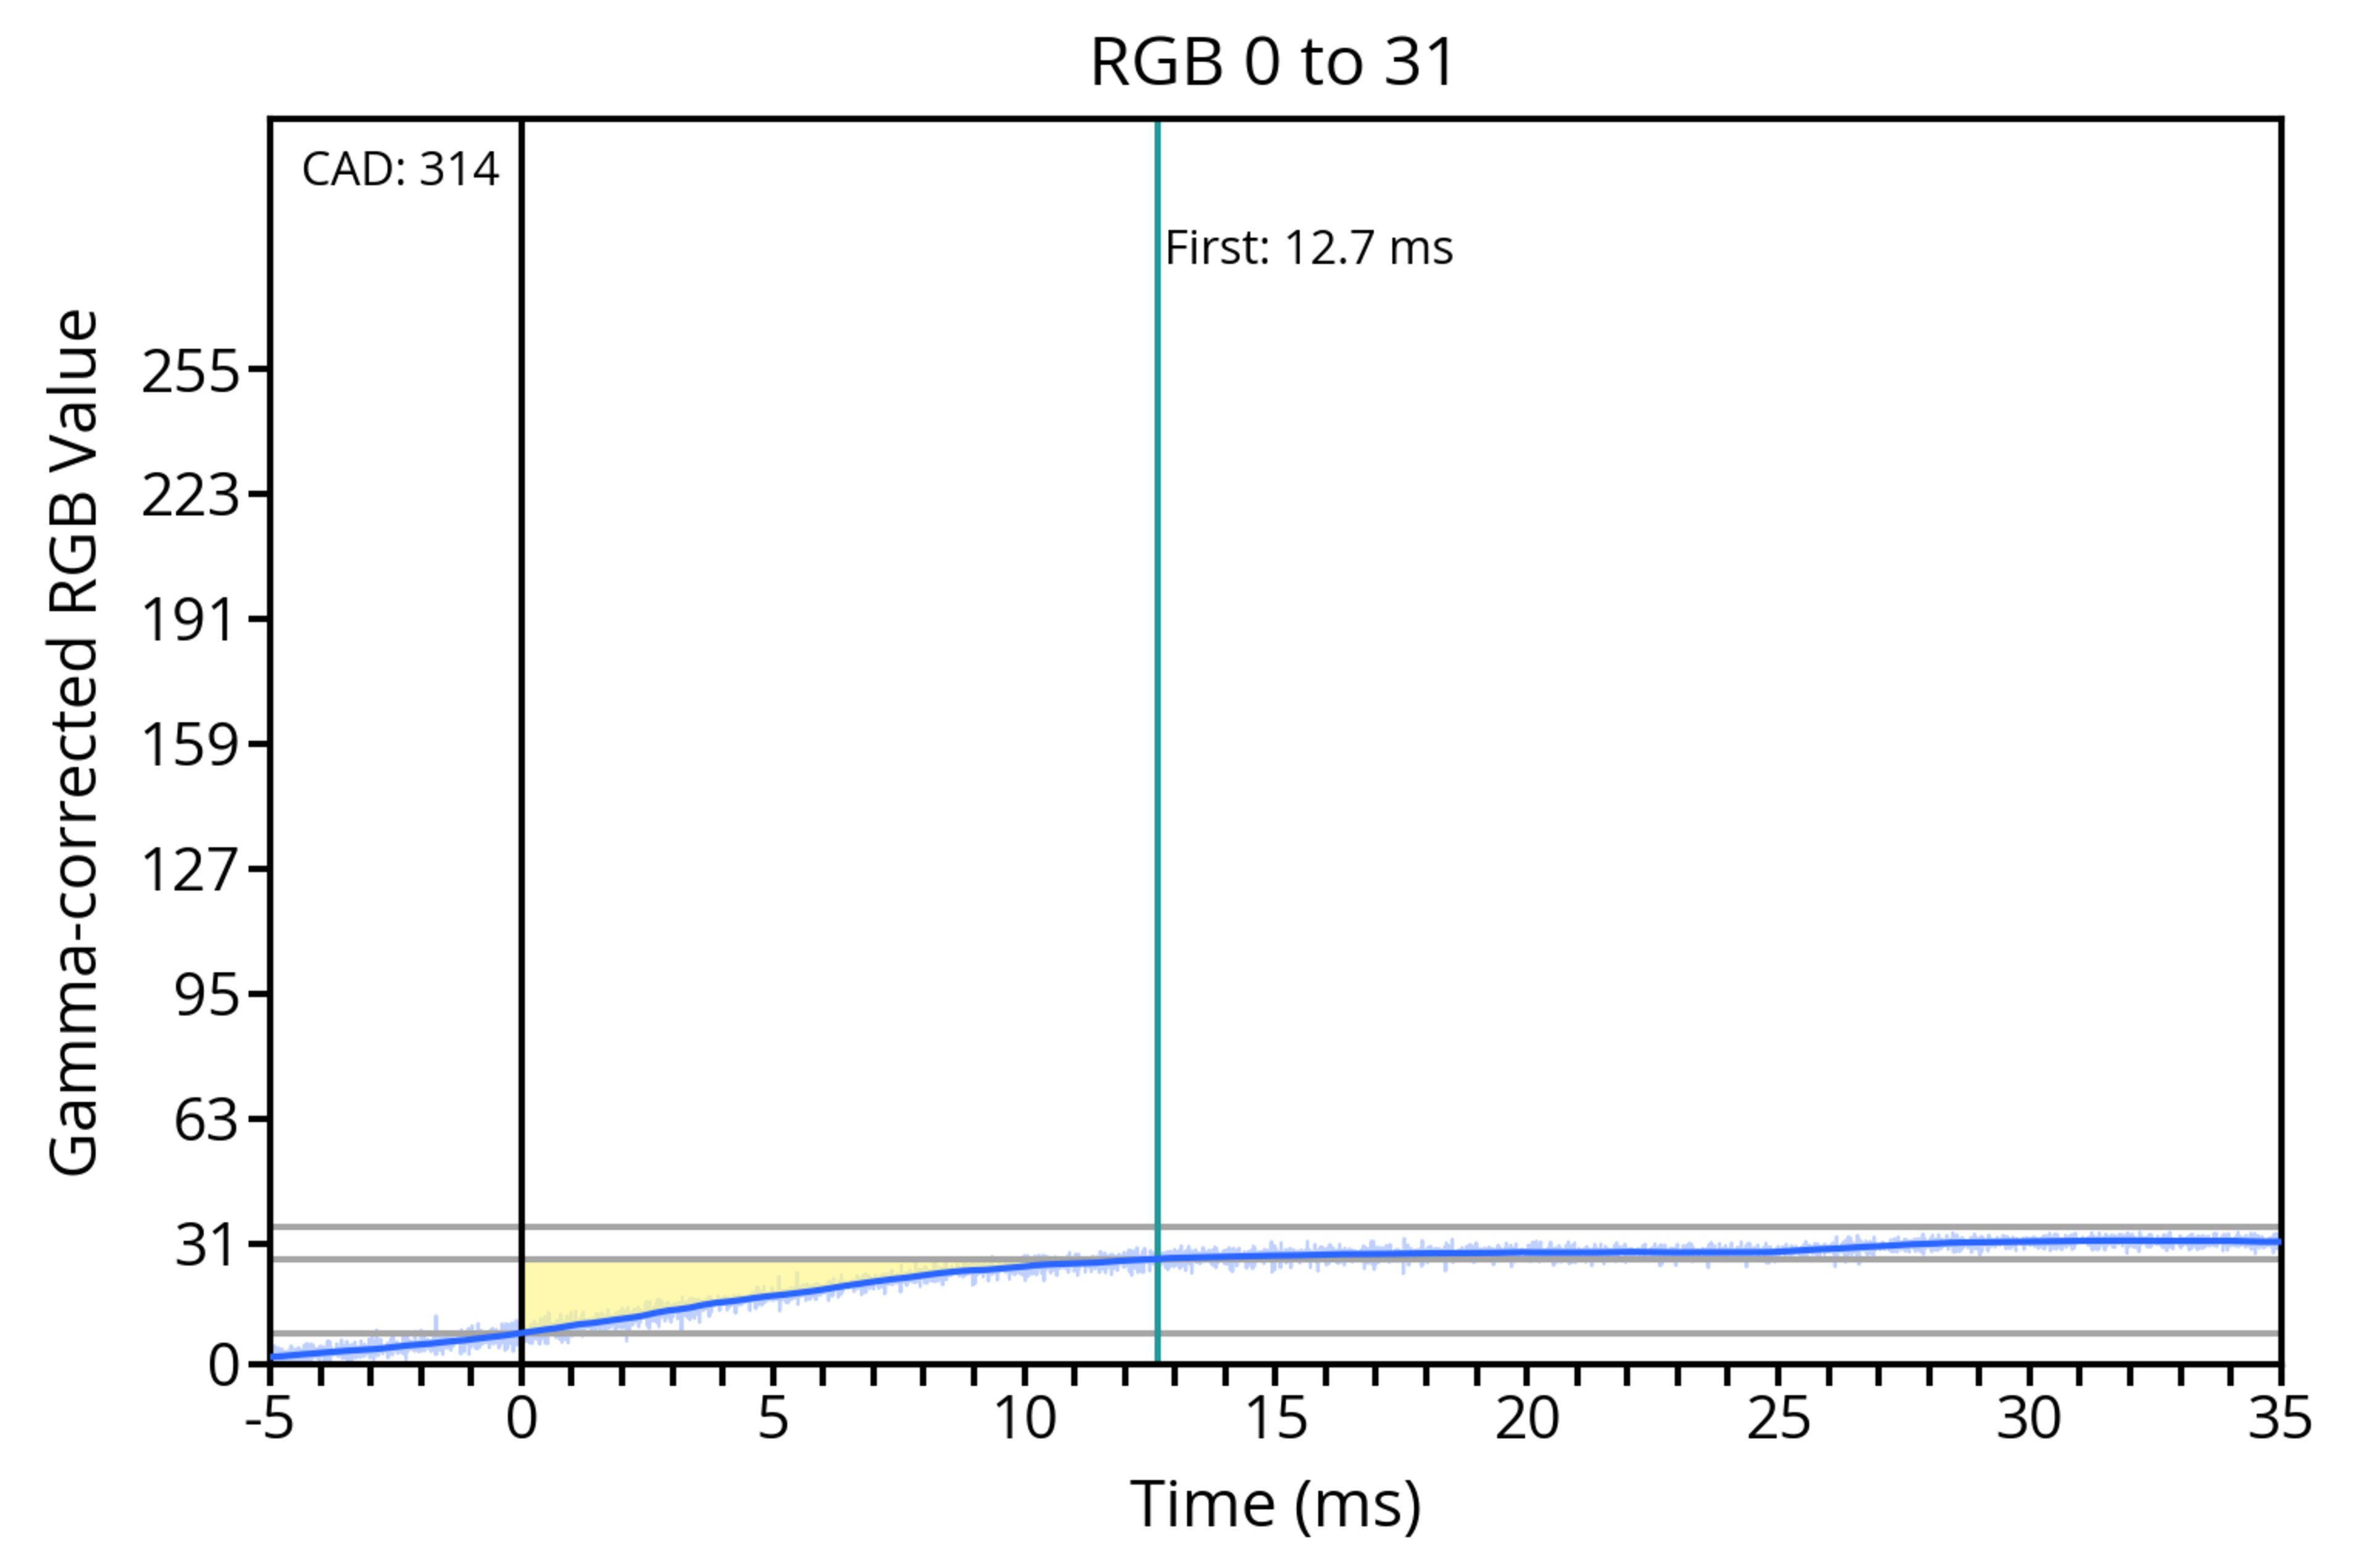
0 to 31

0 to 31
First Response Time
10.4 ms
25.8 ms
Total Response Time
11.9 ms
7.0 ms
Worst 10% Response Time
21.2 ms
37.0 ms
Flicker
Backlight chart


Flicker-Free
No
No
PWM Dimming Frequency
150 Hz
150 Hz
Black Frame Insertion (BFI)
BFI Picture
BFI Frequency Picture
Optional BFI
No
No
Min Flicker For 60 fps
150 Hz
150 Hz
60Hz For 60 fps
No
No
120Hz For 120 fps
No
No
Min Flicker For 60 fps In Game Mode
150 Hz
150 Hz
Motion Interpolation
Motion Interpolation (30 fps) Picture


Motion Interpolation (30 fps)
Yes
Yes
Motion Interpolation (60 fps) Picture
Motion Interpolation (60 fps)
No
No
Reflections
Direct Reflections
6.3
5.8
Ring Light Picture
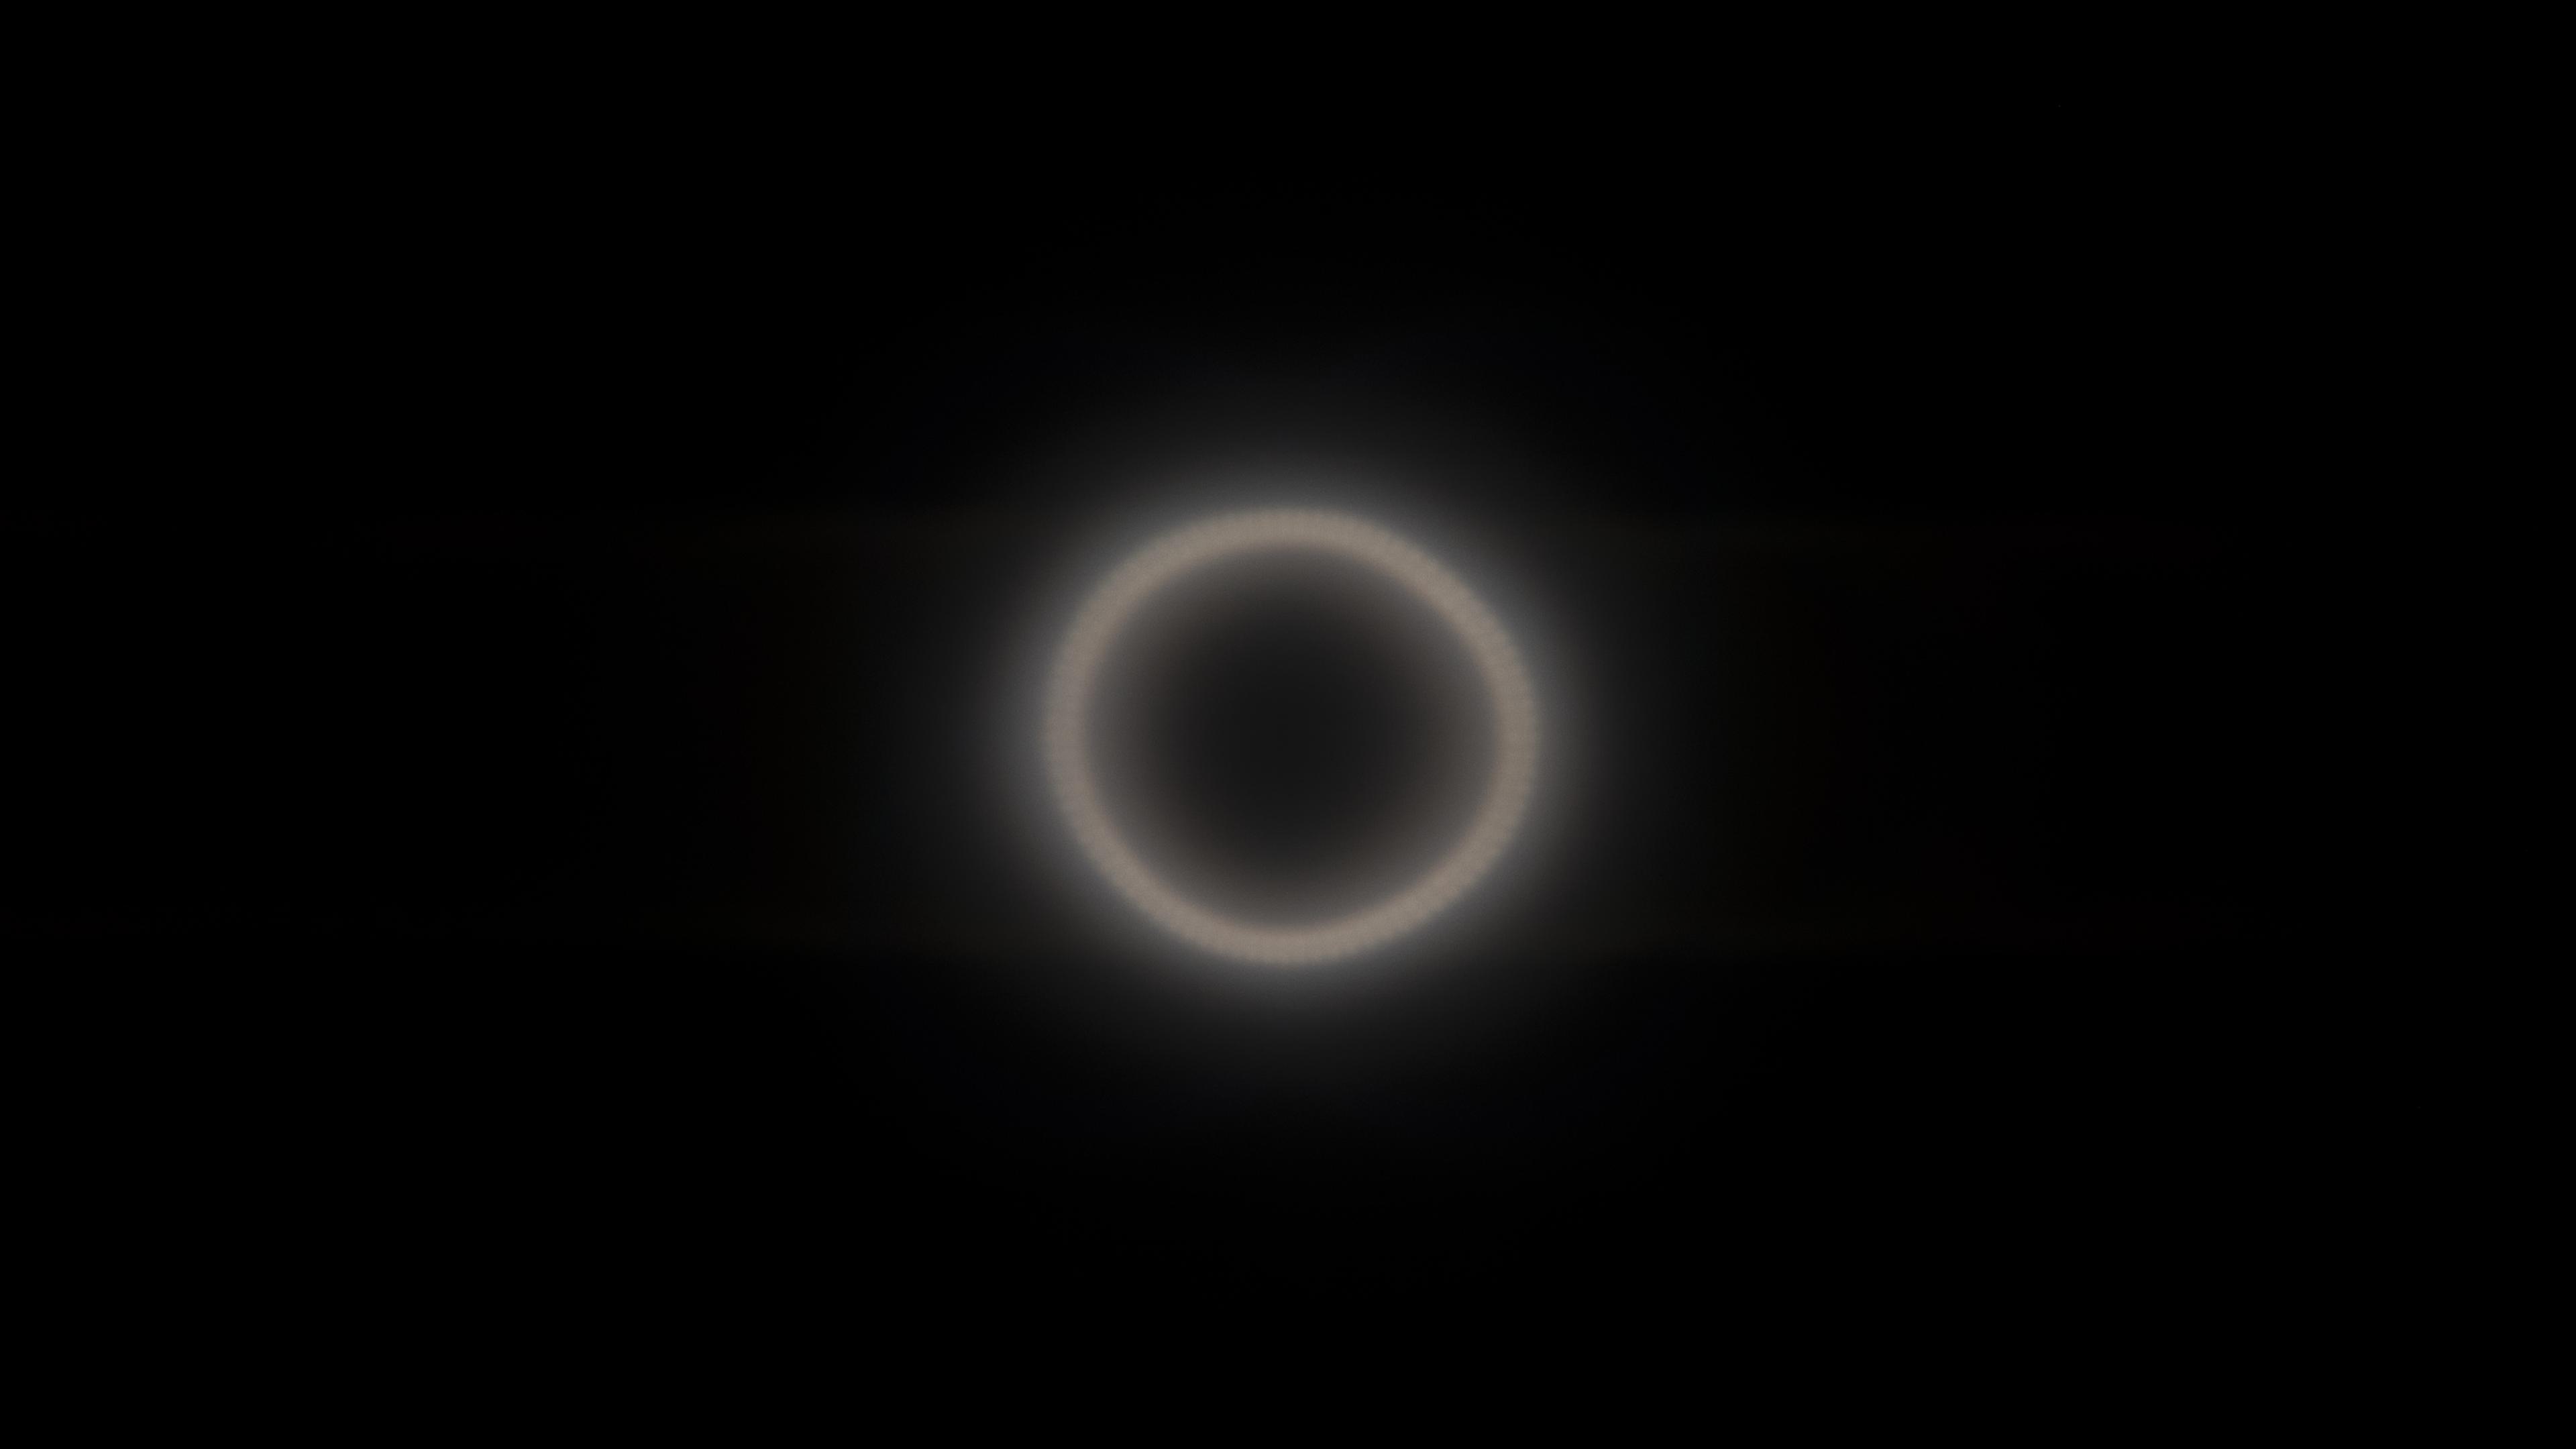

Direct Reflections Graph
Peak Direct Reflection Intensity
46.9%
57.9%
Screen Finish
Glossy
Glossy
Ambient Black Level Raise
9.1
9.0
Black Level Raise Picture


Bright Room Black Level Raise Graph
Black Luminance @ 0 lx
0.06 cd/m²
0.06 cd/m²
Black Luminance @ 1000 lx
0.38 cd/m²
0.39 cd/m²
Total Reflected Light
6.2
5.7
Bright Room Off Picture


Ring Picture Total Reflection
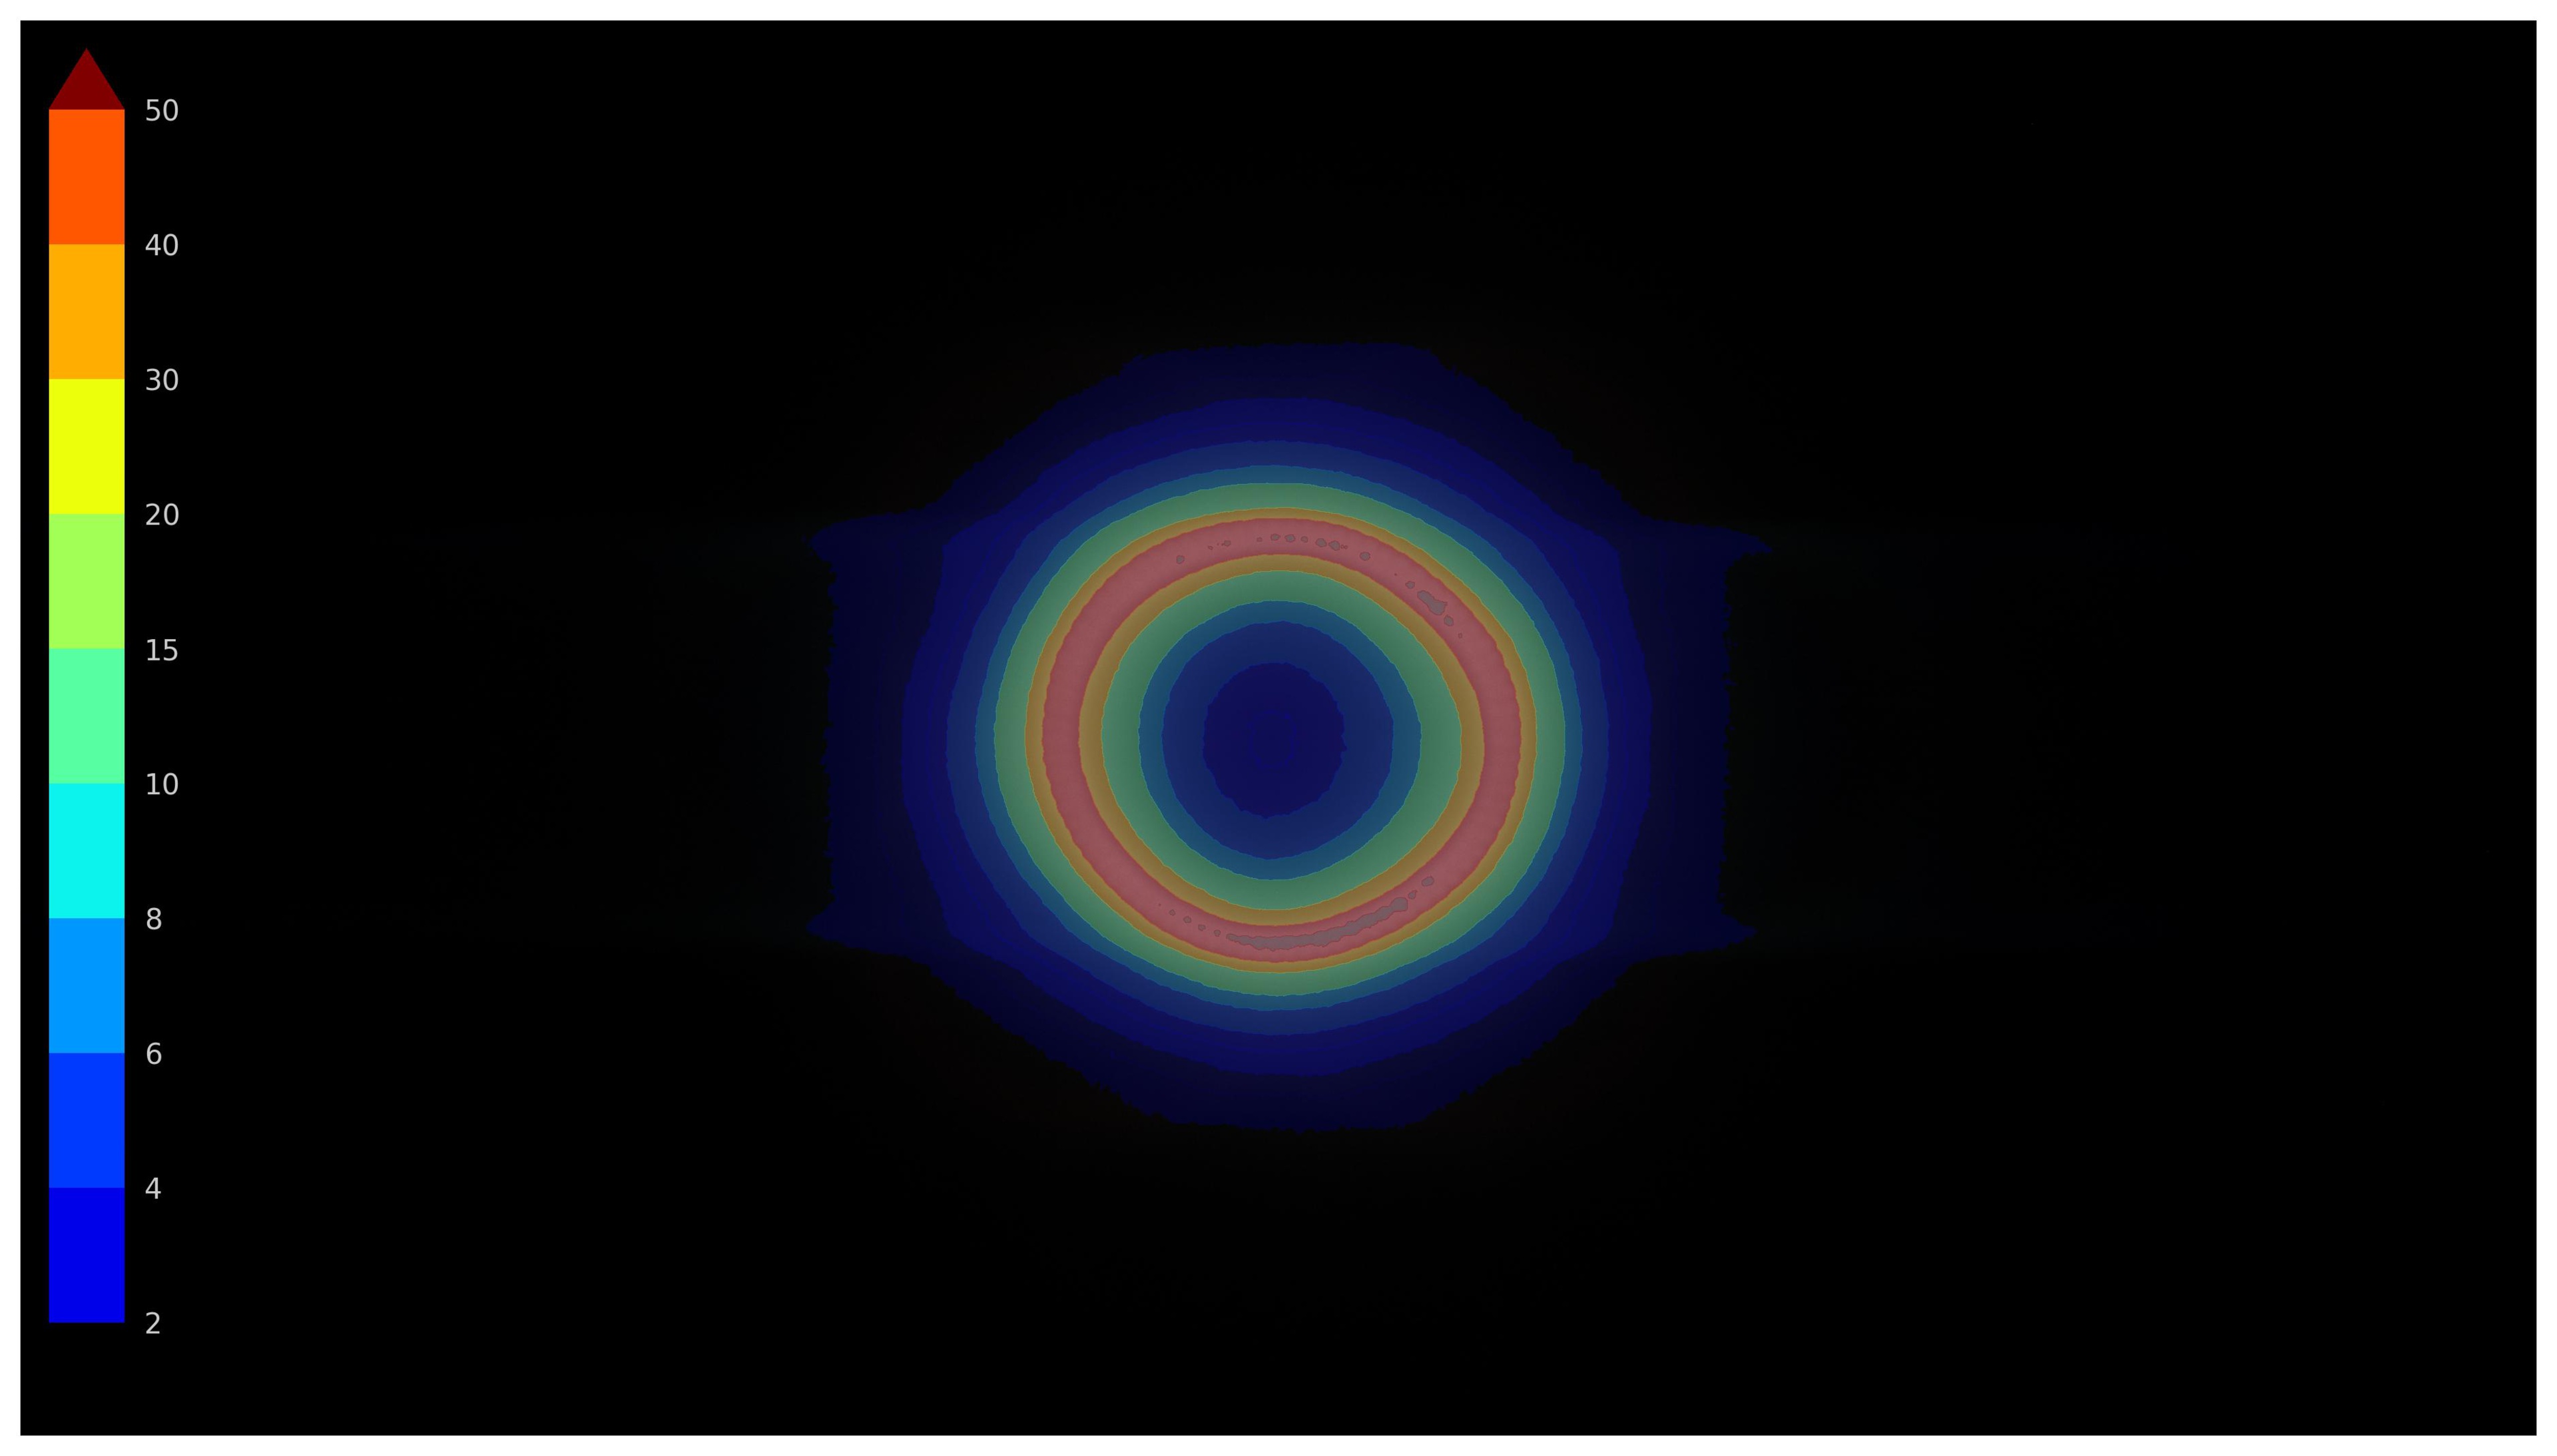

Total Reflected Light Intensity
24,823% ⋅ pixel
29,136% ⋅ pixel
Diffraction Artifacts
Yes
Yes
Ambient Color Saturation
6.6
6.8
Bright Room Color Volume Graph
Low-Luminance Colors @ 1000 lx
56.56%
59.32%
Mid-Luminance Colors @ 1000 lx
57.25%
56.66%
High-Luminance Colors @ 1000 lx
46.24%
45.53%
Panel
Viewing Angle
6.6
6.4
Viewing Angle Video
Chroma Graph


Color Washout
33°
26°
Hue Graph


Color Shift
54°
34°
Lightness Graph


Brightness Loss
39°
29°
Black Level Raise
18°
21°
Gamma Shift
16°
20°
Gray Uniformity
6.0
5.6
50% Uniformity Picture


50% Std. Dev.
4.153%
5.450%
50% DSE
0.221%
0.208%
5% Uniformity Picture


5% Std. Dev.
0.732%
0.575%
5% DSE
0.079%
0.106%
Panel Technology
Spectral Power Distribution
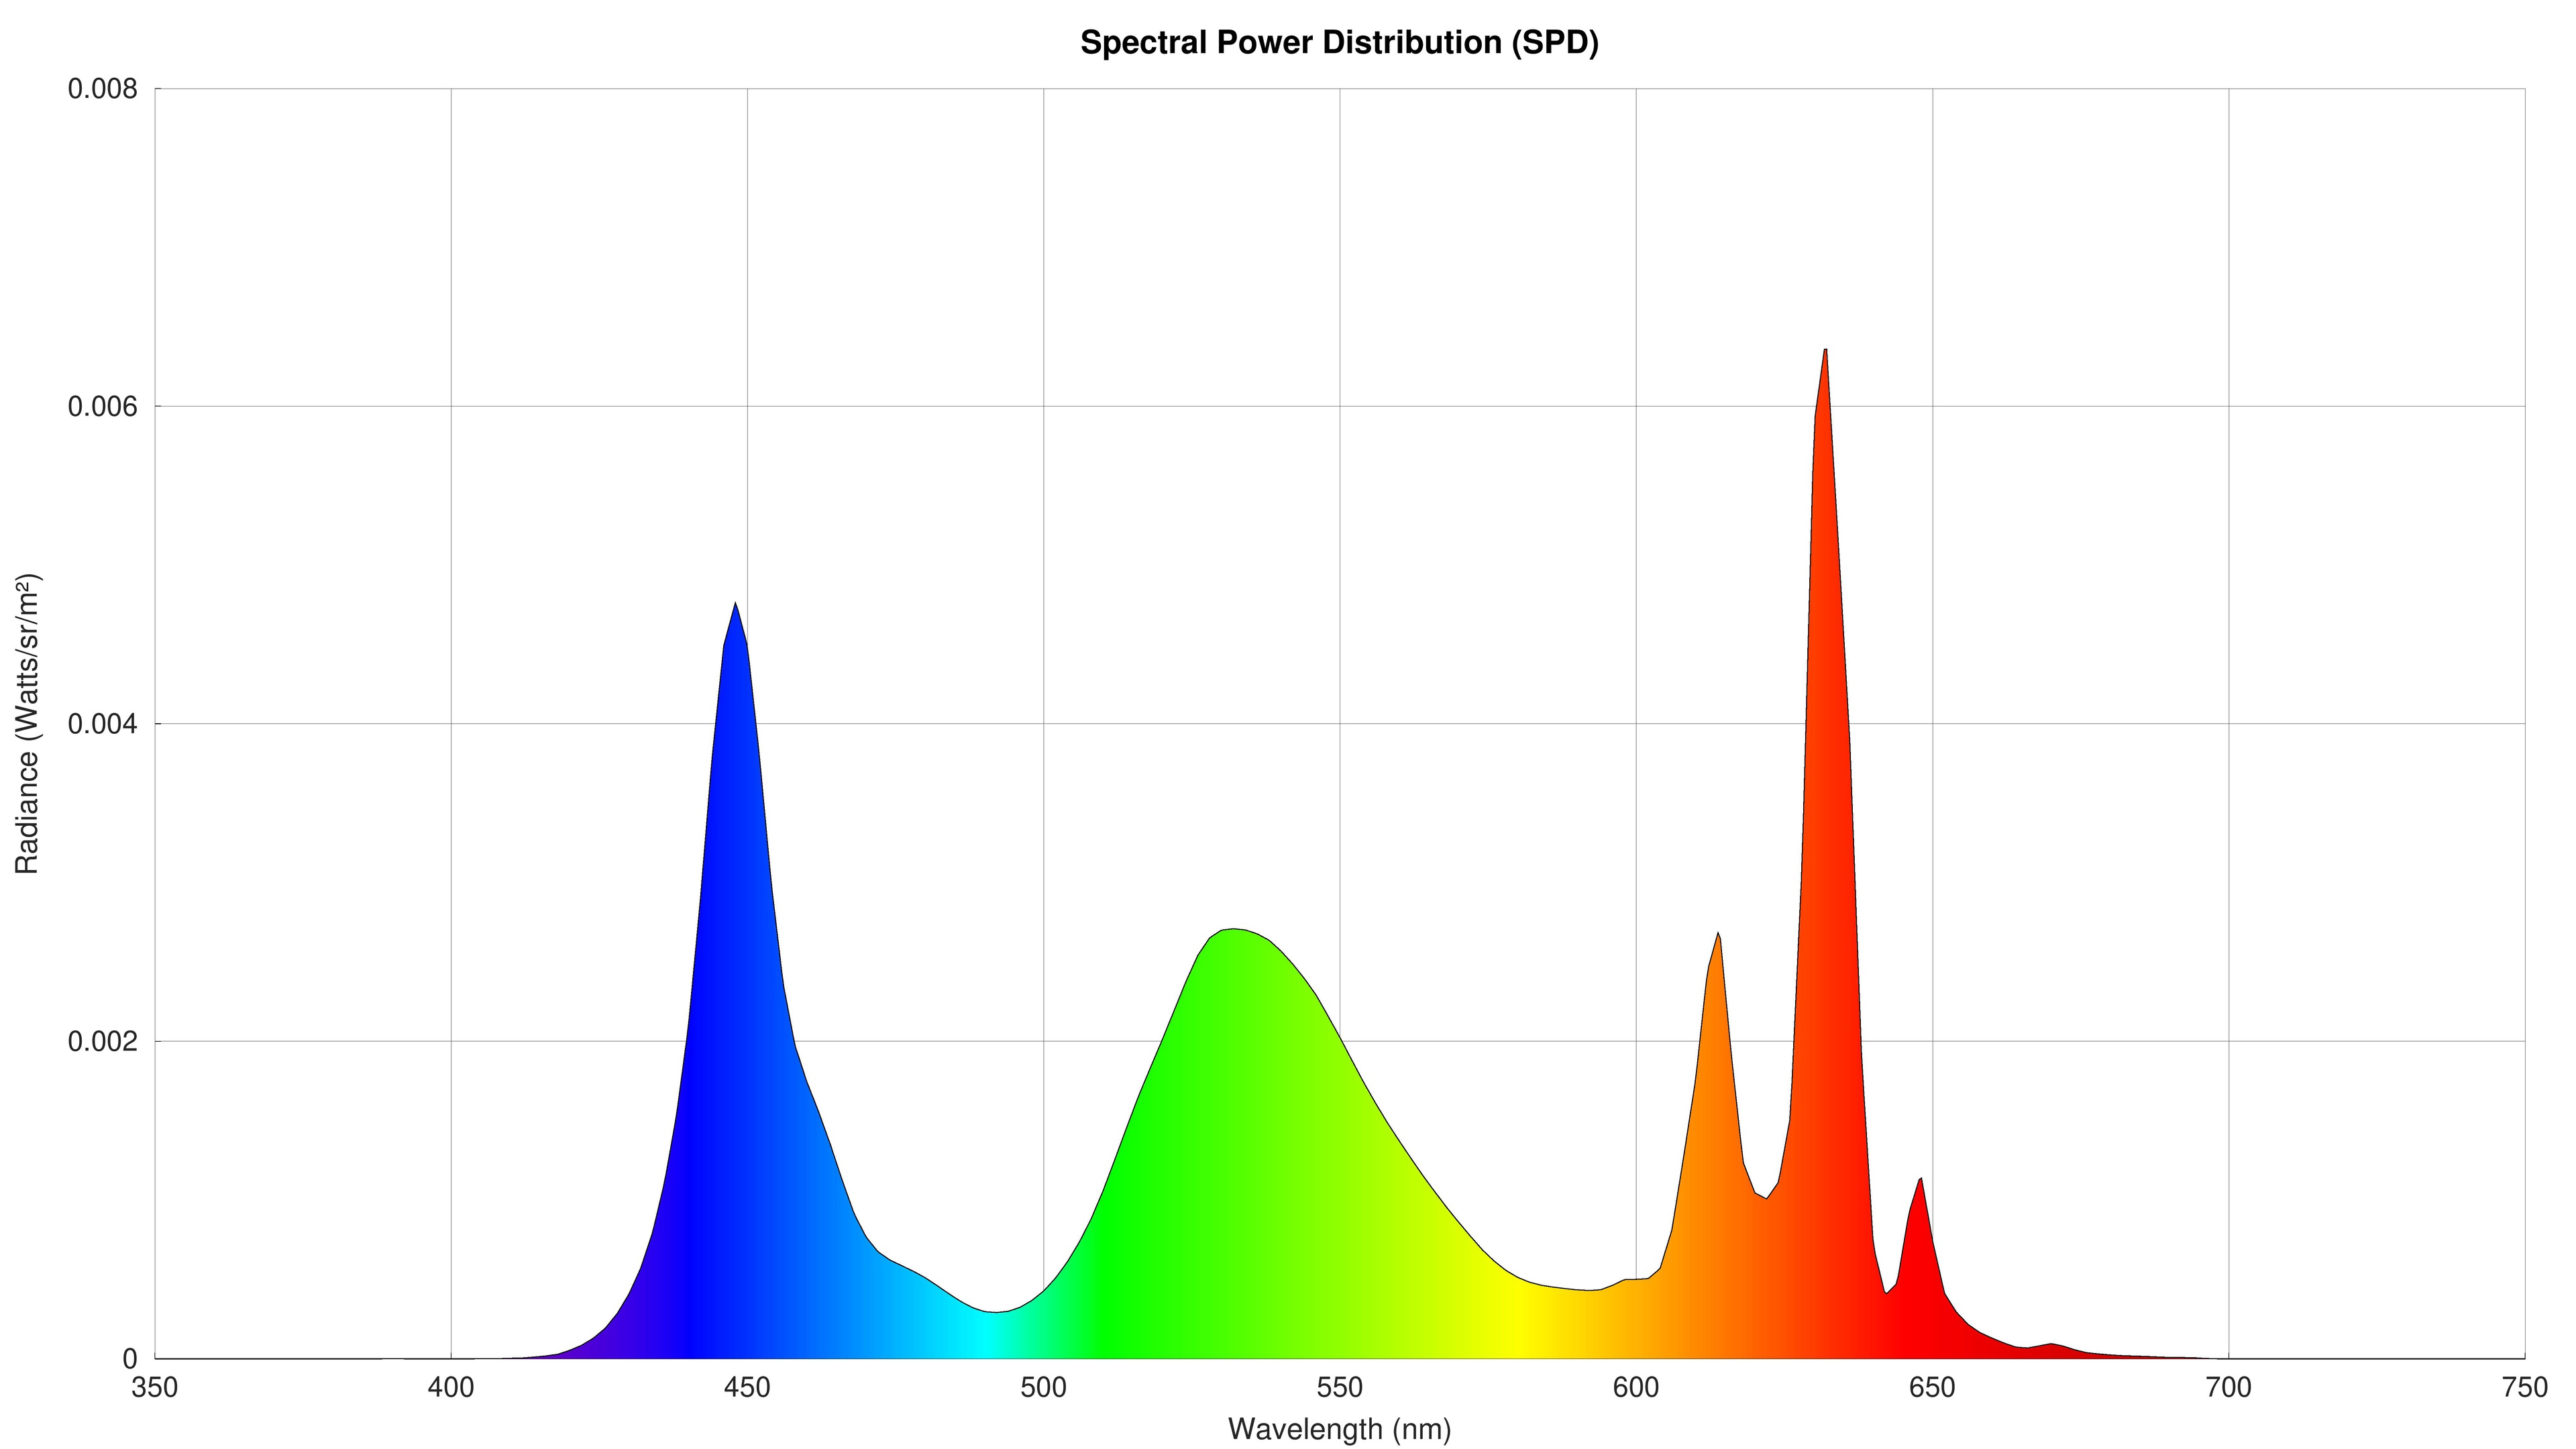

Pixels Picture
Type
LED
LED
Sub-Type
VA
VA
Subpixel Layout
BGR
BGR
Inputs
Input Specifications
Side Inputs Picture


Rear Inputs Picture


HDMI
3 (3x HDMI 2.0)
3 (3x HDMI 2.0)
HDMI 2.1 Rated Speed
No HDMI 2.1
No HDMI 2.1
ATSC Tuner
1.0
1.0
USB Ports
1
1
USB 3.0
No
No
Audio Out 3.5mm
1
1
Wi-Fi
Yes (2.4 GHz, 5 GHz)
Yes (2.4 GHz, 5 GHz)
Ethernet Speed
100 Mbps
100 Mbps
Composite In
1 (Adapter Required, Not Incl.)
1 (Adapter Required, Not Incl.)
Digital Optical Audio Out
1
1
Audio Passthrough
ARC/eARC Port
eARC
eARC
eARC: Dolby Atmos Over Dolby Digital Plus
Yes
Yes
eARC: Dolby Digital Plus 7.1
Yes
Yes
eARC: LPCM 7.1 Over Dolby MAT
Yes
Yes
eARC: Dolby TrueHD 7.1
Yes
Yes
eARC: DTS:X Over DTS-HD MA
Yes
Yes
eARC: DTS-HD Master Audio 7.1
Yes
Yes
eARC: LPCM Channels (Bitstream)
7.1
7.1
ARC: Dolby Digital 5.1
Yes
Yes
ARC: DTS 5.1
Yes
Yes
Optical: Dolby Digital 5.1
Yes
Yes
Optical: DTS 5.1
Yes
Yes
HDR Format Support
HDR10
Yes
Yes
HDR10+
Yes
Yes
Dolby Vision
Yes
Yes
HLG
Yes
Yes
Design
Style
Design Picture
Curved
No
No
Stand
Stand Picture


Back
Back Picture


Wall Mount
VESA 400x400
VESA 400x400
Borders
Borders Picture


Borders
0.33" (0.9 cm)
0.31" (0.8 cm)
Thickness
Thickness Picture


Max Thickness
2.60" (6.6 cm)
2.83" (7.2 cm)
Build Quality
7.0
7.0
Build quality picture


Smart Features
Interface
Smart TV Picture


Smart OS
Google TV
Google TV
Version
12
12
Ad-Free
0.0
0.0
Ads Picture


Ads
Yes
Yes
Opt-out
No
No
Suggested Content in Home
Yes
Yes
Opt-out of Suggested Content
No
No
Remote
Remote Picture


Voice Control
Yes
Yes
TV Controls
Controls Picture


Mute Switch
No
No
In The Box
In The Box Picture


Misc
Power Consumption
54 W
52 W
Power Consumption (Max)
188 W
191 W
Firmware
V8-R75PT01-LF1V174
V8-R75PT01-LF1V174.000660
Sound Quality
Frequency Response
6.3
6.8
Frequency Response
Low-Frequency Extension
134.54 Hz
113.14 Hz
Std. Dev. @ 70
3.96 dB
4.24 dB
Std. Dev. @ 80
4.01 dB
4.26 dB
Std. Dev. @ Max
4.52 dB
5.33 dB
Max
87.2 dB SPL
95.0 dB SPL
Dynamic Range Compression
2.53 dB
2.79 dB
Digital Room Correction
No
No
Check Price
43"
43S551G
SEE PRICE
BestBuy.com
43"
43Q651G
SEE PRICE
BestBuy.com
50"
50S551G
SEE PRICE
BestBuy.com
50"
50Q651G
SEE PRICE
BestBuy.com
55"
55S551G
SEE PRICE
BestBuy.com
55"
55Q651G
SEE PRICE
BestBuy.com
65"
65S551G
SEE PRICE
BestBuy.com
65"
65Q651G
SEE PRICE
BestBuy.com
75"
75S551G
SEE PRICE
BestBuy.com
75"
75Q651G
SEE PRICE
BestBuy.com
85"
85S551G
SEE PRICE
Amazon.com
85"
85Q651G
SEE PRICE
BestBuy.com
98"
98"
98Q651G
SEE PRICE
BestBuy.com
TCL S551G
TCL Q651G
Comments
TCL S551G vs TCL Q651G: Main Discussion
What do you think of these products? Let us know below.
Looking for a personalized buying advice from the RTINGS.com experts? Insiders have direct access to buying advice on our insider forum.
Hello! Help with personalized buying advice is something our experts offer only via our insider forums. We do have lots of self-service tools and recommendation articles that should be helpful as well though!
would the S5 be better for gaming since it has better motion clarity?
They’re on different methodologies, so the scores and most of the test results aren’t directly comparable anymore. Our text goes beyond the scoring, so it’s still valid.
review summary has Q6 as winner, but S5 is rated highest in almost every category. How can that be? What am I missing? thnaks.