Headphones Test Bench 2.2 archived this test and retired the waterfall plot visualization from our testing suite. Please see the changelog for more information.
Cumulative spectral decay (CSD) determines the acoustic properties of headphones' drivers. While a standard frequency response graph plots frequency on the x-axis and amplitude on the y-axis, a CSD graph introduces a third, important element on an additional Z-axis: decay time. This third axis allows us to see how the frequency response evolves after an audio signal stops. Some frequencies will decay quickly, while others might resonate for longer. The higher the amplitude of these resonances, the louder and more audible they will be. Loud, resonant frequencies can negatively impact headphones' listening experience.
If you want to learn more about CSD plots and how our measurements are derived, check out our R&D article for a more detailed explanation.
Our Tests
As with our other sound tests, we use a Brüel & Kjær HATS Type 5128-B (B&K) measurement rig in a room with low ambient noise and minimal sound treatment. Our measurements are derived from an impulse response captured during our frequency response measurement with our Audio Precision APx517b Acoustic Analyzer. We use the following test settings within Audio Precision to collect our results:
- Window type: Hann
- Time window: 10.67ms
- High-pass filter: 500Hz
Choosing a window time allows us to isolate a particular time region of interest within the impulse. It's worth noting that our window time is longer than what you might find with other CSD measurements online, as it amounts to 512 samples at a 48kHz sample rate. The longer time window means that the measurements we collect won't be directly comparable to those taken by others using different time windows or test settings. Crucially, though, it allows us to test Bluetooth headphones, as well as traditional analog headphones with the same methodology. In the case of some wireless headphones with dongle-type USB transmitters, we'll opt for a longer window time, as the impulse has a delay. However, we still apply a constant 10.67ms after the highest peak to ensure consistency.
We opt for a 500Hz high-pass filter so we can focus on resonant frequencies that are reflective of structural and acoustic properties of the headphones themselves. Longer wavelength frequencies will always take much longer to decay and thus fall outside of our observation window.
Unlike some of our other tests, this test isn't scored, as it can be challenging to compare results between headphones. CSD graphs are best utilized as visualization tools or supplementary data to accompany other measurements like frequency response and distortion. It's impossible to extrapolate one single metric that can allow headphones to be ranked. In some cases, problematic resonances are audible and reflected in other tests, like Frequency Response.
When It Matters
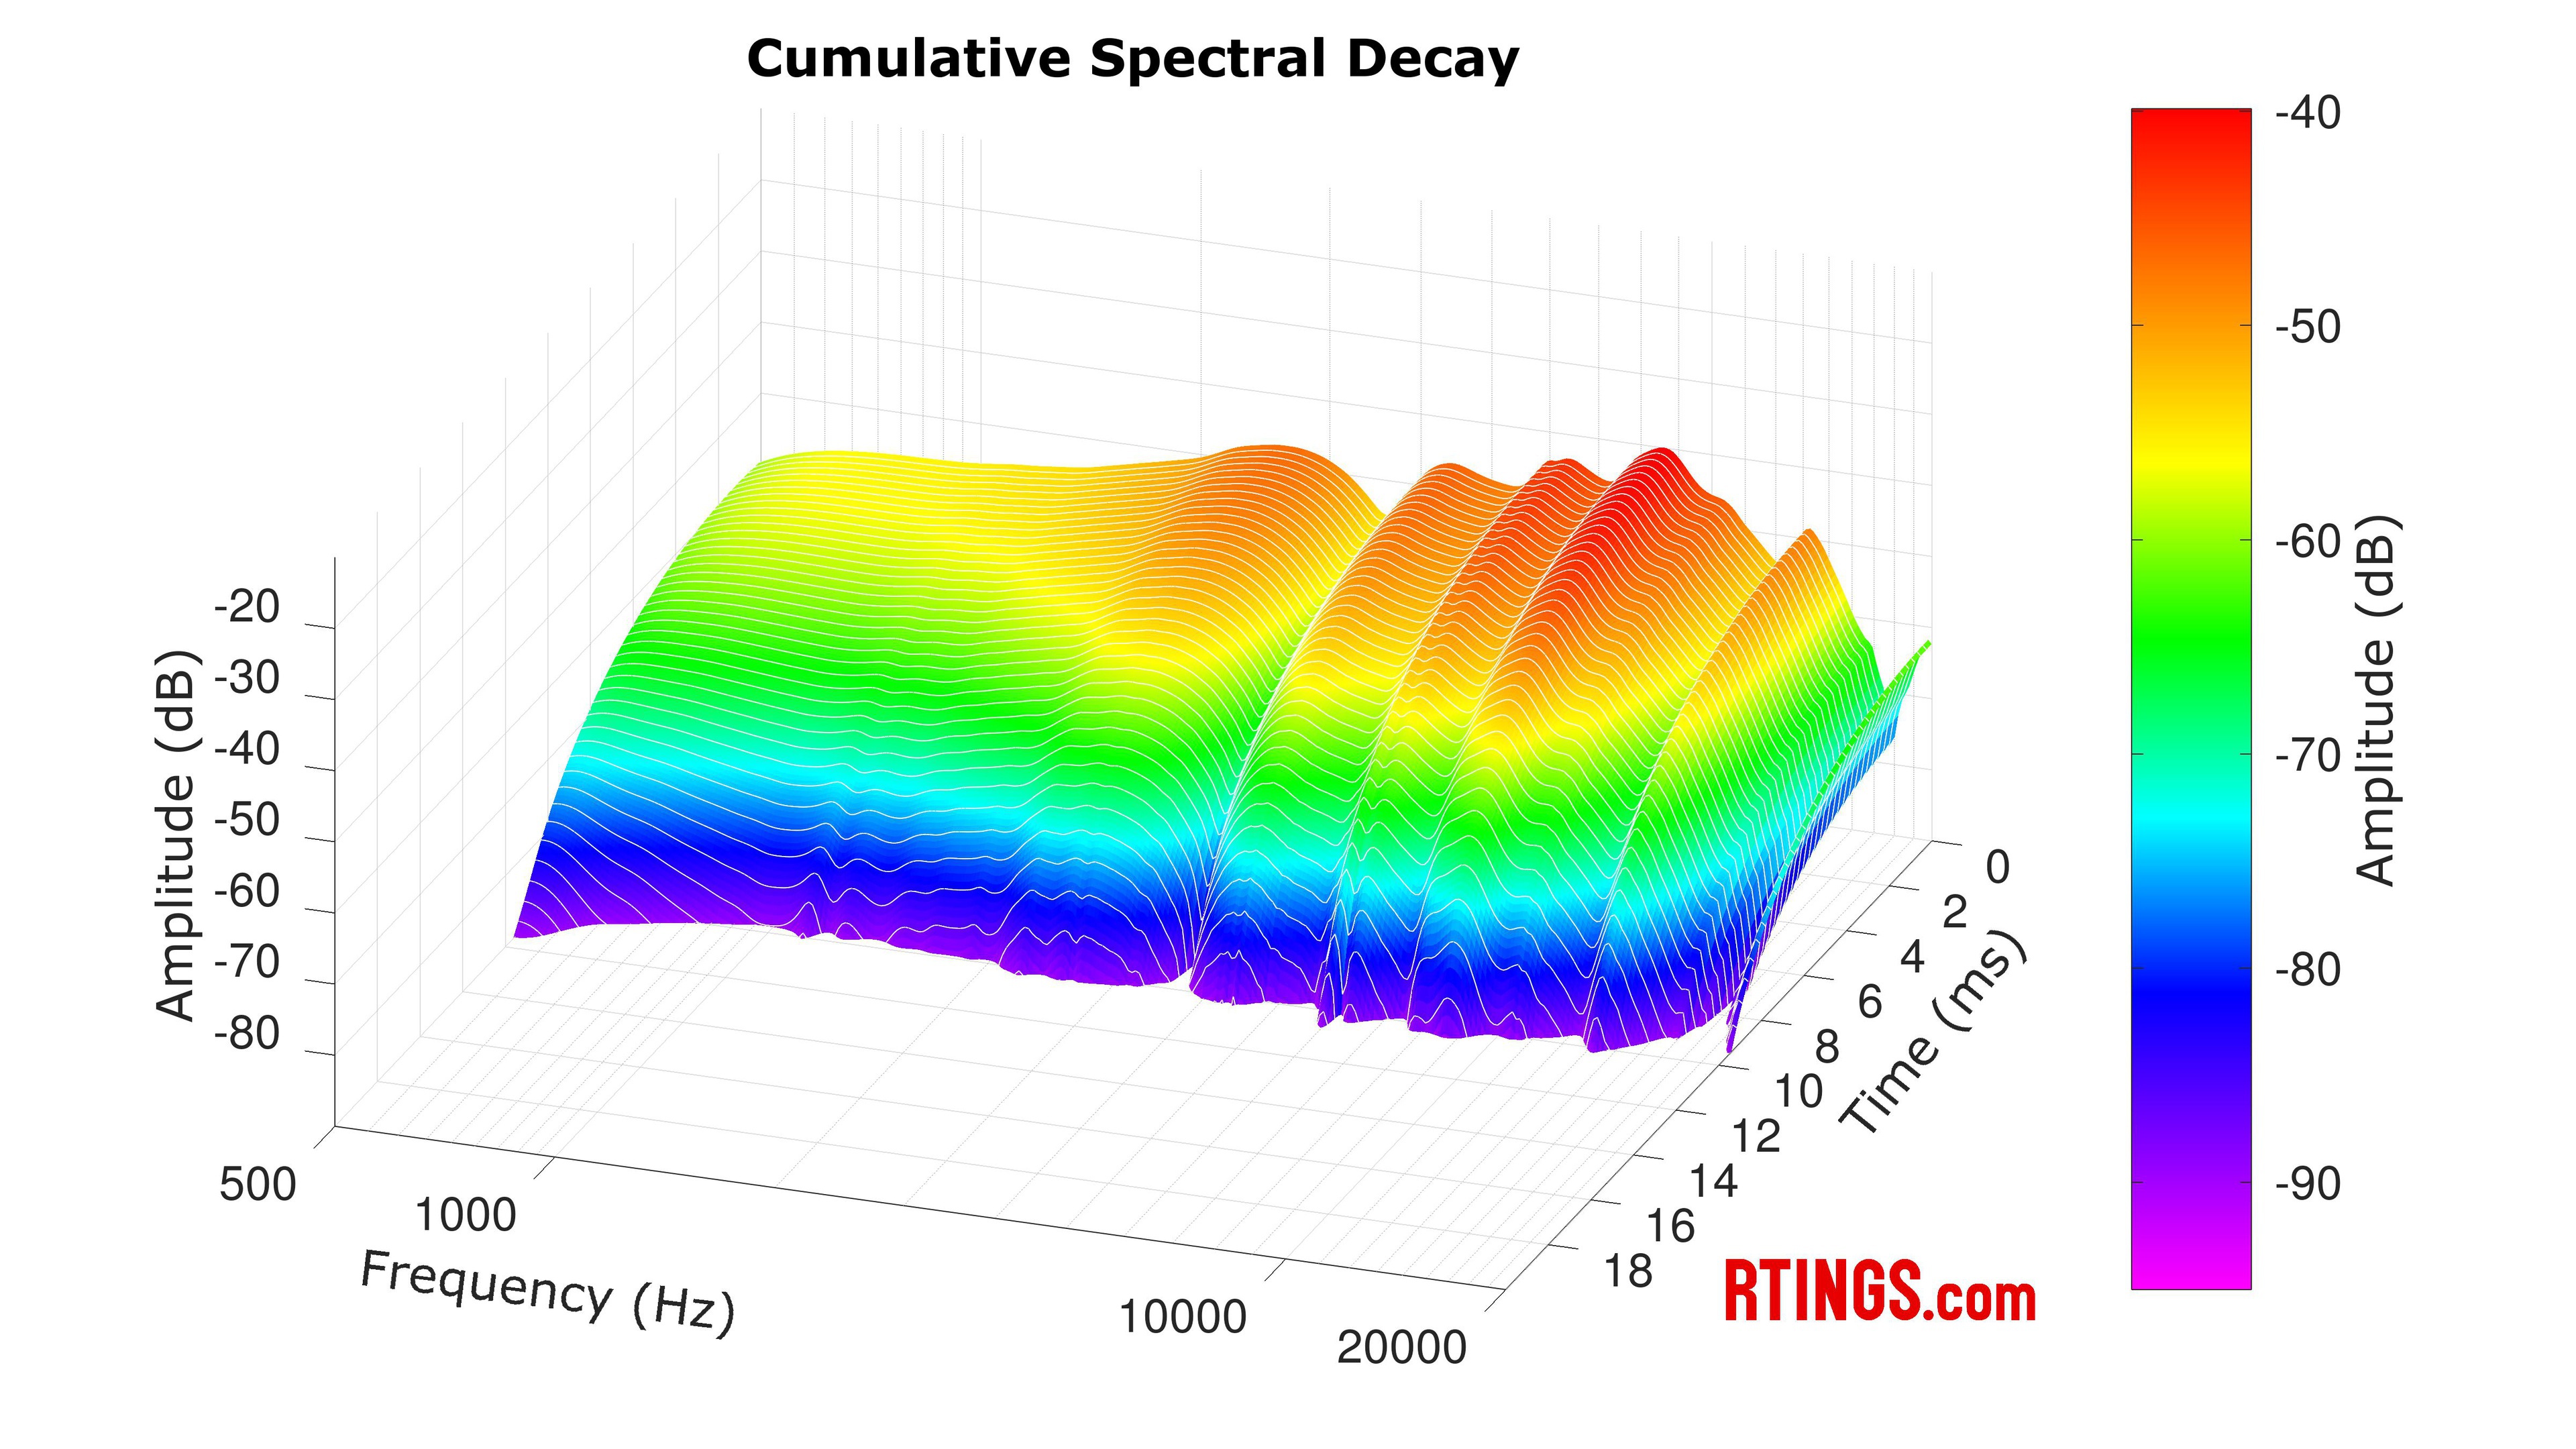
Interpreting the CSD graph can give us insight into which frequencies might cause undesirable resonances, which are often audible as ringing sounds. The data is presented as a three-dimensional waterfall plot. Typically, resonances with longer decay times will display as 'ridges' within the graph, that jut out from the back towards the front. If a driver were to exhibit flawless acoustic properties, with no lasting resonances, we would see this as a flat face, parallel to the back of the x-axis. The Beyerdynamic DT 770 PRO are a good example of this, with no discernible peaks in their CSD graph.
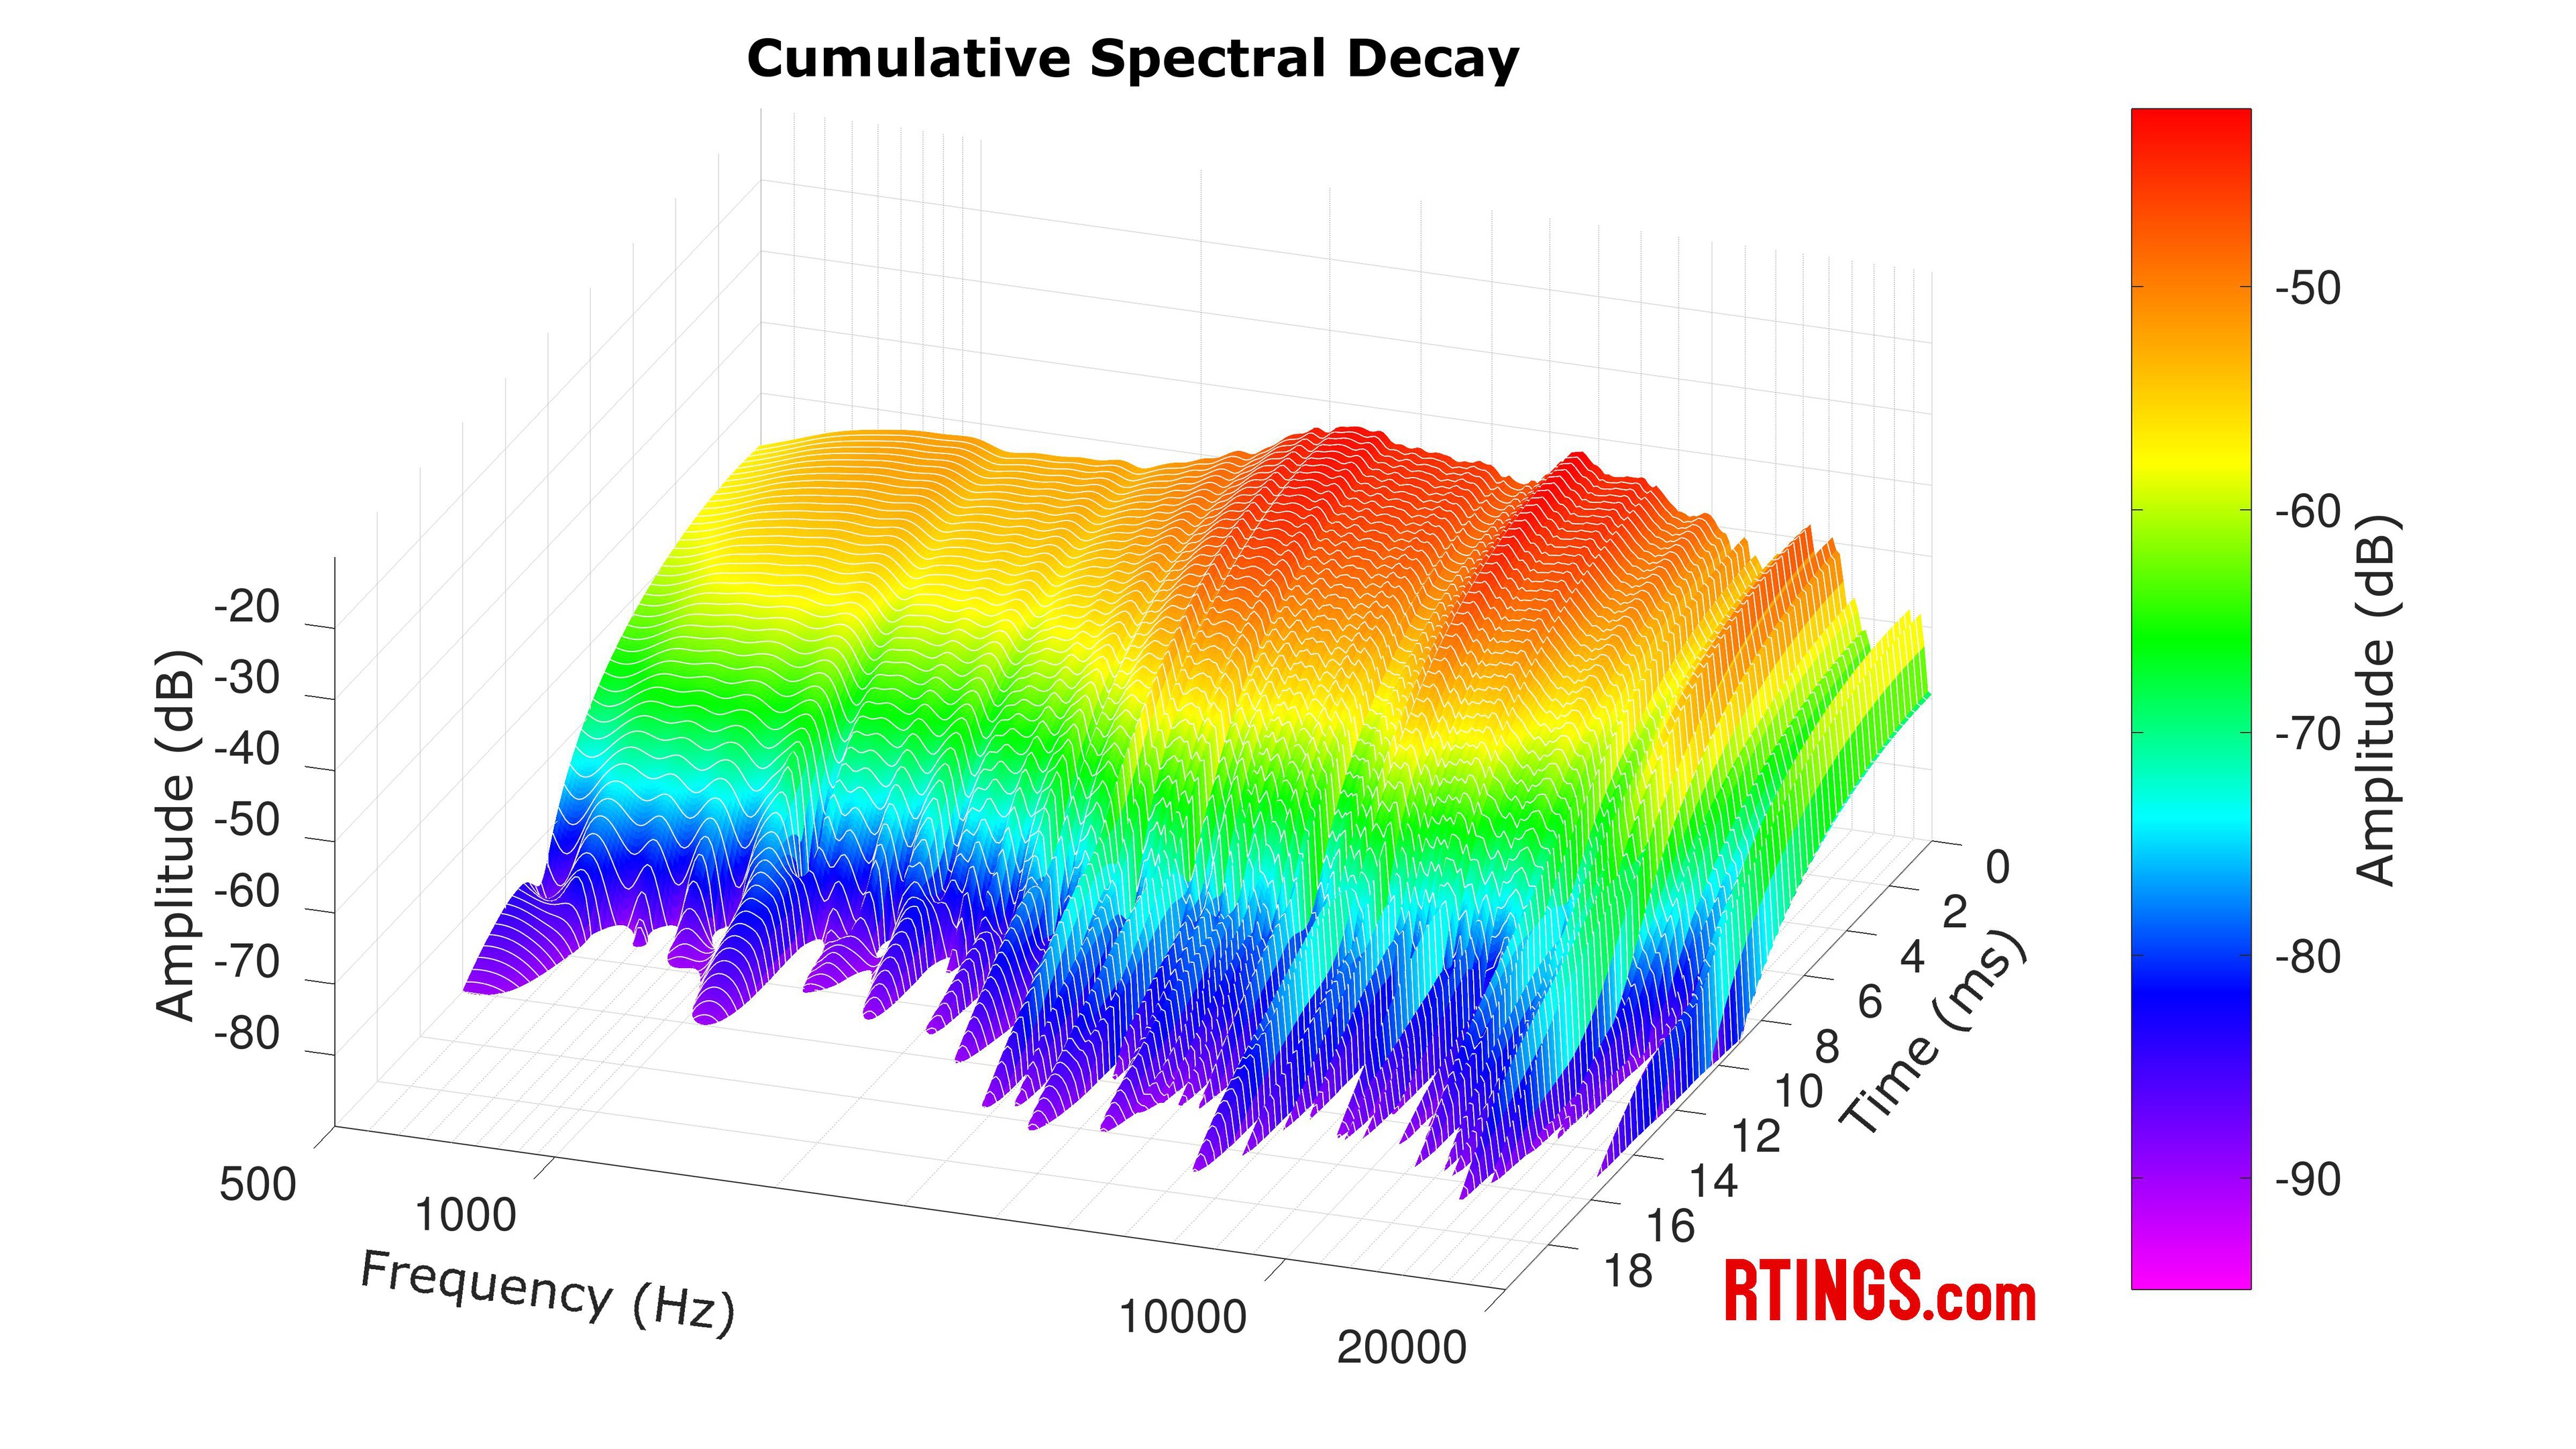
That said, most headphones will fall between the two extremes, as instances of ringing that are discernible to most listeners (not just astute audiophiles) are quite rare. CSD measurements are also likely to vary somewhat between different units, so our results won't be representative of every unit that comes off the production line. In the following example, we can see that the HiFiMan Sundara 2020's driver has some problematic resonance frequencies in the treble range that are audible as ringing sounds.
CSD is just one measurement that can help evaluate headphones' acoustic qualities. When viewed in conjunction with other key measurements, like frequency response and harmonic distortion, a clearer picture emerges of headphones' performance.