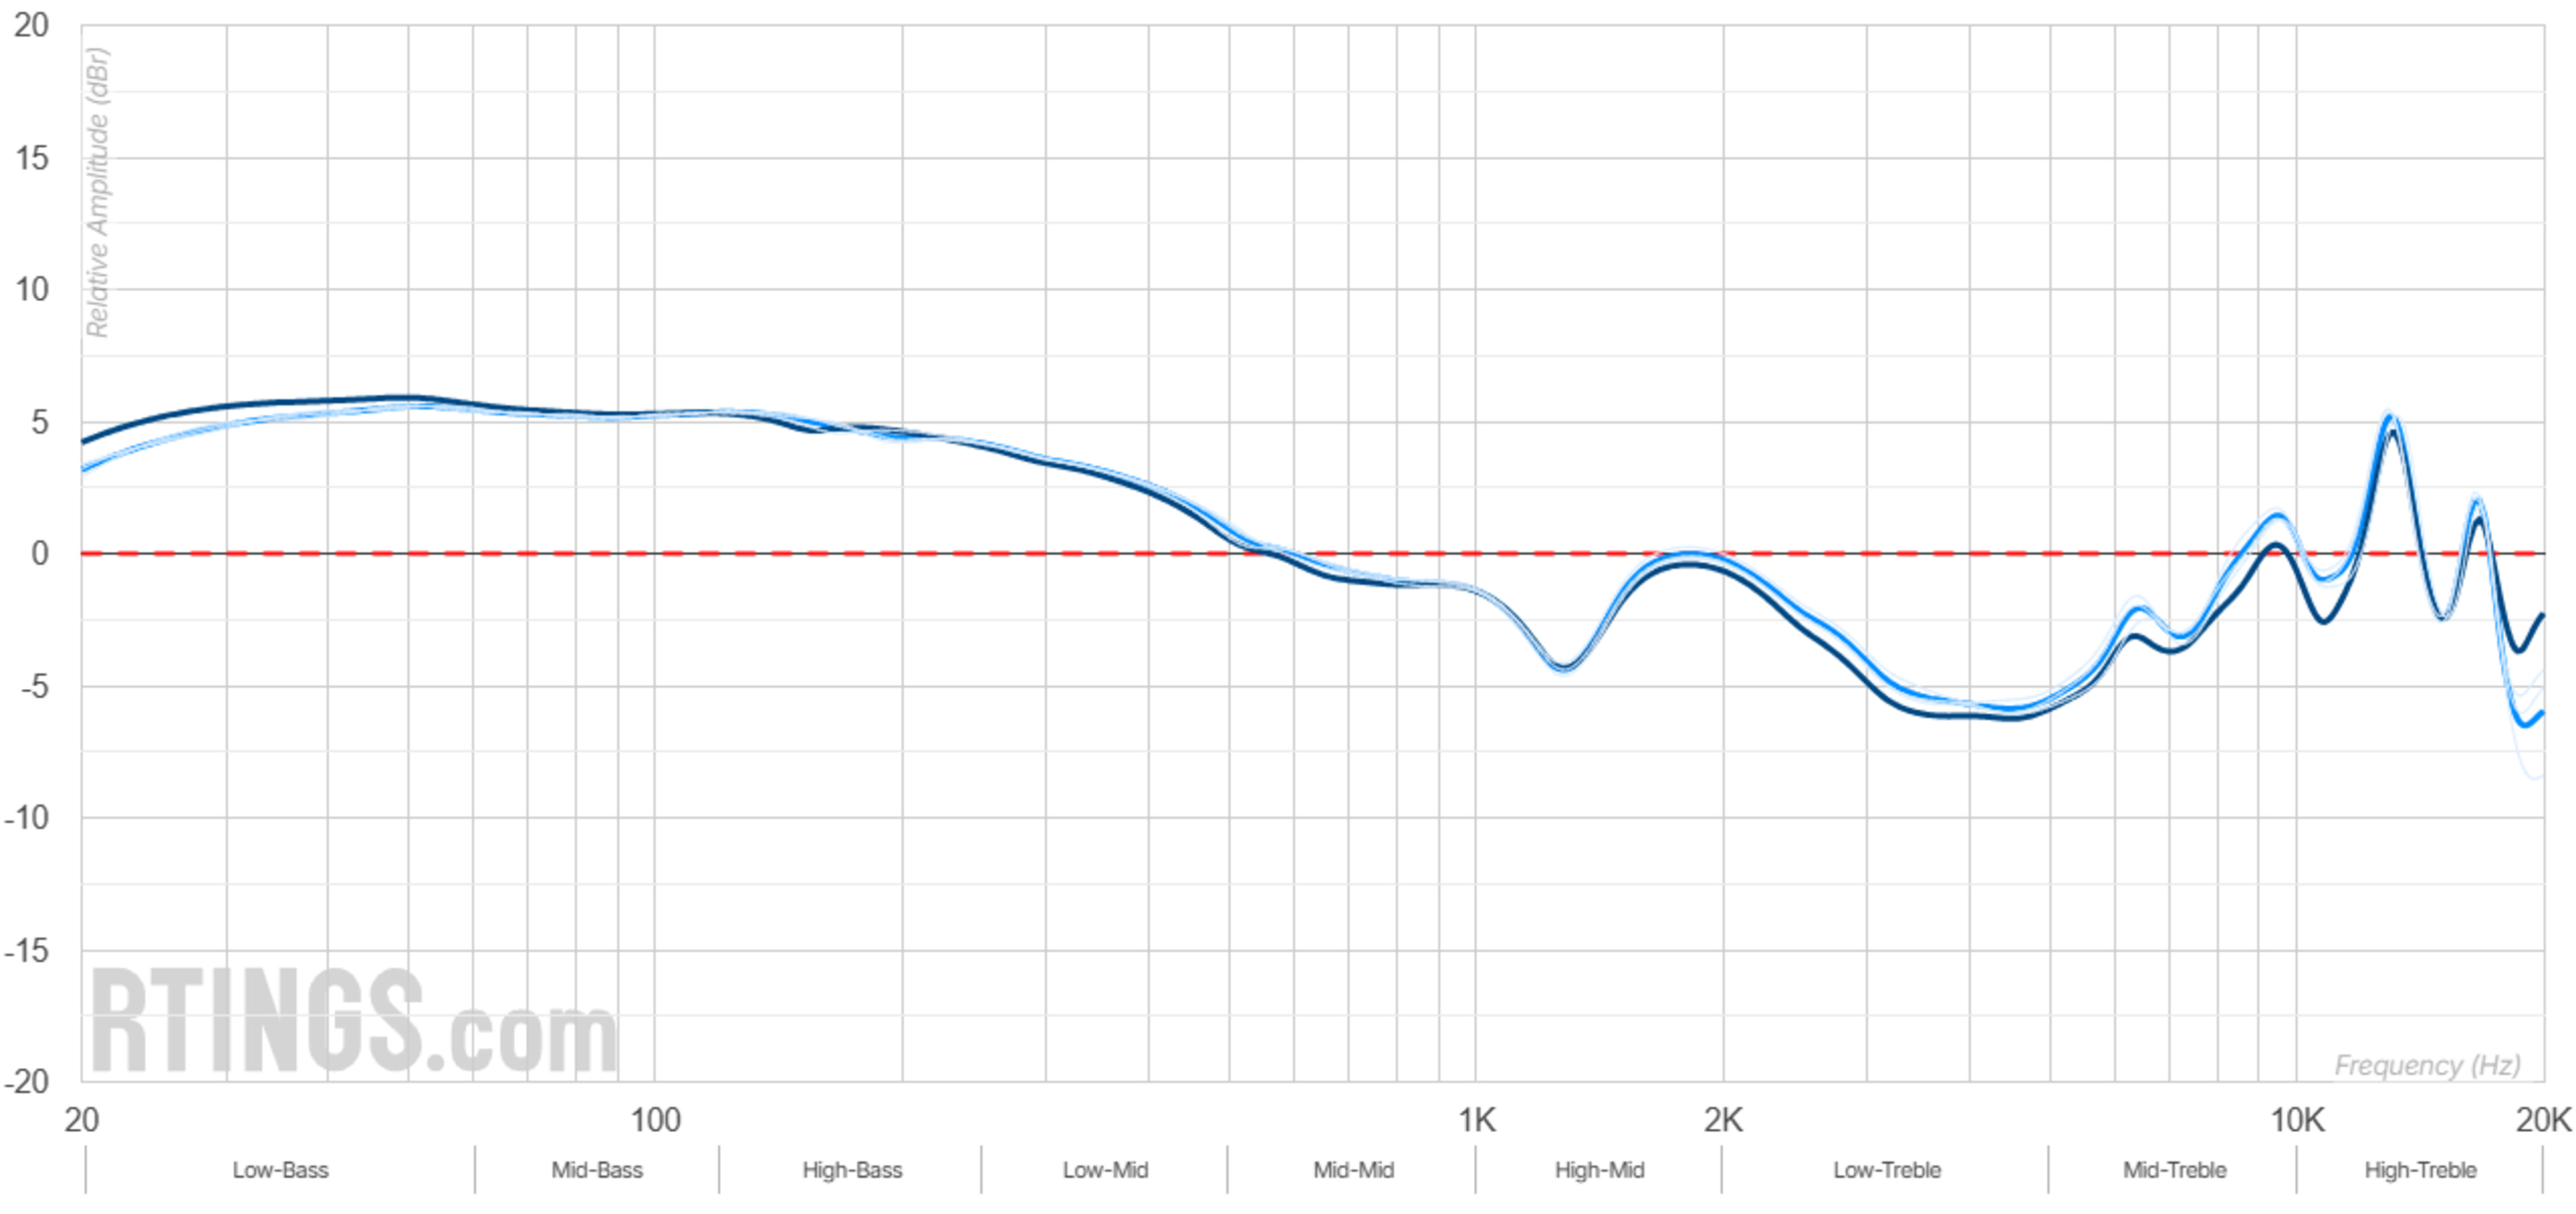
Our Peaks/Dips test measures how much a pair of headphones' frequency response deviates from the Sound Profile. In simple terms, this metric captures how smooth or uneven the model's output is relative to its own tuning, rather than any specific target curve. A very smooth frequency response would have no sudden spikes (peaks) or drop-offs (dips) at any frequency, regardless of the headphones' overall tonality. It's easy to spot these small-scale irregularities on our graph: they appear as little 'wiggles' in the headphones' frequency response curve. In practice, all headphones have some variation, but the fewer and smaller the peaks and dips, the more natural and consistent the sound.
Test results
What Is the Peaks and Dips Measurement?
Our Peaks and Dips test looks at how smooth a pair of headphones' frequency response is. We're not measuring how closely the response matches a target curve, but how smoothly it follows its own tuning. Some headphones might be bass-heavy or treble-leaning by design, and that's fine. Here, we're evaluating whether that tuning is consistent and controlled, or if it's full of small peaks and dips that make the sound uneven.
To figure that out, we first smooth the headphones' raw frequency response into a gentler curve via normalization, which we call the sound profile. This profile gives us a big-picture view of the headphones' overall tonal balance, like warm, flat, or V-shaped. We then flatten that curve and measure how much the actual response deviates above or below it. Those deviations are the peaks (sharp boosts) and dips (sharp drop-offs). A peak might make vocals or cymbals sound harsh or shouty, while a dip could bury a guitar or make a snare drum feel dull.
Most headphones strive to have as few peaks and dips as possible, with only small, smooth variations in their frequency response, because most listeners prefer a smoother experience.
 |
 |
How do peaks and dips relate to our target curve?
This measurement is independent of any target curve. That means we're not judging how closely headphones follow our preferred tuning; we're just looking at how smooth their response is relative to itself. It's a great companion to our Frequency Response and Bass, Mid-Range, and Treble Compliance tests, which compare the headphones' output to our target curve. Those tests tell you whether headphones are bass-heavy, mid-forward, or treble-shy compared to what we think sounds best. But Peaks/Dips answers a different question: is the headphones' sound consistent, or is it full of small boosts and drop-offs that might color the sound?
Headphones can score really well on target compliance, nailing the average bass, mids, and treble, but still get flagged here if the response is jagged. That might mean they're well-tuned overall, but still have, for example, a piercing frequency or two in the mid-treble region. On the flip side, a pair of headphones might stray quite a bit from our target curve but still have a very smooth response. In that case, they might still sound great because nothing jumps out in a distracting way. By scoring both aspects, we aim to give credit to headphones that offer a smooth listening experience and avoid unfairly penalizing good models that simply take a different tuning approach.
 |
 |
Why Does a Smooth Frequency Response Matter for Sound Quality?
In simple terms, a smooth frequency response means the headphones aren't adding a strong sonic 'character' of their own to the audio, like a honky mid-range or boomy bass. When headphones have a noticeable spike in the upper mids or lower treble, for example, certain vocal notes can suddenly sound sharp or piercing just because they land on that frequency. When the singer hits a different note, it might sound fine again. That inconsistency isn't in the music: it's coming from the headphones. Essentially, peaks and dips are colorations that prevent headphones from reproducing the audio accurately.
Years of acoustic research and blind listening tests have shown that listeners generally prefer headphones (and speakers) with a flatter, smoother frequency response. Dr. Sean Olive (formerly of Harman International) demonstrated that both trained and untrained listeners tend to agree on what sounds 'good,' and a big part of that is a neutral spectral balance without glaring peaks or dips. The best headphones have a neutral, even spectral balance with low coloration, while lower-rated models have clear response irregularities that listeners tend to describe as 'dull,' 'colored,' or 'boomy,' due to certain frequency ranges being too recessed or too boosted.
A word on quality control
While not part of our Build Quality test, the Peaks and Dips score can also help identify engineering and design quality. High-end headphones typically use better drivers, tighter tolerances, and more careful acoustic tuning to keep unwanted resonances under control. If you see a flat Peaks and Dips plot, it usually means the headphones have well-damped drivers and clean internal acoustics. On the other hand, cheaper or less refined models might show a jagged response due to things like cone breakup, poor damping, or uncontrolled reflections in the ear cups. Often, poor performance in this test is the result of imperfect control across parts of the frequency range. A common issue is a sharp spike around 5–6kHz that can make cymbals and 'S' sounds harsh or fatiguing. That's exactly the kind of issue the Peaks and Dips test is designed to highlight. You might also visually see differences in the responses of the left and right drivers on the Peaks/Dips graph, but those are assessed as part of another test...
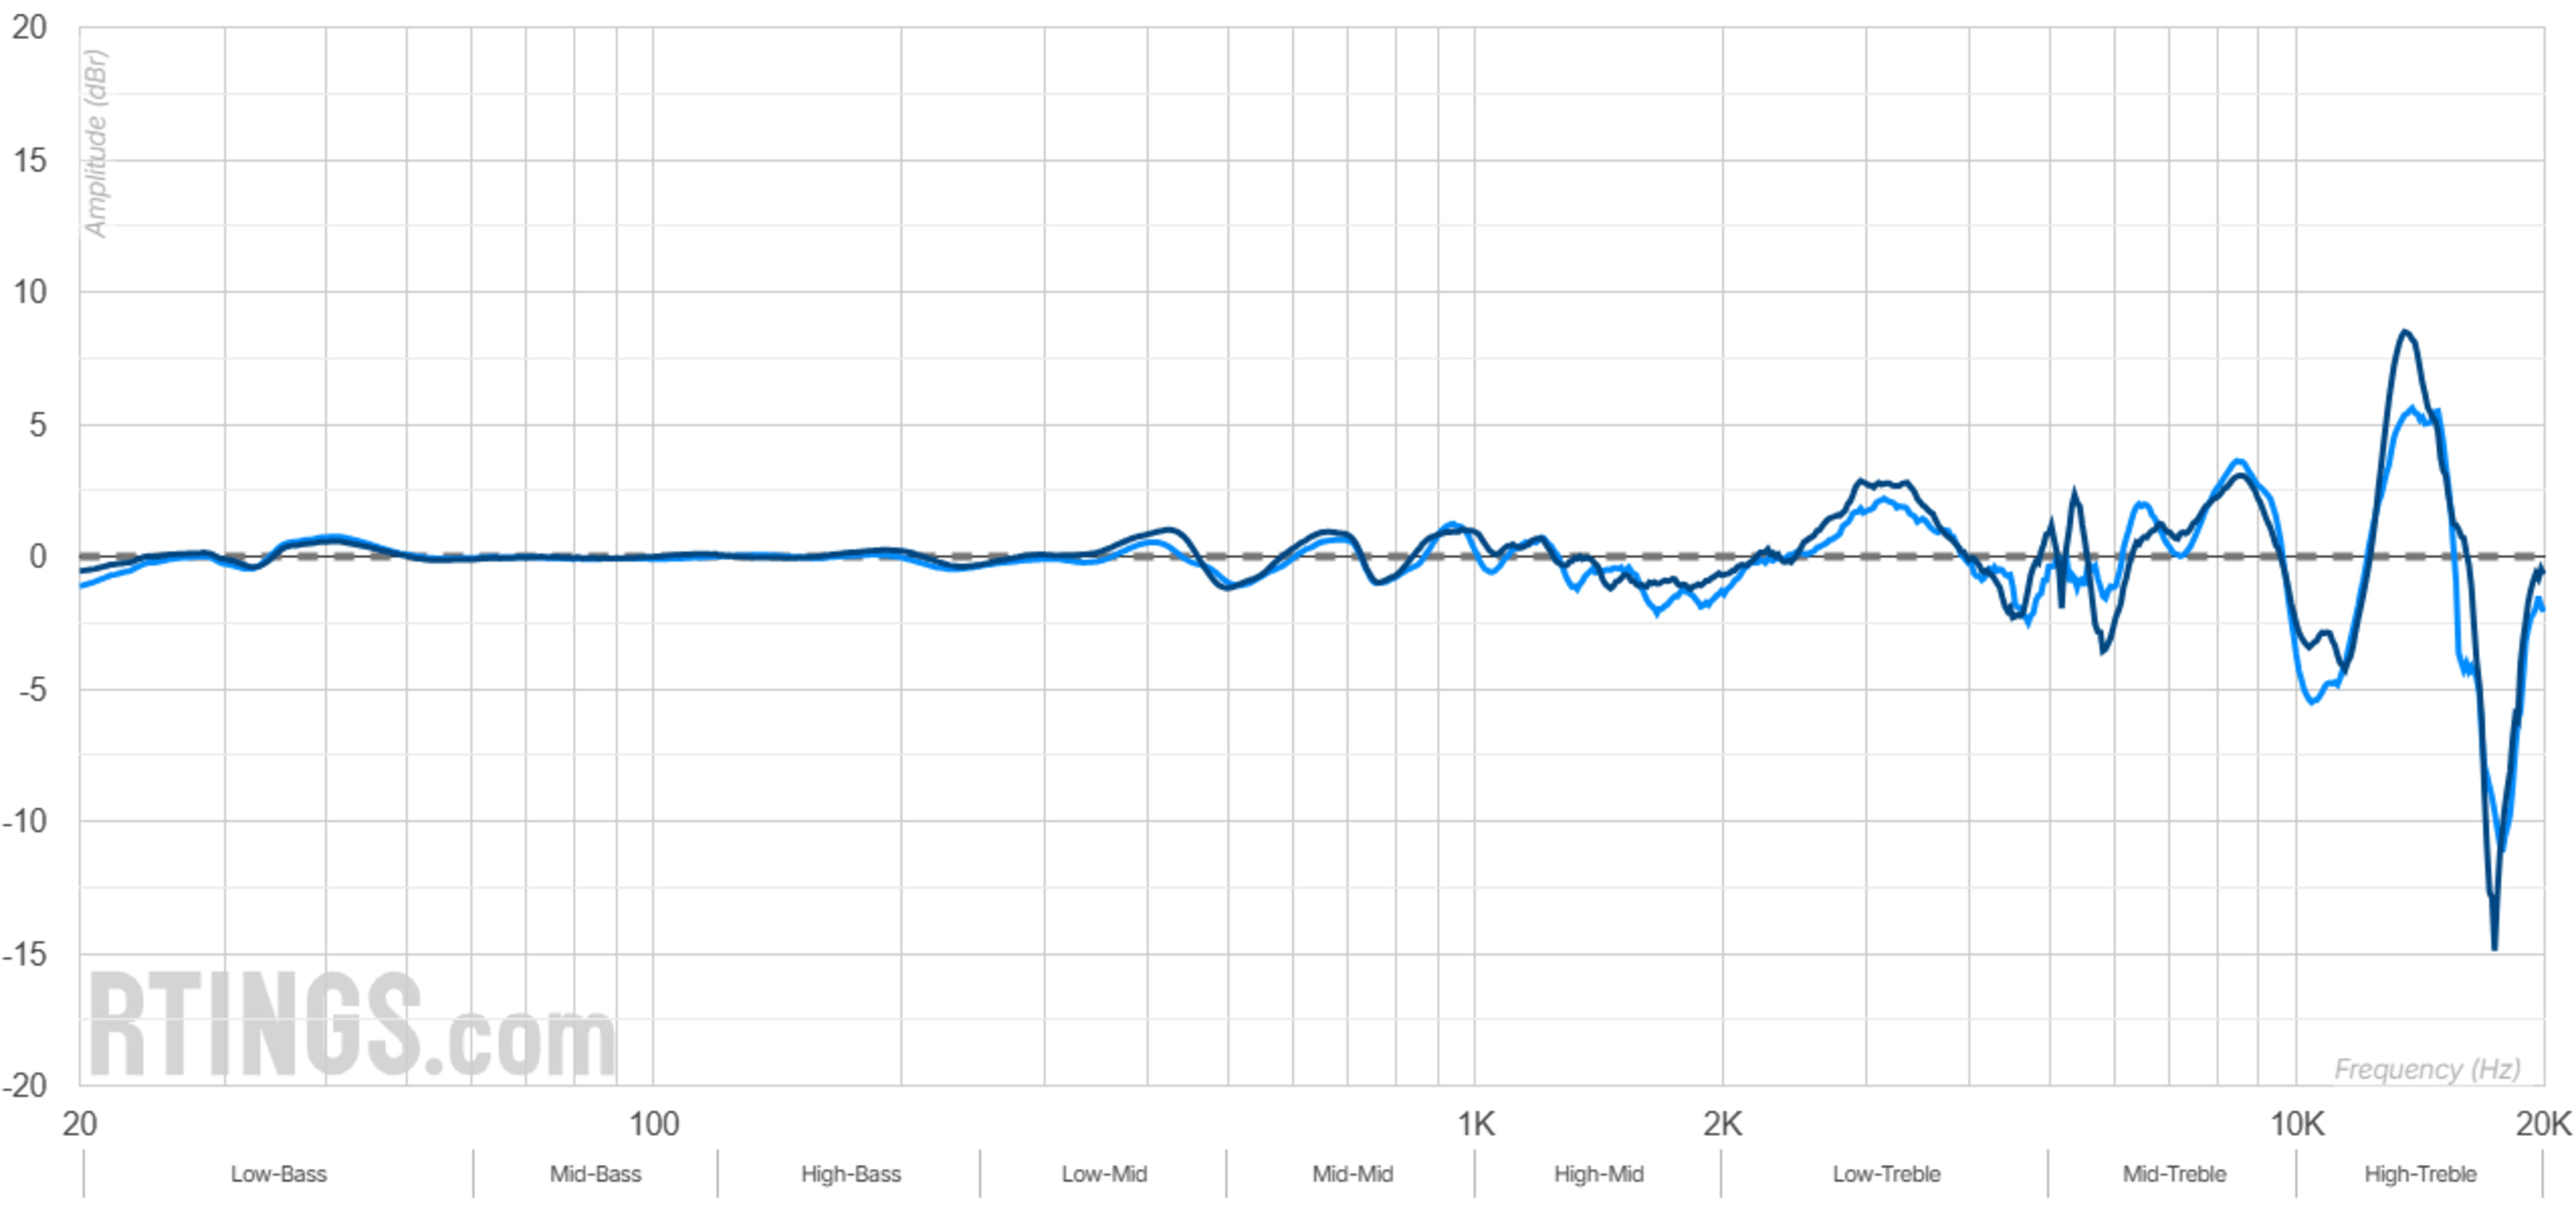
Stereo Mismatch
Big differences between the left and right ear cups aren't part of the Peaks and Dips score: they're handled by our Stereo Mismatch test. That measurement looks at how closely the two channels match. If one side of the headphones shows a big spike or dip that the other doesn't, it usually points to a driver imbalance or a quality control issue. You can visually see the differences between the left and right drivers on the Peaks/Dips graph, but those differences are only scored in the Stereo Mismatch test.
Frequency Response Consistency
We also separate out changes that come from how the headphones sit on your head. That's what Frequency Response Consistency (FRC) is for. Headphones sound different on different people because of the way they interact with the wearer's personal characteristics, like the size of their head or whether they wear glasses. That variation is reflected in the FRC score. If our Peaks/Dips test measures irregularities in the frequency response itself, FRC measures the way that the perceived frequency response changes across different seatings and different people.
How We Measure Peaks and Dips
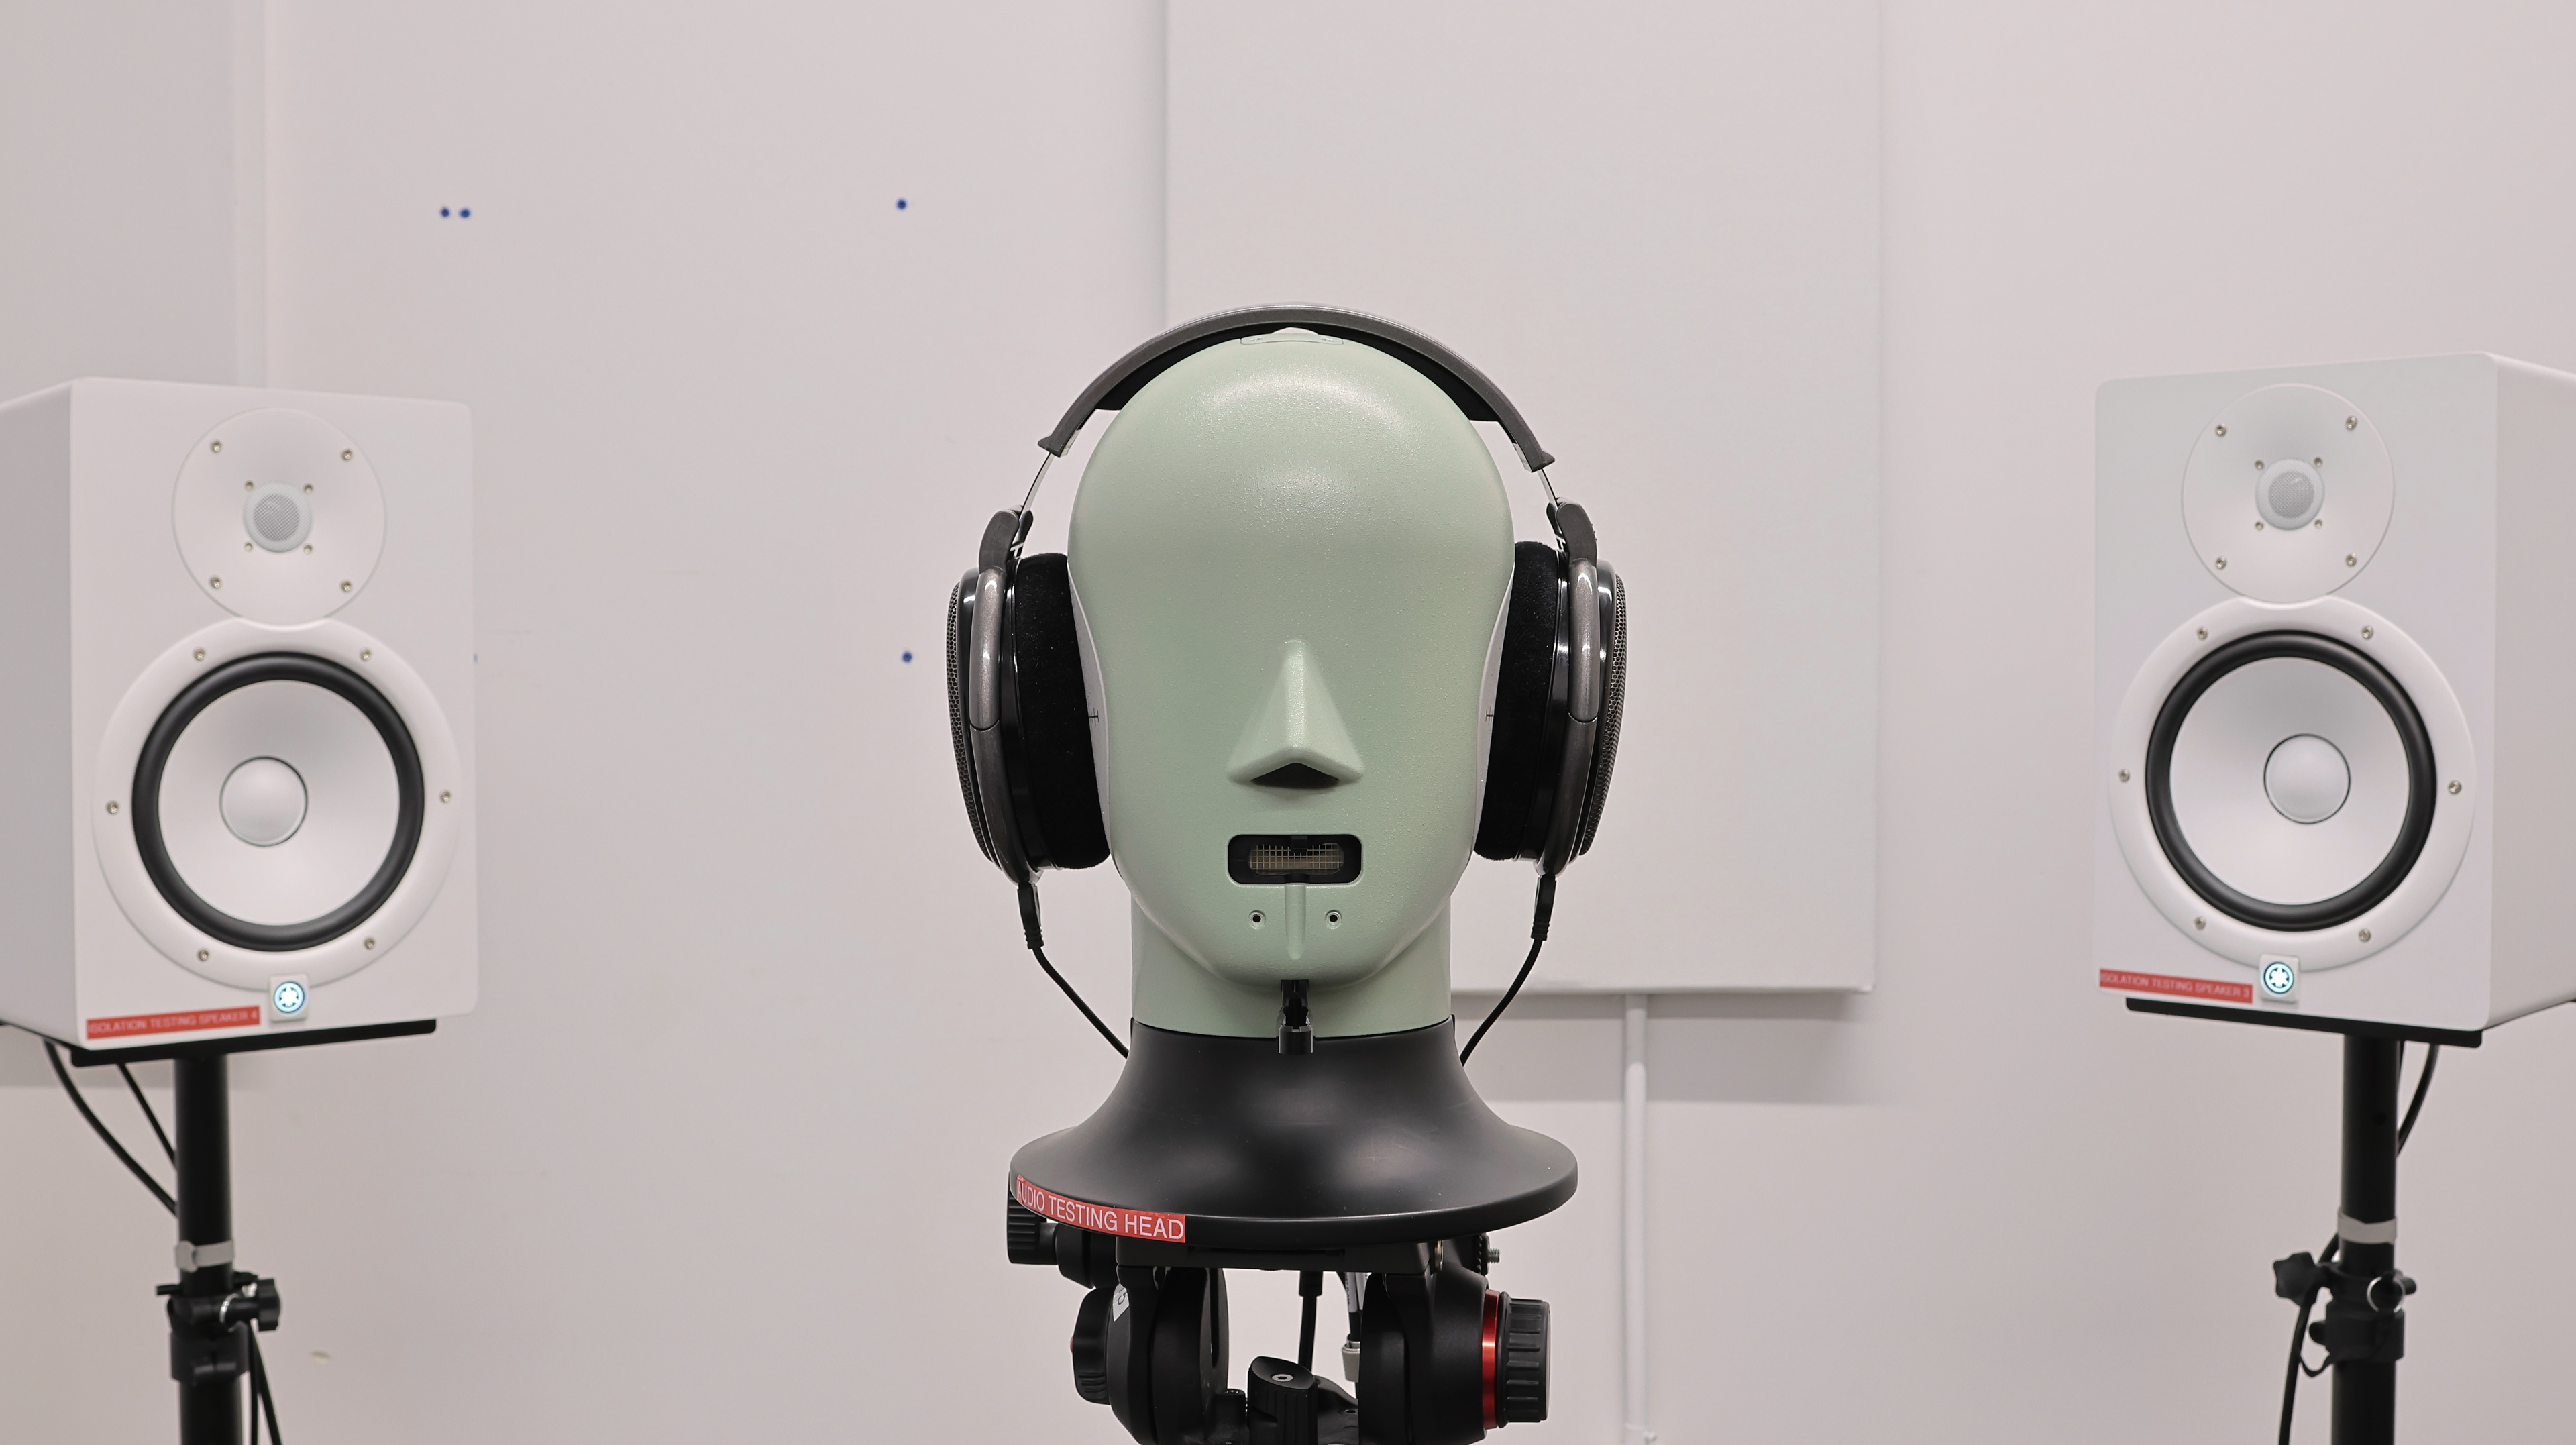
With the launch of our Headphones Test Bench 2.0, we updated our approach to measuring Sound Profile to better align with current measurement standards. To assess Peaks and Dips, we start by capturing the headphones' raw frequency response using our Brüel & Kjær 5128-B head and torso simulator and Audio Precision APx517B analyzer in a controlled, low-noise environment. A calibrated 94 dB SPL 20Hz–20kHz sweep is played through the headphones, captured by microphones in the ear simulators, and fed back into the Audio Precision software to measure and analyze the headphones' acoustic performance. This raw response shows how loud the headphones are at each frequency when reproducing a series of test tones. From there, we apply heavy smoothing to generate what we call a Sound Signature: a single curve that reflects the headphones' overall tonal balance. We give different Sound Signatures descriptive names based on their shape, like Flat, Balanced, or Bass-Heavy. If you know you prefer a specific tuning style, this is a great starting point when deciding whether a pair of headphones suits your taste.
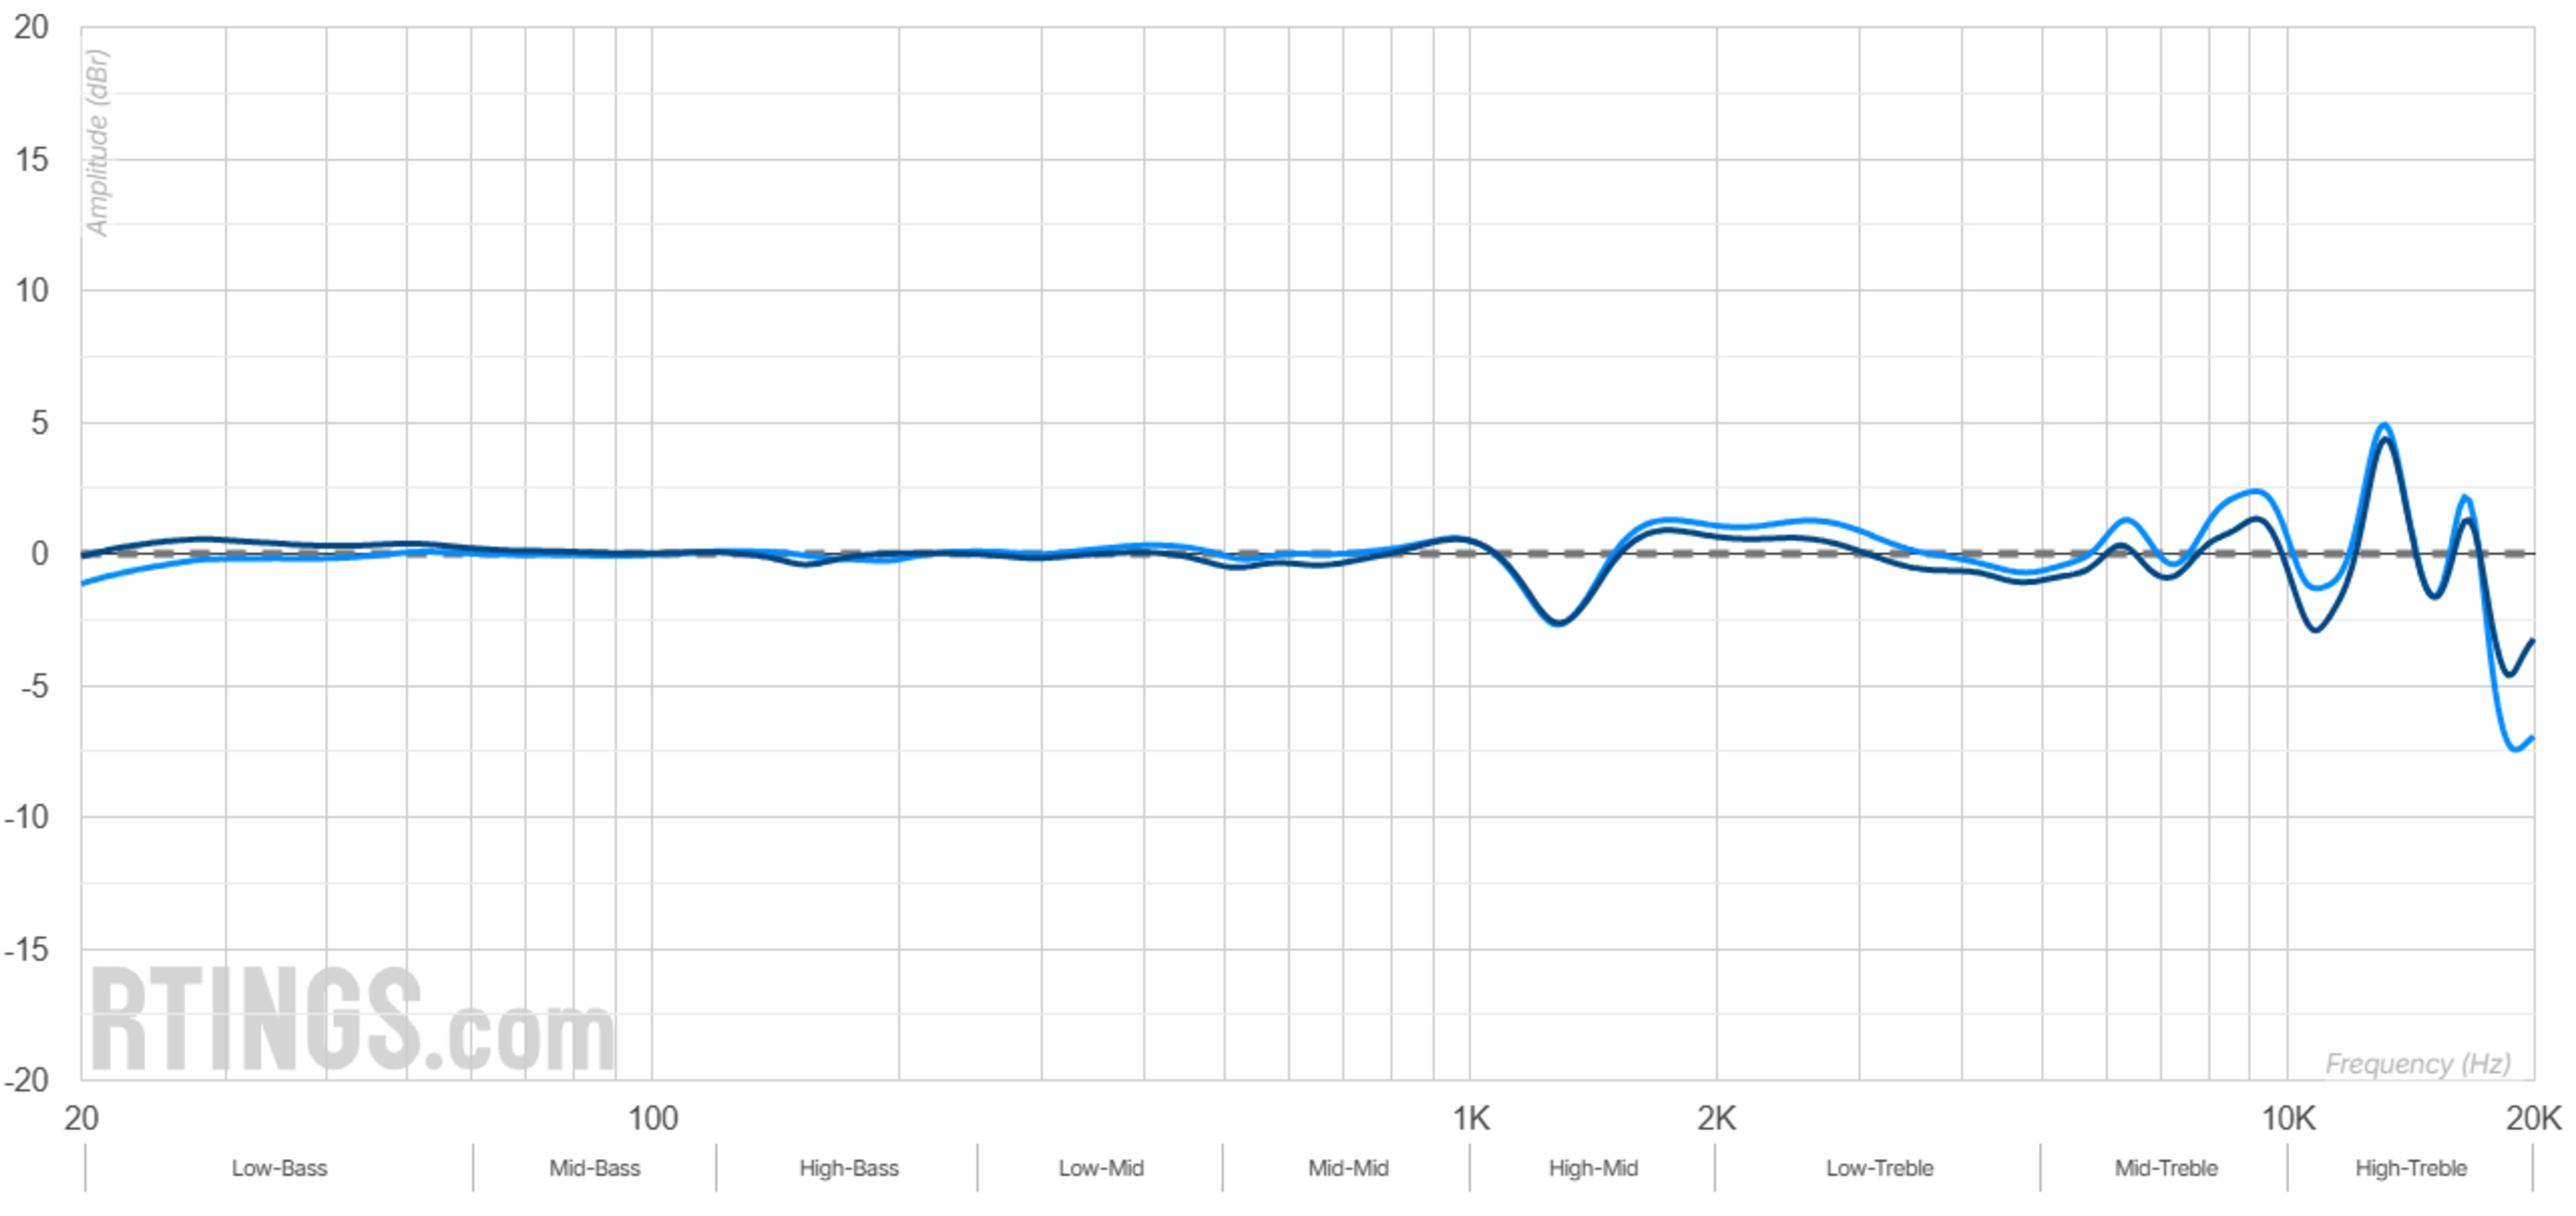
To identify the actual Peaks and Dips, we take this smoothed sound profile and flatten it into a straight line, treating it as a neutral baseline. We then compare the raw frequency response against that line. The remaining 'wiggles' (the deviations from that smooth trend) are the peaks (boosts) and dips (drop-offs).
Importantly, this process is based on an average of multiple measurements across different re-seatings and both ear cups, which helps minimize fit-related variation. The Peaks and Dips metric doesn't rely on variation between passes; instead, it isolates narrowband deviations from the smoothed trend of the average response. These deviations typically reflect design-related characteristics like driver resonances or internal reflections, not random noise.
We analyze these between 20Hz and 9kHz since perception of higher frequencies varies a lot from person to person, and even small shifts in position can dramatically affect the response above 9kHz. This is partly due to individual differences in Head-Related Transfer Function (HRTF), which shape how we perceive directional and high-frequency cues. Plus, we're less sensitive to those ultra-high frequencies, so those deviations tend to matter less (that's one reason we relaxed how we scored the treble range with our Headphones Test Bench 2.0).
Well-controlled headphones might only show 1 to 2 dB of variation, while more uneven models can deviate by 5 dB or more. These deviations are translated into a score: smaller and fewer irregularities mean a better Peaks and Dips rating. We also display them visually in our charts: an ideal response would be perfectly flat, though no headphones are flawless (yet!).
Why are Peaks worth 75% but Dips only 25%?
Peaks are weighted more heavily because they're generally more noticeable than dips. A sharp peak can make certain notes or consonants sound harsh or piercing, while dips tend to sound more like a missing detail. This 75/25 split reflects how added energy is more distracting than removed energy, which aligns with listener preference research from Dr. Sean Olive and others.
Our Tests
Peaks/Dips
This test measures upward and downward deviations in the headphones' frequency response relative to their smoothed Sound Profile. Peaks often reflect resonances or tuning artifacts that add energy at narrow frequency bands, which can make certain notes or consonants sound sharp, sibilant, or harsh. Since these boosts tend to stand out more than dips, they account for the majority of the Peaks and Dips score (75%). Dips usually cause a subtle loss of detail or clarity, making some frequencies sound recessed or muffled. They're generally less noticeable than peaks, so they have a smaller impact on the overall Peaks and Dips score (25%).
Conclusion
The Peaks/Dips test is a key part of our headphones evaluations because it picks up on something raw frequency response or target matching might miss: how smooth the headphones actually sound. A pair of headphones can hit all the right tonal balance points on average, but still have sharp little spikes or dips that make certain notes jump out or vanish. Our Peaks and Dips score helps flag those issues. Research from Harman and others has shown that most people prefer a smoother, more even sound, and we agree. By measuring these fine-grained irregularities, we're making sure headphones aren't just well-tuned overall, but also free from the kinds of response quirks that can lead to harshness, muddiness, or listening fatigue. If you want your music to sound clean and natural, with no surprises, this is a measurement worth paying attention to.
Recent Updates
- 07-24-2025: We updated this article to align with changes made as part of Headphones Test Bench 2.0.