- 12.5%0.1% APL Native Contrast
- 12.5%0.5% APL Native Contrast
- 12.5%1% APL Native Contrast
- 12.5%5% APL Native Contrast
- 12.5%10% APL Native Contrast
- 12.5%15% APL Native Contrast
- 12.5%25% APL Native Contrast
- 12.5%50% APL Native Contrast
The contrast ratio of a projector is the ratio between the illuminance of the brightest whites and the darkest blacks that a projector can produce simultaneously. Higher contrast results in a greater illuminance difference between the deepest blacks and the brightest whites, so dark areas of the screen remain dark when bright highlights are visible. A projector with a low contrast ratio looks washed out whenever bright highlights are in the scene.
To test the contrast, we measure the average illuminance of multiple white and black patches at different average picture levels (APL) and then calculate the ratio between the two. Illuminance is a metric to measure the amount of light (luminous flux) falling on a given surface and is expressed in lux. This gives us a contrast value at each APL level, showing us how well the projector handles blacks as the image increasingly gets brighter. Our main contrast score is based on these measurements with all contrast-enhancing features disabled, which we call Native Contrast. We also run a separate Sequential Contrast test (Full-On/Full-Off) with and without dynamic contrast features, which we report separately.
Test results
When It Matters
Contrast is one of the most important aspects of picture quality with any display technology. Whether you're looking at a TV, projector, monitor, or even your phone, the display's contrast is usually one of the first things most people will notice. It's especially important if you're watching something in a dark room. Contrast isn't just about deep blacks or bright whites but the difference between them. If you're watching a movie in a dark room on a projector with low contrast, whites and saturated colors won't stand out well, and the entire image looks dull and flat. High contrast leads to a punchier image, with dark areas that remain dark and bright highlights that stand out clearly from the background.
It's important to note that contrast measurements on a 50% APL checkerboard pattern, which is how the industry standard ANSI contrast is measured, don't paint the full picture of the projector's performance. Many factors go into producing good picture quality from a projector, including the room setup, ambient light, and even the specific screen you're using. The content also plays a big role here, as a scene's average picture level (APL) can greatly impact the perceived contrast. This is why we now measure contrast at different APLs, as simply measuring contrast on a 50% APL checkerboard doesn't tell you how the projector will perform in lower APL scenes. The lower the APL, the higher the effective contrast ratio. This is due to light leakage within the projector's optical setup, so more light going through means more light leakage and lower contrast. It's also because the more light the projector emits, the more light is reflected from your viewing environment onto the screen, again lowering perceived contrast. Thus, by measuring contrast at different APLs, we can paint a clearer picture of how the projector performs in many scenes, from very dark to brighter ones.
Our Tests
All of our contrast measurements use the same physical setup. We test in a completely black, light-controlled room with fully velvet-covered surfaces to minimize reflections. The projector is aligned to a 100" Stewart StudioTek 100 projector screen with neutral gain (1.0) at its minimum throw distance. Once it is aligned, we temporarily remove the screen and cover it with black velvet so it doesn't reflect any light during the test, exposing a wall-mounted Konica Minolta T-10A illuminance meter array arranged in a 3×3 grid that matches the 100" image area.
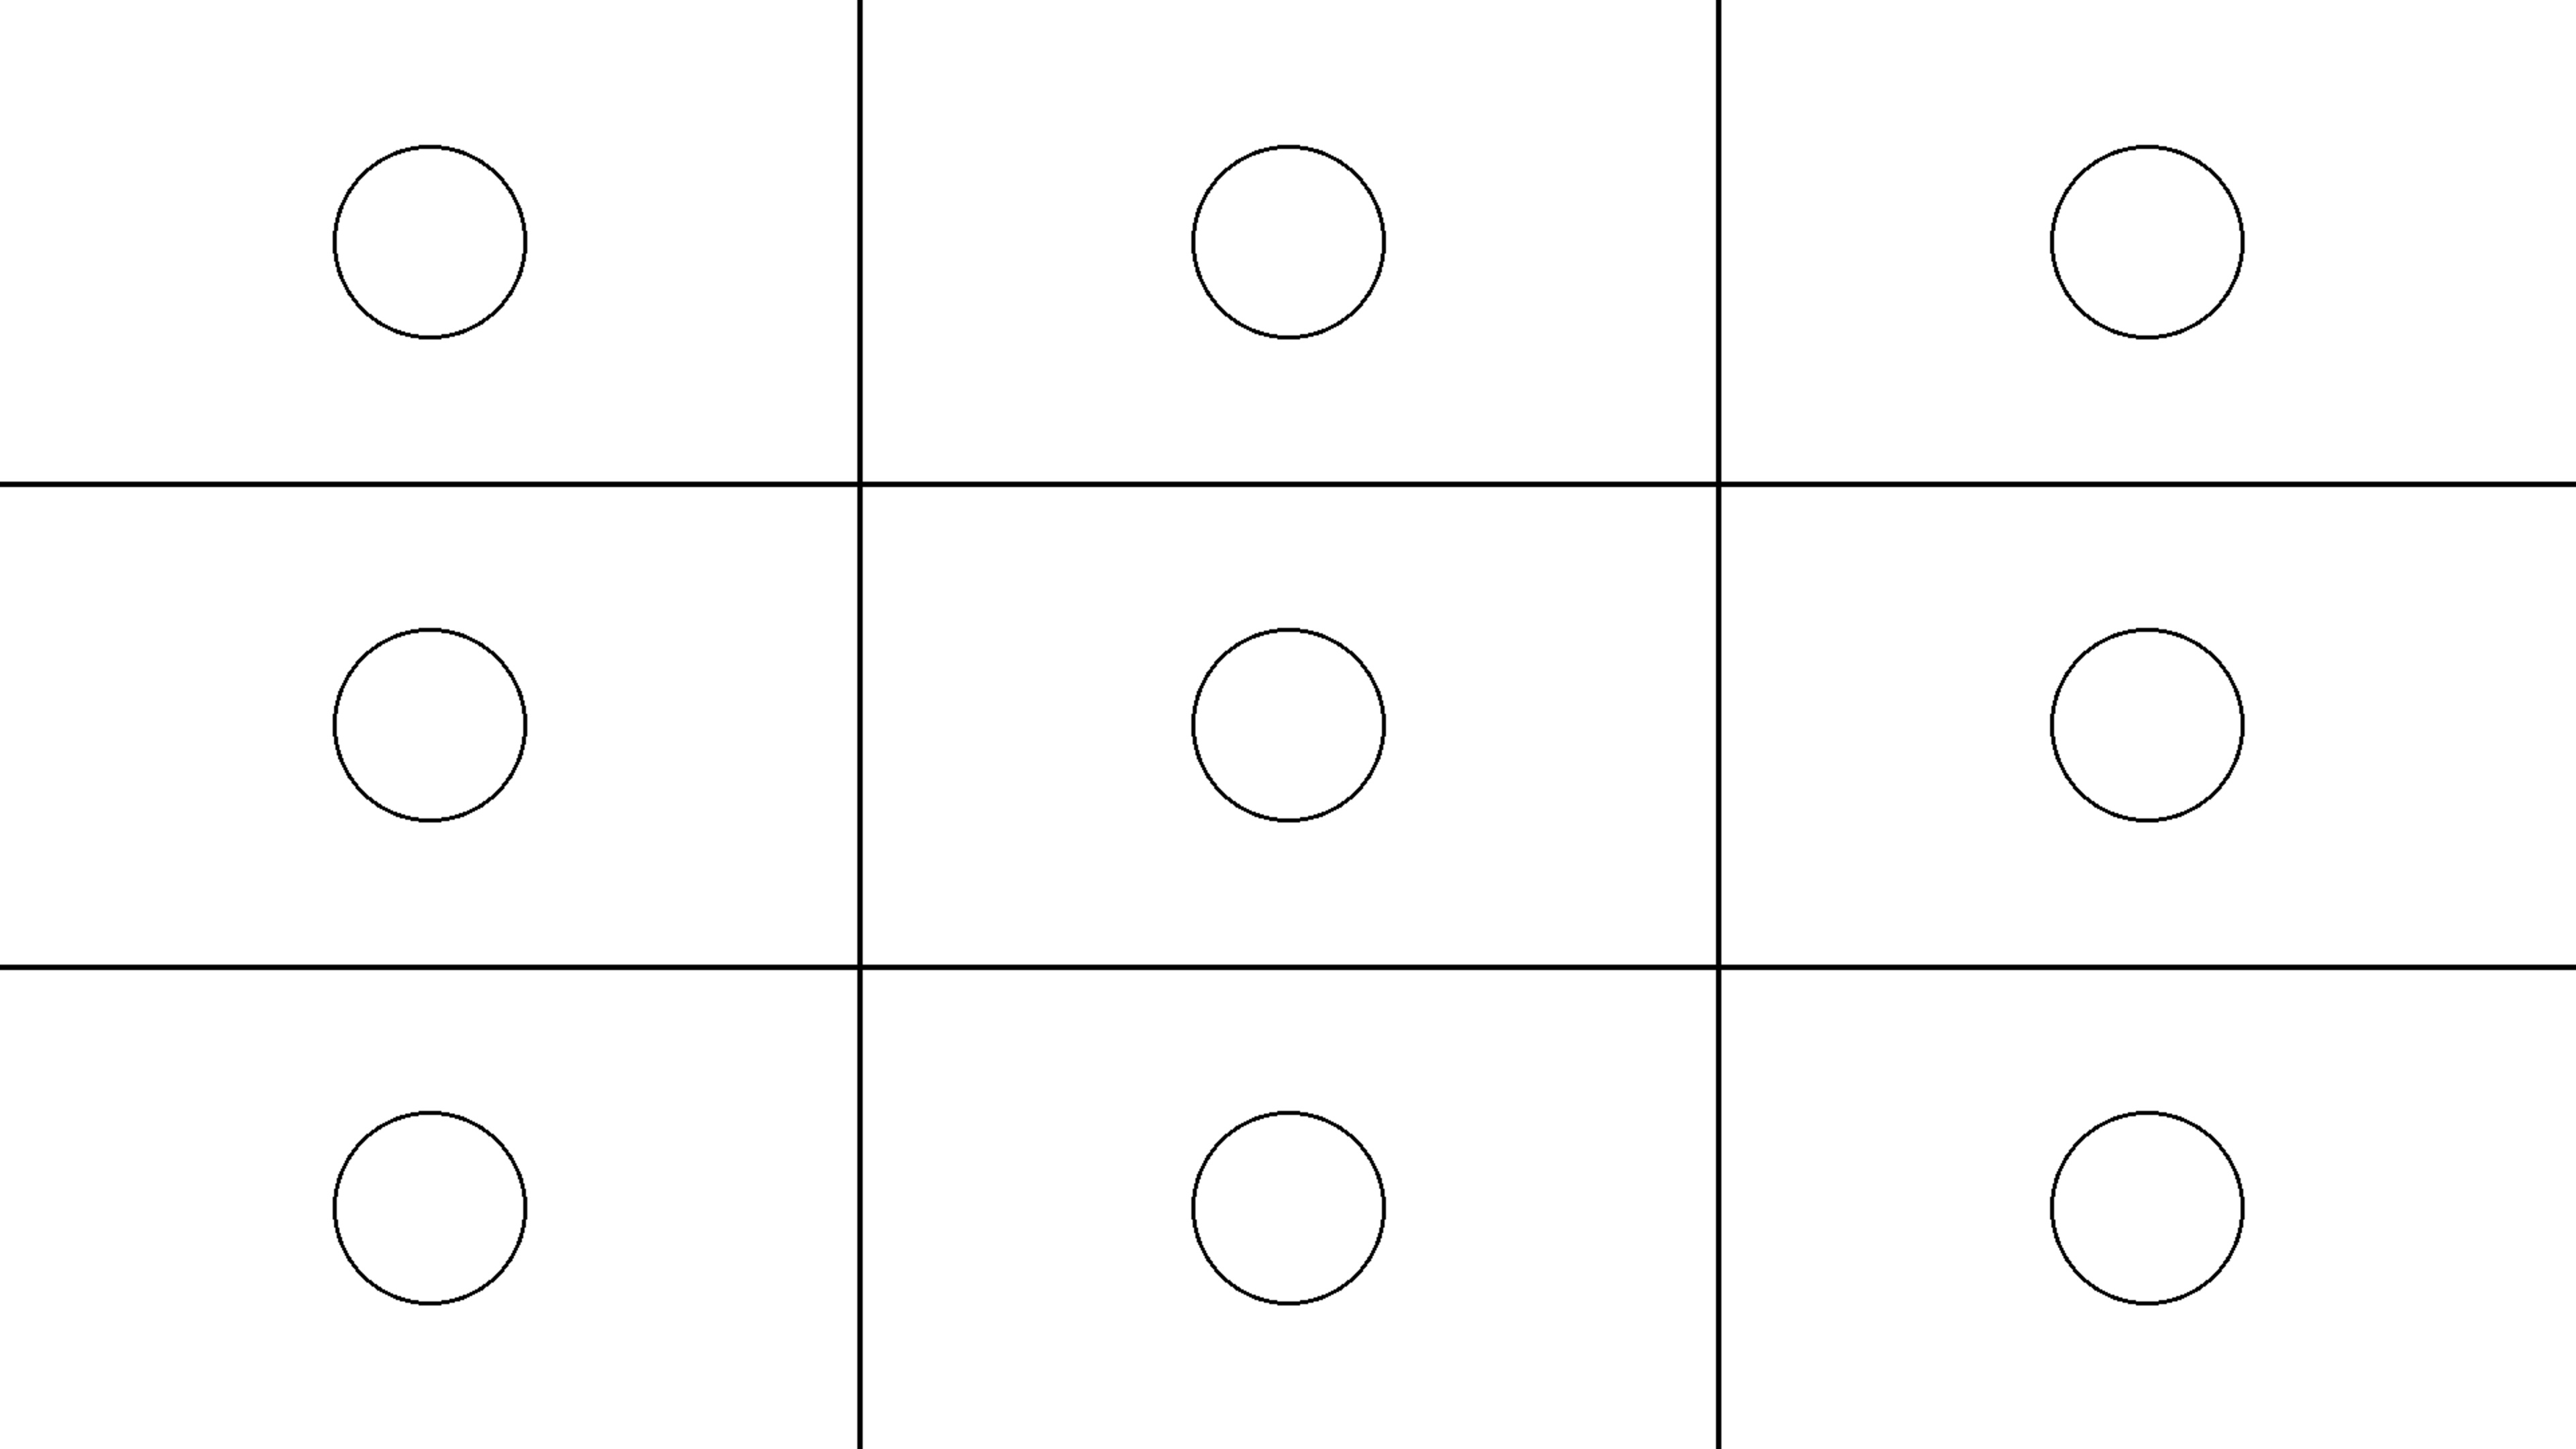
We connect the projector to a computer, configure it as a second monitor with Windows scaling set to 100%, and use it to display our contrast test patterns. For higher APL levels, from 50% down to 5%, we use fixed APL patterns where the white and black patches line up with the sensor array. For the lowest APL levels (1%, 0.5%, and 0.1%), we switch to an APL Patch Generator program that draws small white patches on a black background and lets us position each patch precisely over a sensor; at these very small APL values, good alignment is important because a patch that isn't centered on a sensor will produce a lower reading than it should. During each measurement, the sensors in the array capture the illuminance of the white and black patches in lux, and we repeat readings as needed to ensure the results are consistent and not impacted by stray reflected light.
Native Contrast
- 12.5%0.1% APL Native Contrast
- 12.5%0.5% APL Native Contrast
- 12.5%1% APL Native Contrast
- 12.5%5% APL Native Contrast
- 12.5%10% APL Native Contrast
- 12.5%15% APL Native Contrast
- 12.5%25% APL Native Contrast
- 12.5%50% APL Native Contrast
The native contrast test measures the ratio of the projector's white and black brightness in its most accurate, post-calibration settings, with all dynamic contrast features, such as an auto iris or light-source dimming, turned off. Using the Contrast Testing Setup described above, we run through each of our APL levels. At each level, we take the average illuminance of the white patches and divide it by the average illuminance of the black patches to get a contrast ratio.
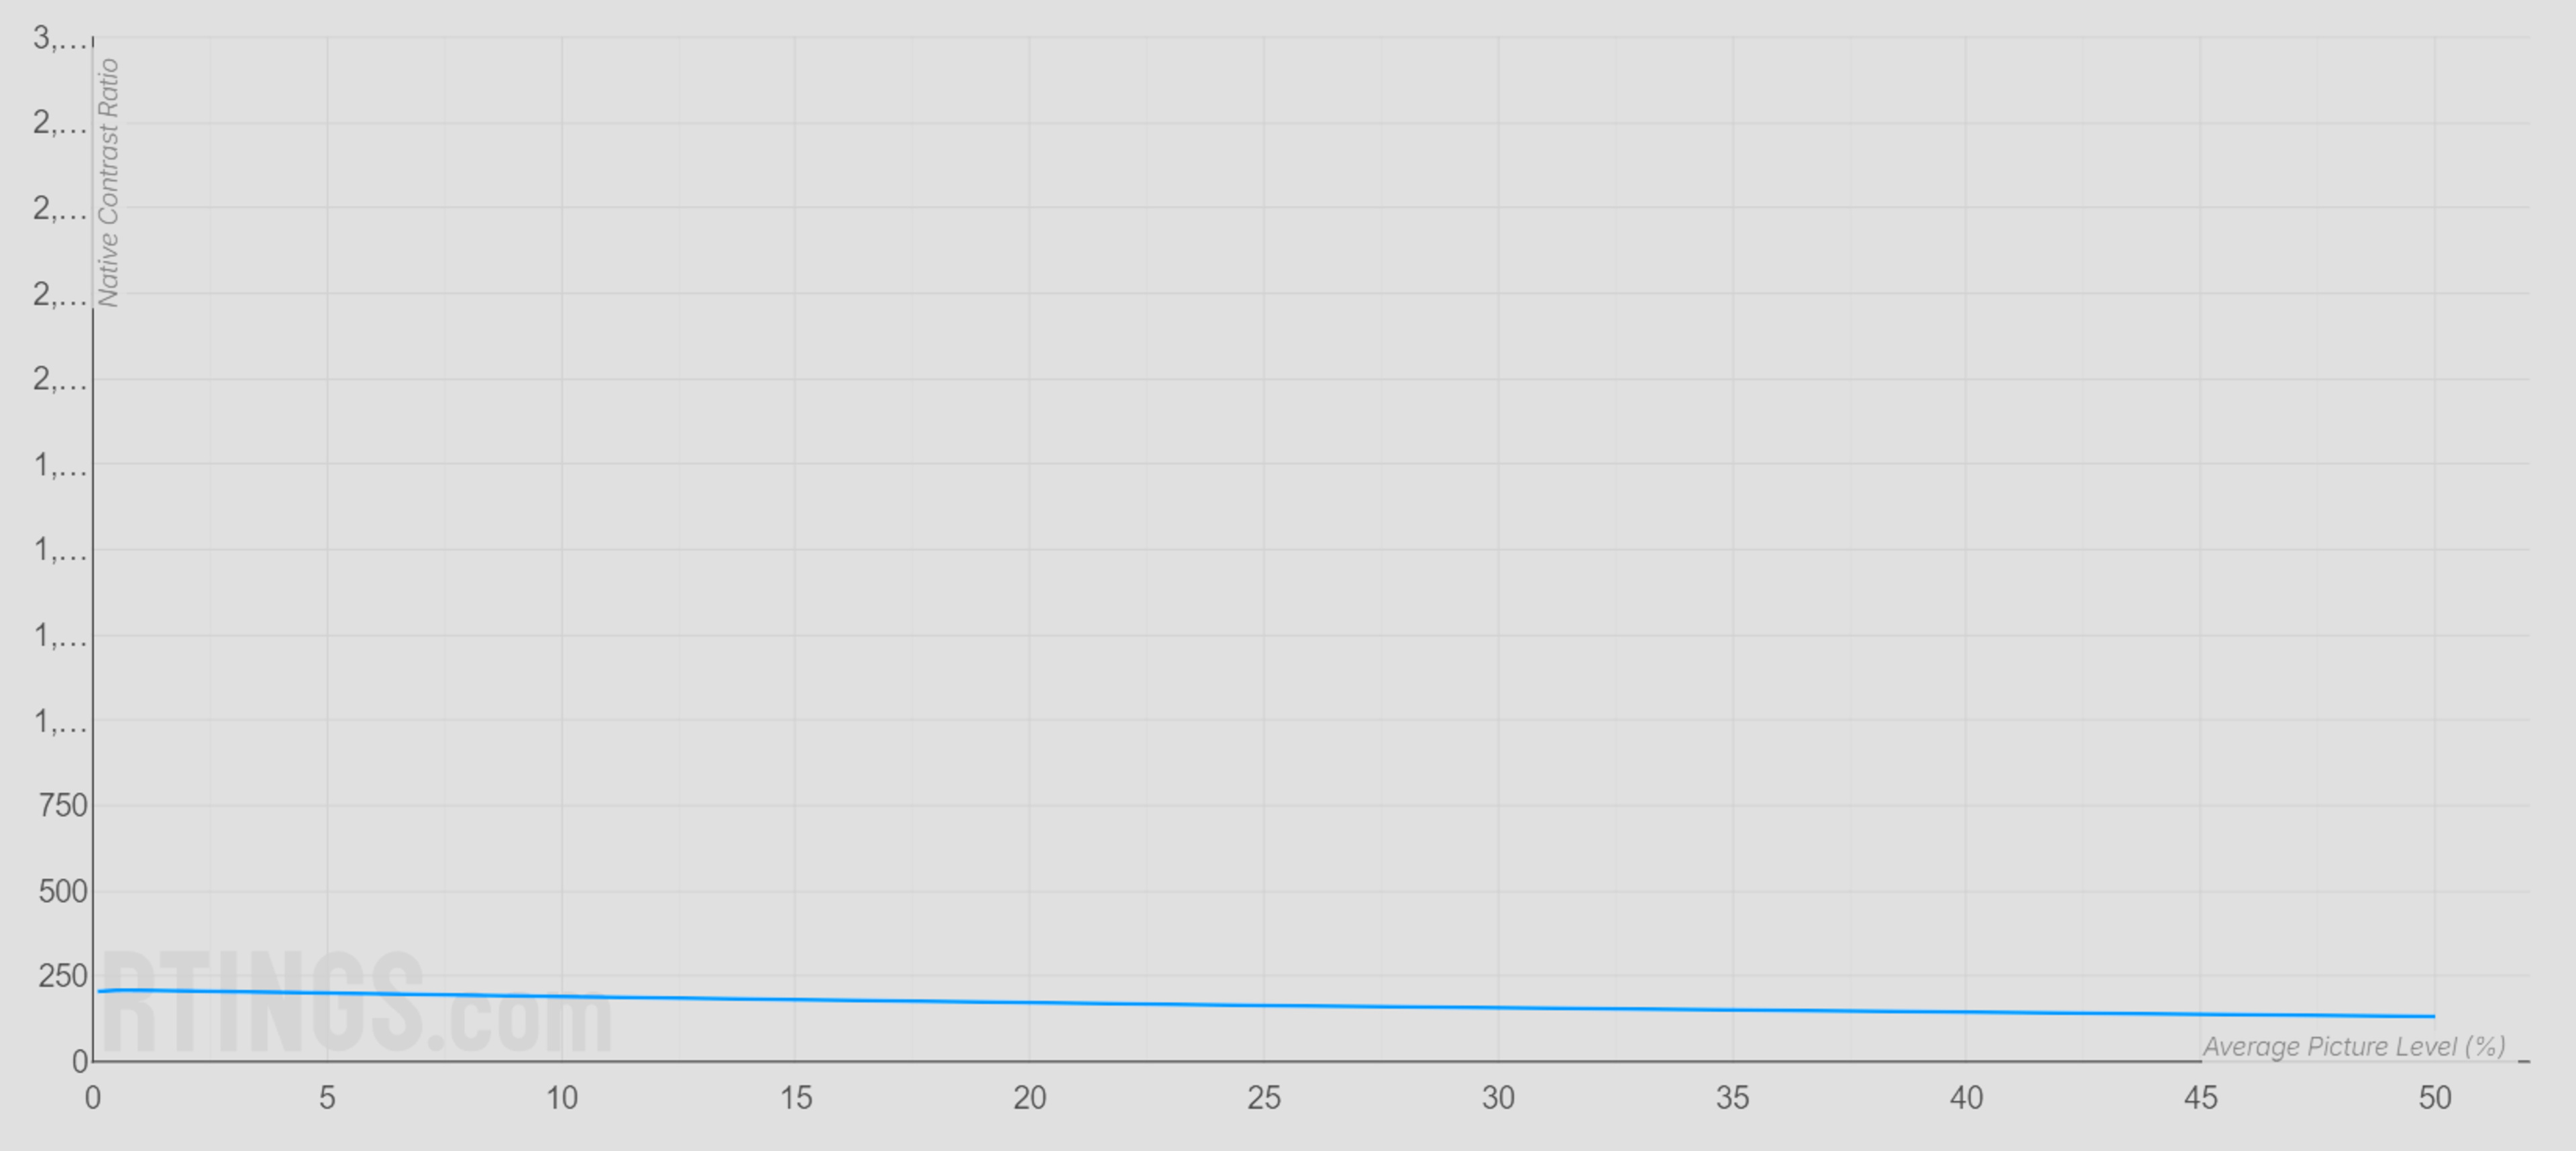
We plot these values as a function of APL to show how the projector's native contrast changes as the image gets brighter. This curve is what you see in the APL Native Contrast graph in our reviews. Our main contrast score is based only on these Native Contrast measurements, with all contrast-enhancing features disabled.
 |
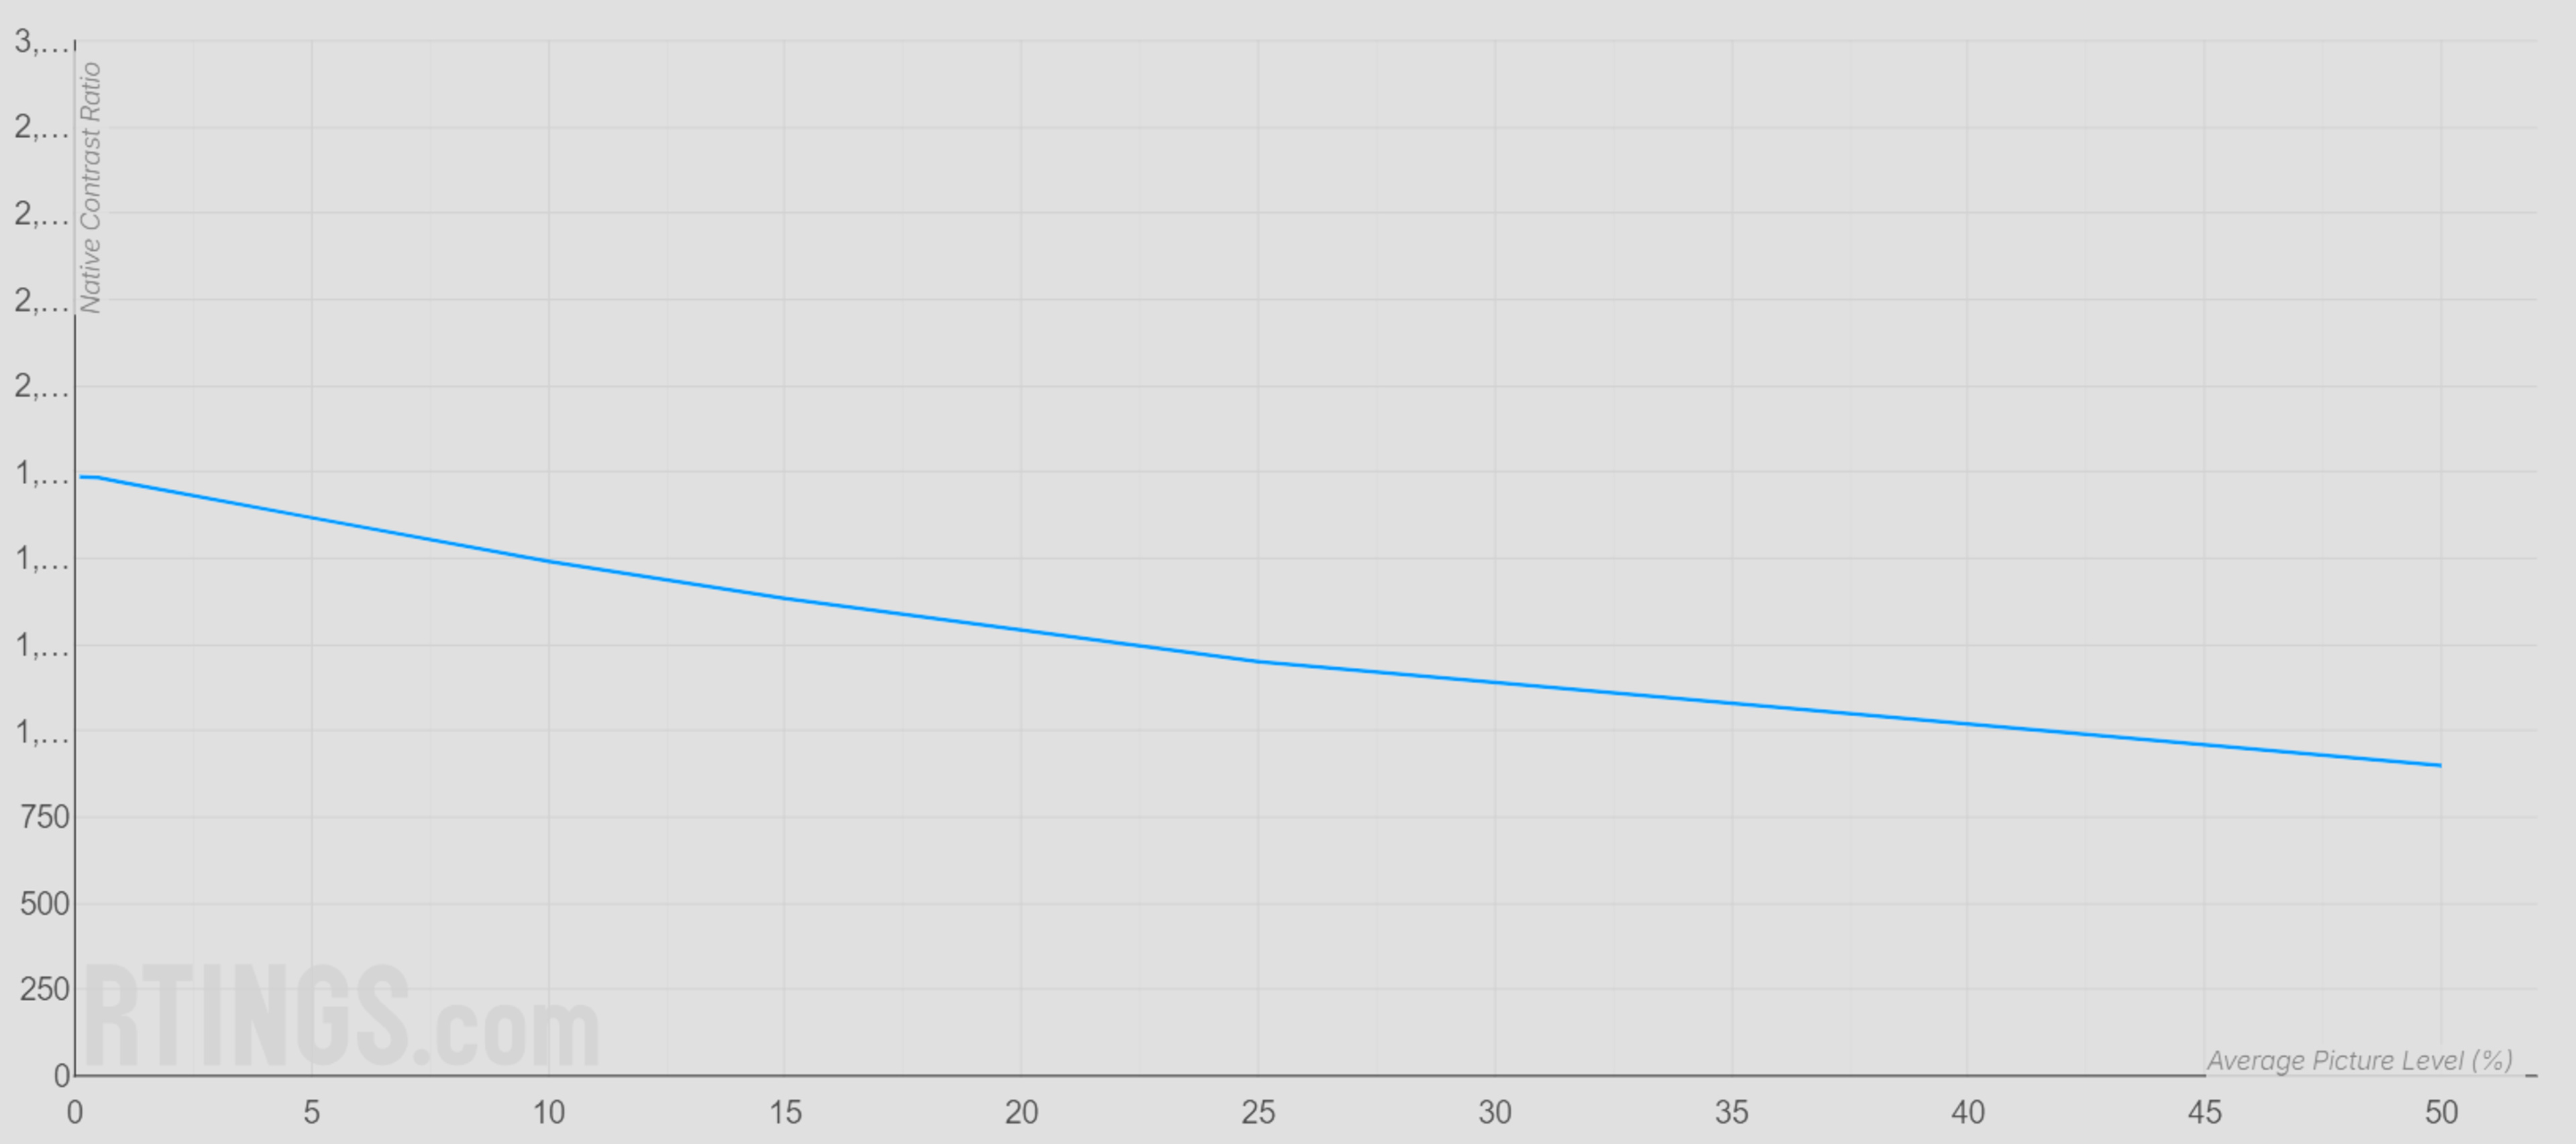 |
Looking at the two examples above, you can clearly see the difference between a projector with low contrast and one with high contrast. The Epson EpiqVision Flex CO-W01 on the left starts out with a very low native contrast, so its curve sits close to the bottom of the graph and stays there across all APL levels. The XGIMI HORIZON 20 Max on the right has much higher native contrast at low APLs, and although its contrast decreases as the Average Picture Level increases, it still remains far above the Epson at every point on the graph. That means dark scenes look deeper and bright highlights stand out more on the XGIMI in real content.
To arrive at each point on these curves, we take the average of the white patches and divide it by the average of the black patches for that APL pattern. We repeat this for all of our APL levels and then plot the resulting contrast ratios on a graph like the ones above, which shows you how the projector's native contrast changes as the image gets brighter.
Sequential Contrast
The sequential contrast test measures the projector's contrast when switching between a full white screen and a full black screen. It's a Full-On/Full-Off (FOFO) test that complements our Native Contrast measurements by showing the maximum theoretical inter-frame contrast the projector can achieve.
Using the same Contrast Testing Setup, we display a full-field white pattern and measure the illuminance at the sensor array, then display a full-field black pattern and repeat the measurement. We first perform this test with all contrast-enhancing features disabled to obtain the Native Full-On/Full-Off Contrast. We then enable the projector's dynamic contrast options (for example, an auto iris or light-source dimming) and repeat the measurements to obtain the Full-On/Full-Off Contrast result.
These values are useful to see how aggressively a projector's dynamic system can deepen black levels in very dark scenes, while our main contrast score remains tied to the Native Contrast results.
Alternative Methods
You'll likely notice that our measured contrast rarely matches manufacturer claims. Why is that? Well, there are multiple ways to measure contrast, and manufacturers often choose the method that delivers the highest numbers for their marketing. Not all manufacturers do this, but most do. So what other ways are there? When you see numbers like 1,500,000:1, the manufacturer is almost always using a simple full-white and full-black pattern to measure contrast, with all of the projector's contrast-enhancing features enabled, such as light-source dimming or closing the iris. Numbers this high are effectively impossible to obtain with native contrast alone. The problem with this method is that it simply doesn't match any real-world content. Our test patterns, which use multiple white test patches on a black background, don't perfectly match real content either, but they're much more demanding than a simple full-white/full-black slide, so they better reflect how a projector will look in real use.
ANSI Contrast
Measuring contrast with a 50% APL slide is commonly called "ANSI Contrast." Before the 0.9 test bench, we also measured contrast solely with a 50% APL slide, but our methodology wasn't quite in line with the ANSI standards, so we called it Native Contrast instead. Contrast measurements are extremely sensitive to stray light. As our Projector Launch article explained, during our initial test development process, we discovered that even our clothing could significantly impact our measurements.
Our current test room is now much closer to a true laboratory setup, with fully blacked-out, velvet-covered surfaces that minimize reflections. This means our results with a 50% APL slide are likely very close to what a strict ANSI setup would produce. However, our patterns and measurement workflow still differ slightly from the formal ANSI specification, and ANSI contrast is only one APL level among many that we test. For these reasons, we present our 50% APL results as part of our APL Native Contrast measurements rather than labeling them as ANSI contrast.
Dynamic Contrast
Many projectors include "dynamic contrast" features that aim to improve black levels by adjusting light output over time. This can be done with a dynamic iris, light-source dimming, or by adjusting the projector's gamma or brightness based on the current frame's brightness. Manufacturers often quote very high "dynamic contrast" numbers in their marketing, sometimes orders of magnitude higher than the projector's native contrast.
The challenge with dynamic contrast is that it depends on how the content changes from frame to frame, so the measured value can vary a lot depending on the pattern you use and how long you display it. That makes it difficult to obtain stable, comparable numbers across different projectors, especially for more complex APL patterns. For this reason, we always disable dynamic contrast features for our main Native Contrast measurements, and our contrast score is based only on those native results.
We still think it is useful to see how much a projector's dynamic system can deepen blacks in very dark scenes, so we quantify it in a controlled way through our Sequential Contrast test. In that section of the review, we report both Native Full-On/Full-Off Contrast (dynamic contrast disabled) and Full-On/Full-Off Contrast (dynamic contrast enabled) using simple full-white and full-black screens. This lets you see the impact of dynamic contrast on FOFO measurements, while keeping our main contrast score tied to more realistic native performance.
Read more on the challenges of testing dynamic contrast on projectors.
Conclusion
Contrast is one of the most important and noticeable aspects of a projector's overall picture quality. The higher the contrast, the better, as bright highlights will stand out more against darker areas of the scene. Although there are multiple ways to test contrast, we use custom patterns consisting of white test patches on a black background and measure the difference in average illuminance between the white and black patches.