Whether you're training for your next race, trying to stay fit, or just jogging for fun, having running shoes that match your style and needs is crucial. To guide runners into choosing their next pair, we've been testing the midsole performance: energy return, cushioning, and firmness using a compression machine. Our first approach was to apply a sine wave compression test up to 900 N based on values from literature and a few assumptions to adapt it to our custom setup (see our R&D article).
But assumptions only go so far. While most of our results made sense, some of them didn't feel quite right based on our testers' experiences, so we suspected something about our load range was off. It led us to collect data directly on runners using foot pressure mapping to create our own load models. As a result, we were able to build the following tables to help you know the load you apply to a shoe depending on your weight, pace, and cadence.
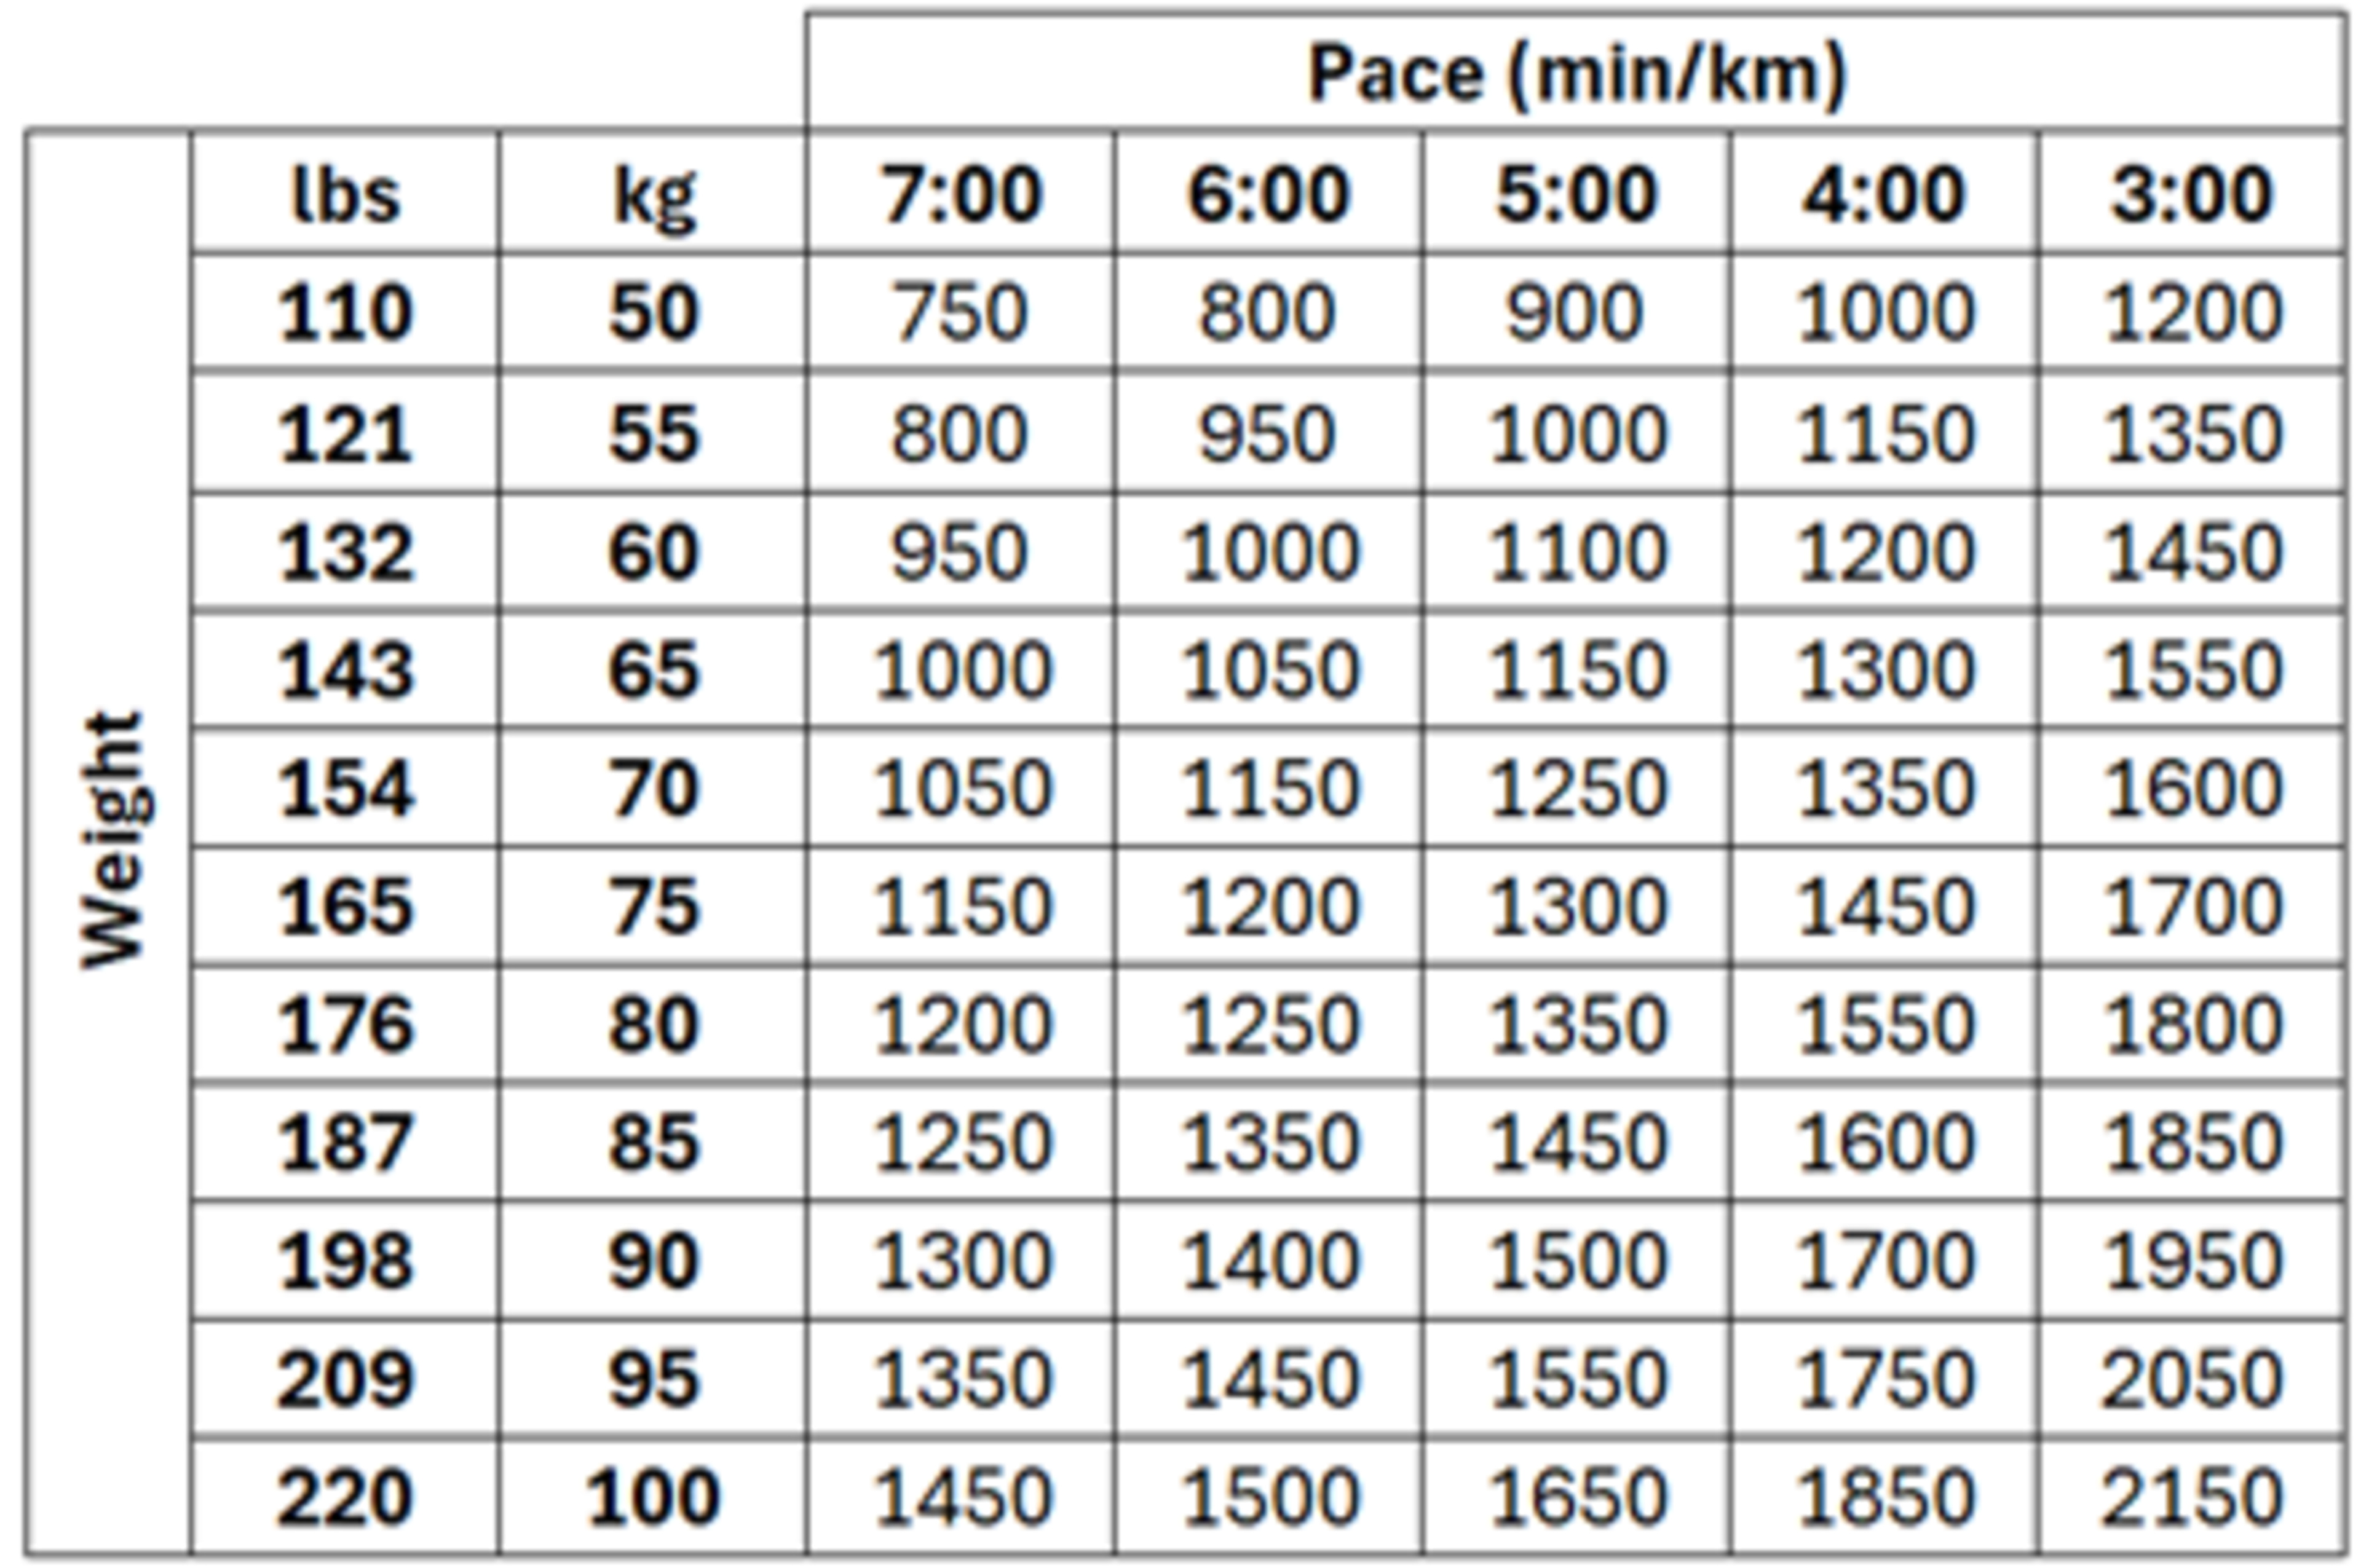
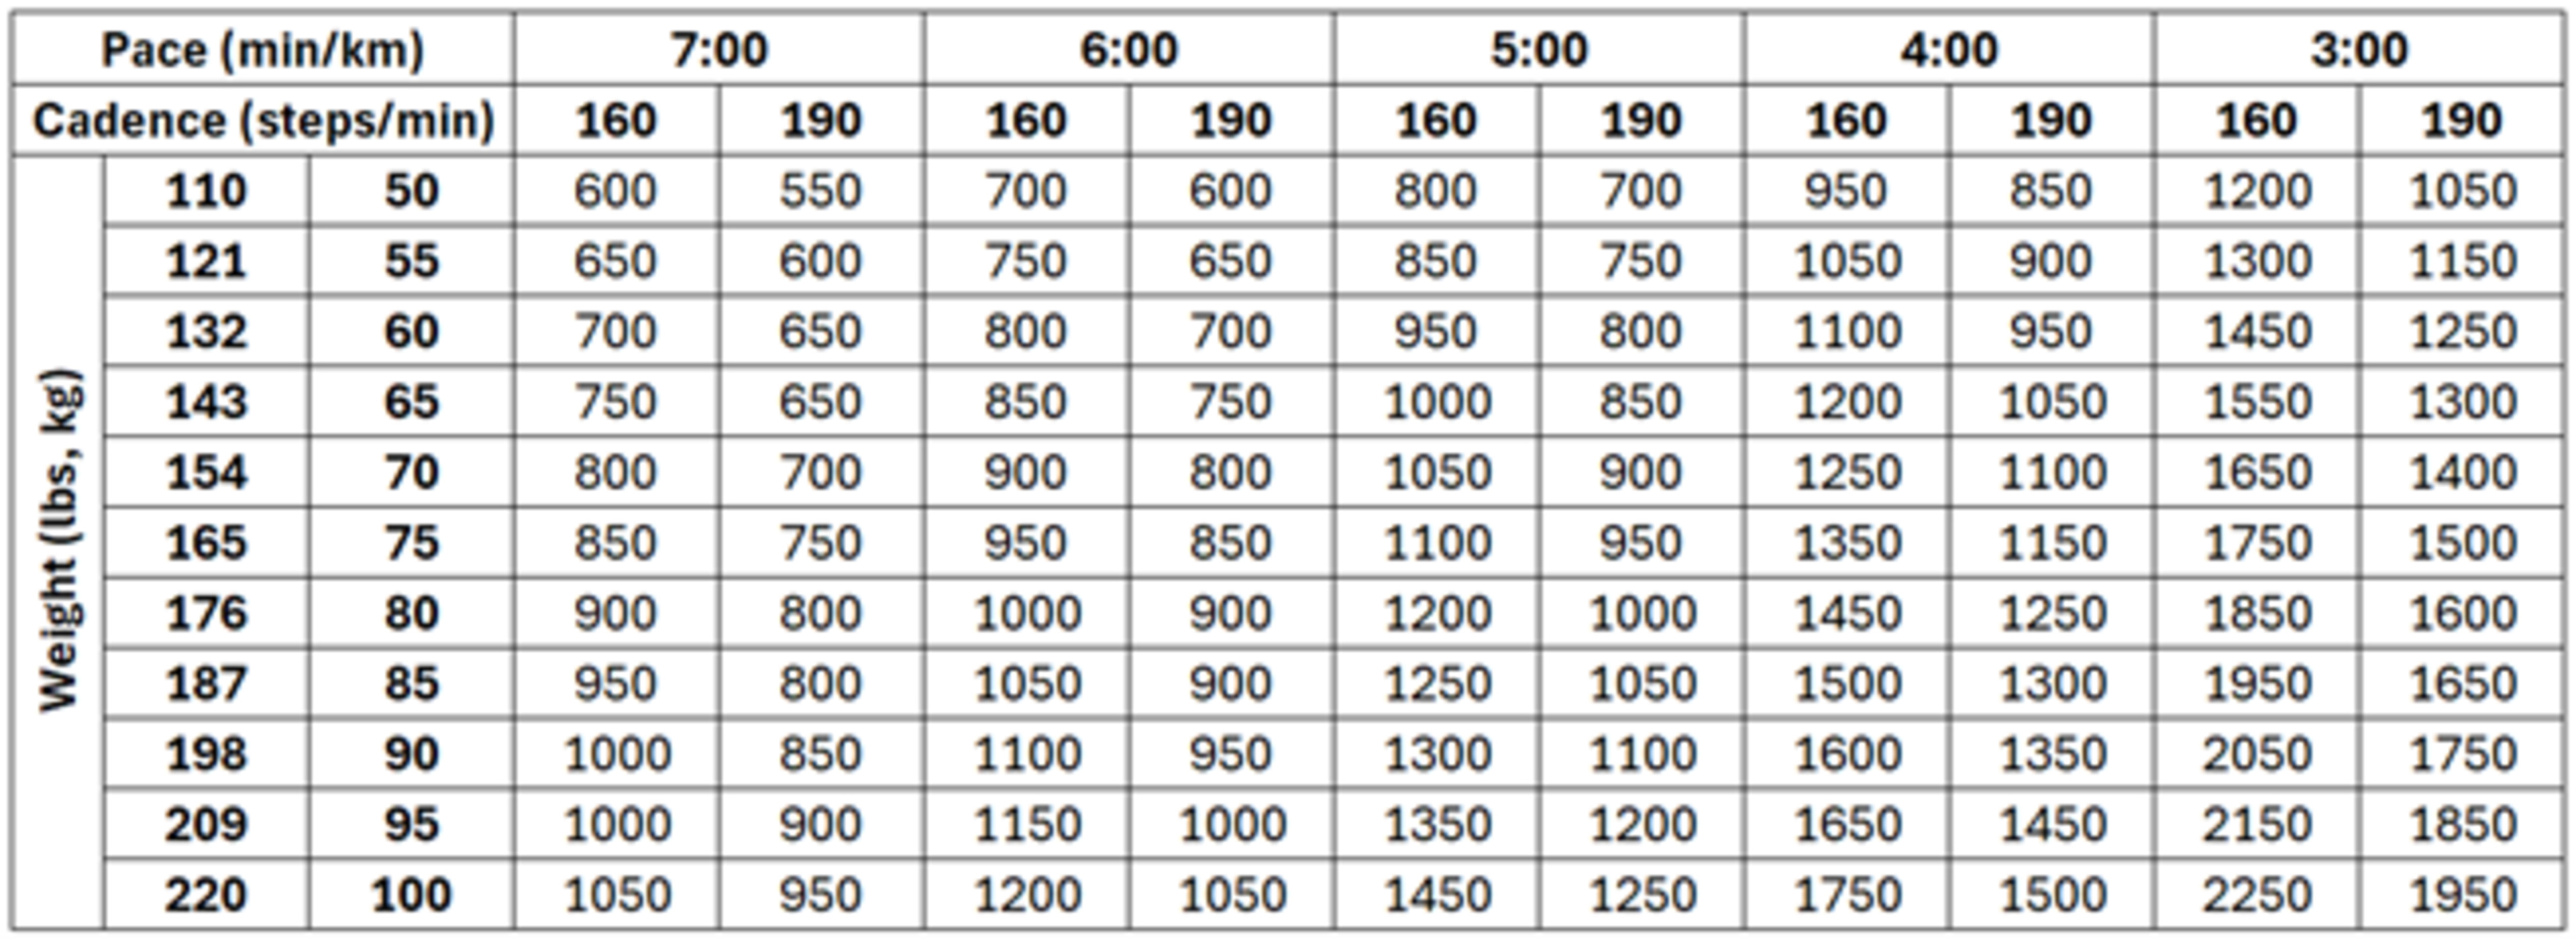
For example, we know now that if you are an 85 kg person doing easy runs at 7:00 min/km, you'd want to check cushioning and firmness at around 1,250 N in the forefoot to choose your daily trainer. If you're also a heel striker, then heel cushioning and firmness in the 800–950 N range matters, too. On the other hand, if you're interested in buying a speed workout shoe for interval sessions and you run your intervals around a 4:00 min/km pace, then 1,600 N in the forefoot becomes a load of interest as well.
To build those tables, we measured the real-life forces applied by runners using pressure sensor insoles. Eight runners with very different profiles helped us capture how load varies with weight, speed, and strike pattern.
Pressure Sensor Insoles
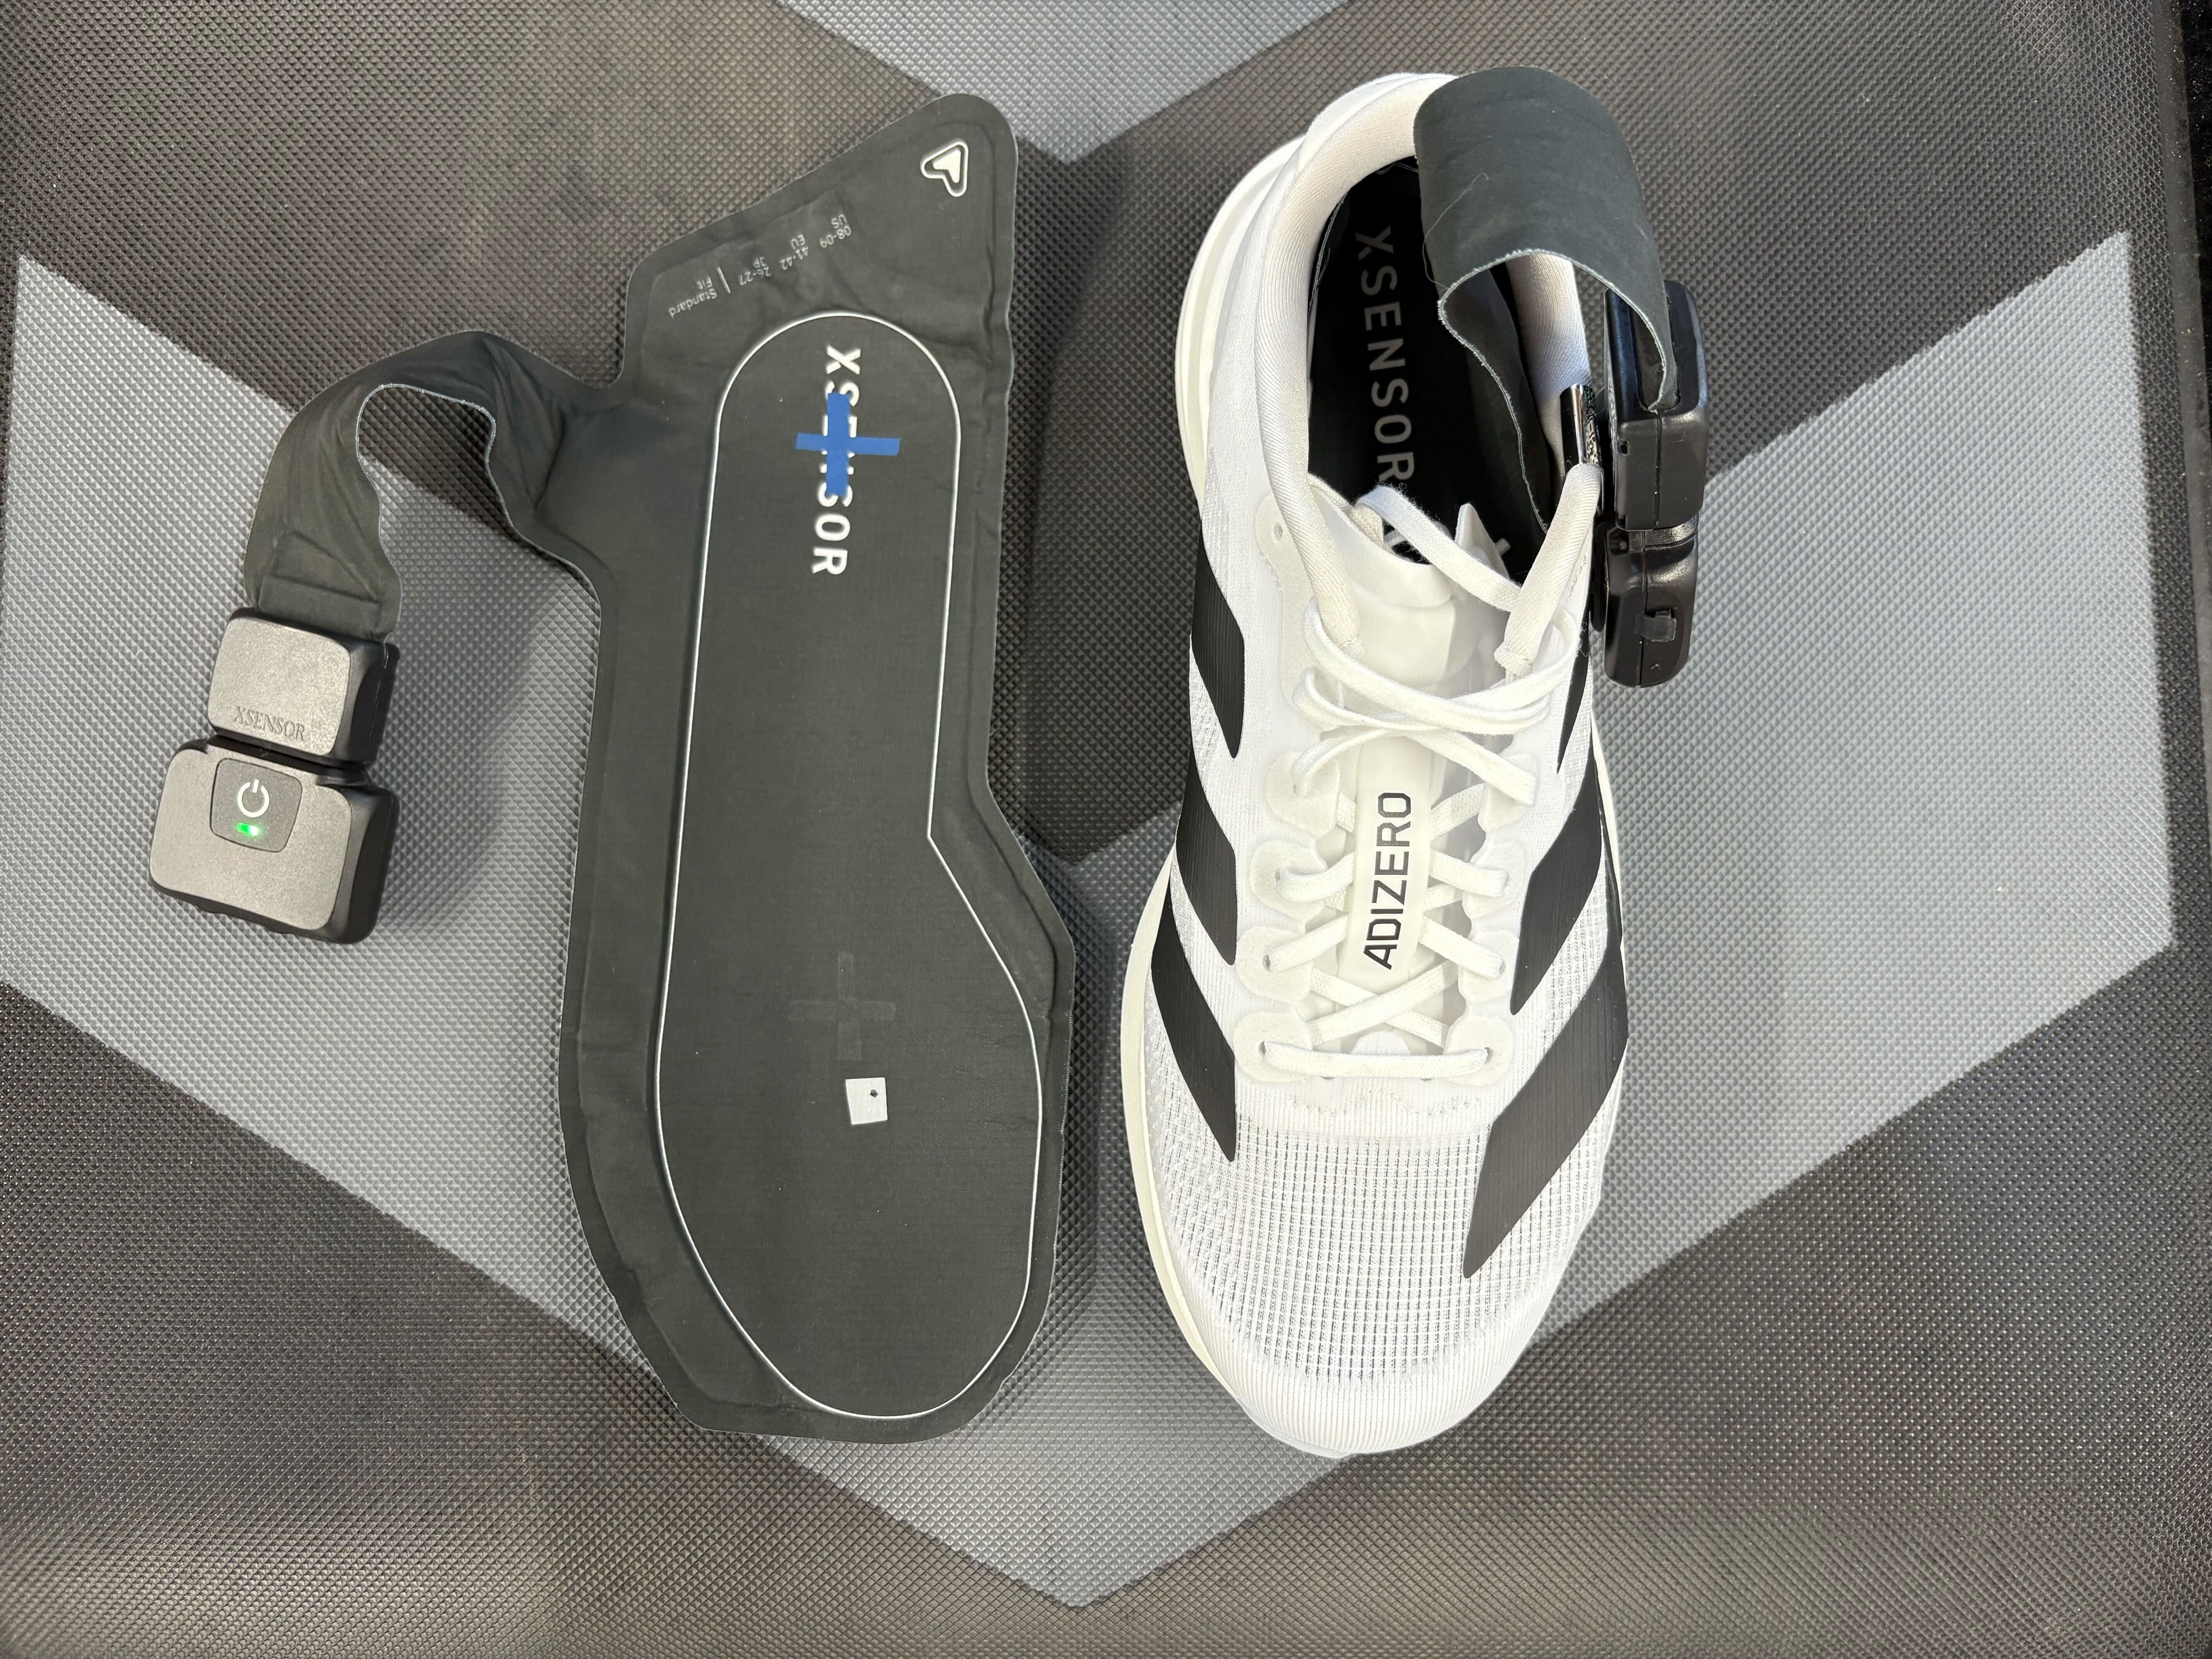
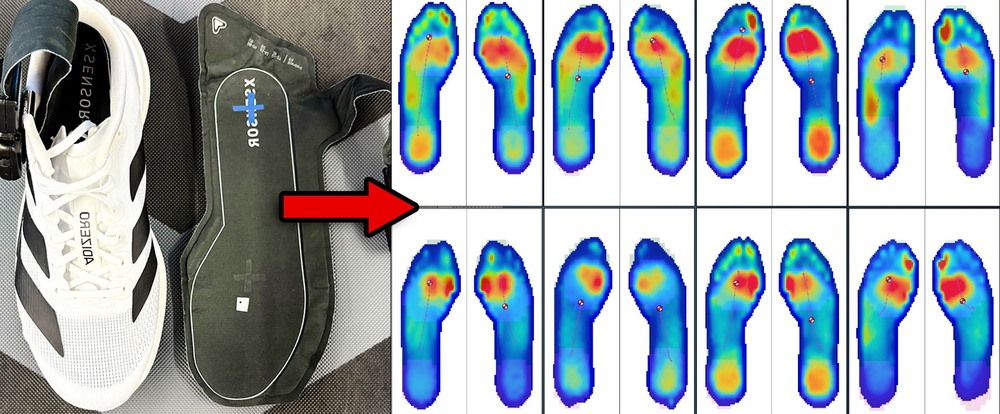
Pressure sensor insoles are thin inserts that fit inside a runner's shoe and record how much pressure the foot applies to the shoe with each step, as well as how that pressure is distributed across different parts of the foot. On top of that, they provide valuable gait information such as cadence and ground contact time. Our testing was carried out using XSENSOR's Intelligent Insoles that we bought ourselves. Each insole is equipped with over 235 tiny sensors to capture detailed pressure data. As seen in the video below, a preview of the data can be visualized while it is being recorded.
A tester and test developer using the insoles.
Eight Runners to The Test
Before deciding who should take part in the testing, we asked ourselves: what really affects how much load a runner puts on their shoes? We narrowed it down to three key factors:
- Weight: A greater mass naturally results in higher forces due to gravity.
- Cadence: A lower cadence means fewer steps per minute; therefore, it's expected that at each step the runner should apply more force to maintain the same speed.
- Foot strike pattern (heel, midfoot, or forefoot): Heel strikers put more pressure on the heel, while midfoot and forefoot strikers spread it differently, but by how much exactly? That's what we wanted to find out.
To capture the widest range of behaviors with the fewest participants, we used a design of experiments approach (illustrated below) and selected eight runners with distinct profiles across these three features.
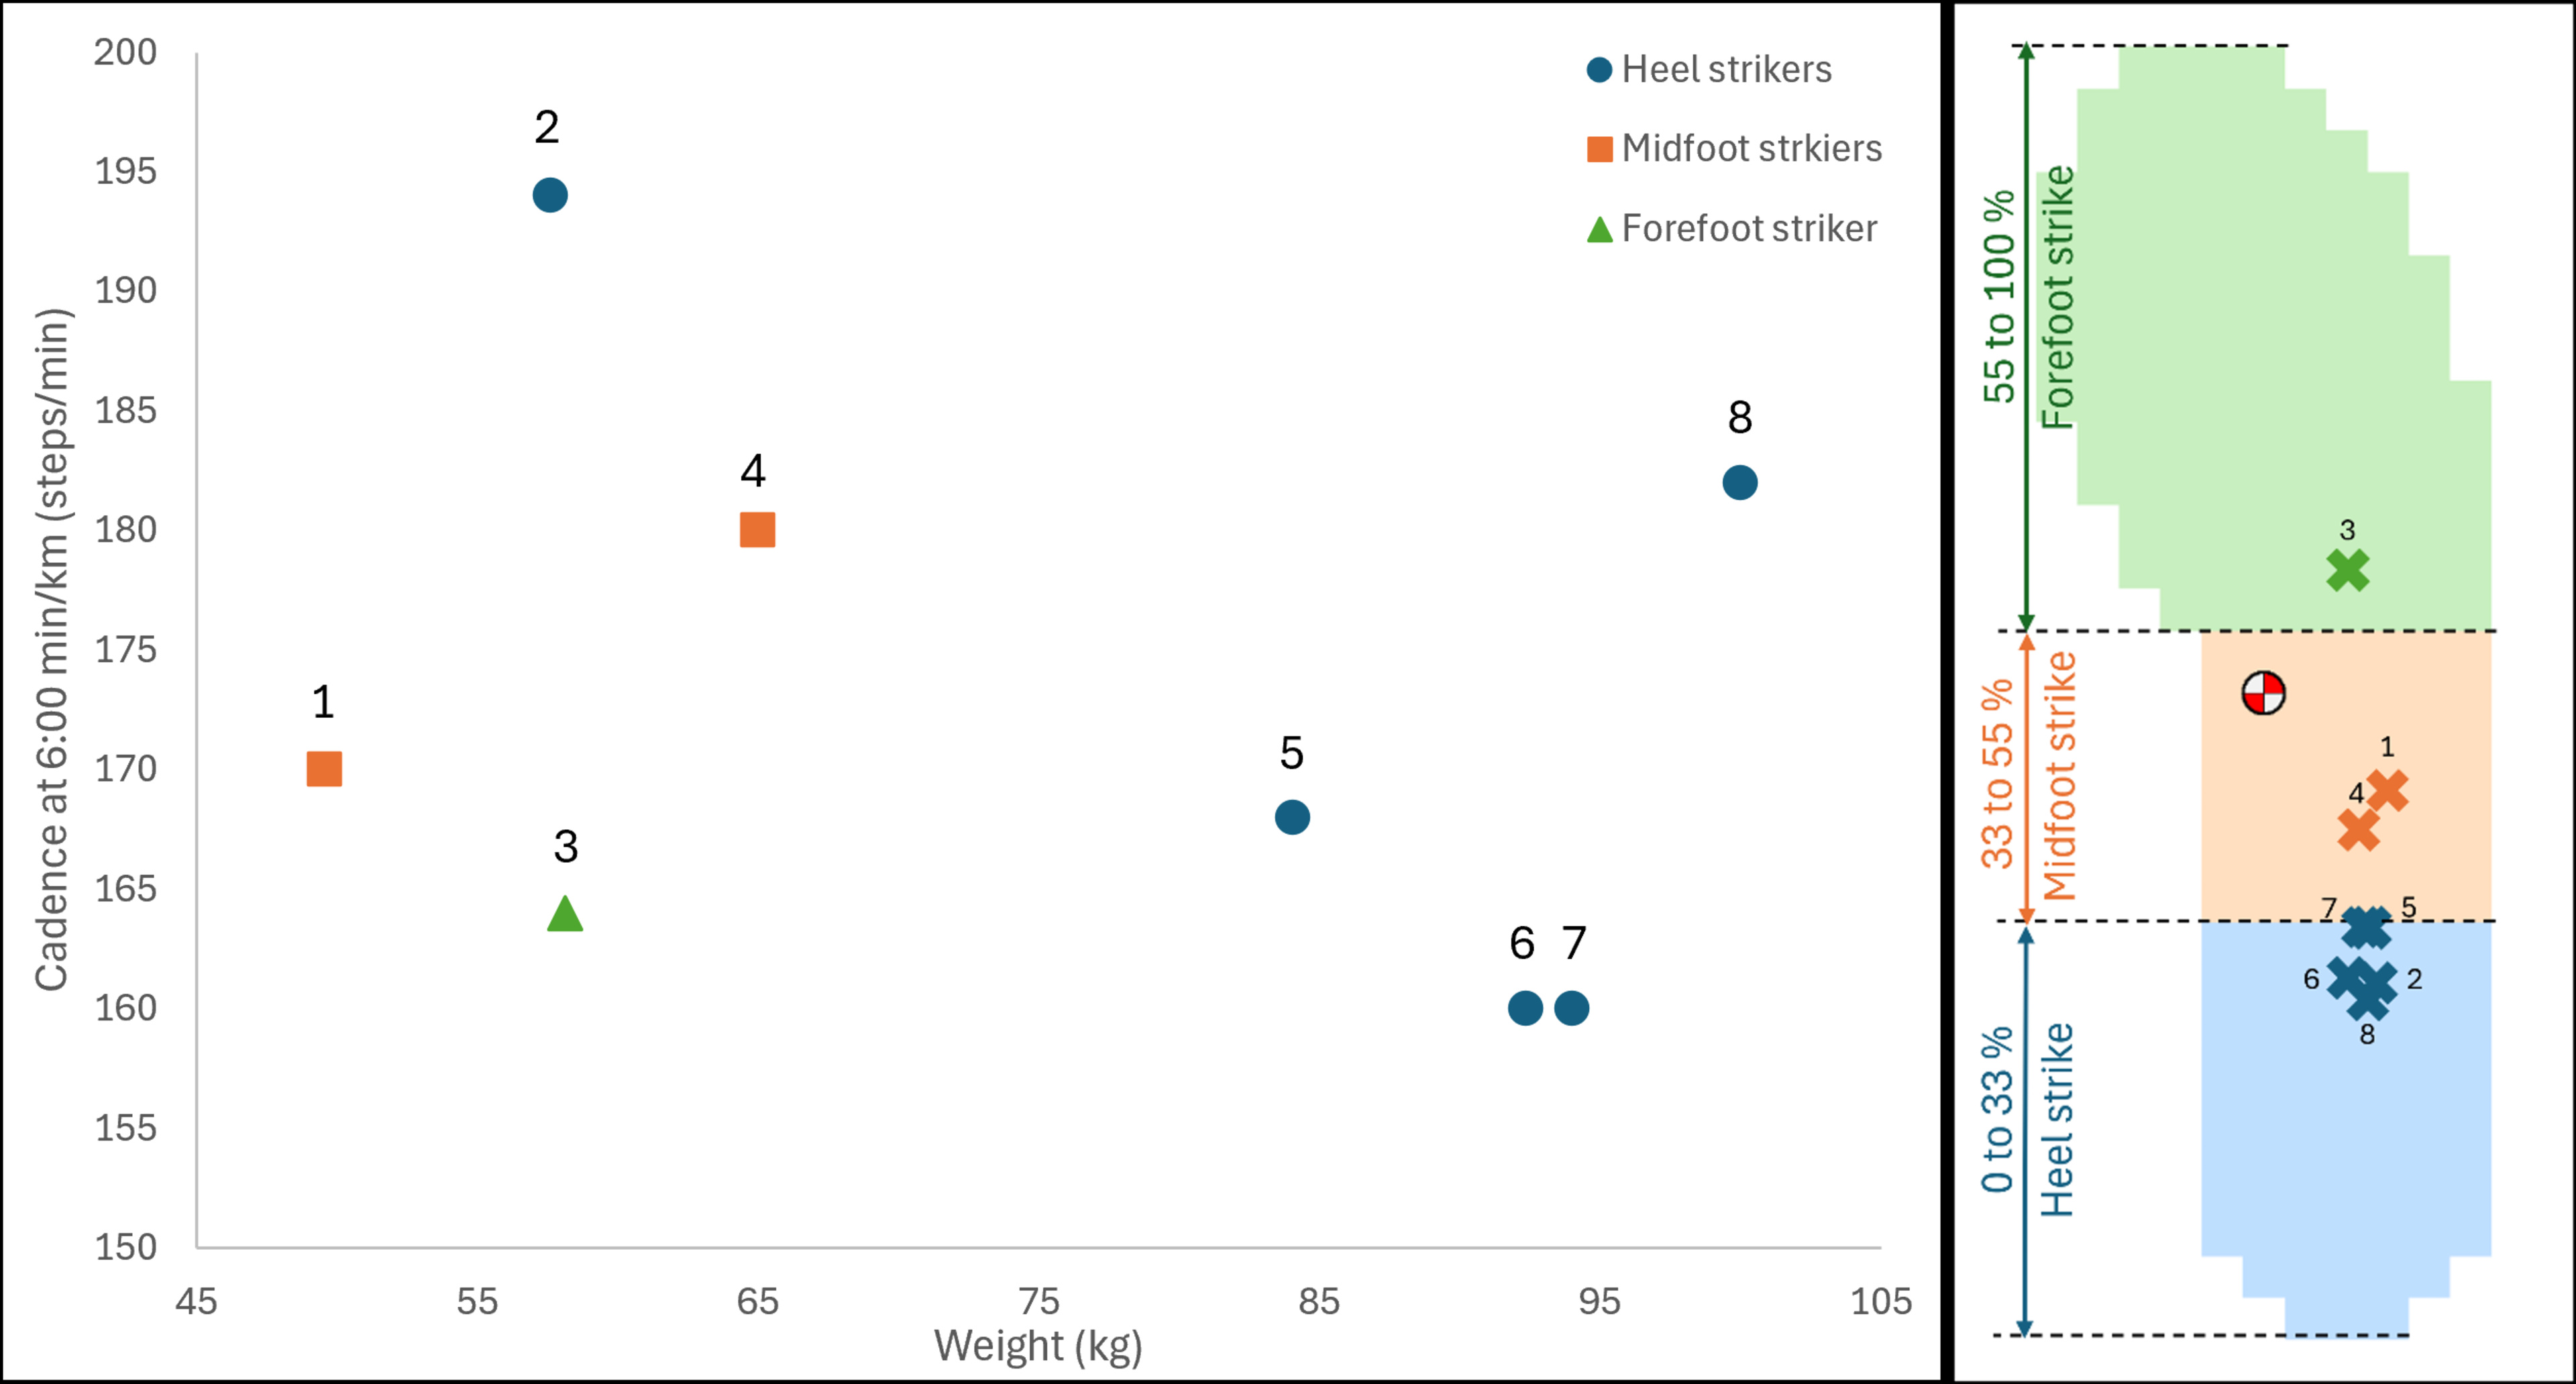
While weight was easily recorded with a scale and cadence directly measured by the insoles, defining the foot strike pattern was less straightforward. To establish a systematic classification, we analyzed the position of the center of pressure at initial ground contact recorded by the insoles for each runner. Three distinct strike patterns emerged: heel strikers were defined as landing between 0% and 33% of foot length, midfoot strikers between 33% and 55%, and forefoot strikers at 55% or more.
Each participant ran in the same shoe, the adidas Adizero Evo SL, at several speeds ranging from 7:00 to 3:00 min/km (8.5 to 20 km/h) depending on the level of the runner. At least one minute per speed was recorded.
Building the Load Recommendation Tables
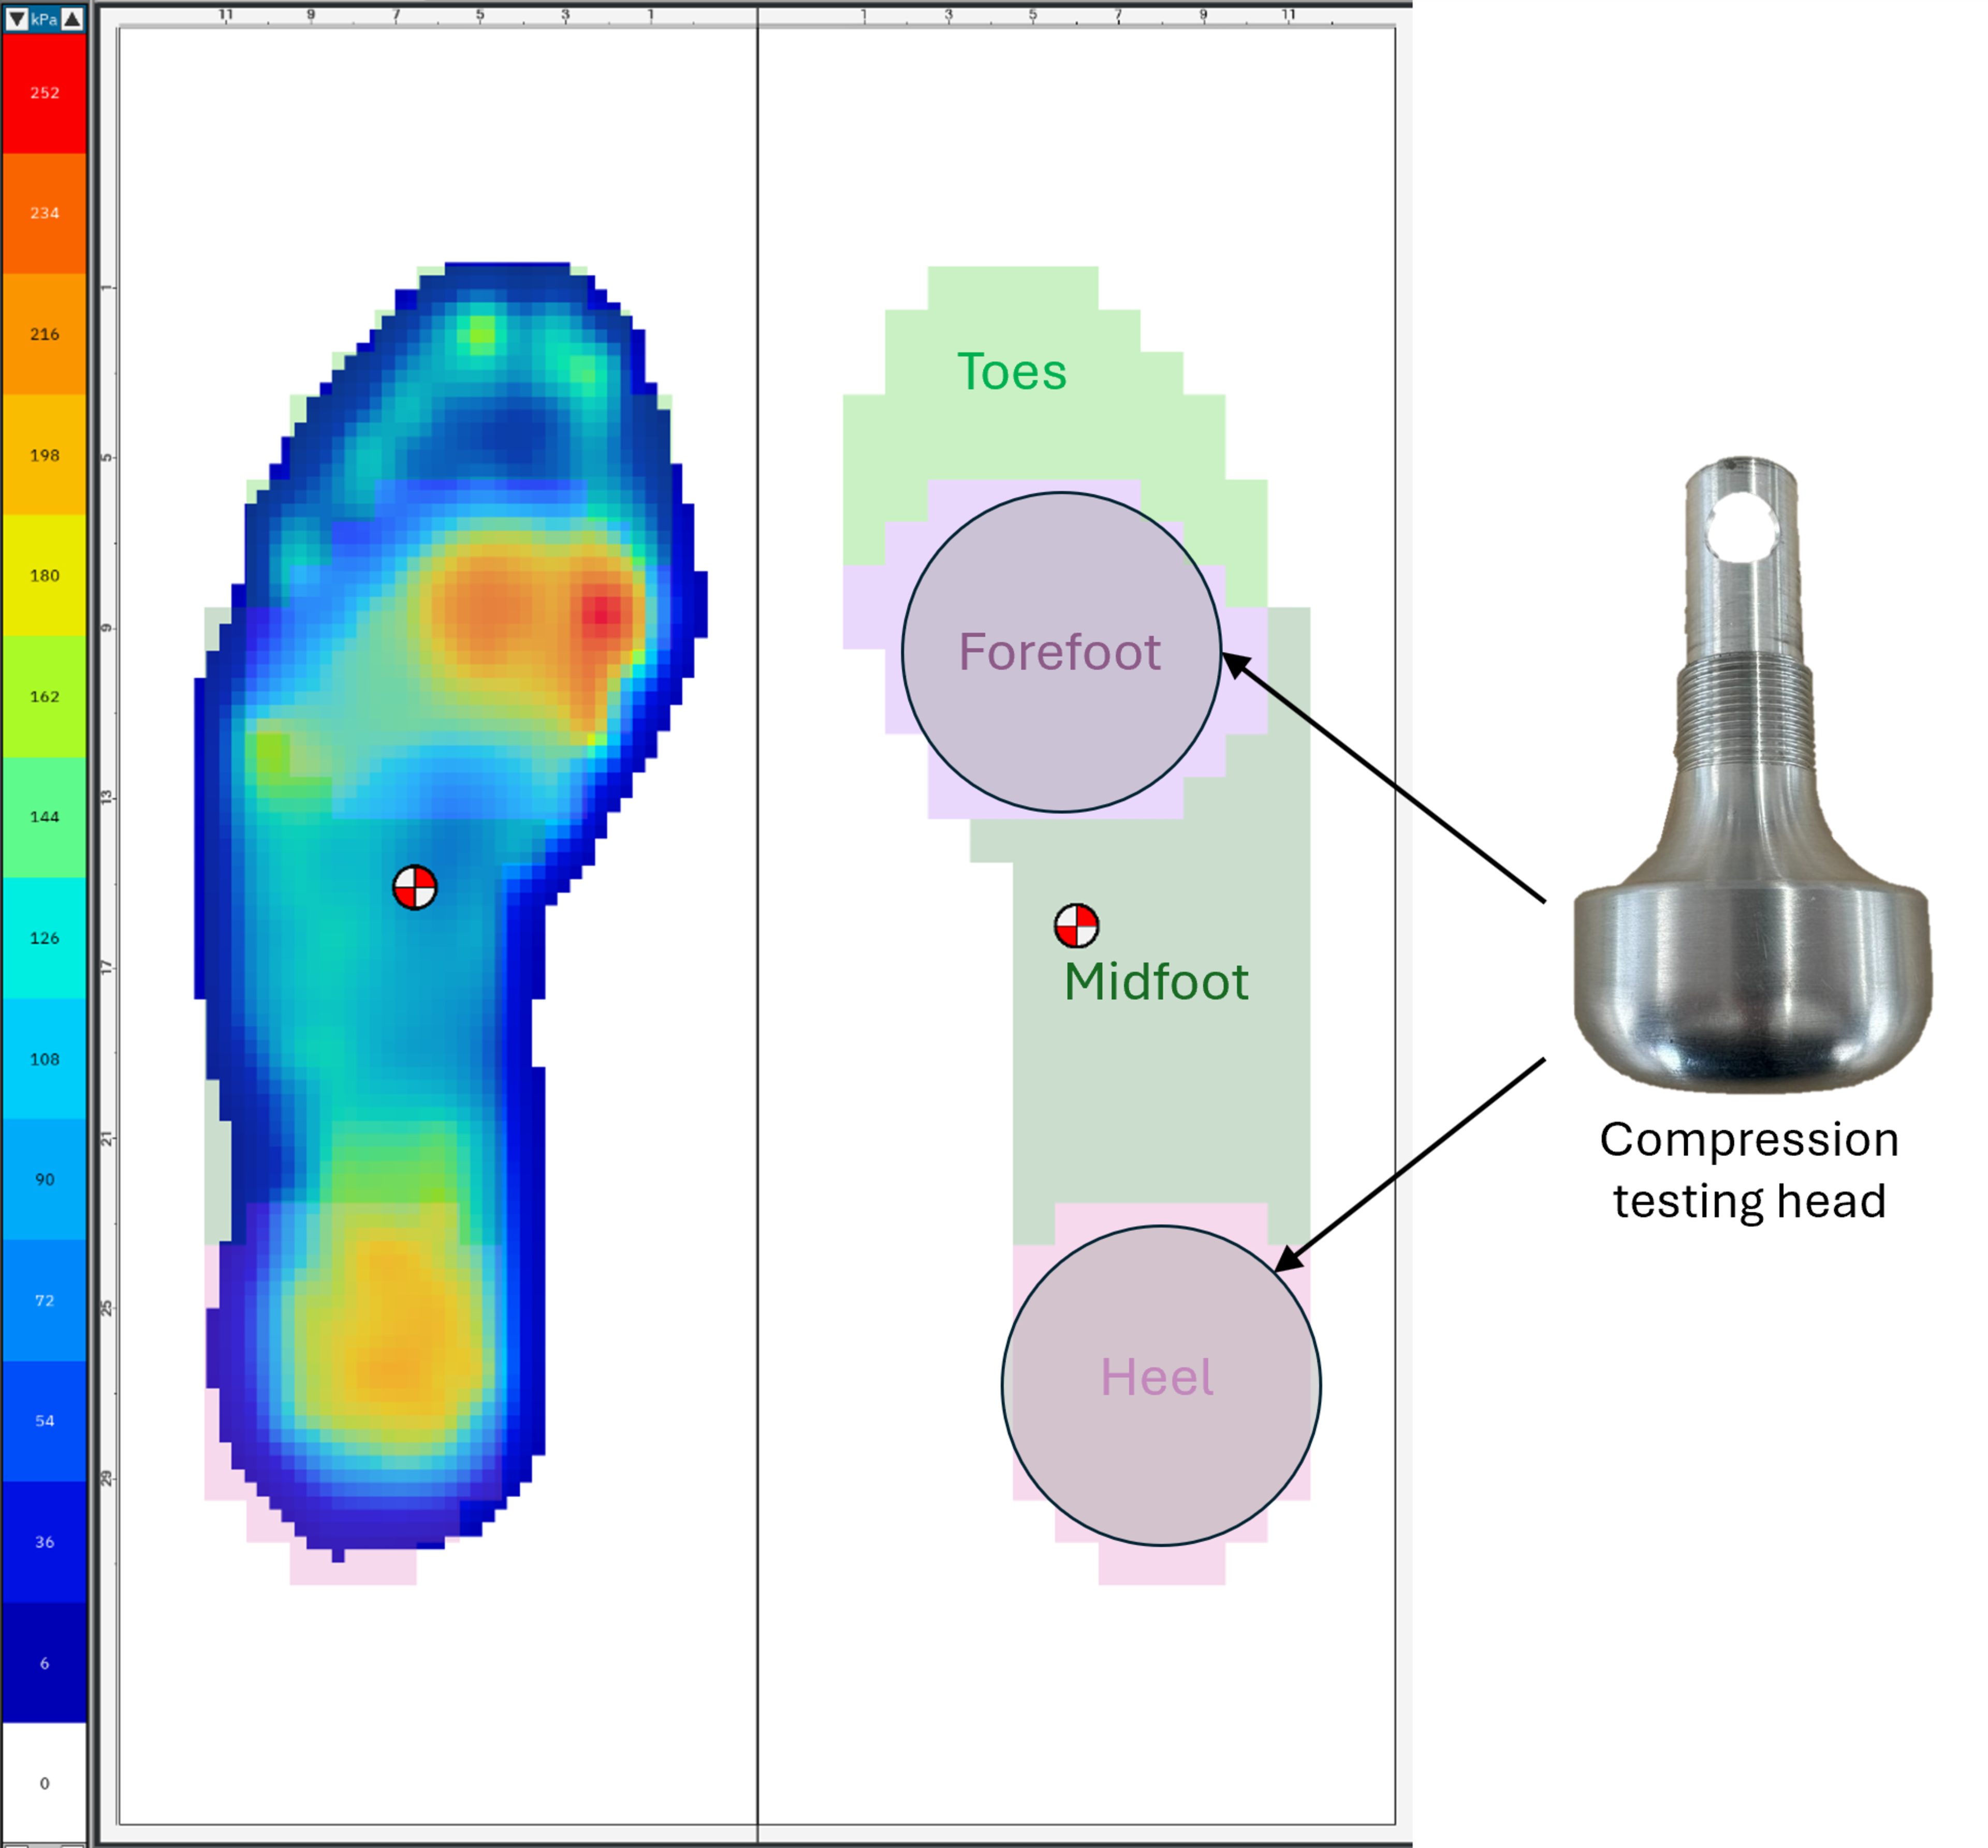
Since our compression tests target specific areas of the foot that match our custom testing head design (see our R&D article), we first made sure that the pressure measurements aligned with those same regions. When necessary, the placement of the testing zone was adjusted, especially in the forefoot, to make sure to capture the areas where each runner applies the greatest compression load and thus deforms the shoe the most.
Forefoot Load Table
Interestingly, neither the foot strike pattern nor cadence significantly affected the load applied in the forefoot. This is likely because the region analyzed corresponds to where the runner pushes off rather than where they land, making it independent of the strike pattern. As to why cadence didn't significantly affect the forefoot load, it might be because weight and speed have a much stronger impact than cadence. Indeed, the trends are clear: the load applied by the runner in the area of interest increases linearly with both speed and weight.
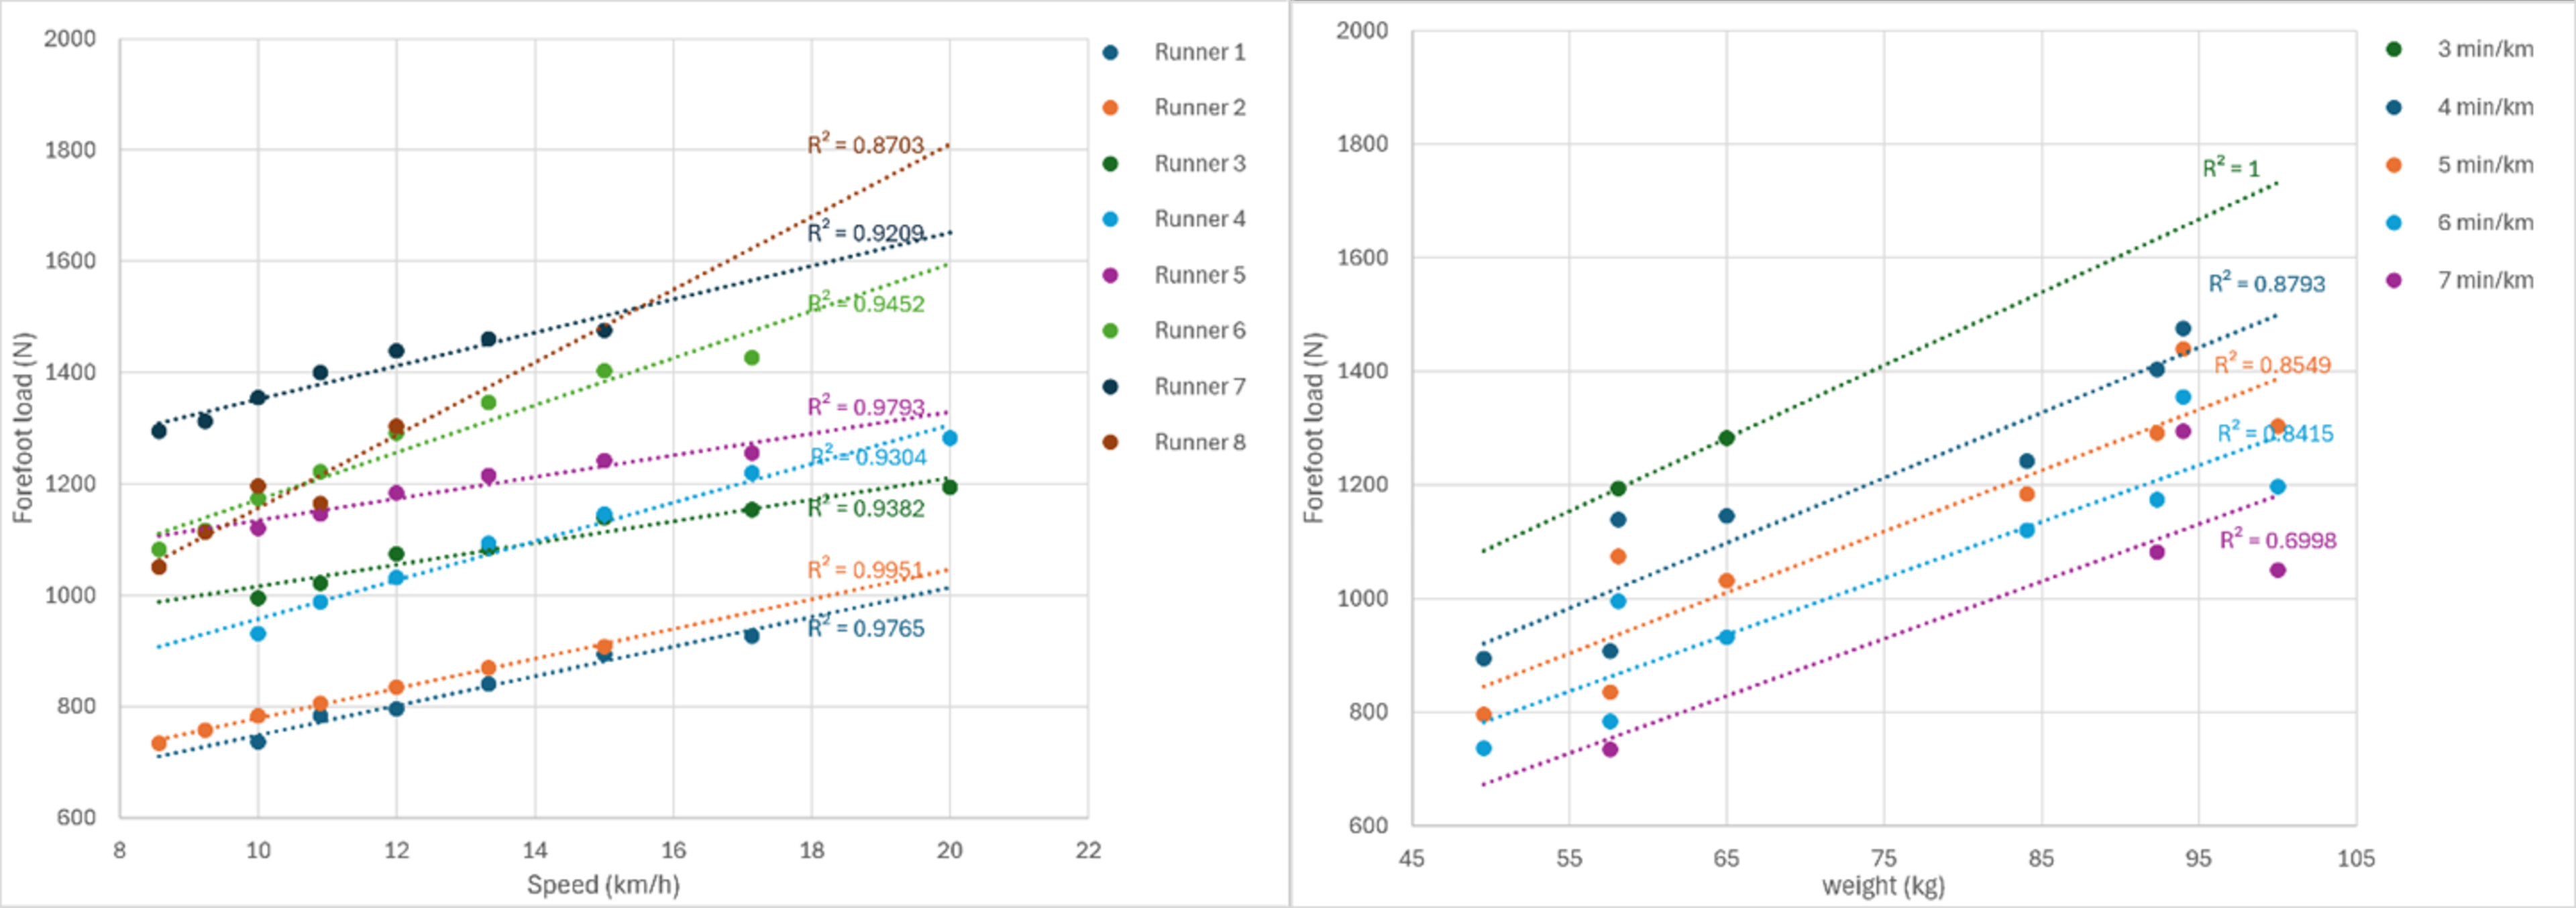
Because of these neat linear relationships, it was possible to model the load as a function of speed and weight with the following empirical equation derived from the results:

Note that speed is in km/h and weight is in kg.
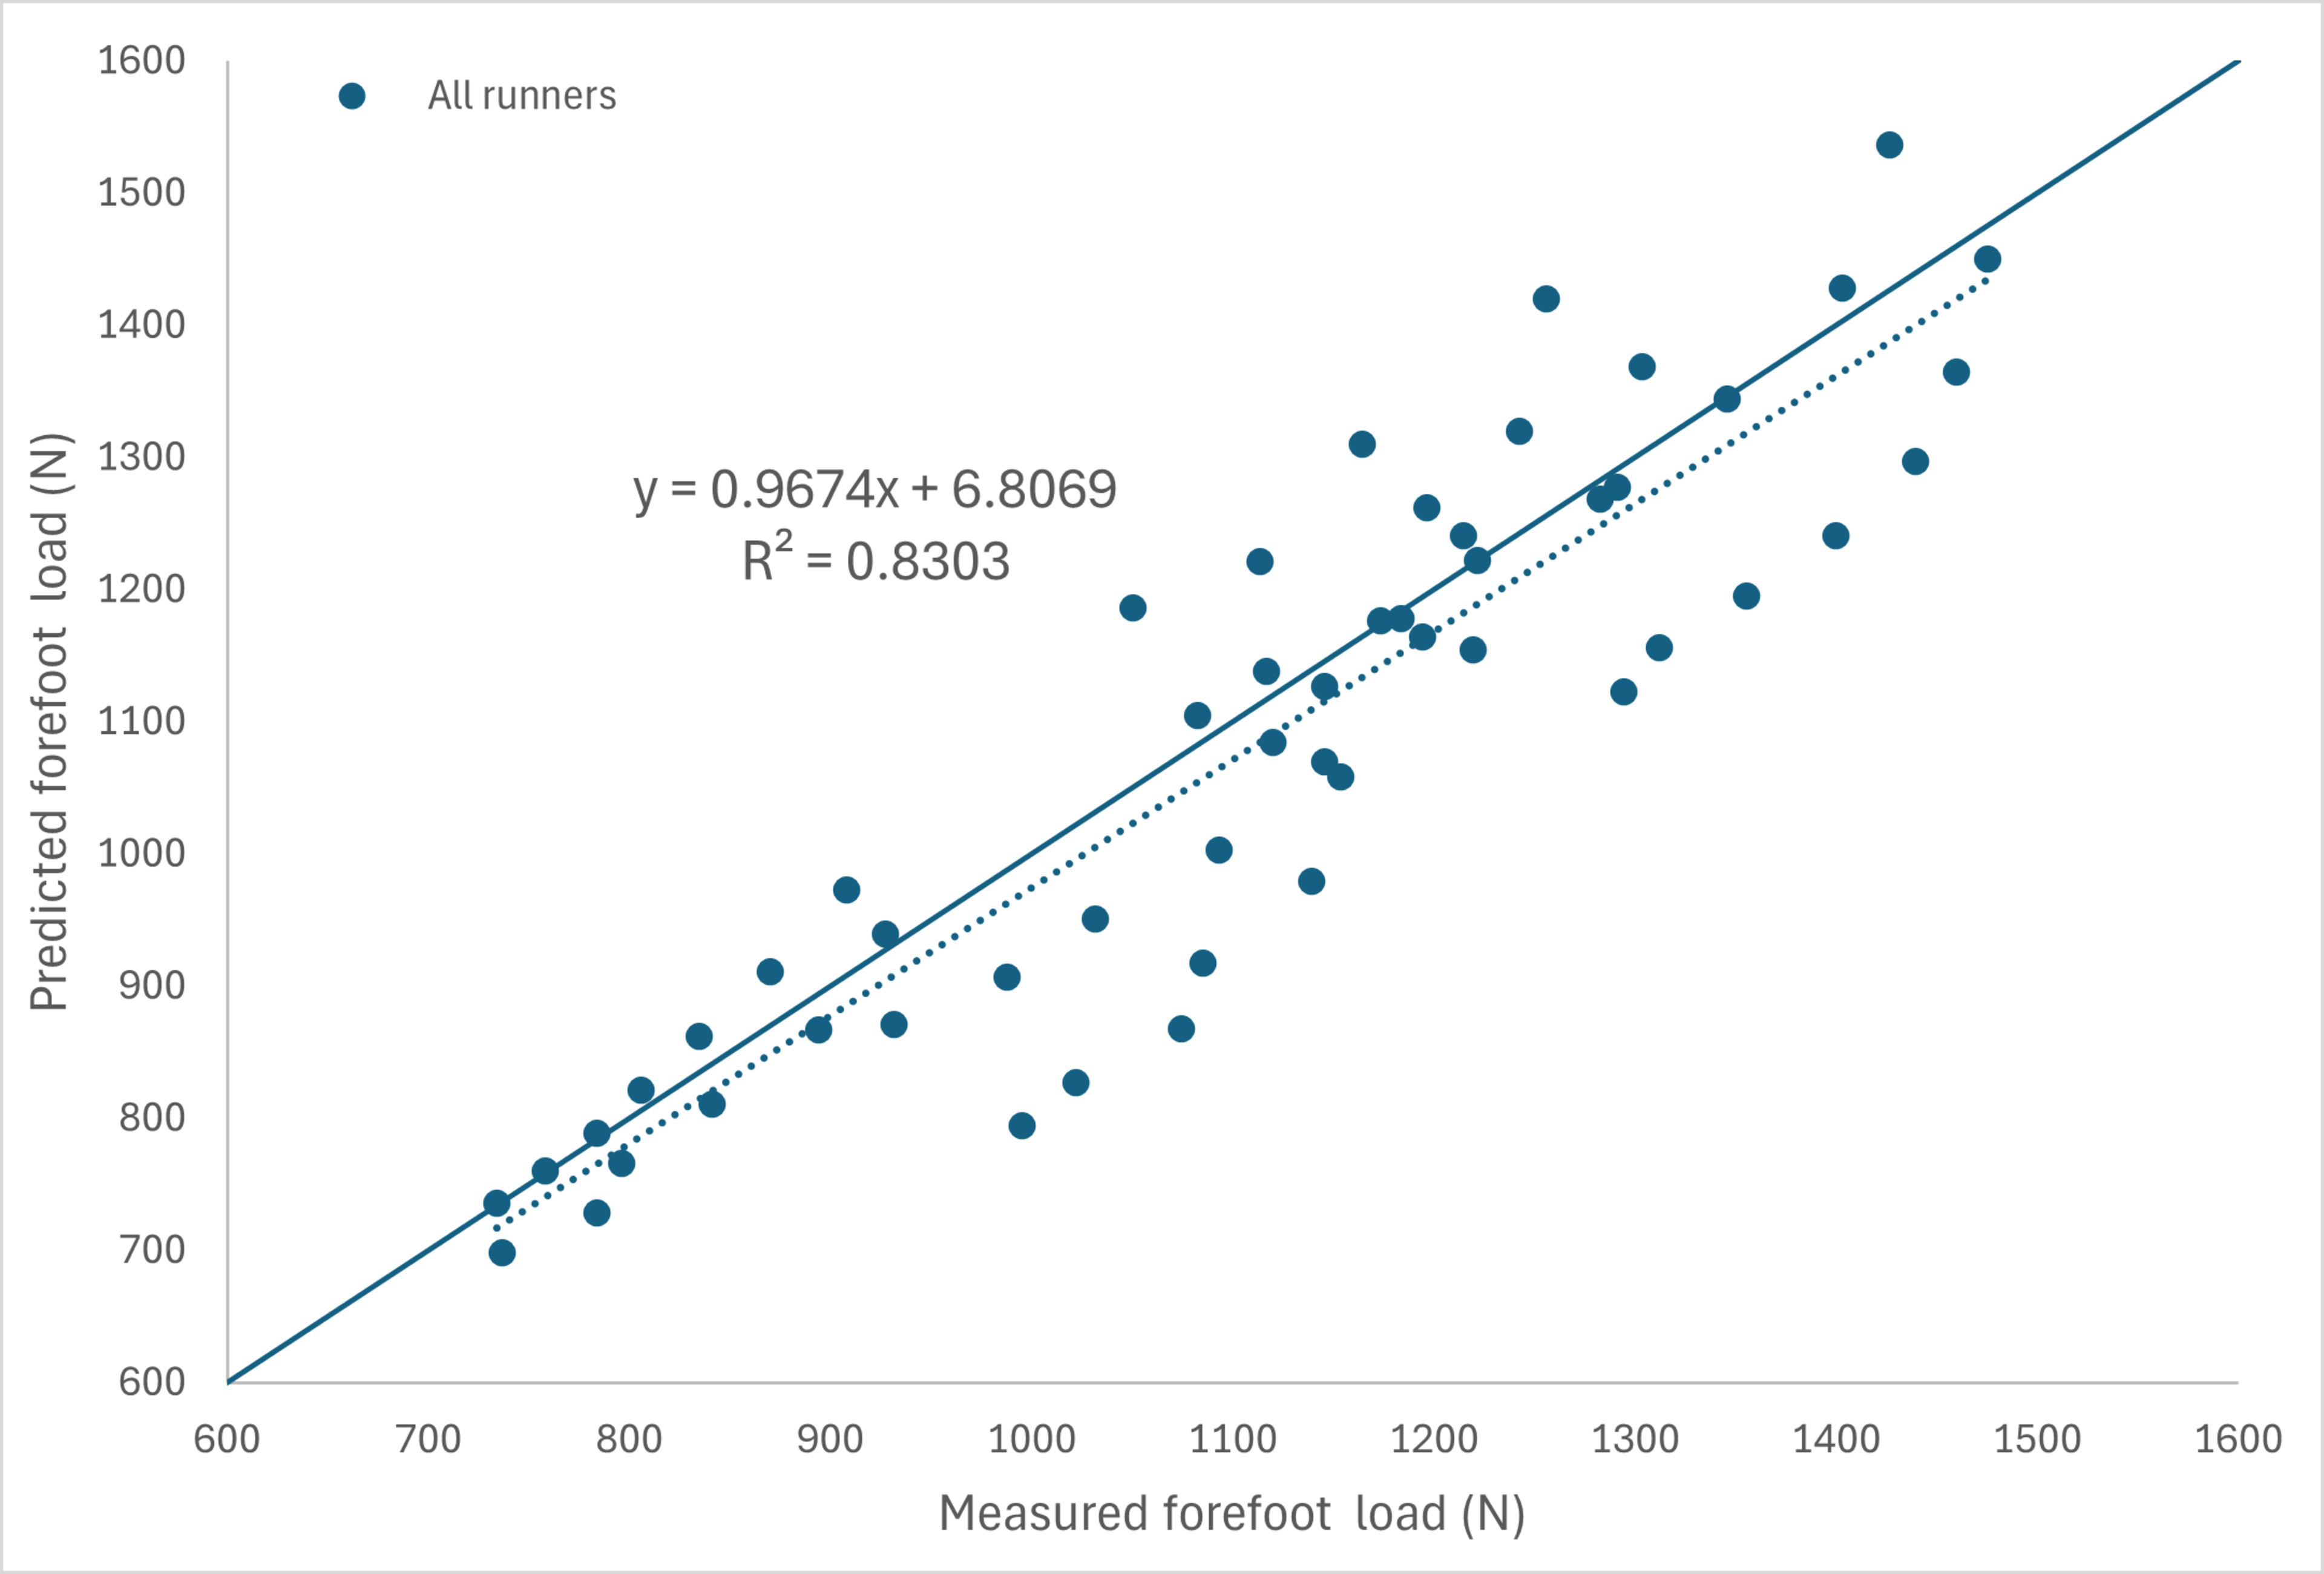
By comparing the loads predicted by this equation with the loads measured by the insoles, it can be concluded that the agreement was strong. The trendline had a slope close to one, the intercept was only 6.8 (close to zero), and the R² value was 0.83, showing a good match between modeled and measured loads.
You may notice, however, that the values shown in the tables are slightly higher than those reported in this section. For example, according to the equation above, an 85 kg runner at 7:00 min/km should generate about 1,100 N of forefoot load, while the introduction mentioned 1,250 N. This difference comes from a systematic 15% offset between the load measured in our testing machine and the load recorded by the insole. To quantify this, we placed the insole on a midsole during compression tests at different set loads and compared the peak loads recorded by both systems.
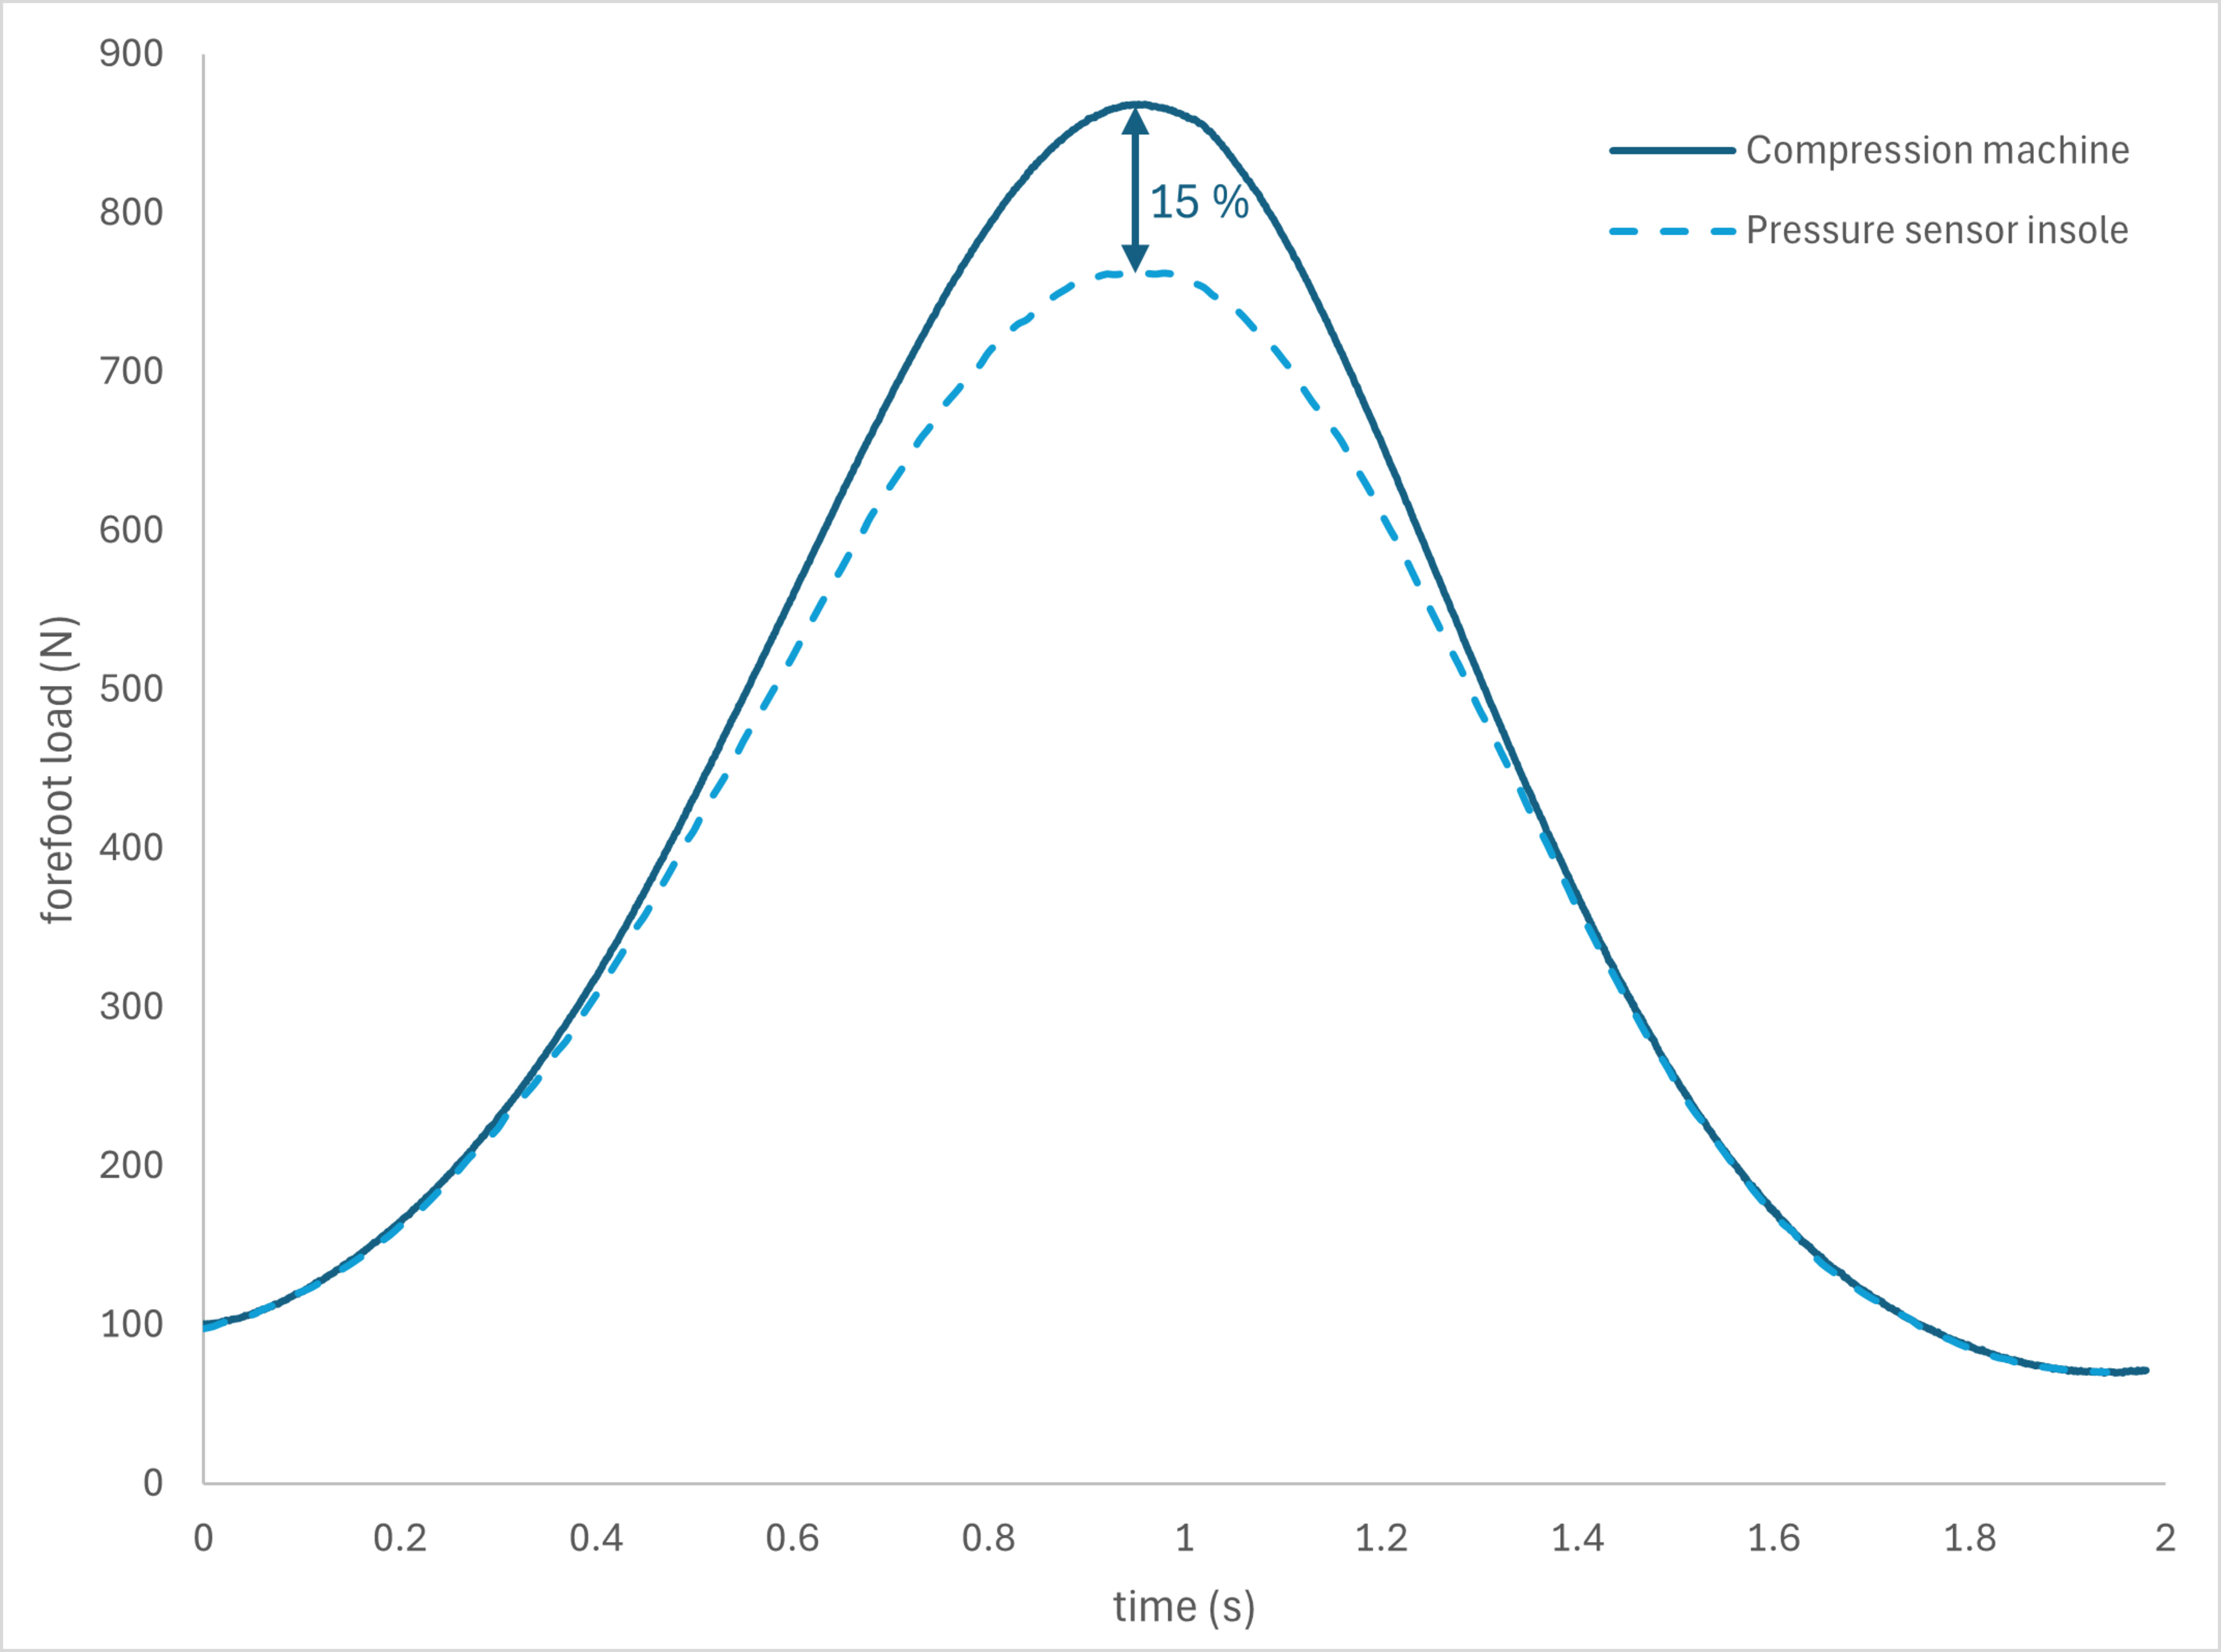
The pressure sensor insole load reported here is calculated by dividing the mean pressure measured by the area. However, as shown by Parker et al. in their study on the accuracy of the XSENSOR in-shoe pressure system, mean pressure values are typically underestimated by about 3–10%. On top of that, there's also a potential error in the measurement of the contact area itself, estimated between 0.68 and 0.86 cm² in the same study, which would reflect on the load value. Together, these factors make a total error of around 15% very consistent with the claims from that paper.
After accounting for this offset, the corrected model for forefoot load becomes:

Note that speed is in km/h and weight is in kg.
This corrected equation reflects the values reported in the tables above, rounded to the nearest 50 N.
Heel Load Table
Modeling heel load proved to be more complex. Plotting load as a function of speed for each runner revealed that trends were highly dependent on foot strike pattern. As expected, heel strikers (runners 2 and 5–8) apply more force on the heel than midfoot or forefoot strikers (runners 1, 3, and 4).
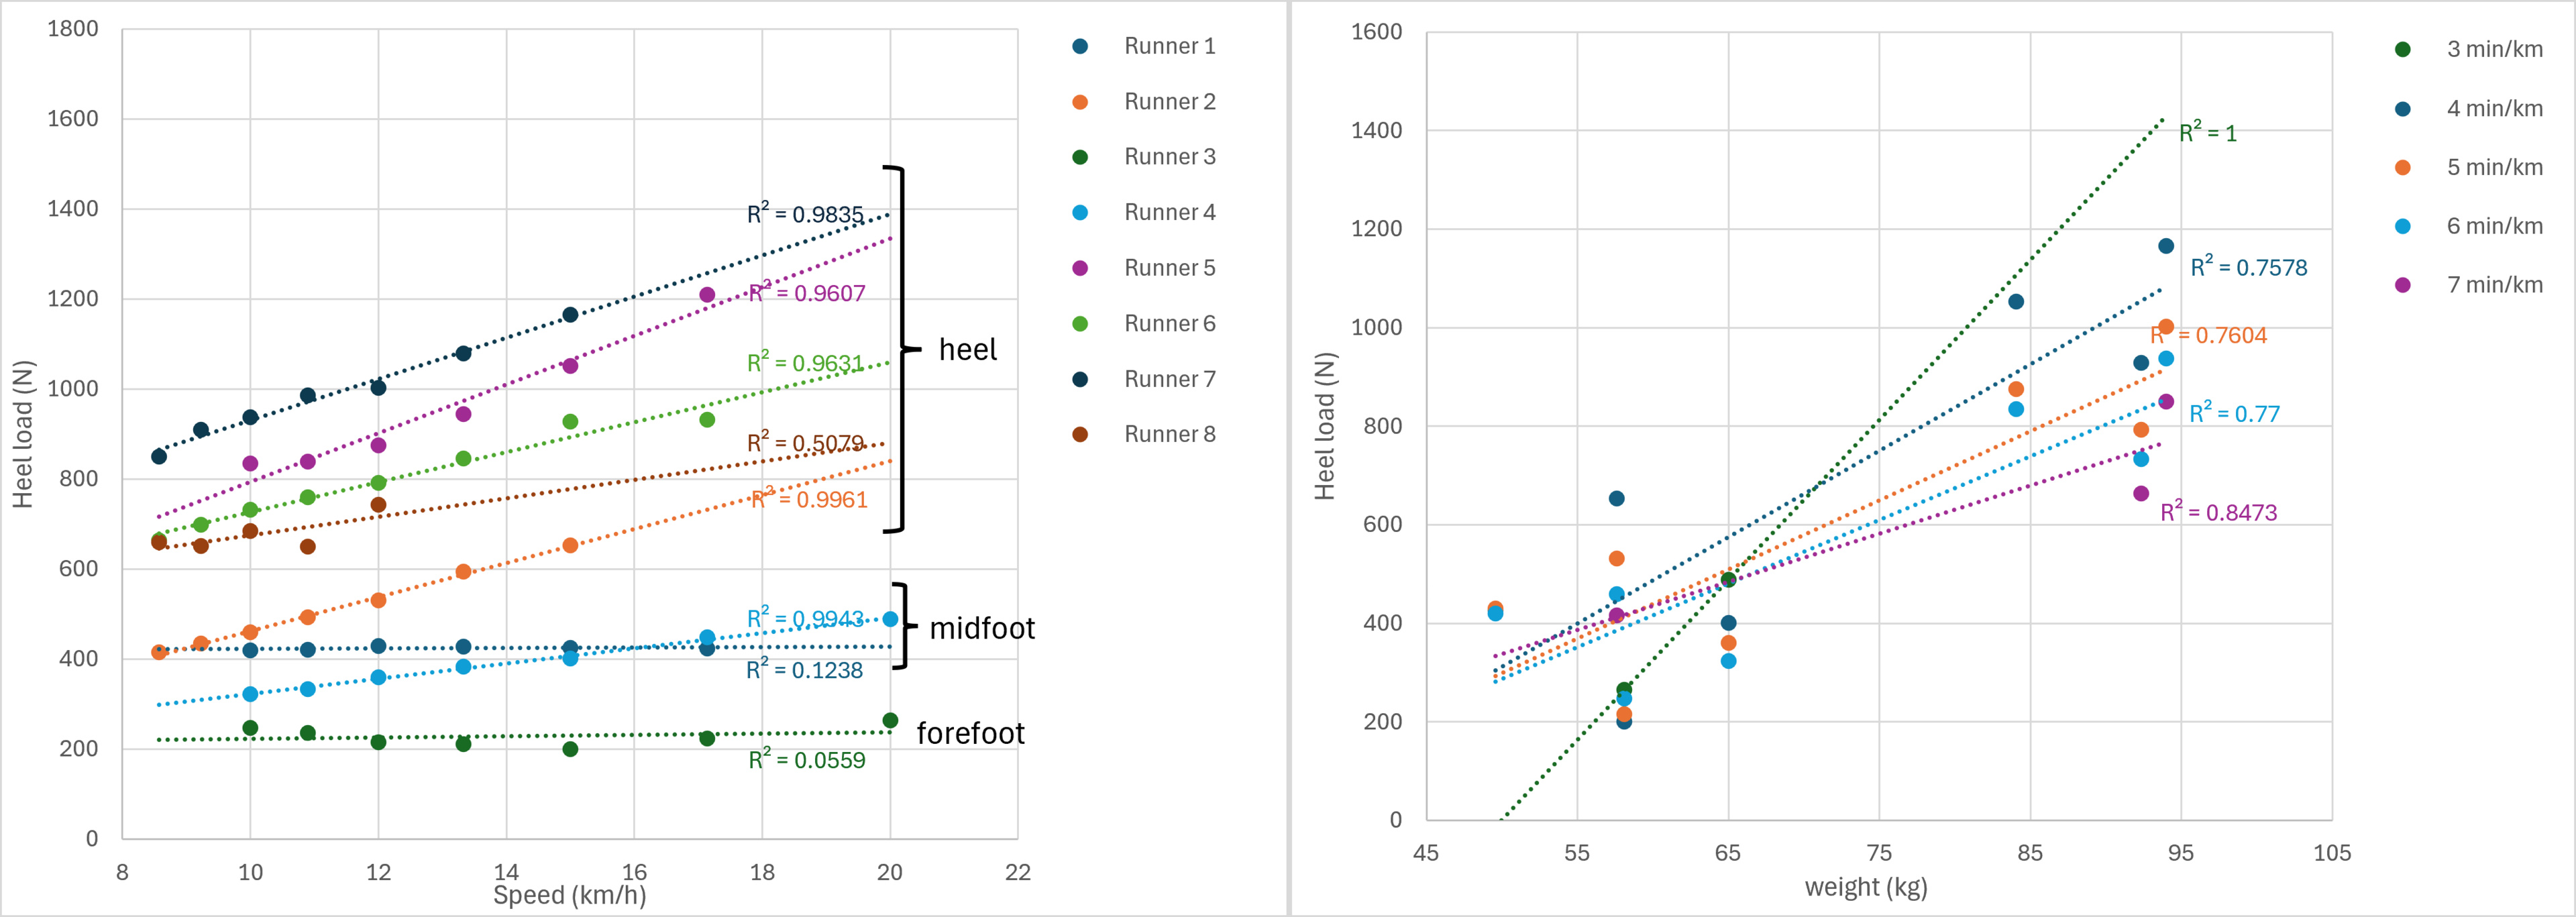
In particular, the forefoot runner applies a consistent heel load across speeds. In the case of midfoot runners, one increased heel load with speed in a manner similar to heel strikers, while the other maintained a consistent load similar to the forefoot runner. A larger sample would be required to draw reliable conclusions for midfoot and forefoot runners; consequently, only heel strikers were included in the final analysis.
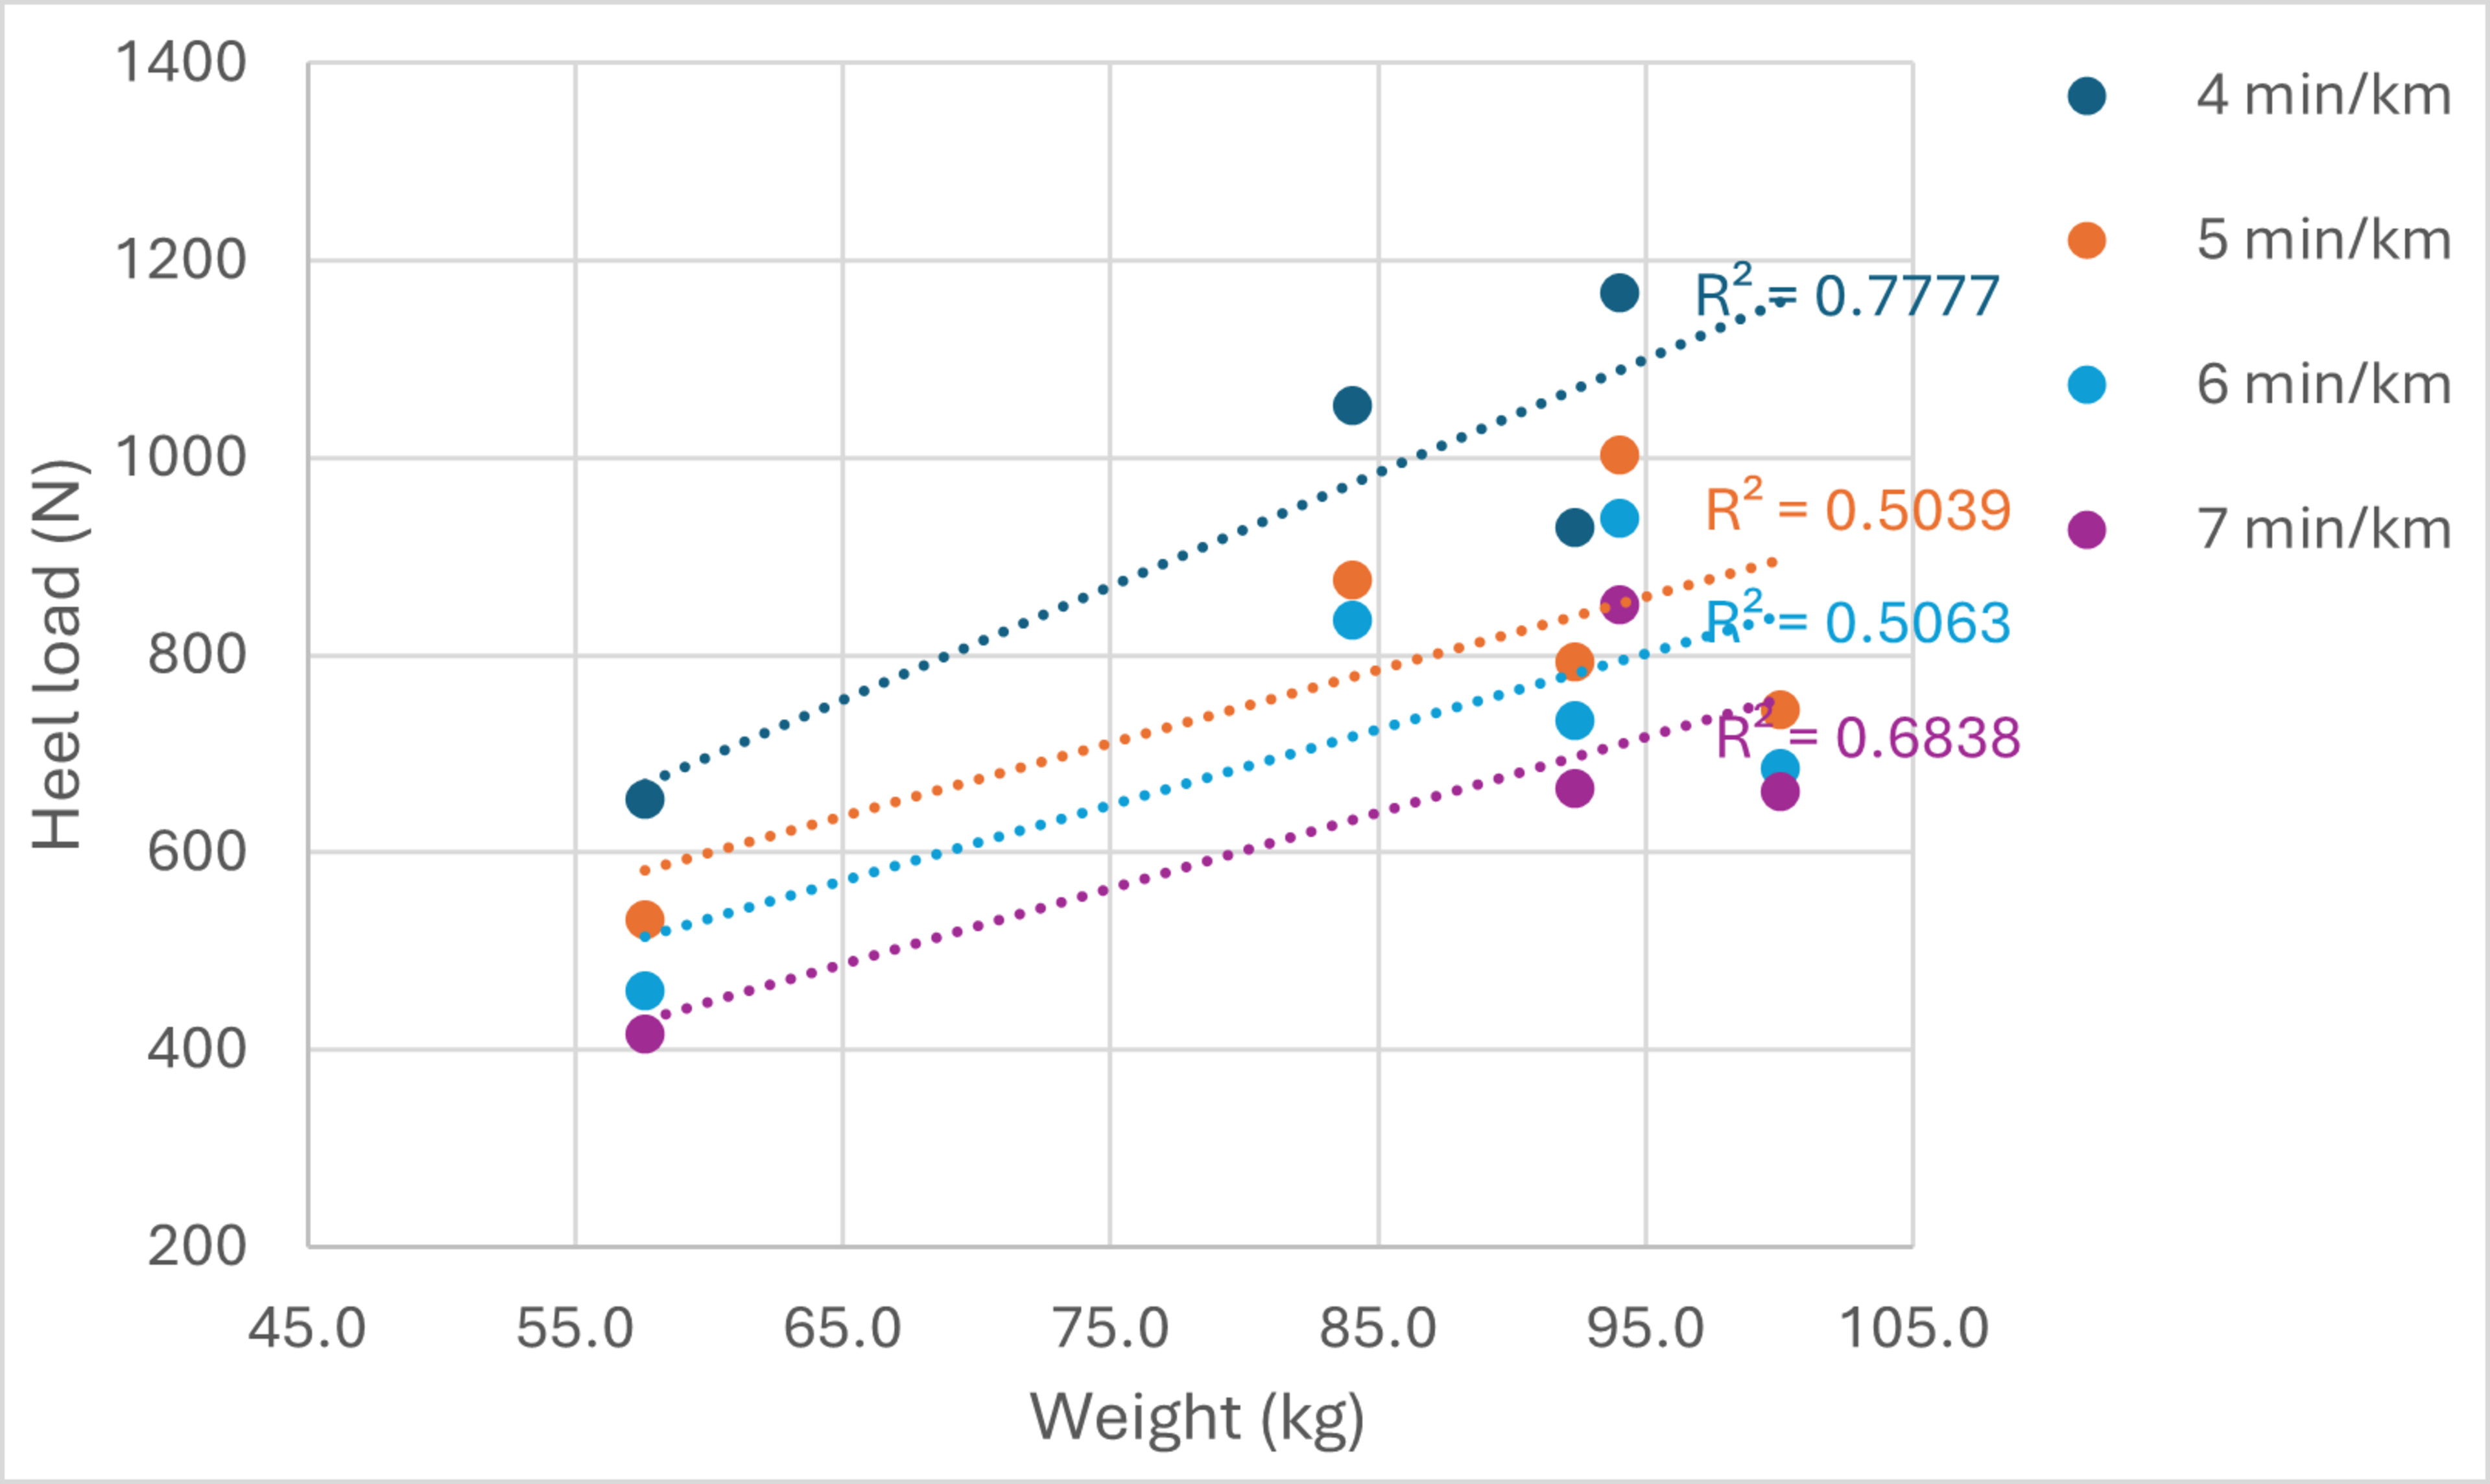
Even then, when plotting heel load as a function of weight using only heel strikers, another issue arose. While the overall trend became clearer, the R² values were further from 1, indicating that there was still something missing. This led us to think that cadence should be considered since the lower the cadence, the higher the heel load. After testing several models, the best fit formula was identified to be the following:

Note that speed is in km/h, weight is in kg, and cadence is in steps/min.
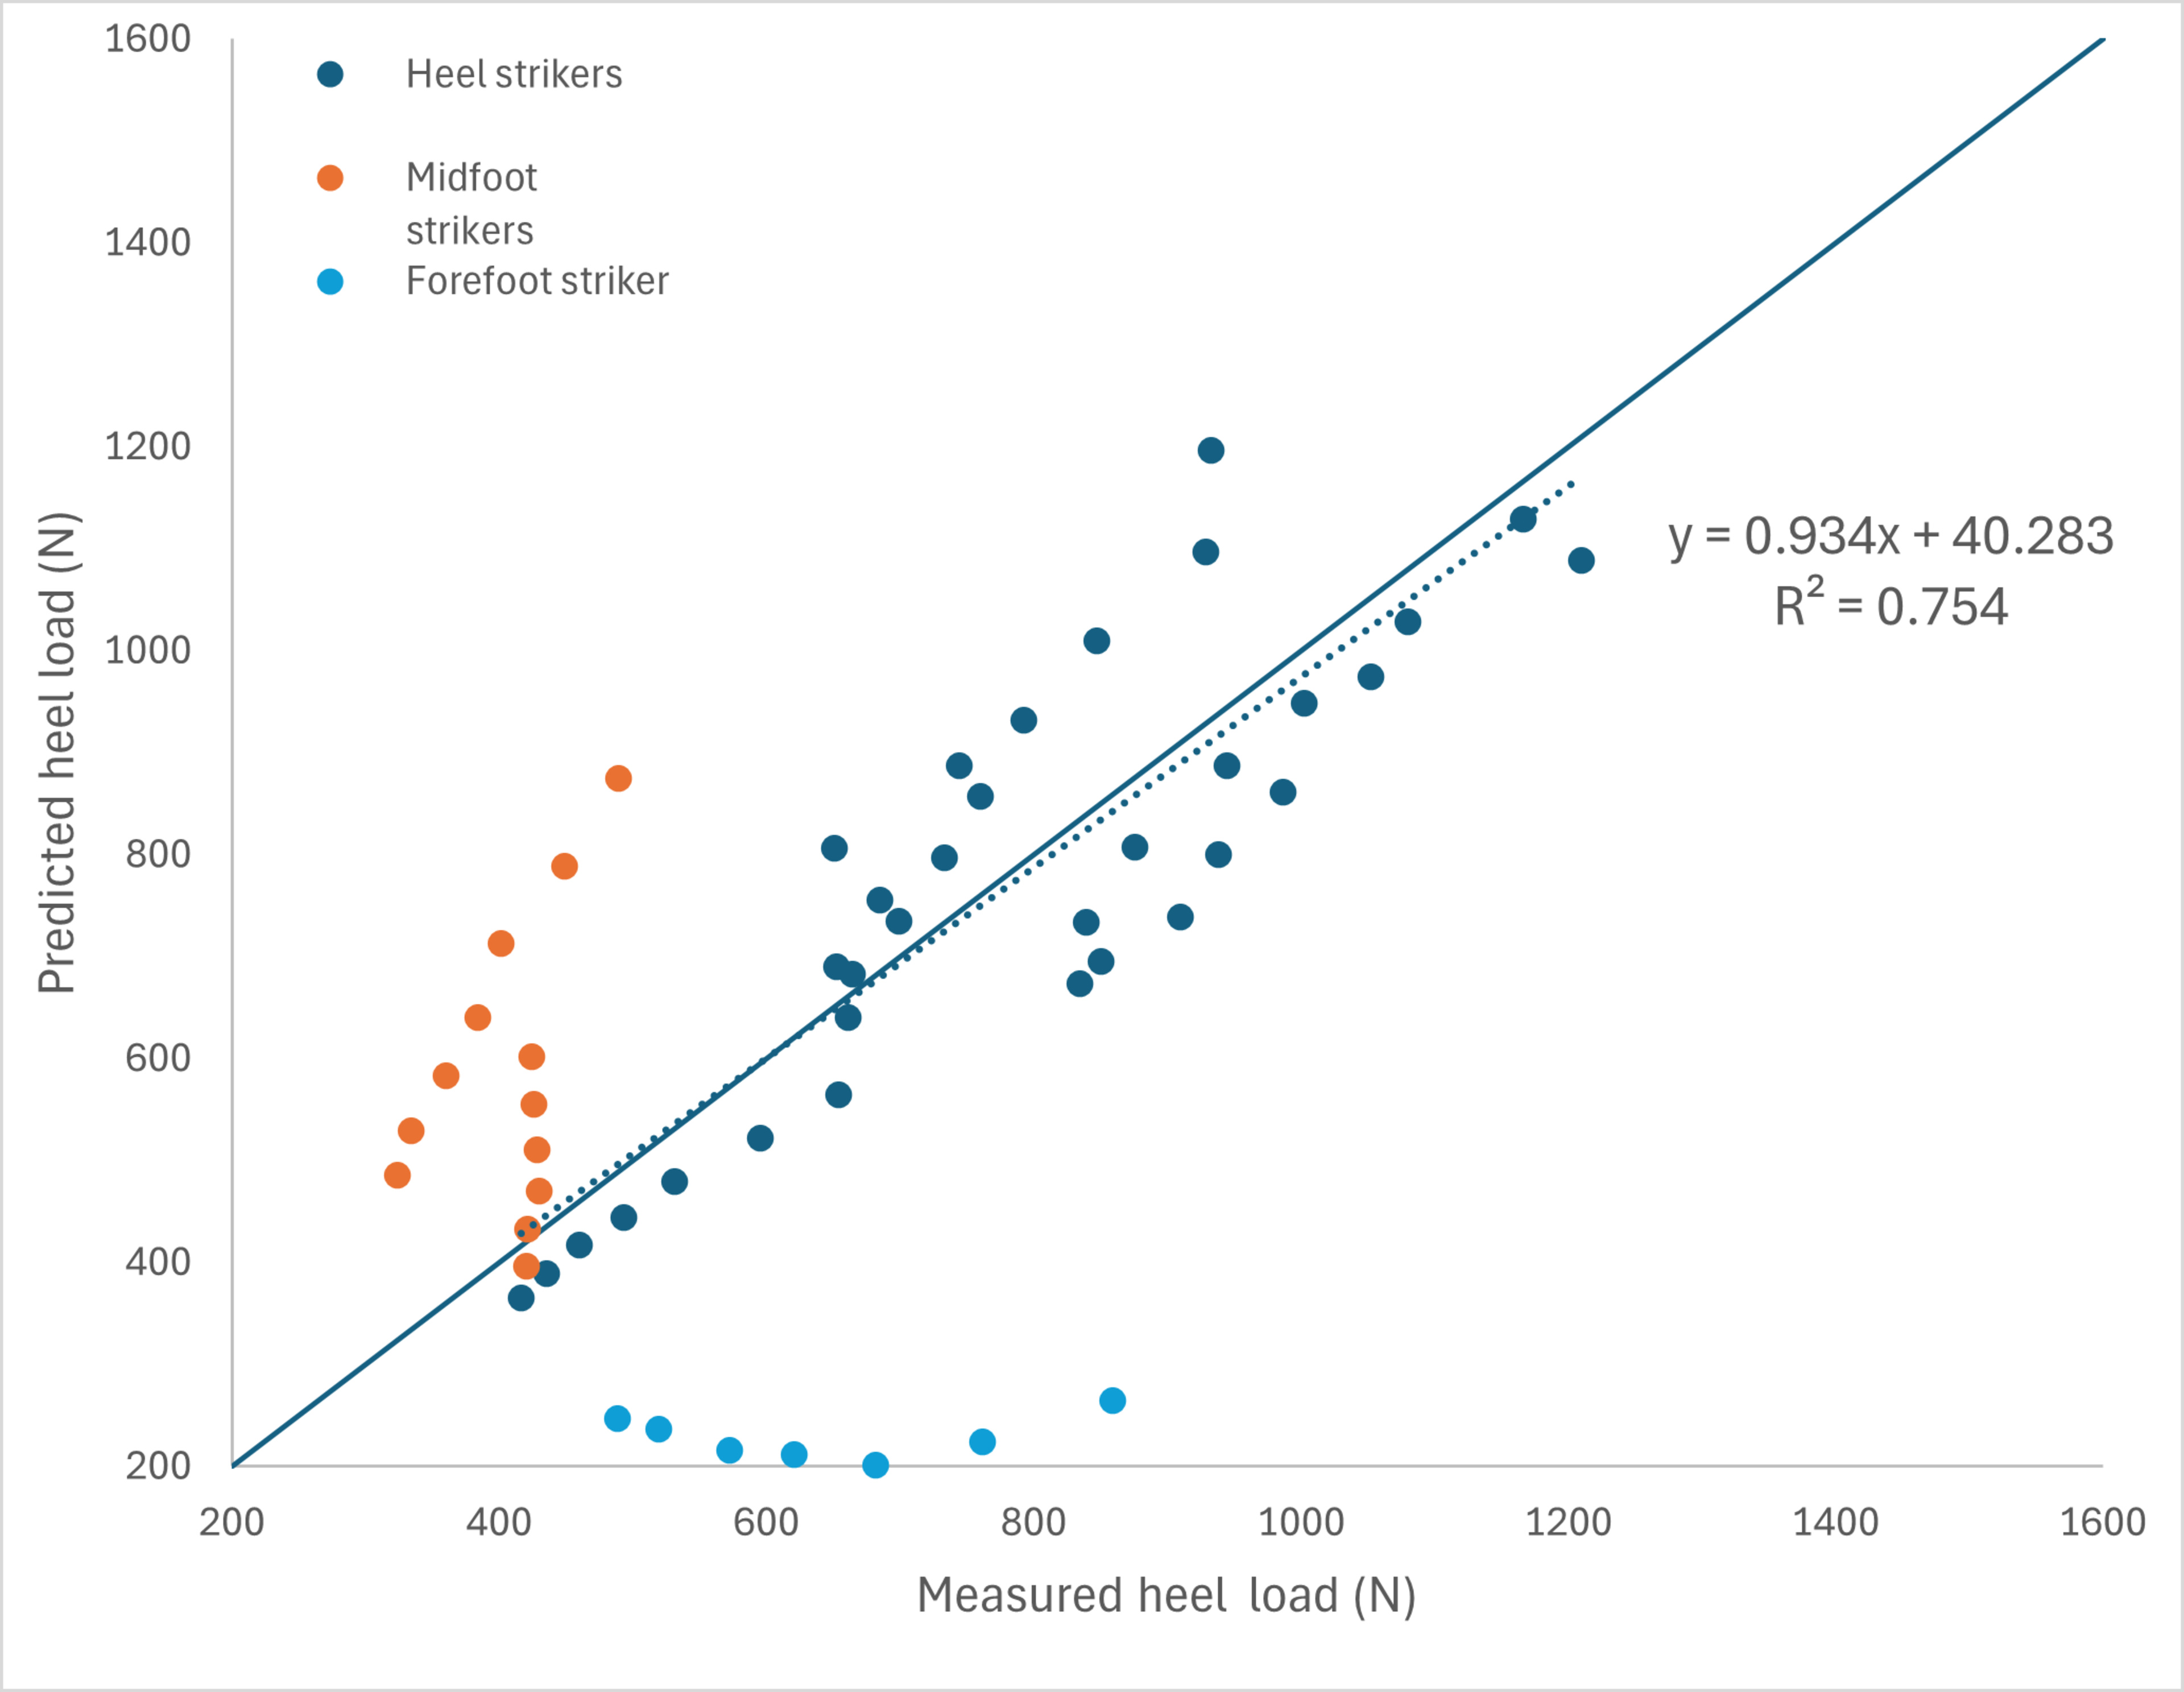
Plotting the predicted versus measured load shows that the model performs well for heel strikers (dark blue) as the trendline has a slope close to 1 and an R² of 0.75. The y-intercept of 40 suggests a slight overestimation of load. In contrast, this model doesn't adequately predict the load of midfoot (orange) and forefoot (light blue) runners.
The offset between the insole and the compression machine was measured to be 43% in the heel, much higher than in the forefoot. We currently don't have a definitive explanation for this difference, though it's possible that some of the pressure applied and measured by the machine is "lost" along the sides of the insole, meaning it's not recorded by the insole because of geometry constraints. Taking this offset into account, the final model becomes:

Note that speed is in km/h, weight is in kg, and cadence is in steps/min.
These results and the modeling process formed the load tables introduced earlier and are designed to guide runners in selecting their next pair of running shoes. Table values are rounded to the nearest 50 N, reflecting the expected accuracy of the model.
Why the Compression Test Needed an Update
The analysis of the insoles' results indicated that our previous maximum load was not representative of reality. 900 N was originally assumed to correspond to a 113 kg person running at 5 min/km, but the data suggests it reflects a 50 kg person at the same pace. To cover the full range of forces applied by the running population, it became necessary to test up to higher load values, requiring an adjustment to the load pattern.
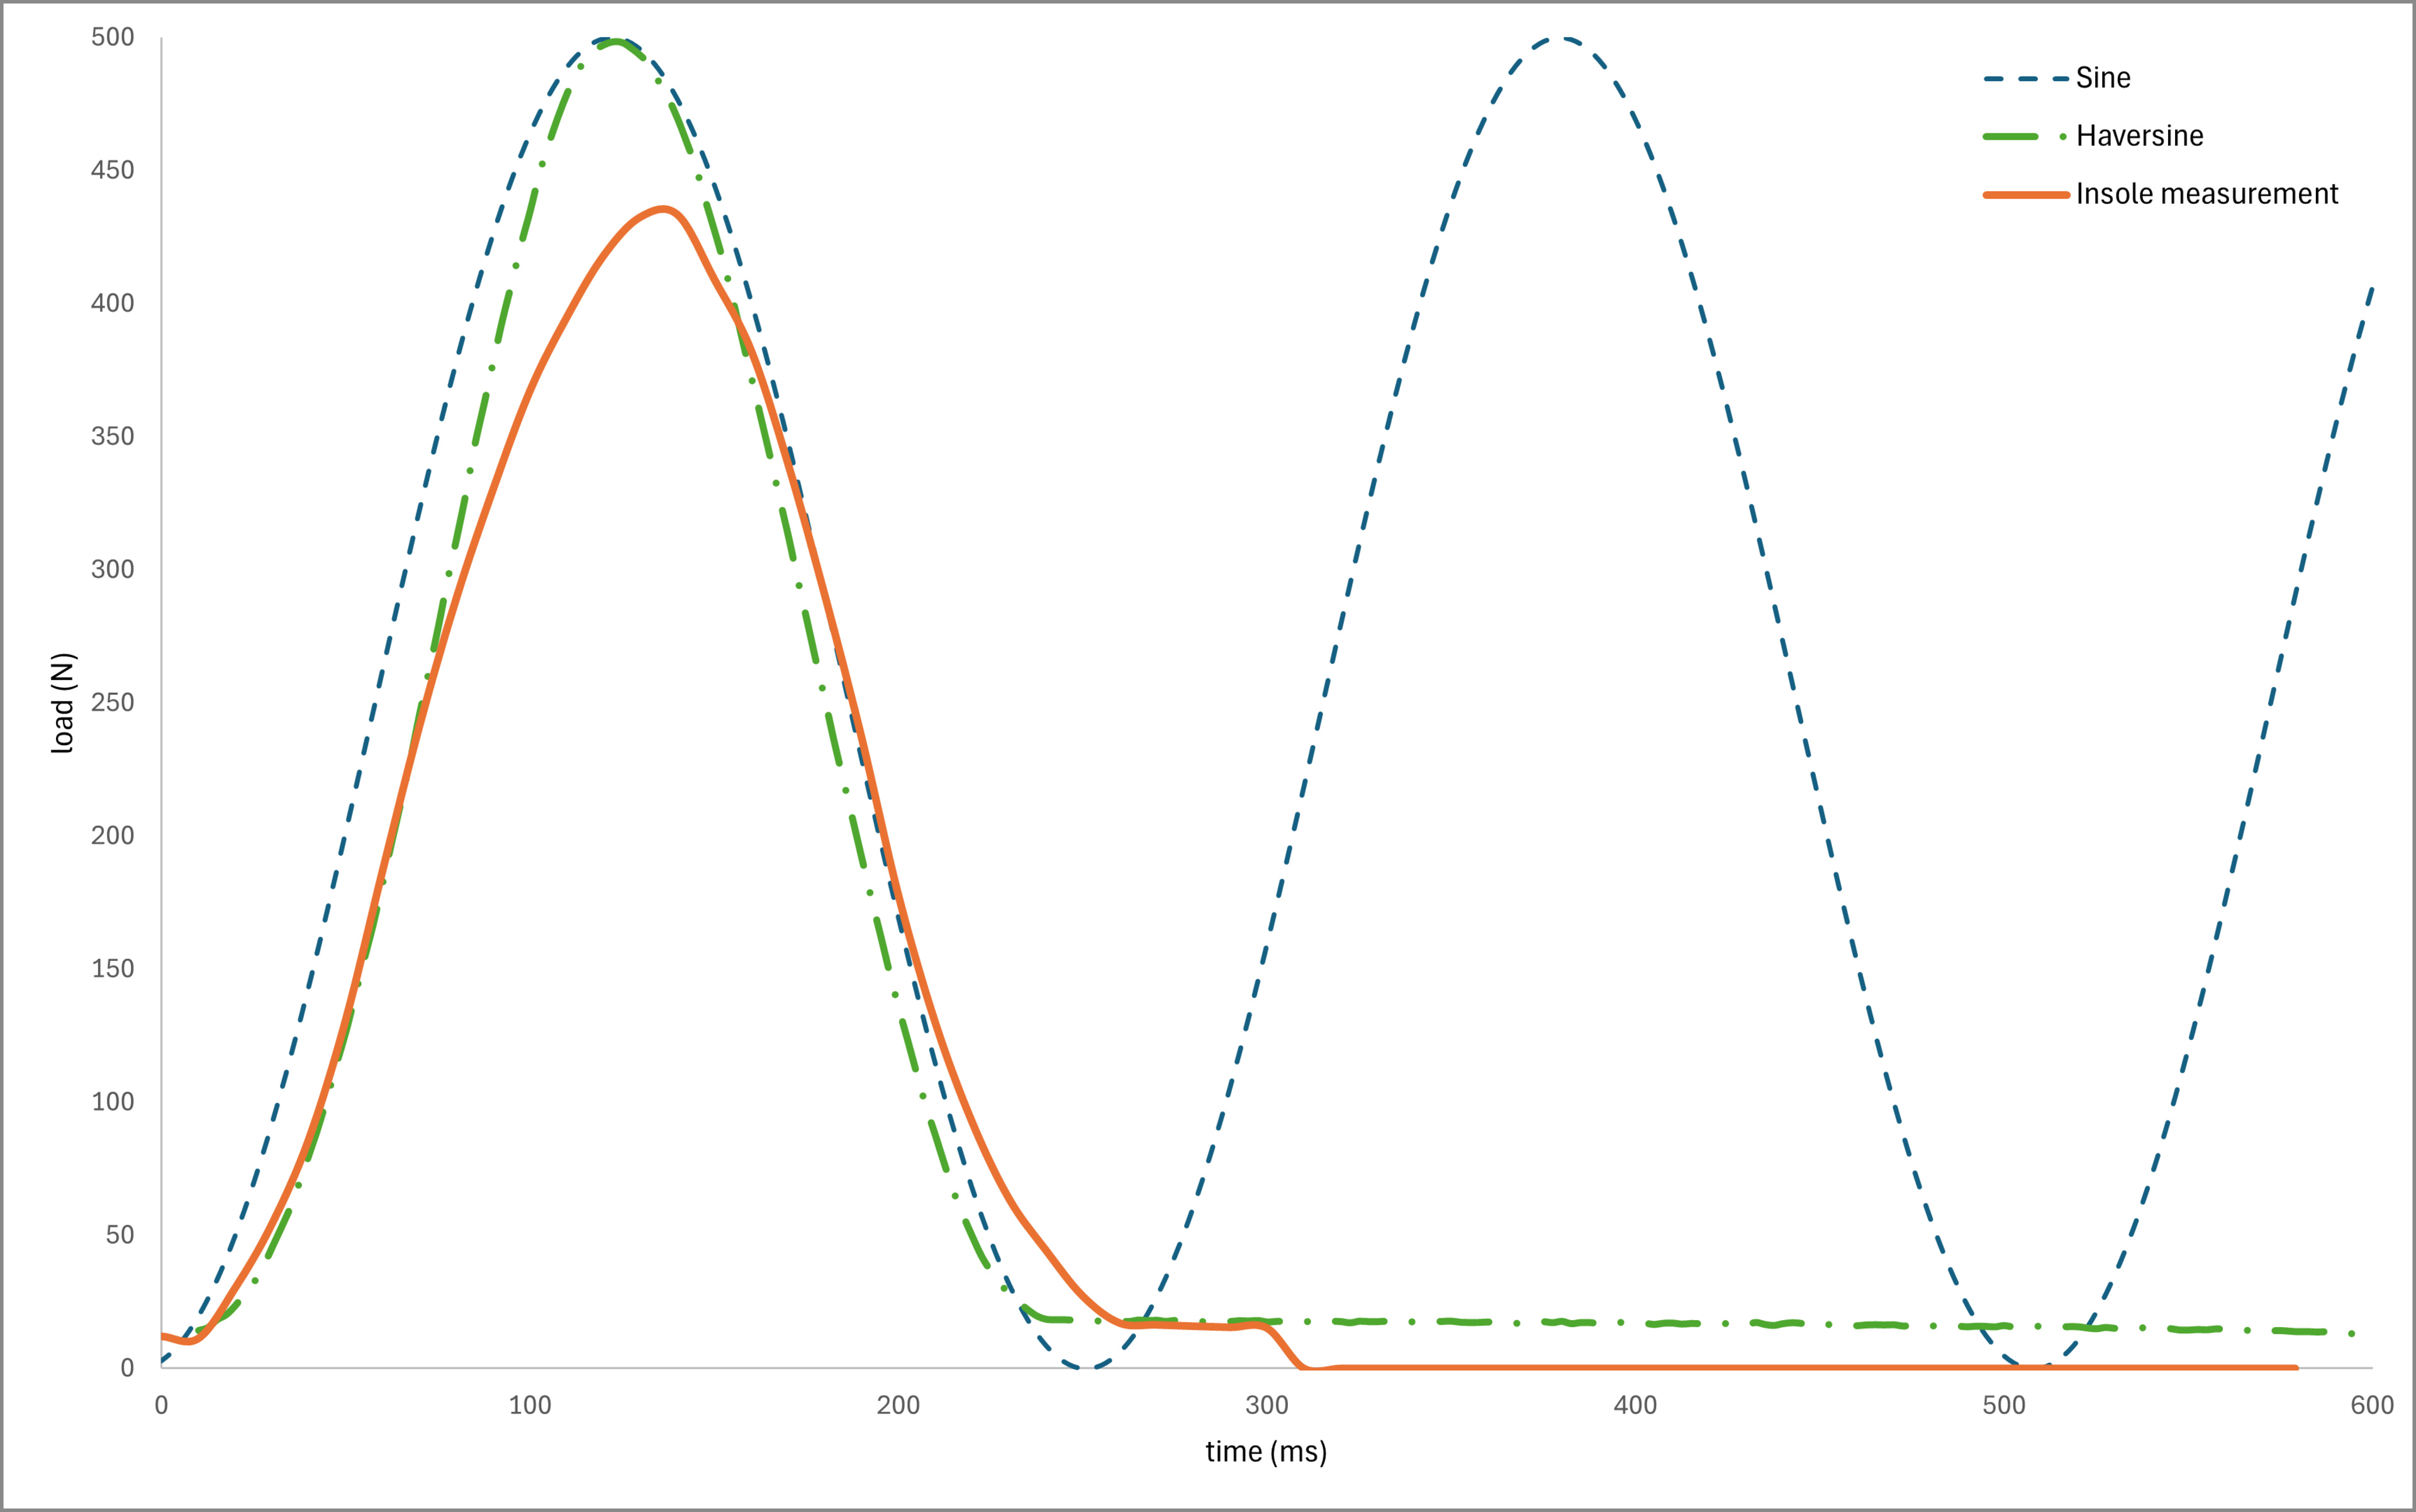
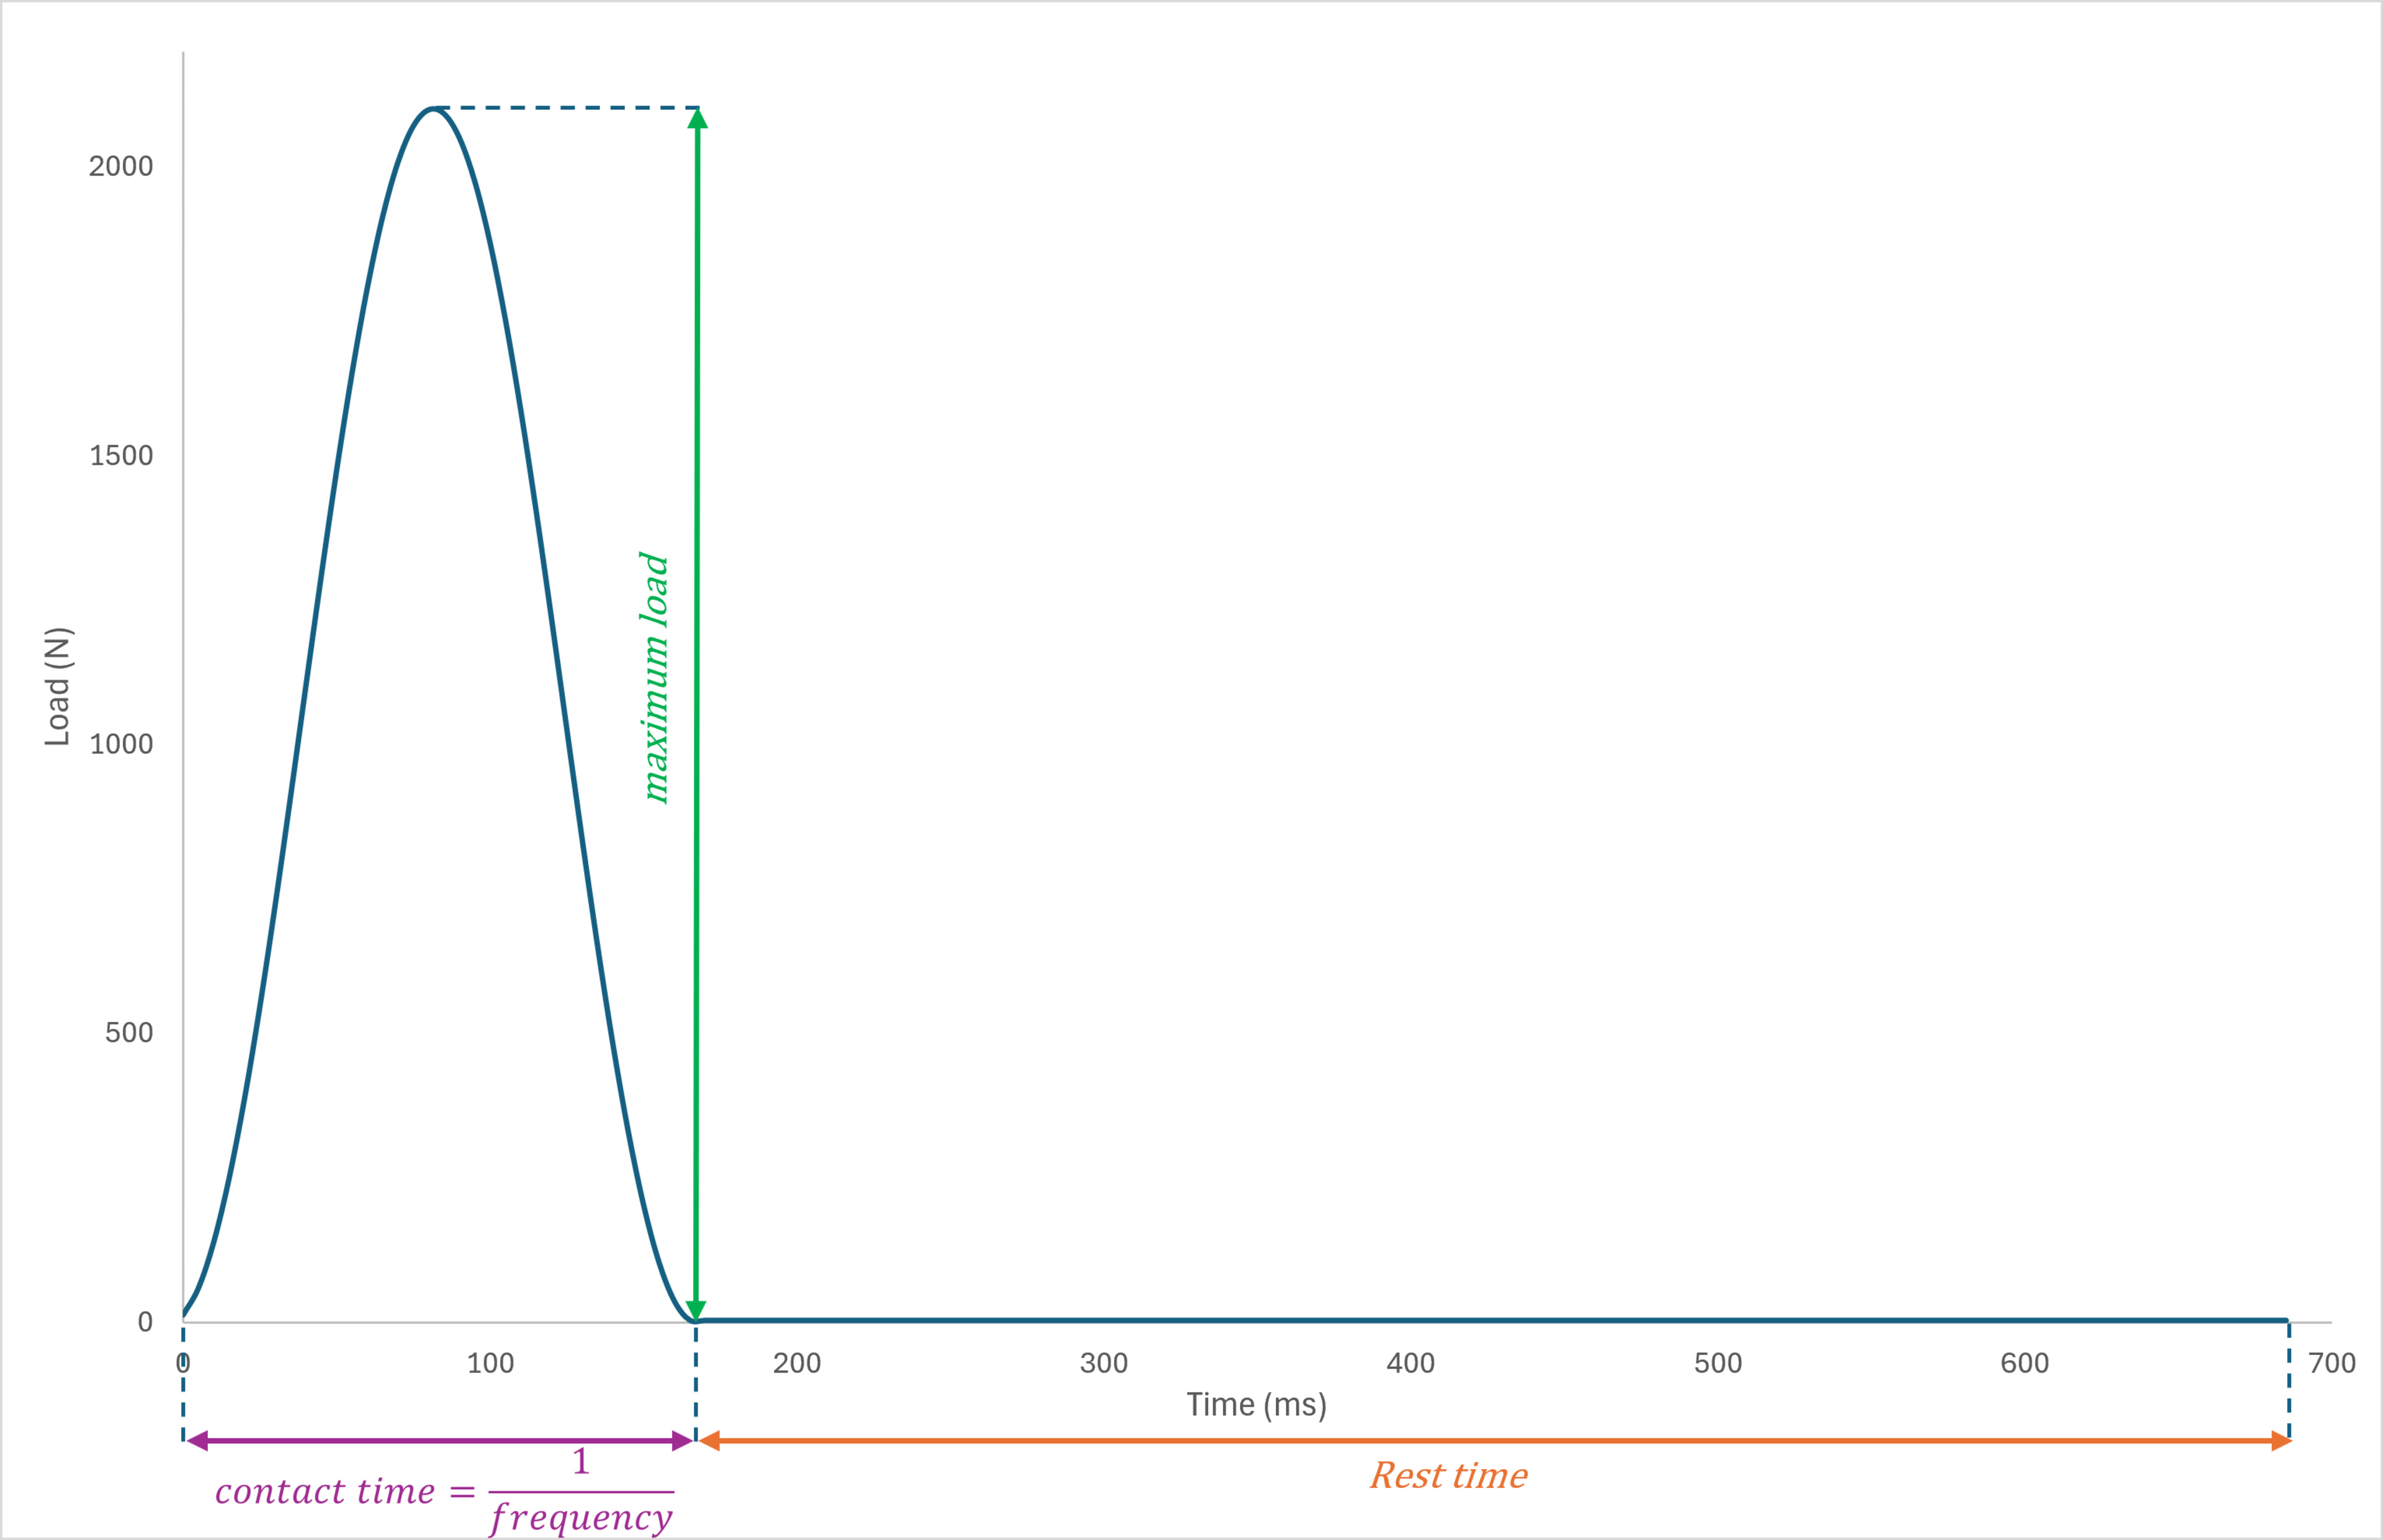
Additionally, even by matching the maximum load, our previous tests used a sinusoidal profile, whereas the actual insole-measured load over time resembles a haversine profile, a sine wave followed by a pause. In practice, a runner applies force while the foot is in contact with the ground, followed by a period of no contact during flight and when the opposite foot takes over.
To better replicate reality, we estimated realistic frequency and rest times in addition to the loads. All the shoes will be retested using the new sets of parameters, which means you may notice differences with the v0.8.2 methodology.
How the Updated Profile Changes the Results
Detail-oriented readers may notice some differences in the reviews with the new testing profile. However, because overall comparisons between shoes remain unchanged, minus some exceptions, the scoring is minimally affected.
Energy Return
Energy return refers to the amount of energy the midsole will return to the foot when it decompresses after compression. In our test, the energy loss corresponds to the area between the loading and unloading phases for a given compression cycle. The smaller the energy loss, the more energy return a shoe has.
With the updated load profile, the energy return of all the shoes decreased by 3 to 7%, which is likely due to the viscoelastic nature of the polymeric foams. In previous tests, when using a sinusoidal profile without rest time, the foam underwent continuous compression cycles, leaving no time to relax. This may have exaggerated the elastic component of the foam's mechanical behavior, resulting in higher measured energy return since pure elastic behavior corresponds to instantaneous recovery. The updated testing profile includes a 0.5s rest period between cycles, allowing the foam to partially relax. This triggers the viscous component of the response, producing a more viscoelastic behavior and, consequently, slightly lower energy return.
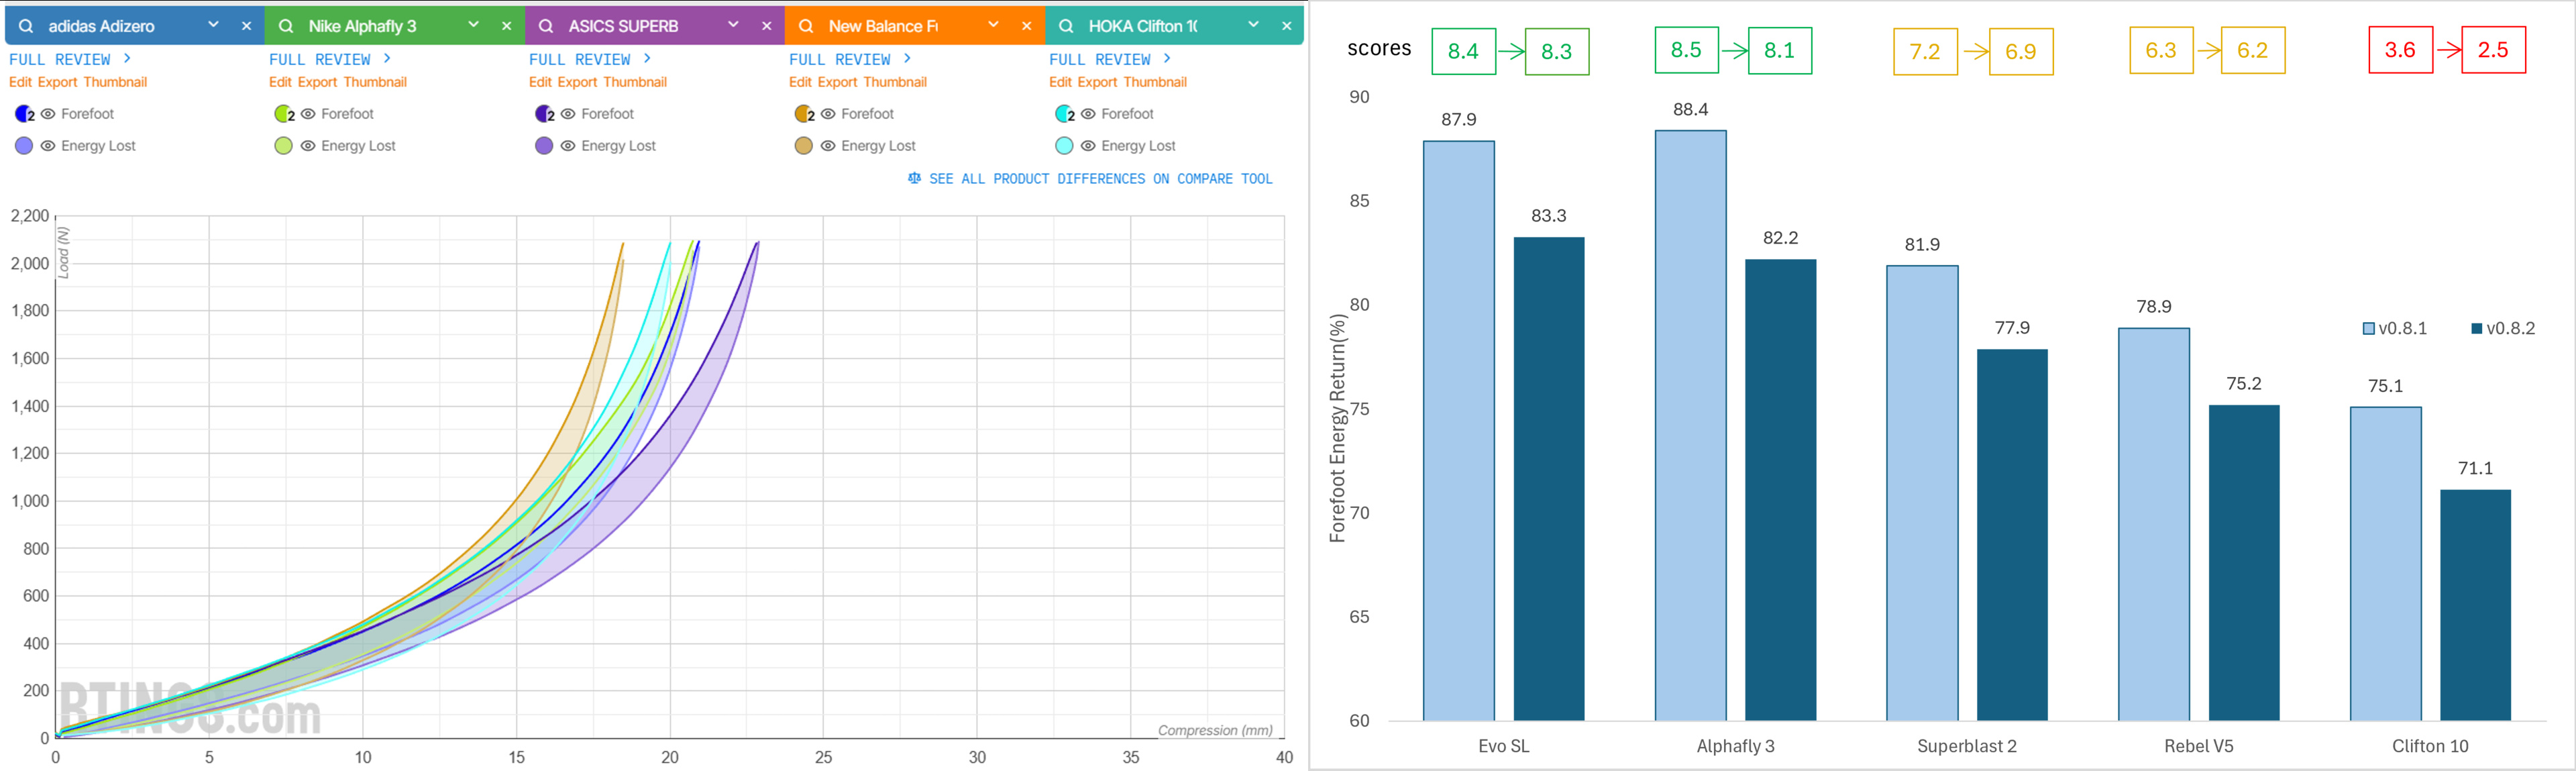
Despite these changes, general trends between shoes remain consistent. For example, the Nike Alphafly 3 still exhibits high energy return, while the HOKA Clifton 10 remains comparatively low. Scoring has been adjusted to maintain consistency with previous results, so overall ratings are largely unchanged. Some close-scoring shoes may switch positions: for instance, the adidas Adizero Evo SL previously scored higher than the Alphafly 3, but the order is now reversed in both heel and forefoot. That said, those two still score pretty close to each other with only a 0.2 score difference, indicating both have good energy return in the same range.
Cushioning and Firmness
Cushioning and firmness depend only on the loading phase of the compression test. Cushioning reflects the energy absorbed by the midsole during compression, corresponding to the area under the force-displacement curve. Firmness is defined as the midsole's resistance to deformation, which is calculated as a derivative of the force-displacement curve at each load.
Because the load values increased substantially, cushioning and firmness changed as well. Instead of evaluating performance at 300, 600, and 900 N, we now focus on 550, 1,100, and 1,900 N in the heel and 800, 1,300, and 2,050 N in the forefoot. Direct comparison with previous results is, therefore, more difficult.
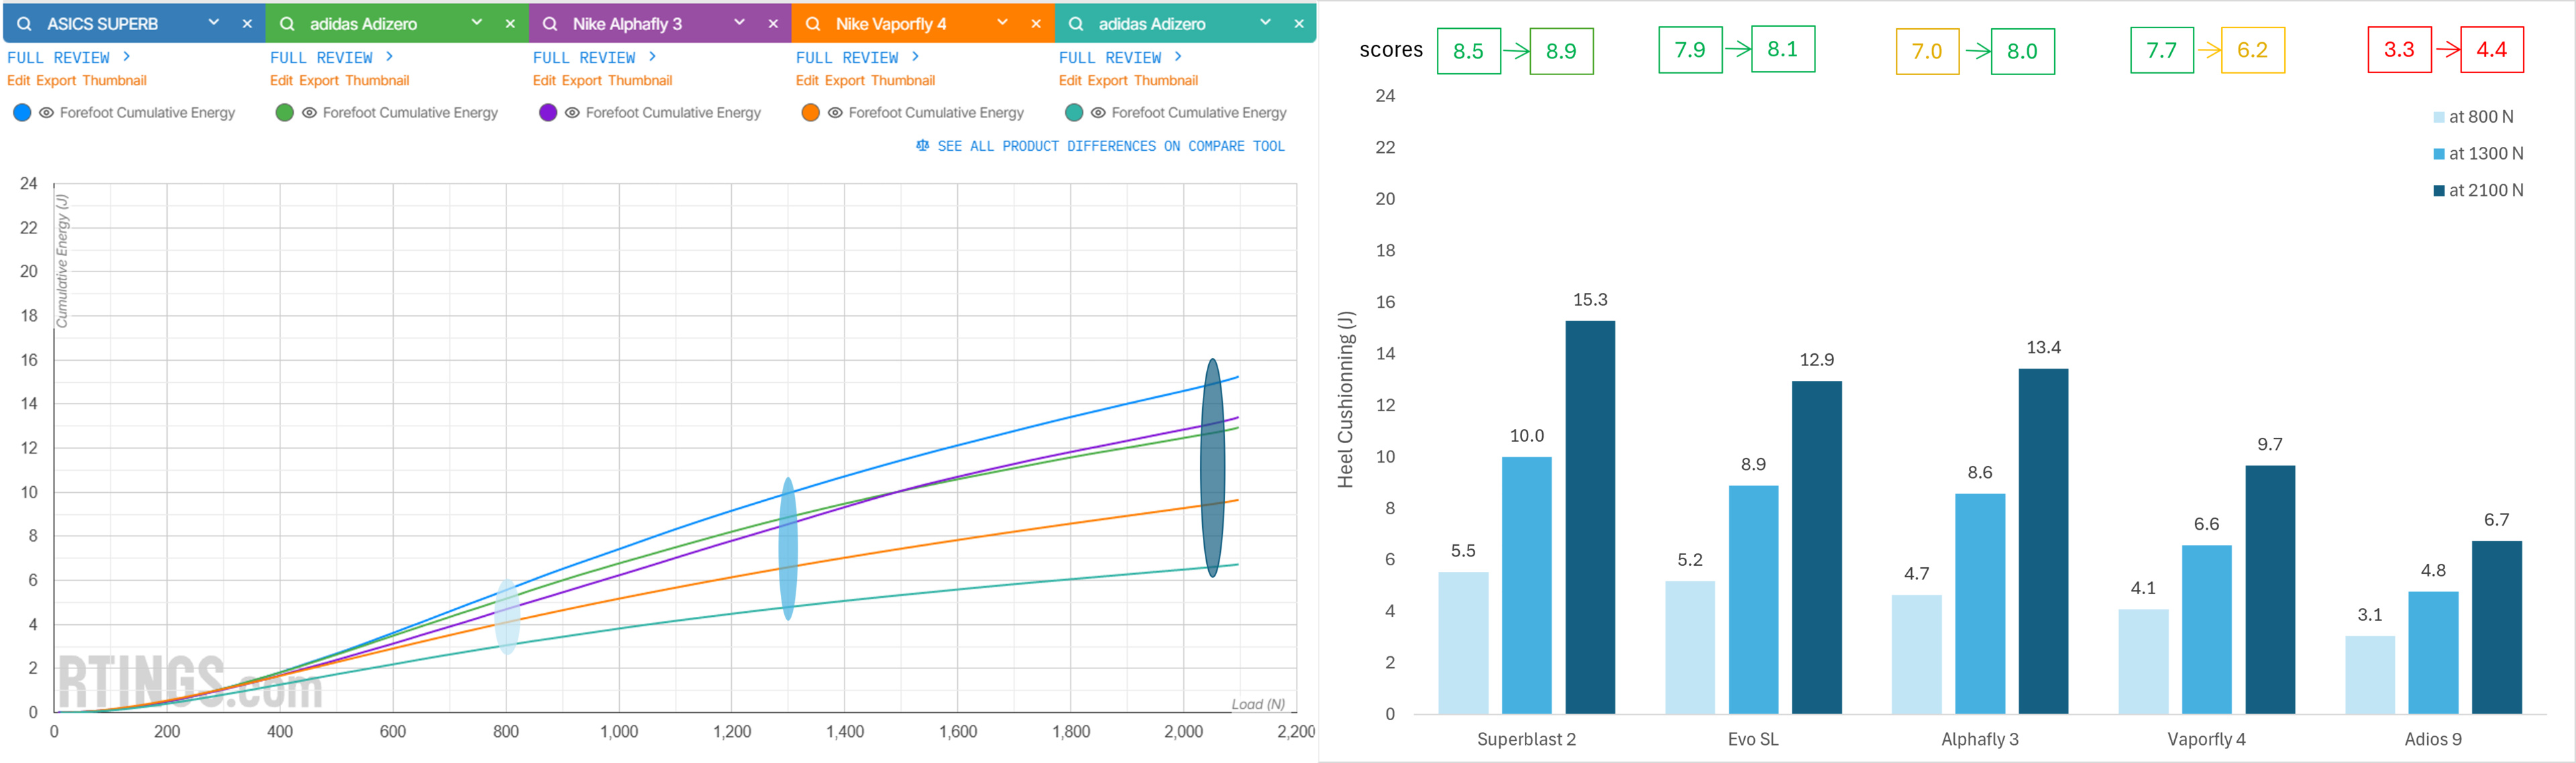
Testing at higher loads has amplified differences between shoes. While most scores will remain similar, some notable shifts occurred. For example, the Nike Vaporfly 4 previously scored green in cushioning and now scores yellow. This drop is likely due to bottoming out under high loads, a phenomenon not captured as well using the previous load profile. Its score of 6.2 in the forefoot still indicates acceptable cushioning, but it now scores significantly lower than the Alphafly 3. It's worth mentioning that the Alphafly 3's forefoot score increased from 7.0 to 8.0, likely reflecting the revised testing head placement relative to its air pod. Since the Alphafly is designed for longer distances requiring more foot protection, the comparison between the shoes makes more sense now.
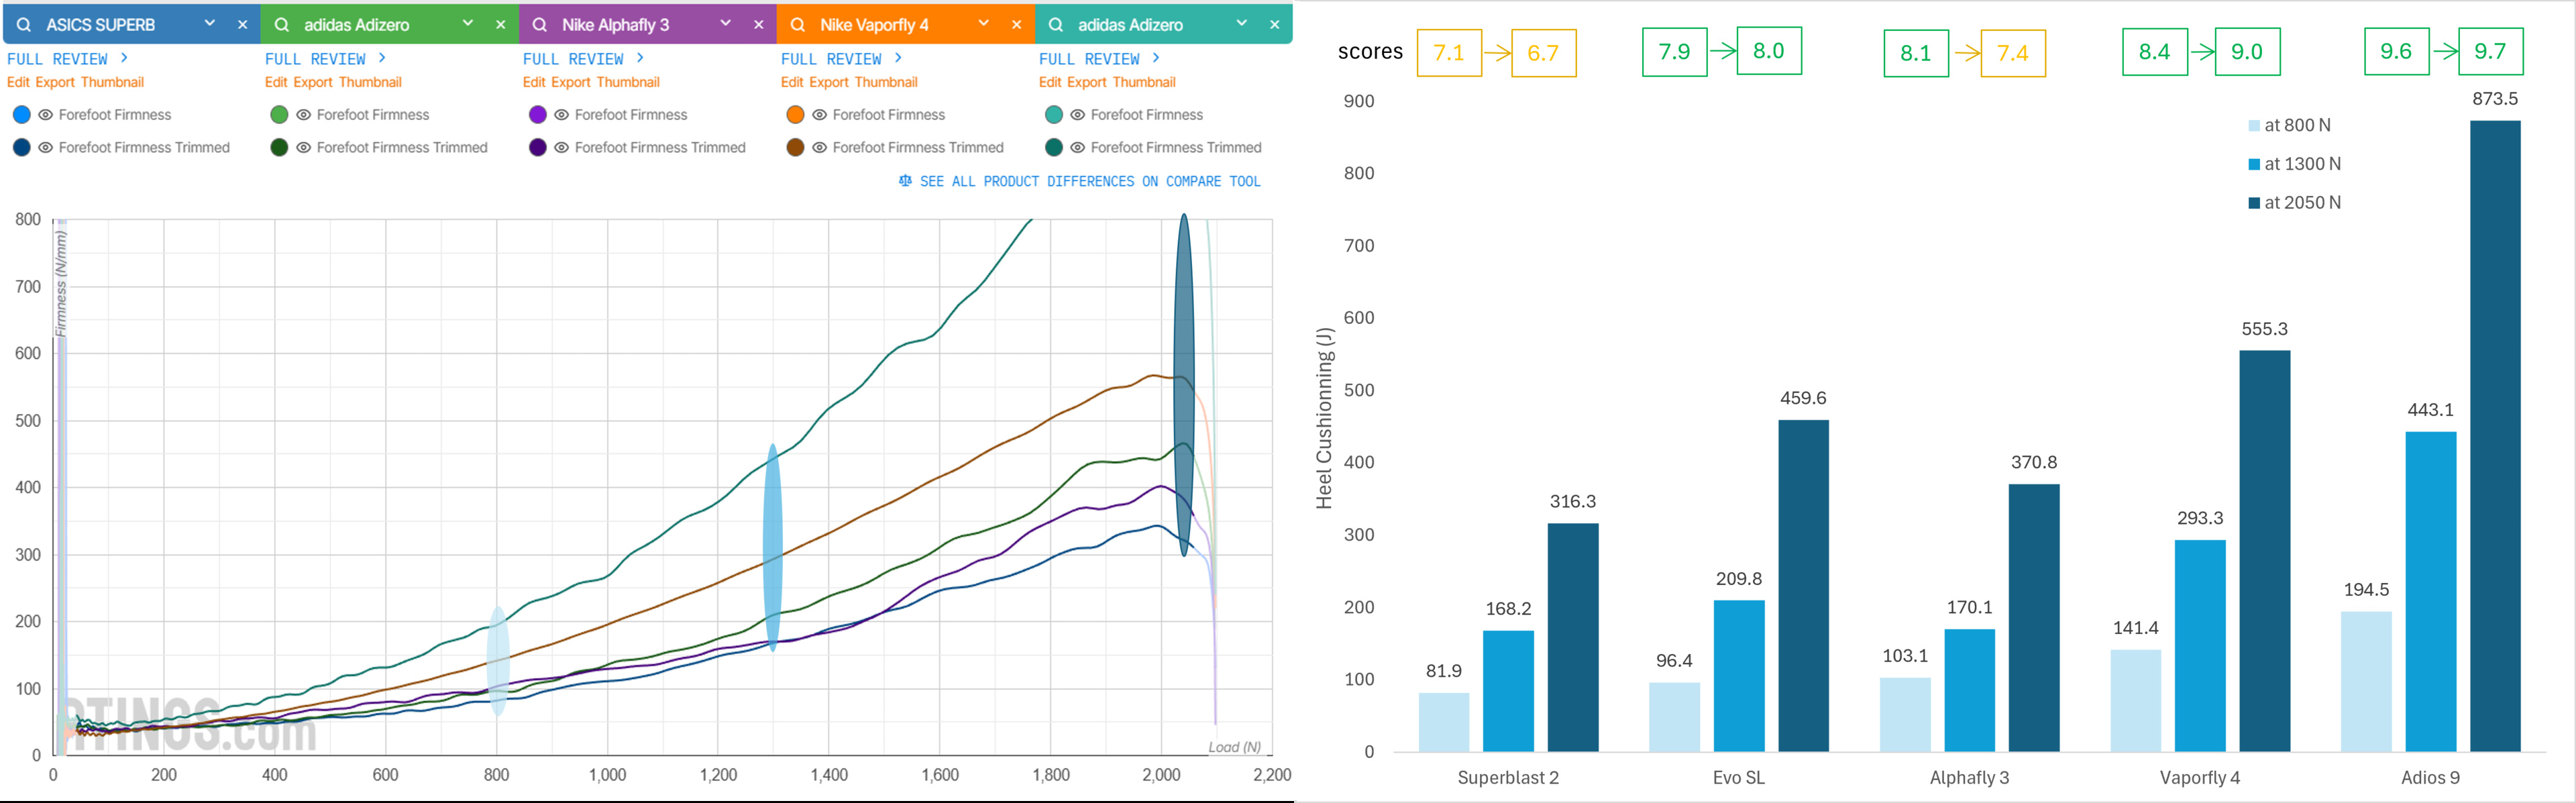
For firmness, the overall scores changed little, as relative comparisons remain consistent: the Adios 9 are still the firmest shoes tested, while the SUPERBLAST 2 and Alphafly 3 are on the softer side. The Vaporfly 4 shows increased firmness, which aligns with its design as an aggressive race shoe providing a firmer and snappier ride compared to the Alphafly 3.
In summary, while some individual score changes may be noticeable, overall trends and rankings remain consistent under the new load profile. Importantly, the adjustments to both testing parameters and head placement weren't arbitrary but the result of a systematic approach, as detailed in the following section.
Placement of the Testing Head
Previously, instead of 75% of shoe length, the value recommended by the World Athletics to measure forefoot stack height, we positioned the testing head at 65%, which we, and much of the running community on Reddit, consider more representative. However, averaged heat maps from the eight tested runners revealed that most of the force is applied at 70% of shoe length, midway between the World Athletics standard and our initial choice. In addition, the data showed that peak force is applied slightly inward of center for most runners, leading us to shift the width placement from the middle to 44% from the inside edge of the foot.
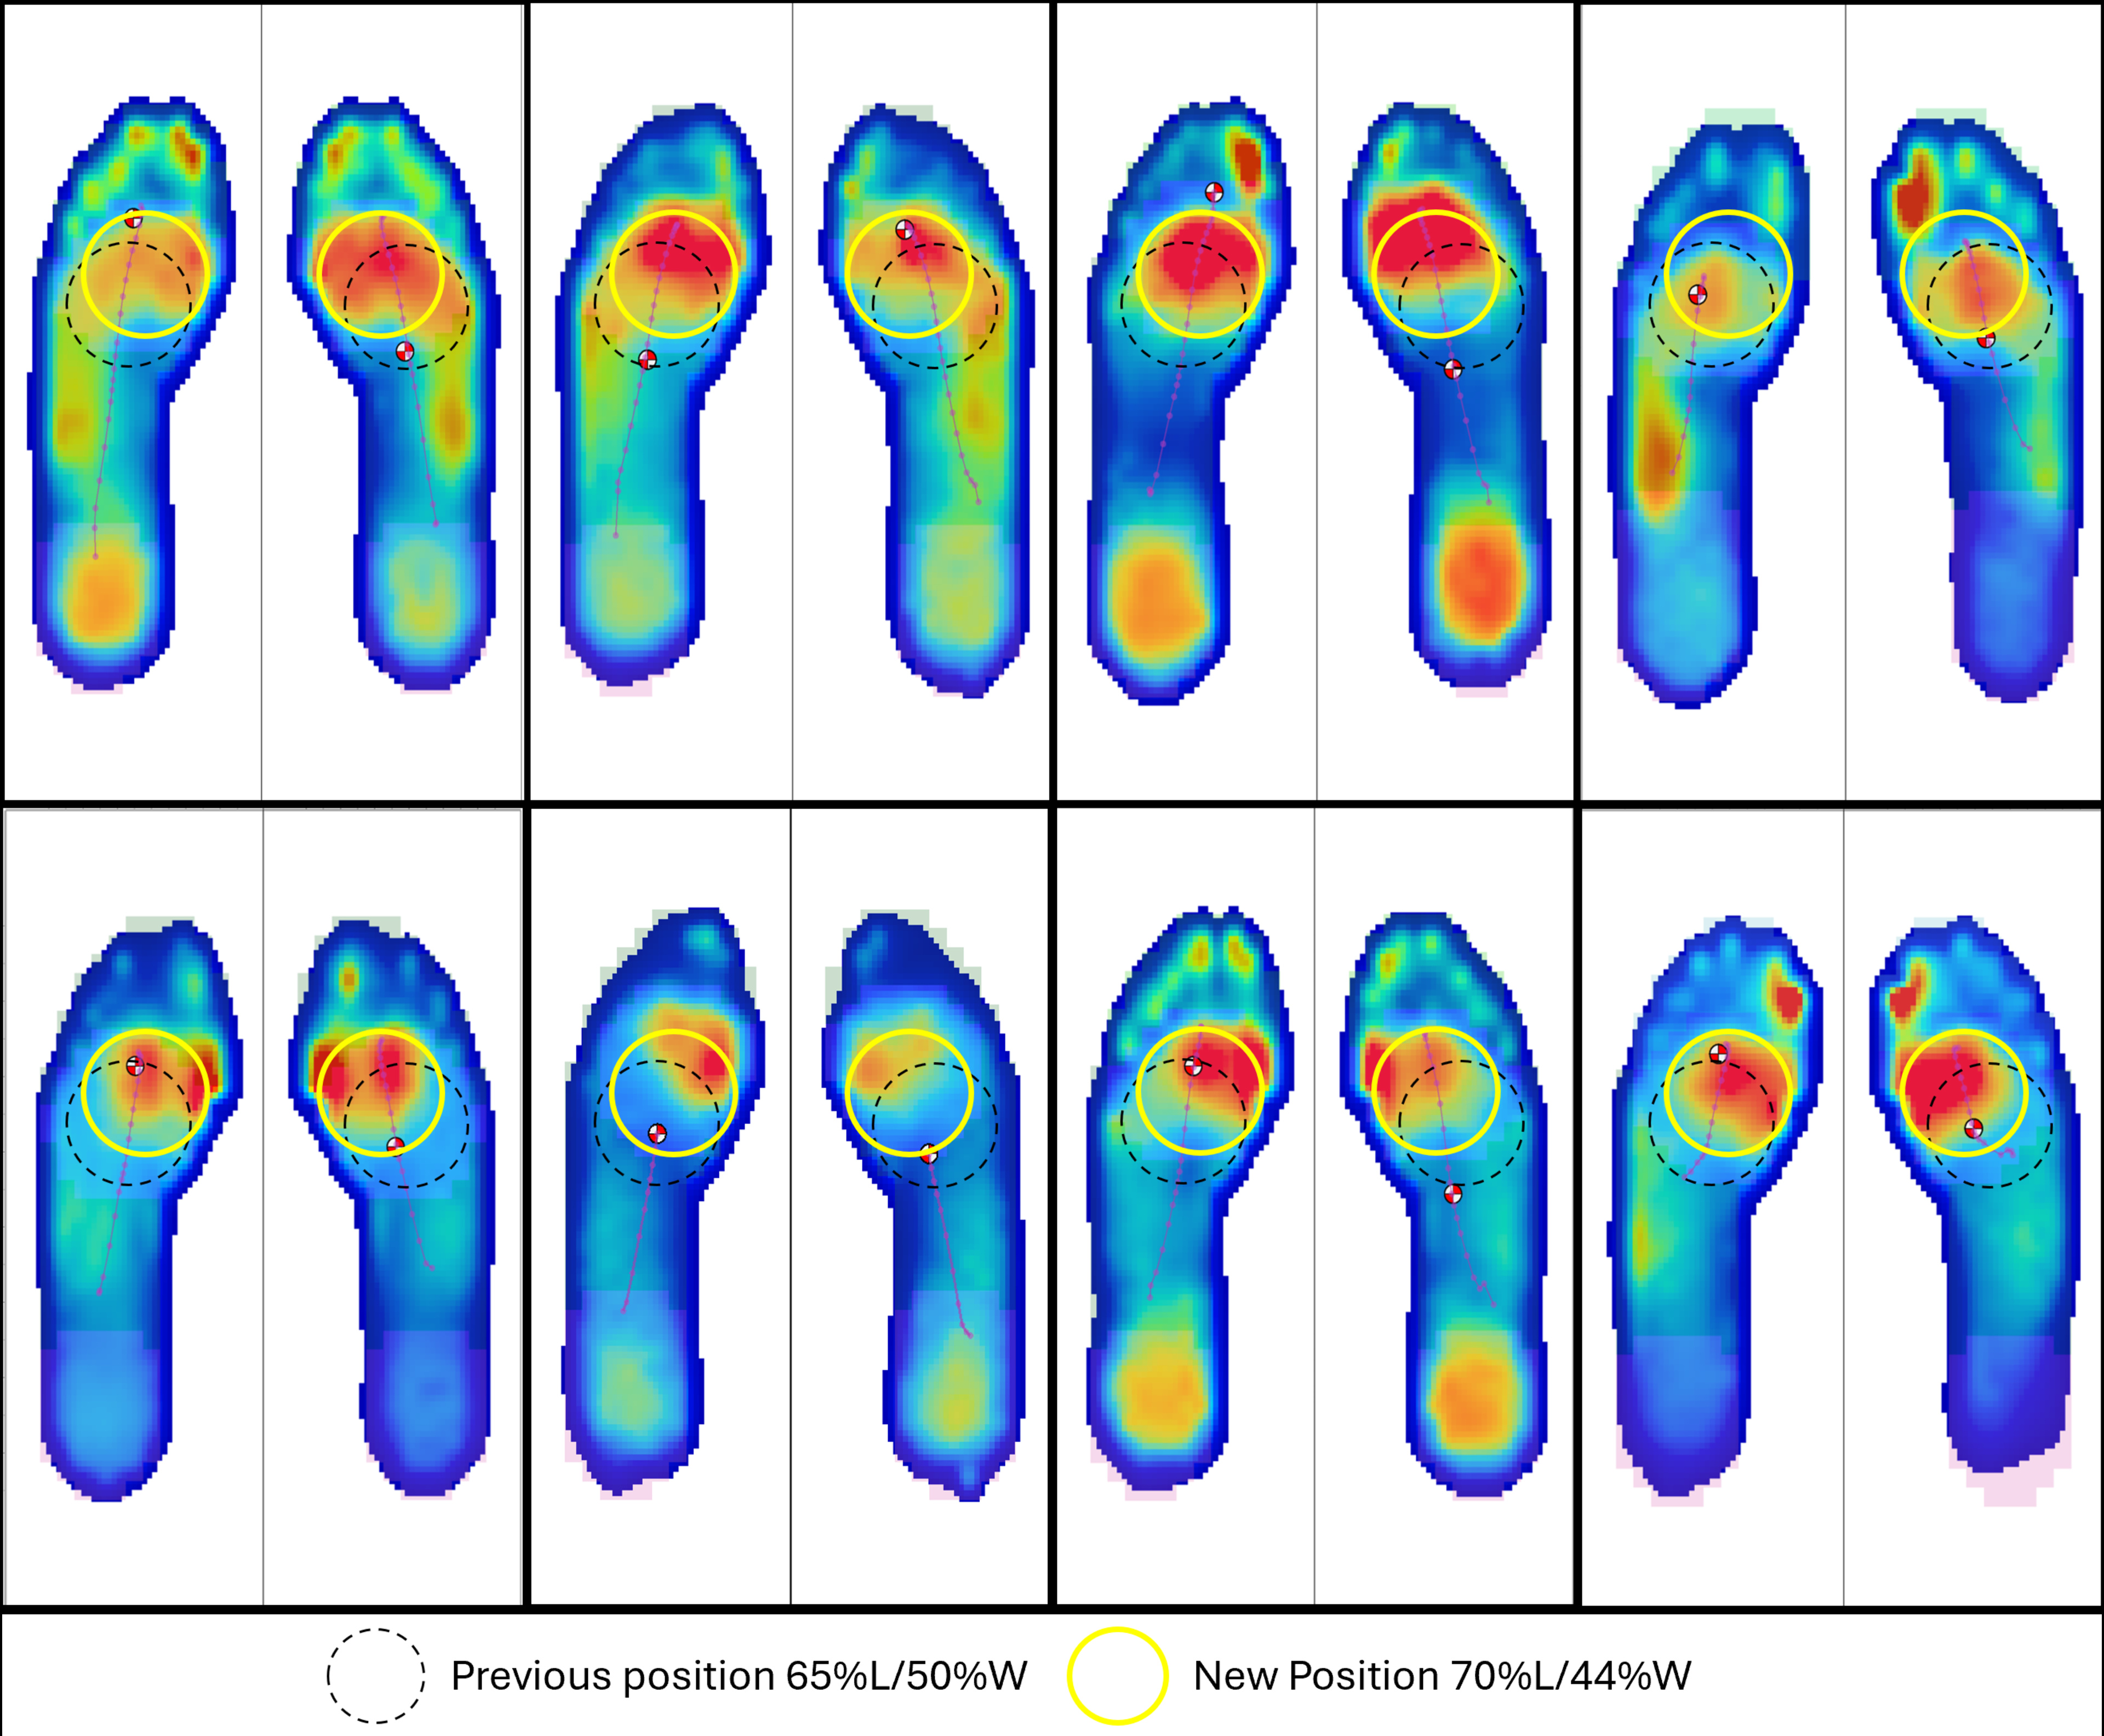
In the heel, the original placement at 12% of shoe length was validated by the pressure maps and therefore remained unchanged.
New Load Profile Development
To maximize efficiency, minimizing the number of load profiles tested was a priority. Because cushioning and firmness at different loads corresponding to different runners can be inferred from points along the same force-displacement curve, we opted to test up to the extreme load of a heavy runner moving at 3 min/km, ensuring the full range of possible forces is covered.
Since the load tables derived from pressure maps already provided a reliable estimate of applied forces, the remaining parameters required to define the compression machine's load profile were frequency and rest time.
Frequency
The load profile's frequency of the sinusoidal part is the inverse of the foot's contact time in the area of interest, which can be measured using the pressure sensor insoles. For this part of the work, the goal wasn't to model contact time with high precision for each runner, but rather to establish a representative value for a runner at 3 min/km.
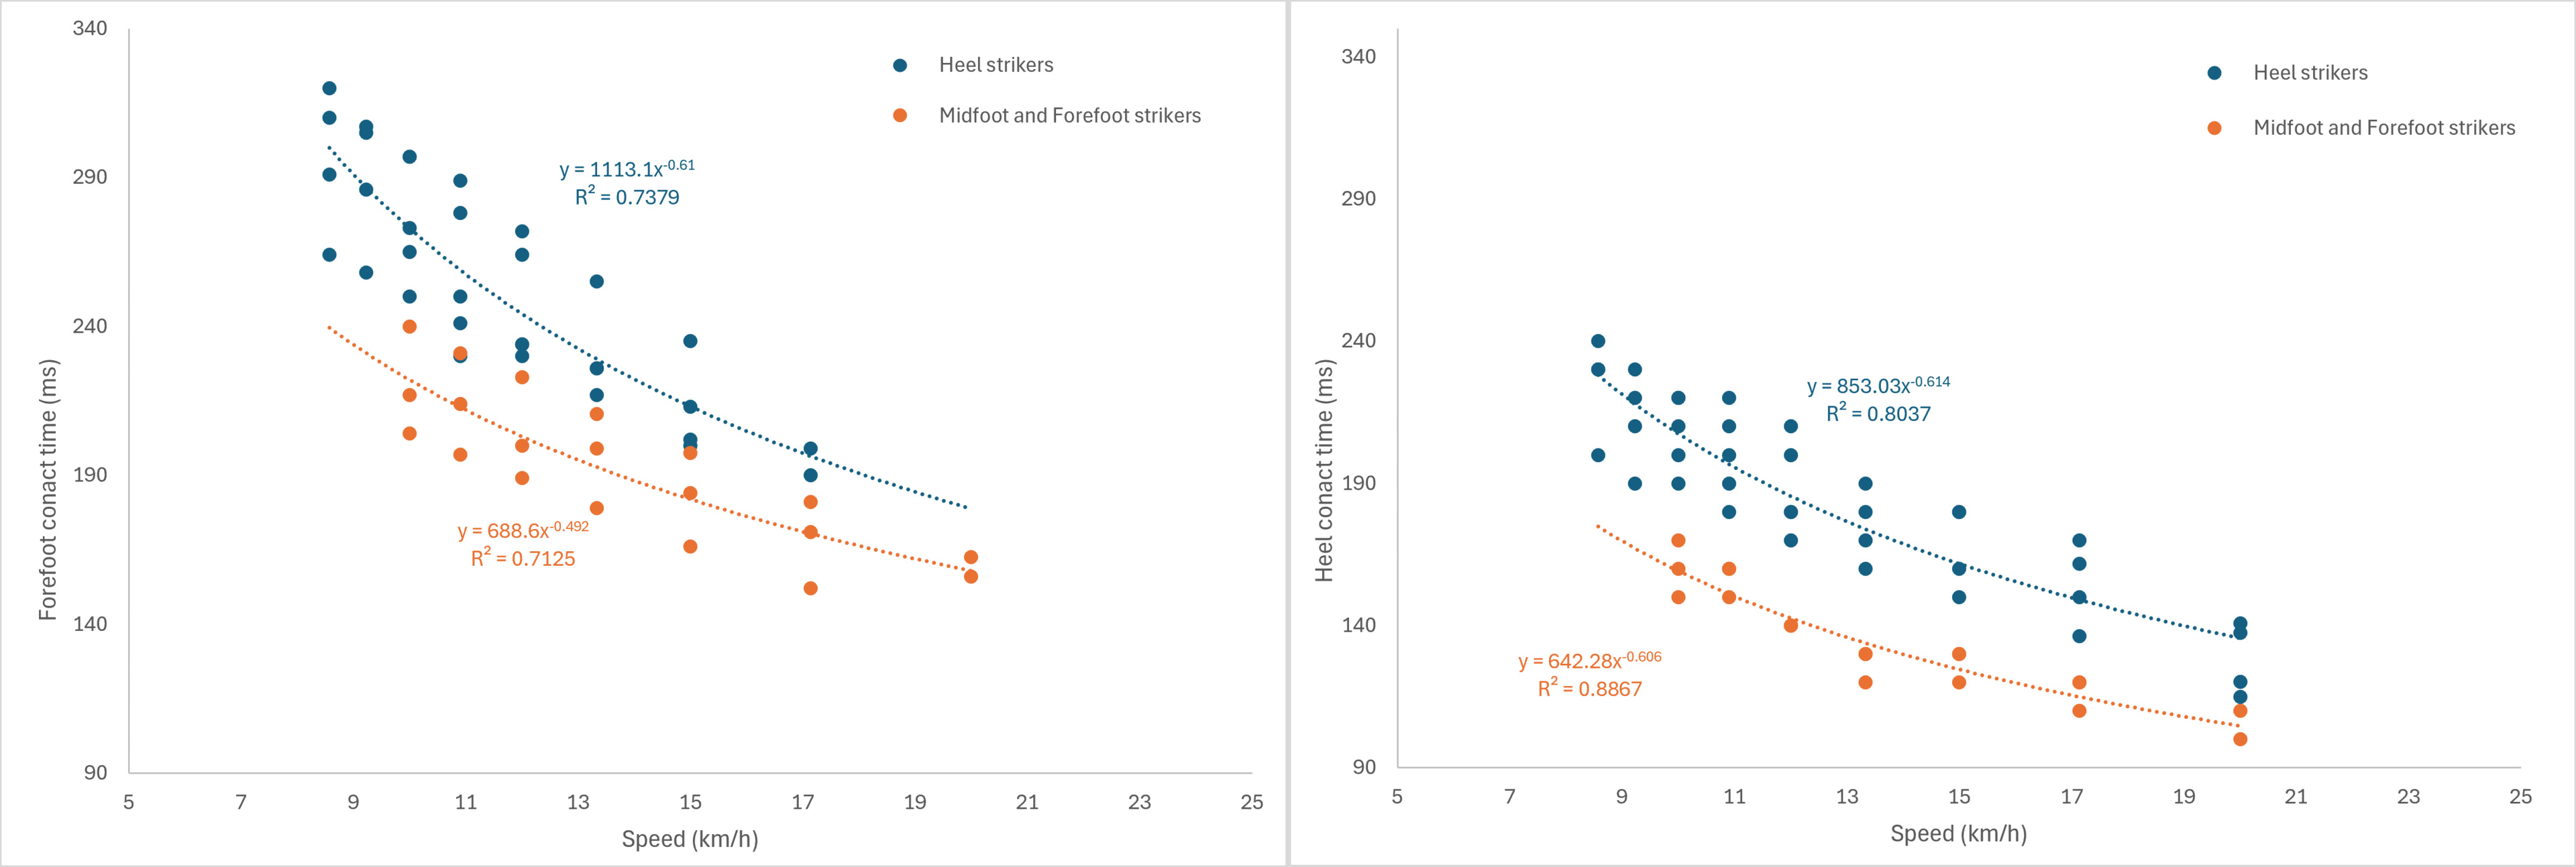
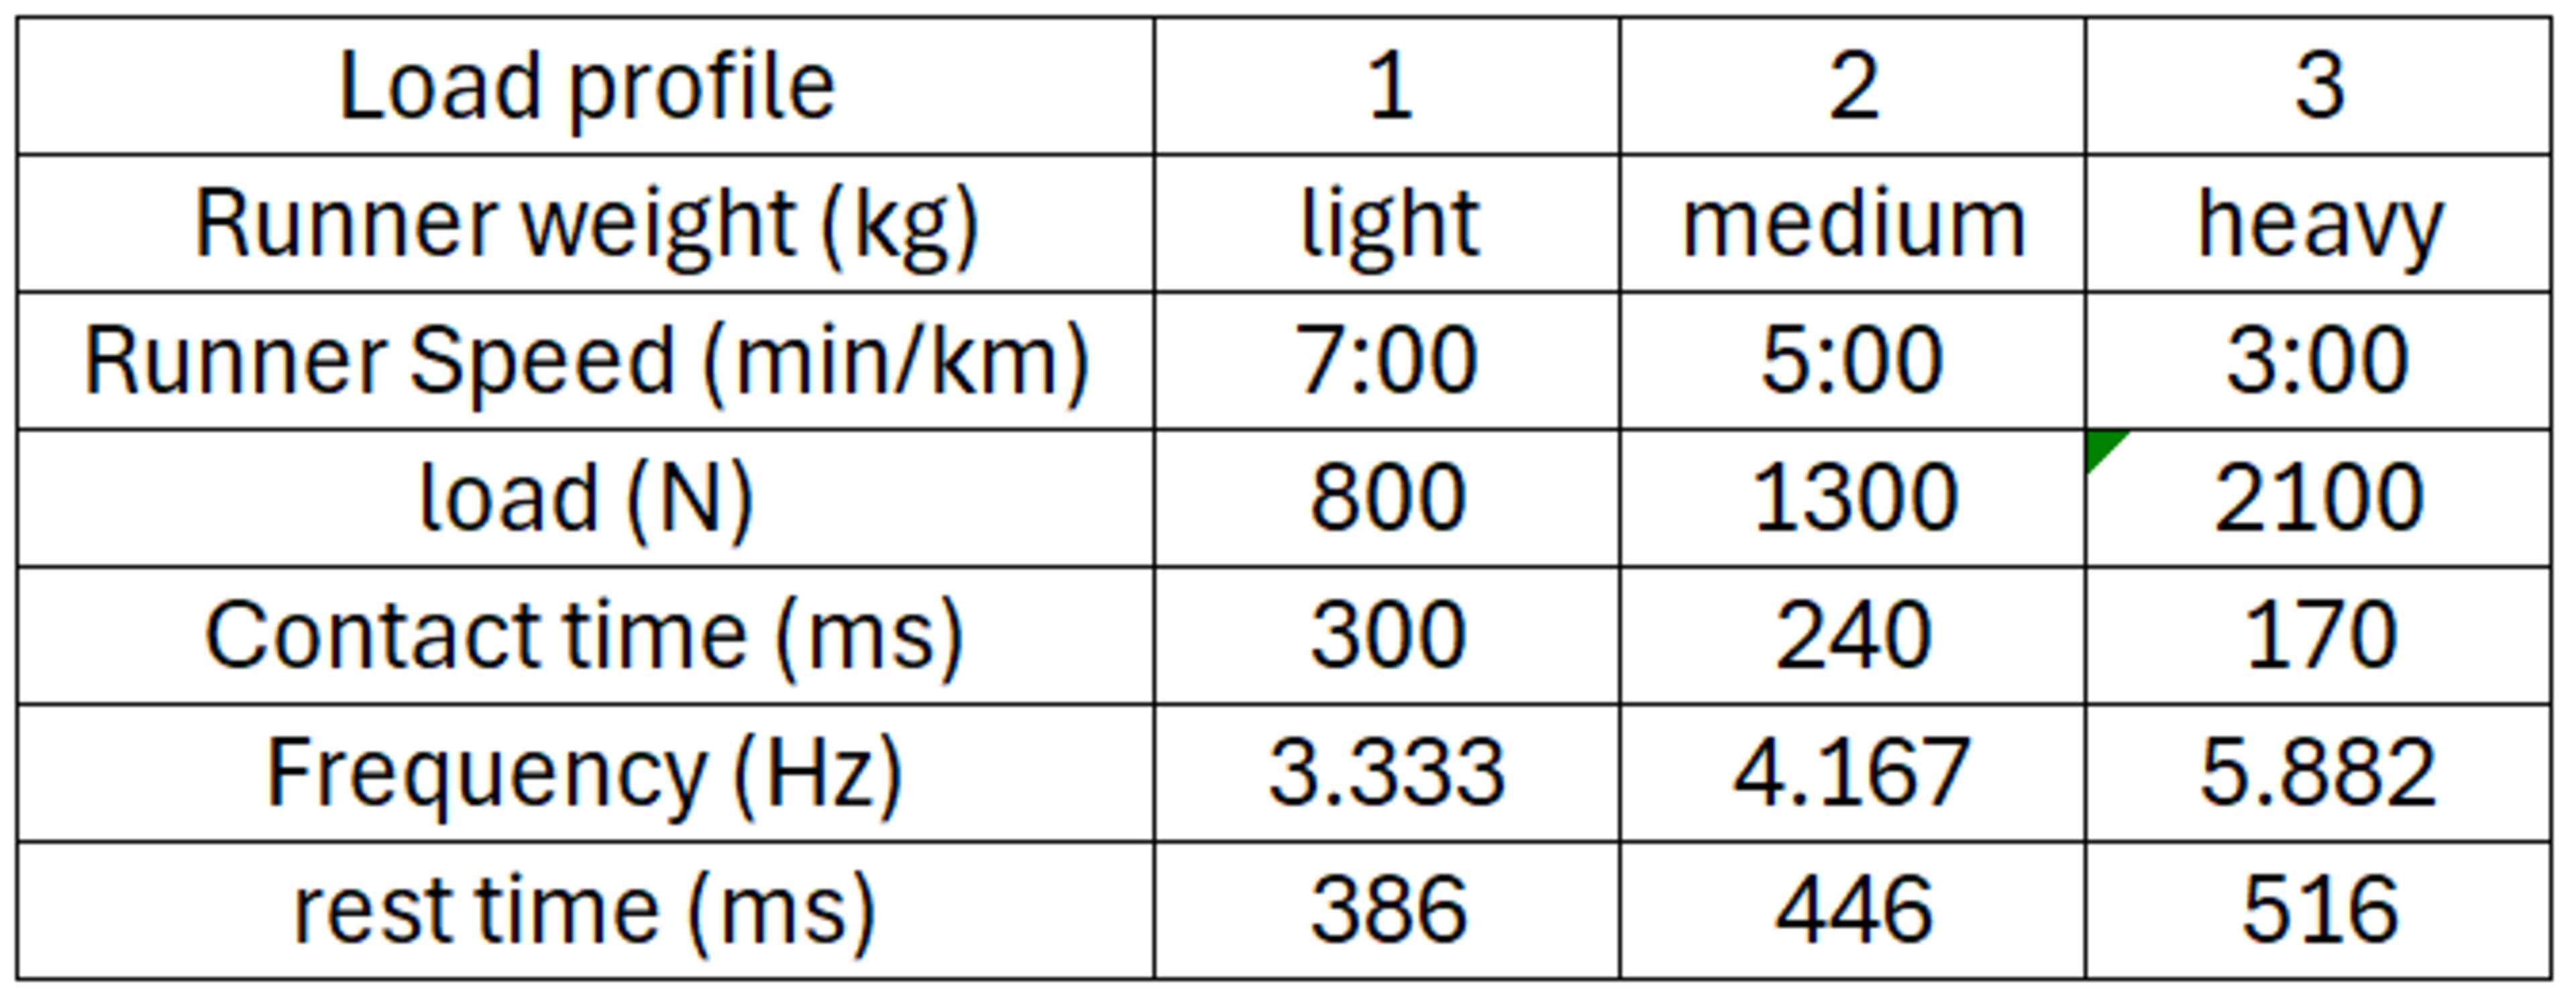
Contact time is expected to depend primarily on speed and cadence, rather than body weight. However, since no universal trend between contact time and cadence emerged in our runner pool, we simplified the modeling by using speed alone. The results led to consistent power-law relationships for both heel and forefoot. Separating heel strikers from midfoot/forefoot strikers further improved the fit. Using this approach, forefoot contact times were 158 ms for midfoot/forefoot strikers and 179 ms for heel strikers: a representative value of 170 ms was adopted, corresponding to a frequency of 5.882Hz. Applying the same method to the heel led to a contact time of 120 ms or 8.333Hz.
Rest time
Once frequency (or contact time) was determined, calculating the rest time is straightforward, as it depends only on stride time, which is derived from cadence. We selected a reference cadence of 175 steps per minute, reflecting the typical range of 160–190 steps per minute for recreational road runners. At this cadence, the stride time, the time it takes to do two steps, is 685 ms. Subtracting the contact times leads to rest times of 566 ms for the heel and 516 ms for the forefoot.
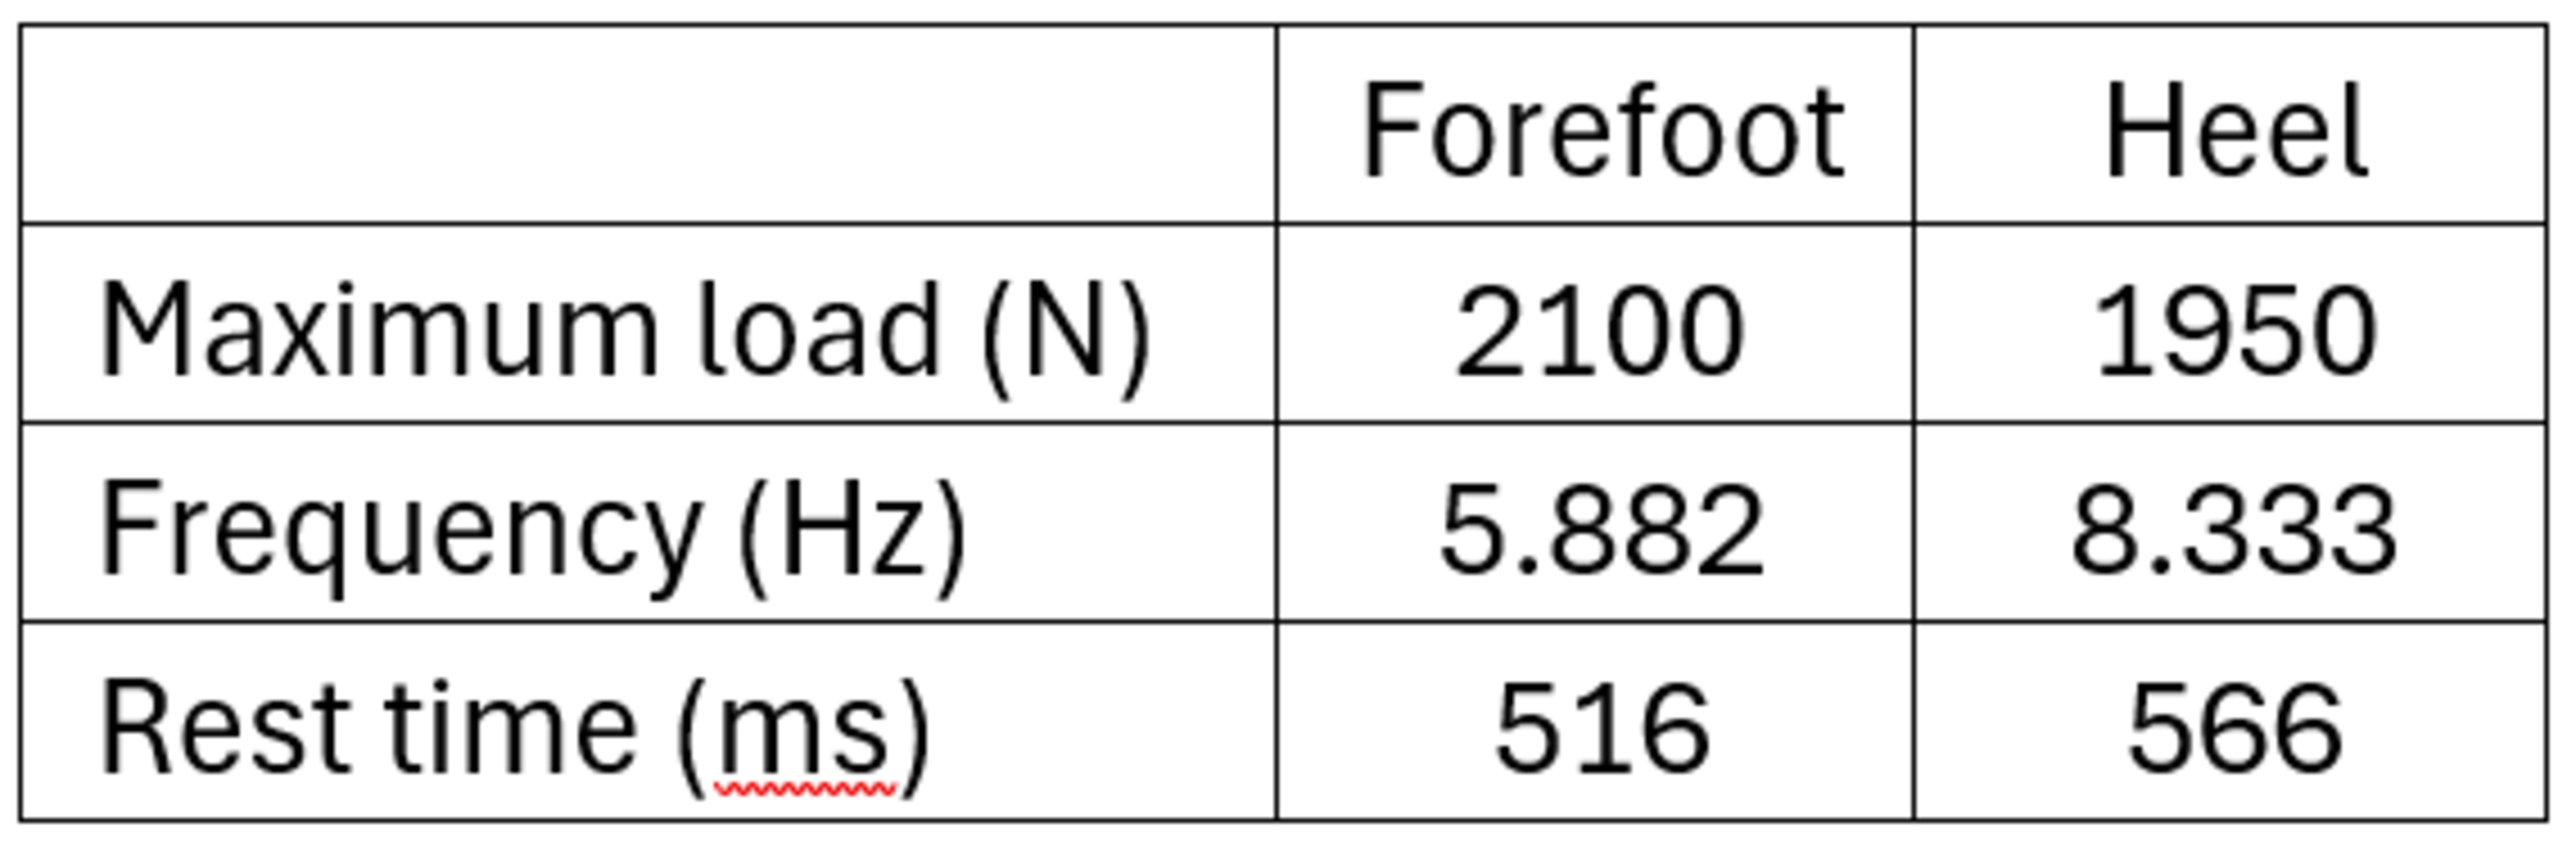
In the end, the selected parameters defining the new load profile are as follows:
Applicability of the Load Profile to Different Runners
A reasonable question is whether using a load profile tailored to a heavy runner would still be representative for lighter runners. For example, if a lightweight runner looks at cushioning at 800 N on a curve derived from a heavy runner's profile, does that value remain valid?
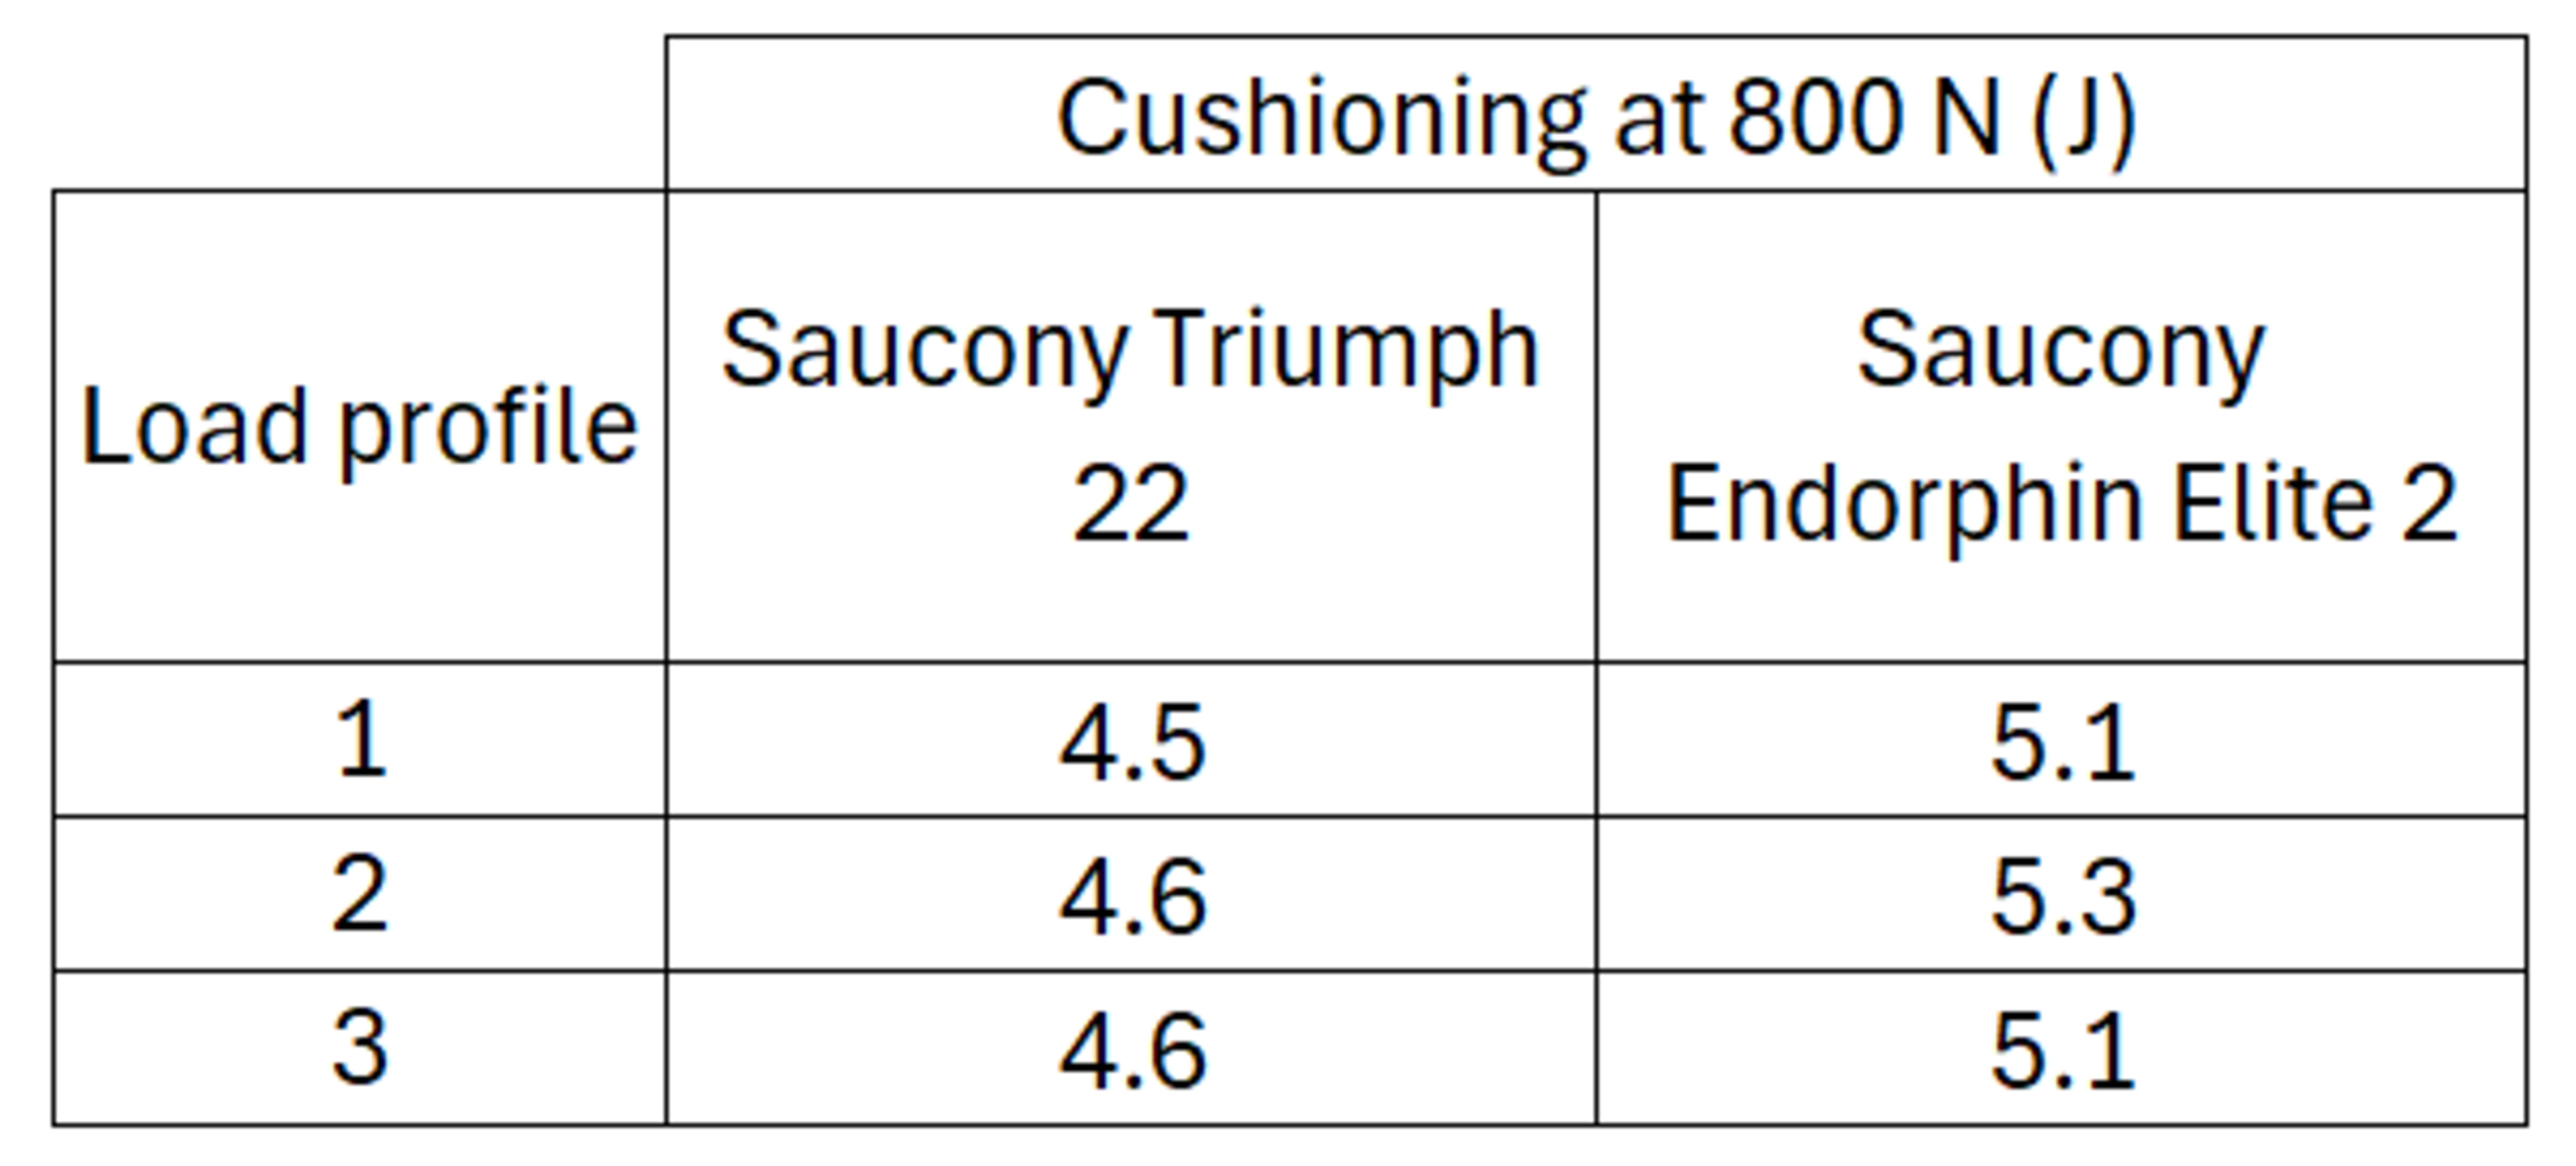
To investigate this, we tested several profiles across the full load range: a light runner at a slow pace (7:00 min/km), a medium runner at a moderate pace (5:00 min/km), and a heavy runner at a fast pace (3:00 min/km).
The results showed that cushioning was highly consistent across profiles, with a maximum difference of only 0.2 J. This means cushioning values at 800 N for a light runner at a slow pace can be reliably taken from any load-displacement curve, even one modeled for a heavy runner at a fast pace.
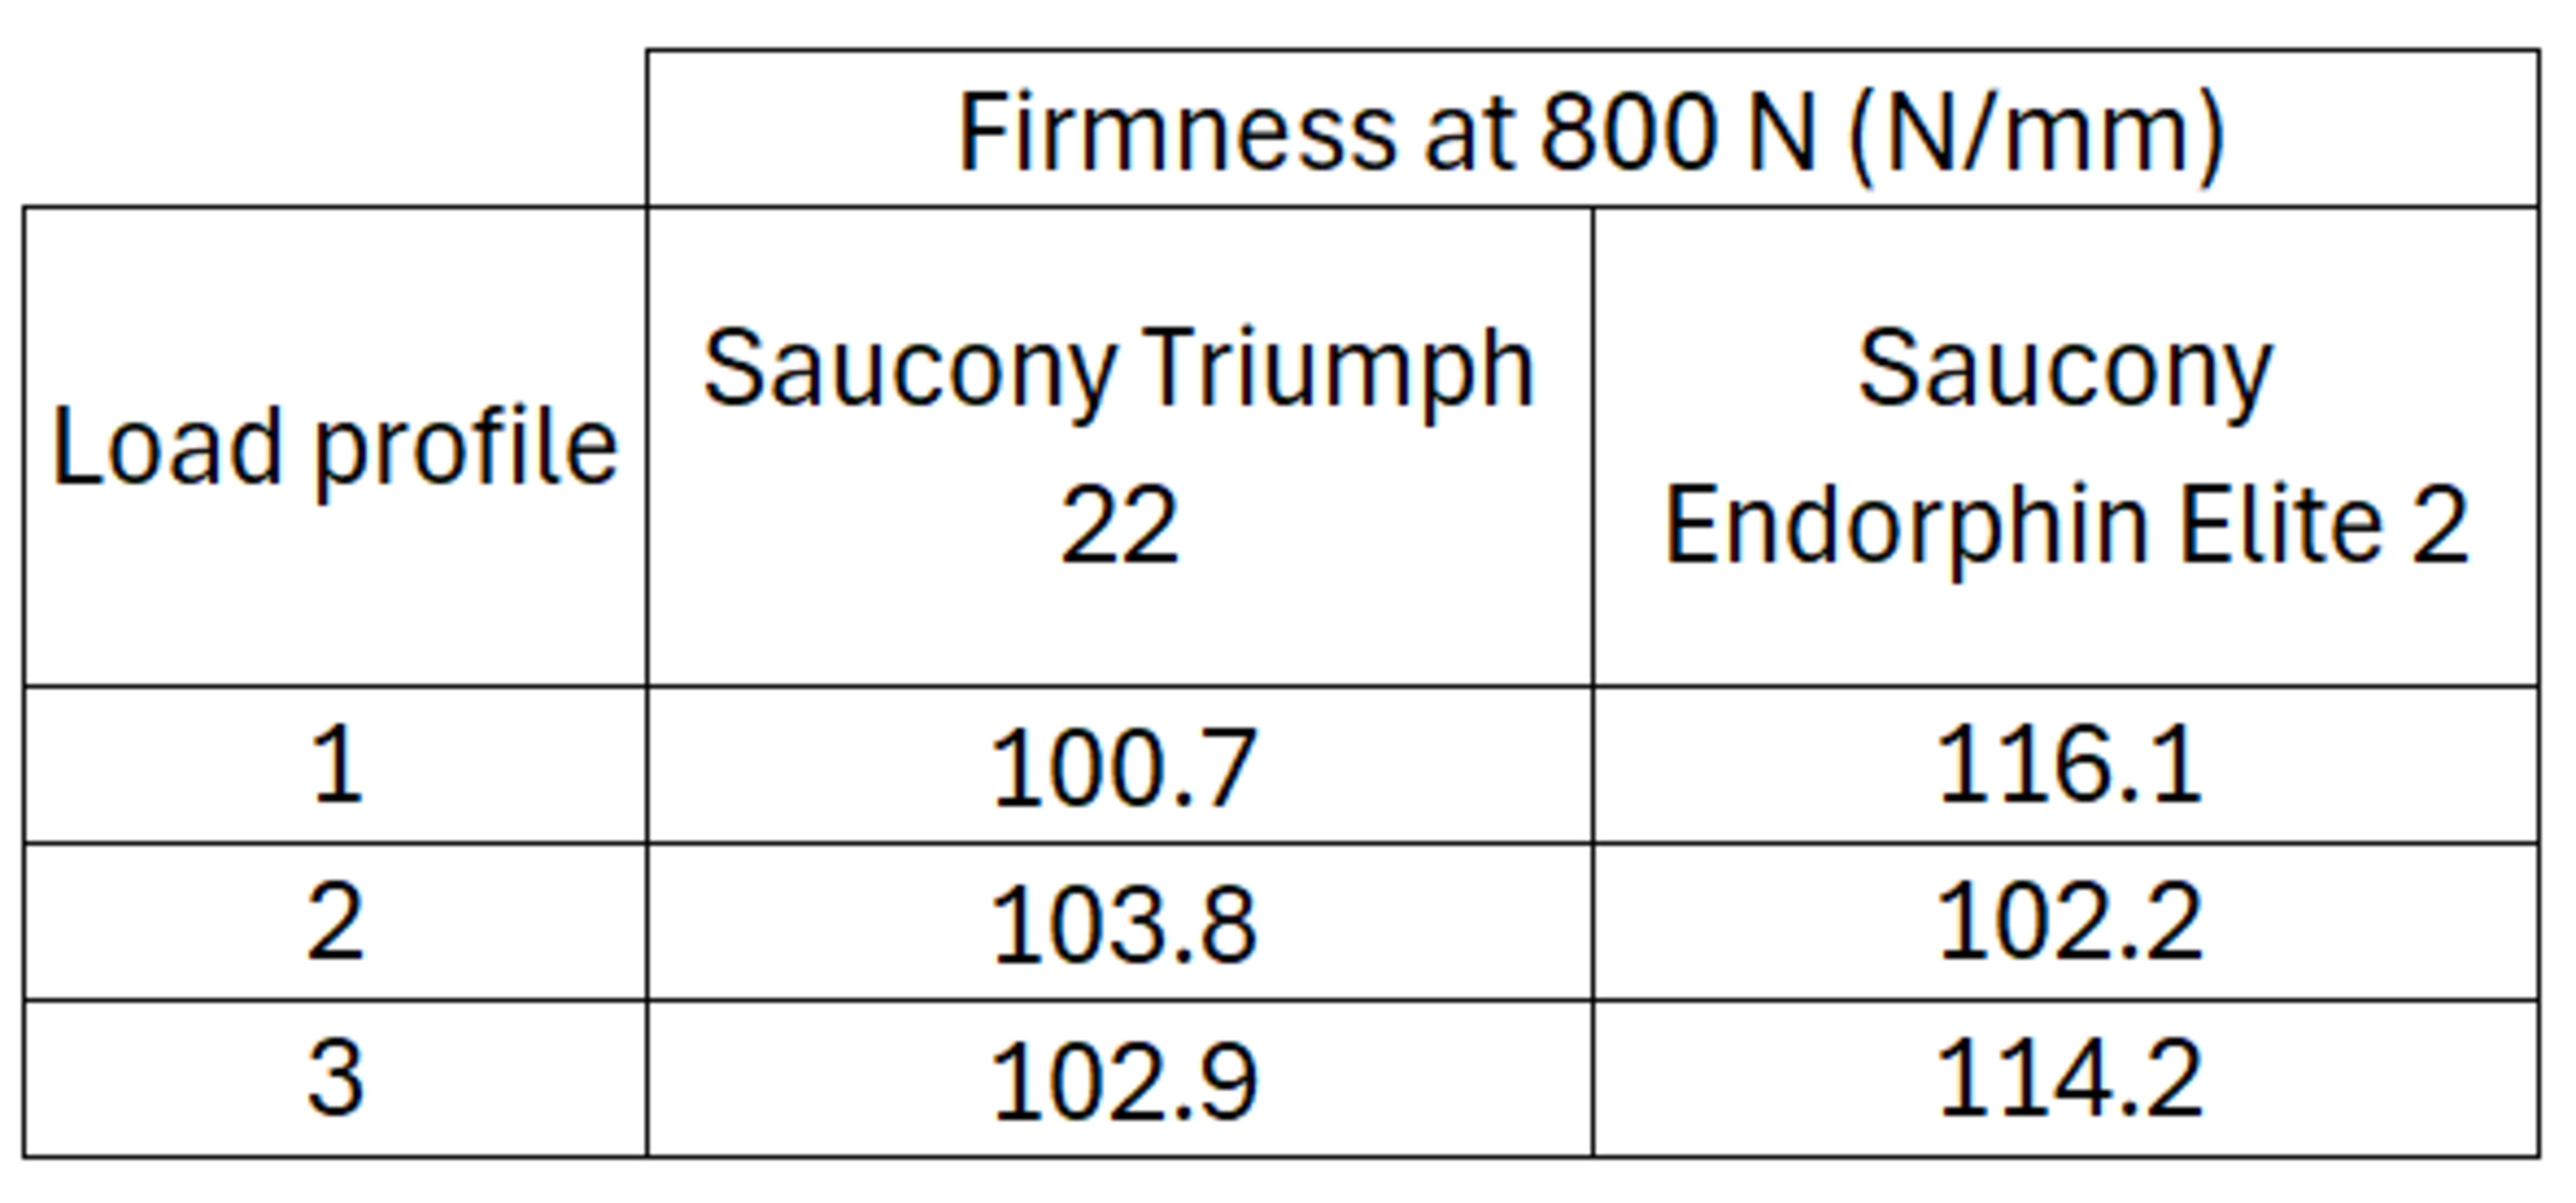
Firmness showed slightly more variation, with a maximum difference of 14 N/mm in the Saucony Endorphin Elite 2. However, this remains reasonable considering that firmness at 800 N across the first 10 shoes tested ranged from 82 to 194 N/mm. For other shoes, such as the Saucony Triumph 22, firmness was very consistent across all profiles.
In conclusion, even though the reference load profile is tailored to heavy runners at a fast pace, cushioning and firmness values can still be extrapolated to lighter or slower runners, as long as the corresponding load is known.
Conclusion
This running shoe test bench update was designed to provide more accurate load recommendations for users. We measured the load applied to shoes by runners using pressure sensor insoles and modeled load as a function of weight, speed, and cadence. It allowed us to build two tables to guide users on the loads they're likely to apply to their shoes. In the process, the compression machine's load profile was also adjusted, and representative parameters for the compression tests were established.
The impact of these changes on the reviews is limited, as scores were adjusted to account for the new loads. Although some notable changes occurred, such as the relative cushioning of the Alphafly 3 and Vaporfly 4, these differences are consistent with expected behavior. Overall, we're confident that our recommendations and testing now better reflect real running conditions.
Looking forward, we plan to continue using pressure sensor insoles to refine load recommendations and aim to transform this analysis into a practical tool that allows users to determine their own custom load ranges. We might also use the insoles for other purposes, and we would be happy to hear your thoughts or ideas on that. You can email us at feedback@rtings.com or leave a comment below.