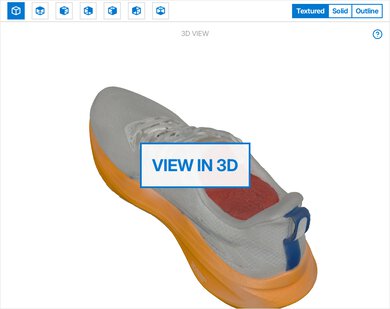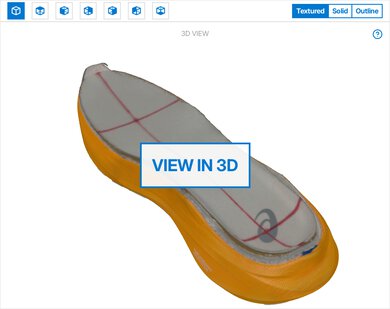
We've tested these running shoes to expand our database and allow users to compare results to help with their buying decisions. We don't expect to write a full review, but if you have any questions about this product, please let us know!
Our Verdict
Performance Usages
Changelog
- Updated Apr 29, 2026: We've converted this review to Test Bench 0.10, adding a new set of fit tests to the Design section and an overall fit performance usage. Check out the details in our changelog.
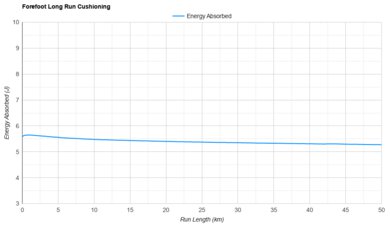
- Updated Apr 13, 2026: We've converted this review to Test Bench 0.9, which adds a Forefoot Long Run Cushioning test to our performance section. Read more in our changelog.
- Updated Nov 19, 2025: Review published.
- Updated Nov 18, 2025: Early access published.
Popular Running Shoe Comparisons
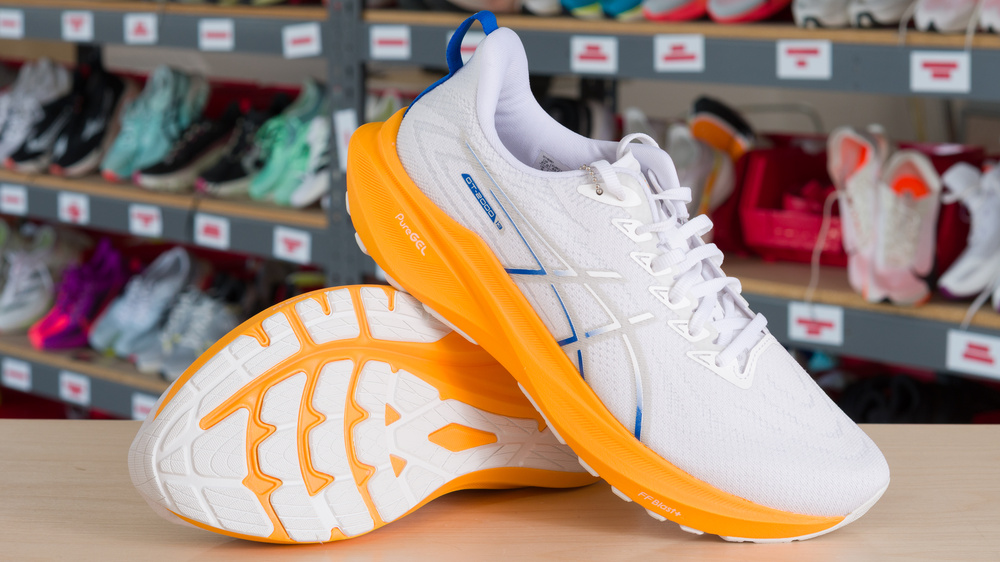
The ASICS GT-2000 13 and GT-2000 14 are both moderate stability daily trainers of the same series with very similar weight, but the 14 tweaks the midsole and geometry to feel slightly more cushioned and a bit less harsh. The 13 uses a firmer foam and a more old-school stability feel, while the 14 switches to a new compound, FF BLAST MAX, that softens the ride a touch and raises the forefoot stack slightly, giving a bit more protection and bounce up front.
The ASICS GEL-KAYANO 32 and the ASICS GT-2000 13 are both stability shoes, but they differ significantly in how they deliver support and cushioning. The GT-2000 13 is the lighter and lower-stacked of the two, making it feel more nimble but also firmer and less protective, especially on longer runs. Its 3D Guidance system provides mild to moderate stability through a flatter platform and structured midsole without the bulk of a full guidance wall. The KAYANO, on the other hand, uses a 4D Guidance system with more built-up sidewalls and torsional rigidity, offering more pronounced support and control, especially for heavier runners or those who overpronate significantly. It also rides softer and absorbs more shock thanks to its thicker midsole and higher stack, but feels heavier and less agile as a result.
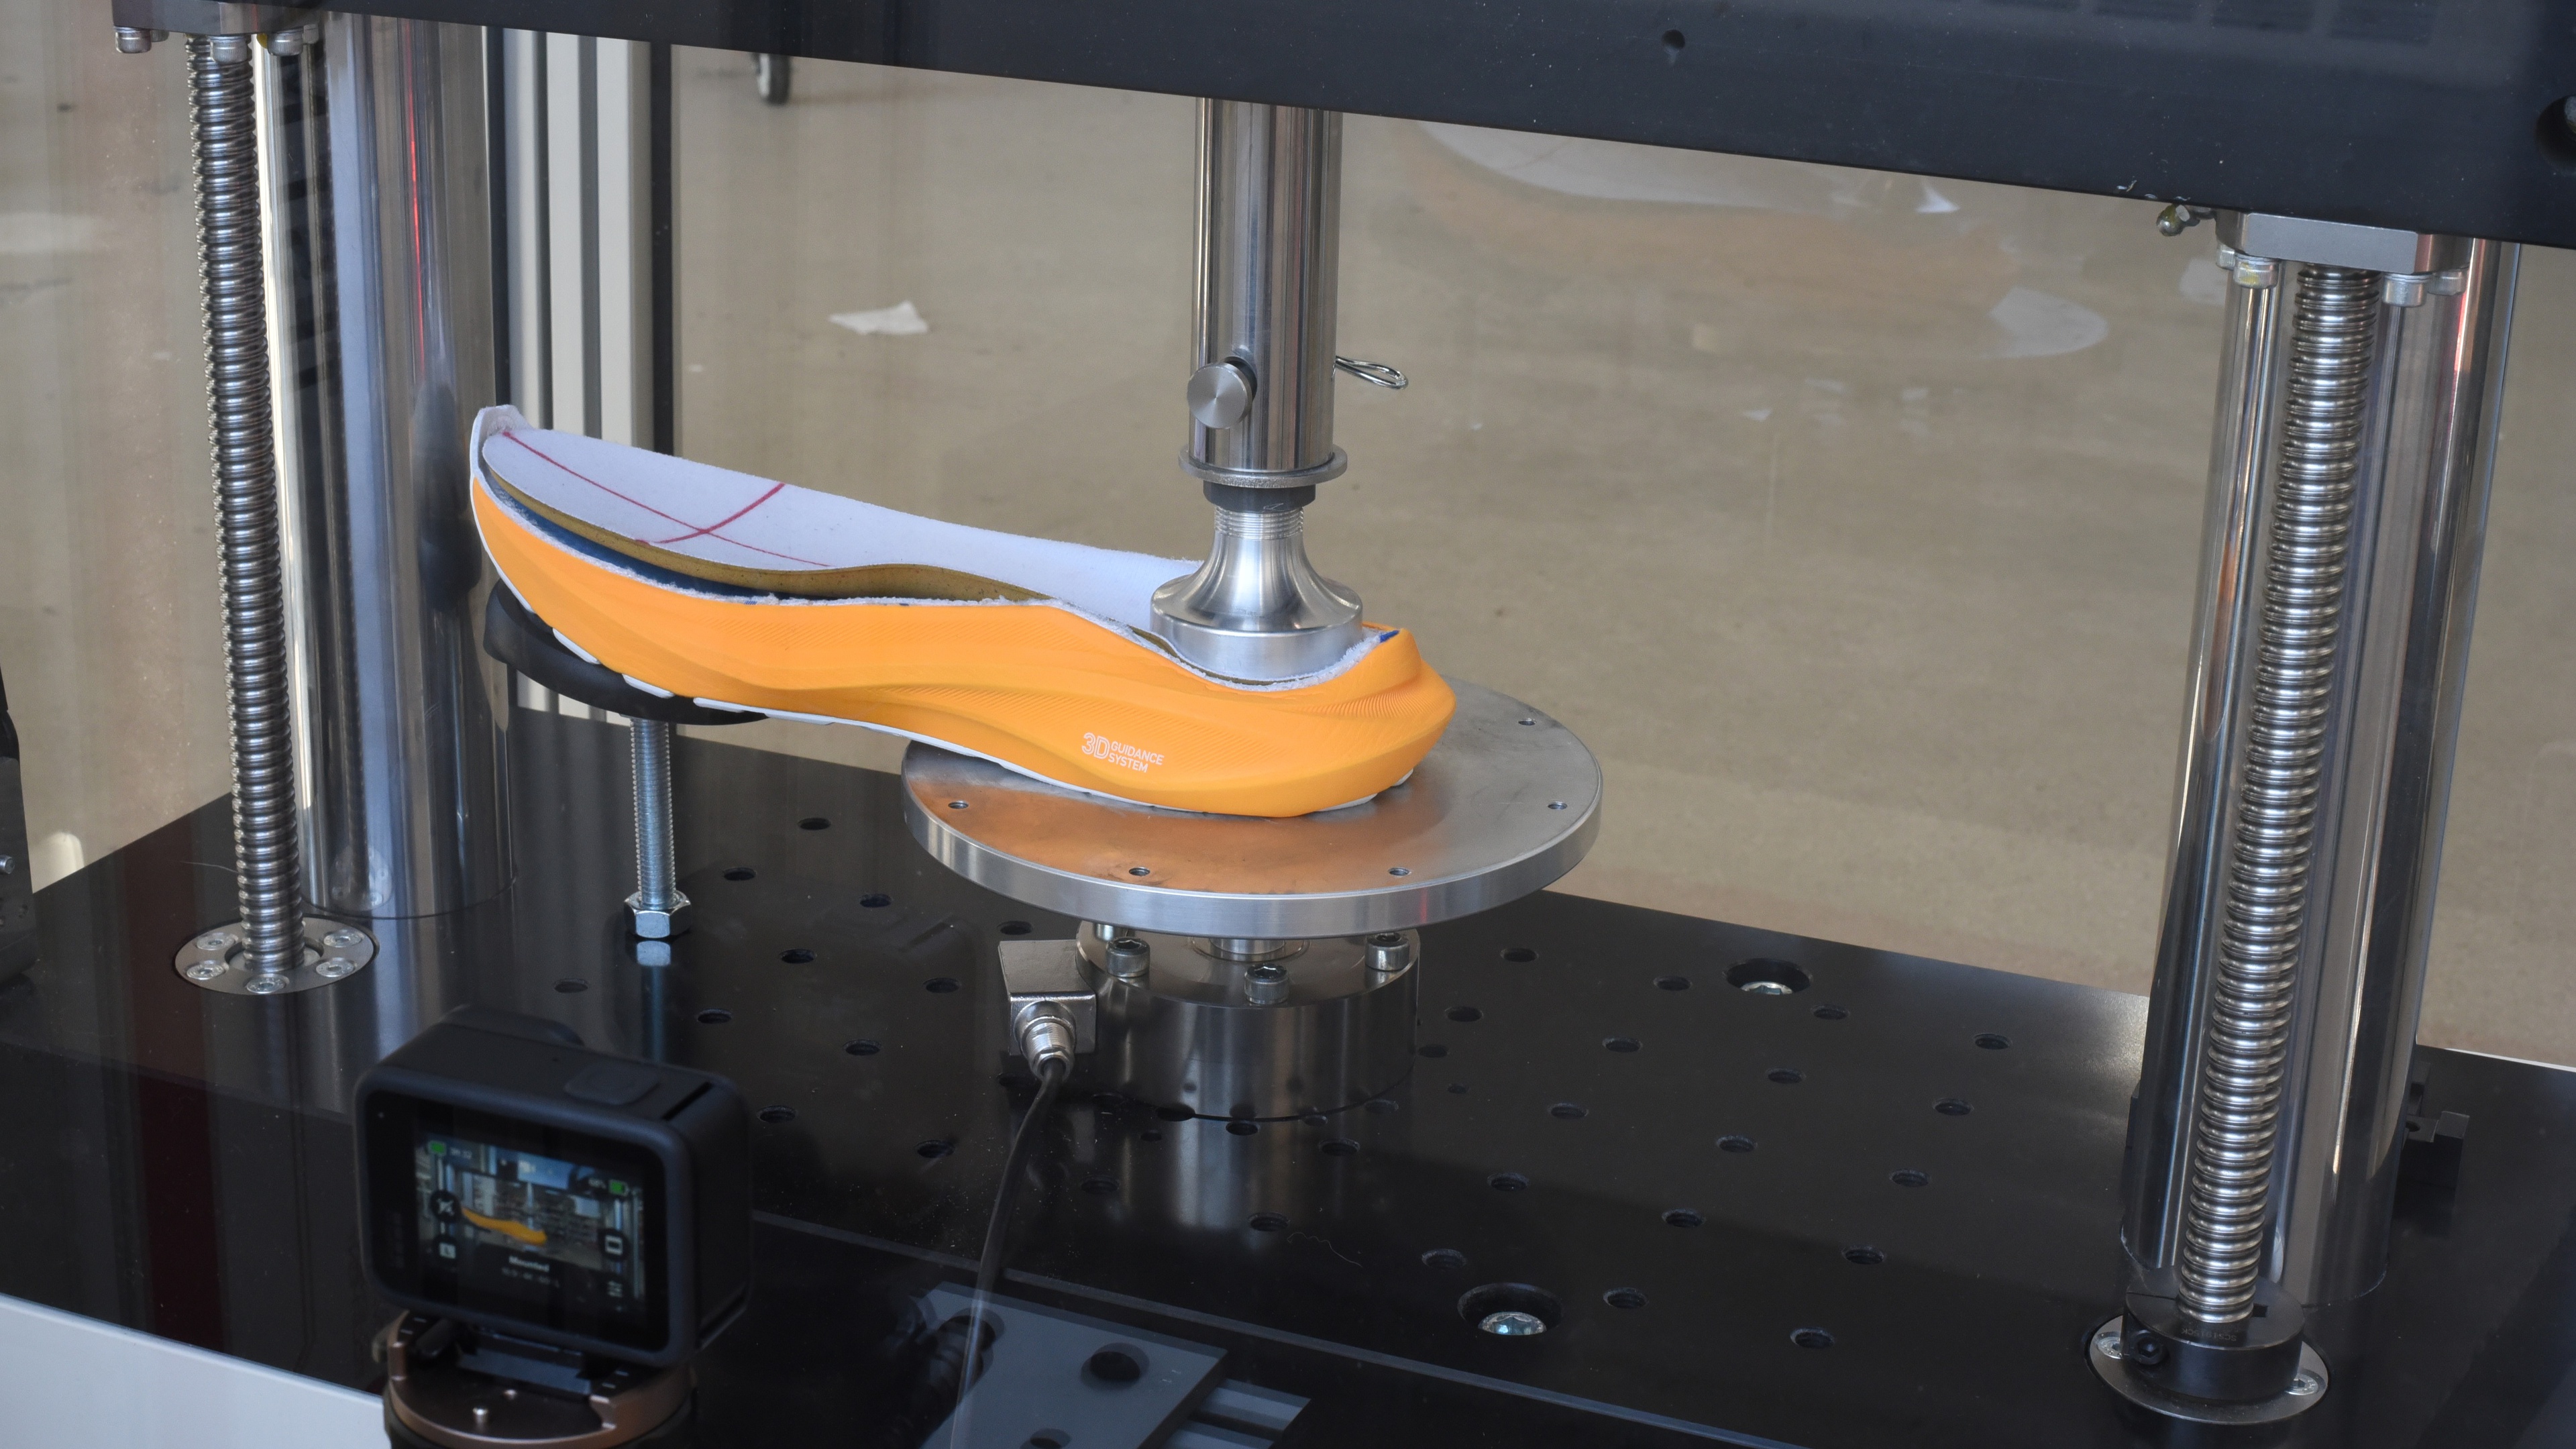
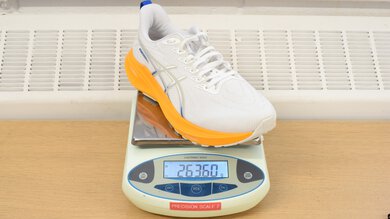
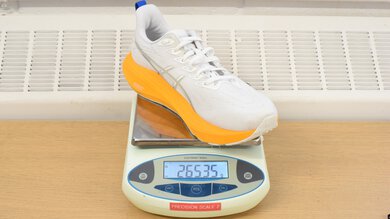
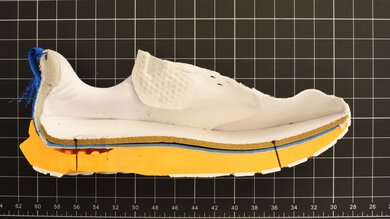
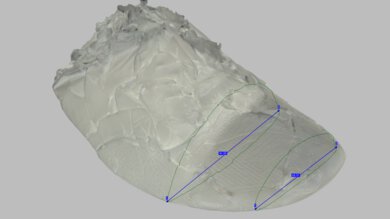
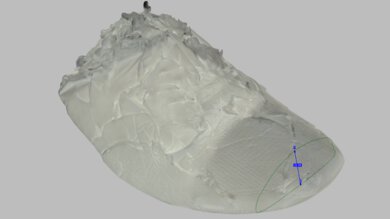
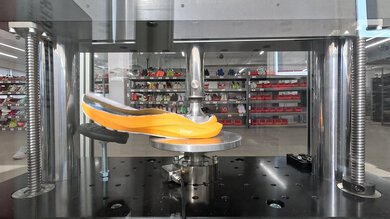
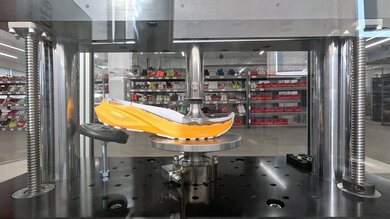
We buy and test running shoes with a very data-oriented approach. While we're just getting started, our methodology already has dozens of tests to help you make the right purchasing decision for your needs. Not only do we use high-end equipment to gather objective data, but we also order multiple sizes of the same shoes so team members can log in miles. This real-world testing is conducted at various paces and conditions, across different types of workouts, to cover all the bases. This allows us to verify our results and ensure they align with what you might feel with a specific pair.
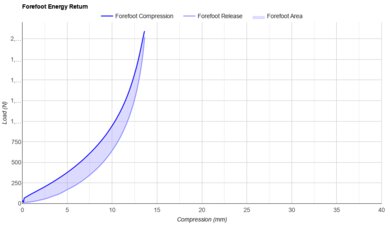
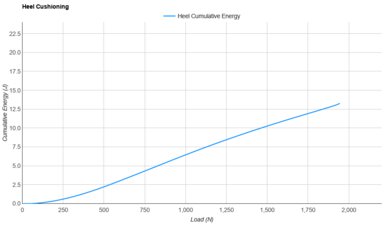
Test Results