Most cinematic content available is recorded at a frame rate of 24 frames per second (fps). This standard dates back to 1927 and was chosen as a good compromise between sound and image synchronization and the amount of film needed for recording. Later in the 1950s, 25 fps was adopted in Europe due to their power system infrastructure. More than a century later, the number of movies available at higher frame rates can be held on a relatively short Wikipedia page. One of the first big-budget movie releases at high frame rates was The Hobbit: An Unexpected Journey (2012), which received mixed reviews, with some noting that the high frame rate compromised the traditional cinematic feel. 24 and 25 fps were then maintained as a cinematic standard to preserve the movie's cinematic look.
On the other side, the television industry is introducing higher native refresh rates every year, going from 60Hz to 120Hz and beyond. However, these new refresh rates have a very limited impact on the cinematic content you're watching if you're using a mode in which the filmmaker's intent is preserved, and no motion enhancement technique is used. In Filmmaker Mode, for example, the television should display the original content without enhanced processing, and cinematic content will be displayed at 24 or 25 fps, depending on the region where the content was recorded.
In this article, we will review three types of artifacts primarily caused by the low refresh rate used in the entertainment industry: stutter, judder, and micro-judder. To some extent, we could even argue that the progression in TV technology and the inertia of cinematic content create a gap that enhances the perception of certain artifacts.
Pulldown
The concept of pulldown will be referenced several times throughout the article, and understanding it is essential to better comprehend how a television handles the conversion of different frame rates. There's a lot of nuance and interesting history behind this concept. It was originally performed with a telecine on an interlaced signal. There are still nuances in the way it is done when dealing with an interlaced signal, but we won't go into detail in this article, as interlacing isn't the main topic of this article; more information can be found on this Wikipedia page.
For the context of this article, it can be summarized by the challenge of adapting 24 fps cinematic content to television hardware with a 60Hz refresh rate. As shown below, one way to achieve this is to duplicate the odd frame and repeat the even frame three times. This is called a 3:2 pulldown. Today, the term pulldown is used for all sorts of frame rate conversions. With the introduction of 120Hz televisions, the term 5:5 pulldown is often used to describe scenarios where odd and even frames are duplicated five times to create a 120 fps video from 24 fps content. It's important to note that the pulldown process doesn't create new information; it merely repeats existing information. Therefore, the 5:5 pulldown 120 fps video is still perceptually viewed as a 24 fps video. A 2:2 pulldown is also often used by televisions to display 24 fps content on television that can only reach a 60Hz refresh rate. To avoid reducing the internal frame rate to 24, they will lower their internal refresh rate to 48 fps and apply a 2:2 pulldown to the content.

Display cinematic content on a high refresh rate television
The image below illustrates two approaches commonly used to display low frame rate content on televisions. There are always three main steps involved, depicted by the red arrows.
- The recorded original content is encoded on a disc or media file
- The television and the video streaming device handshake to a specific signal frequency. This frequency will be used to play the video content.
- The television processor applies a transformation to the signal that will allow it to buffer out the frame to the display using the refresh rate available on the display.
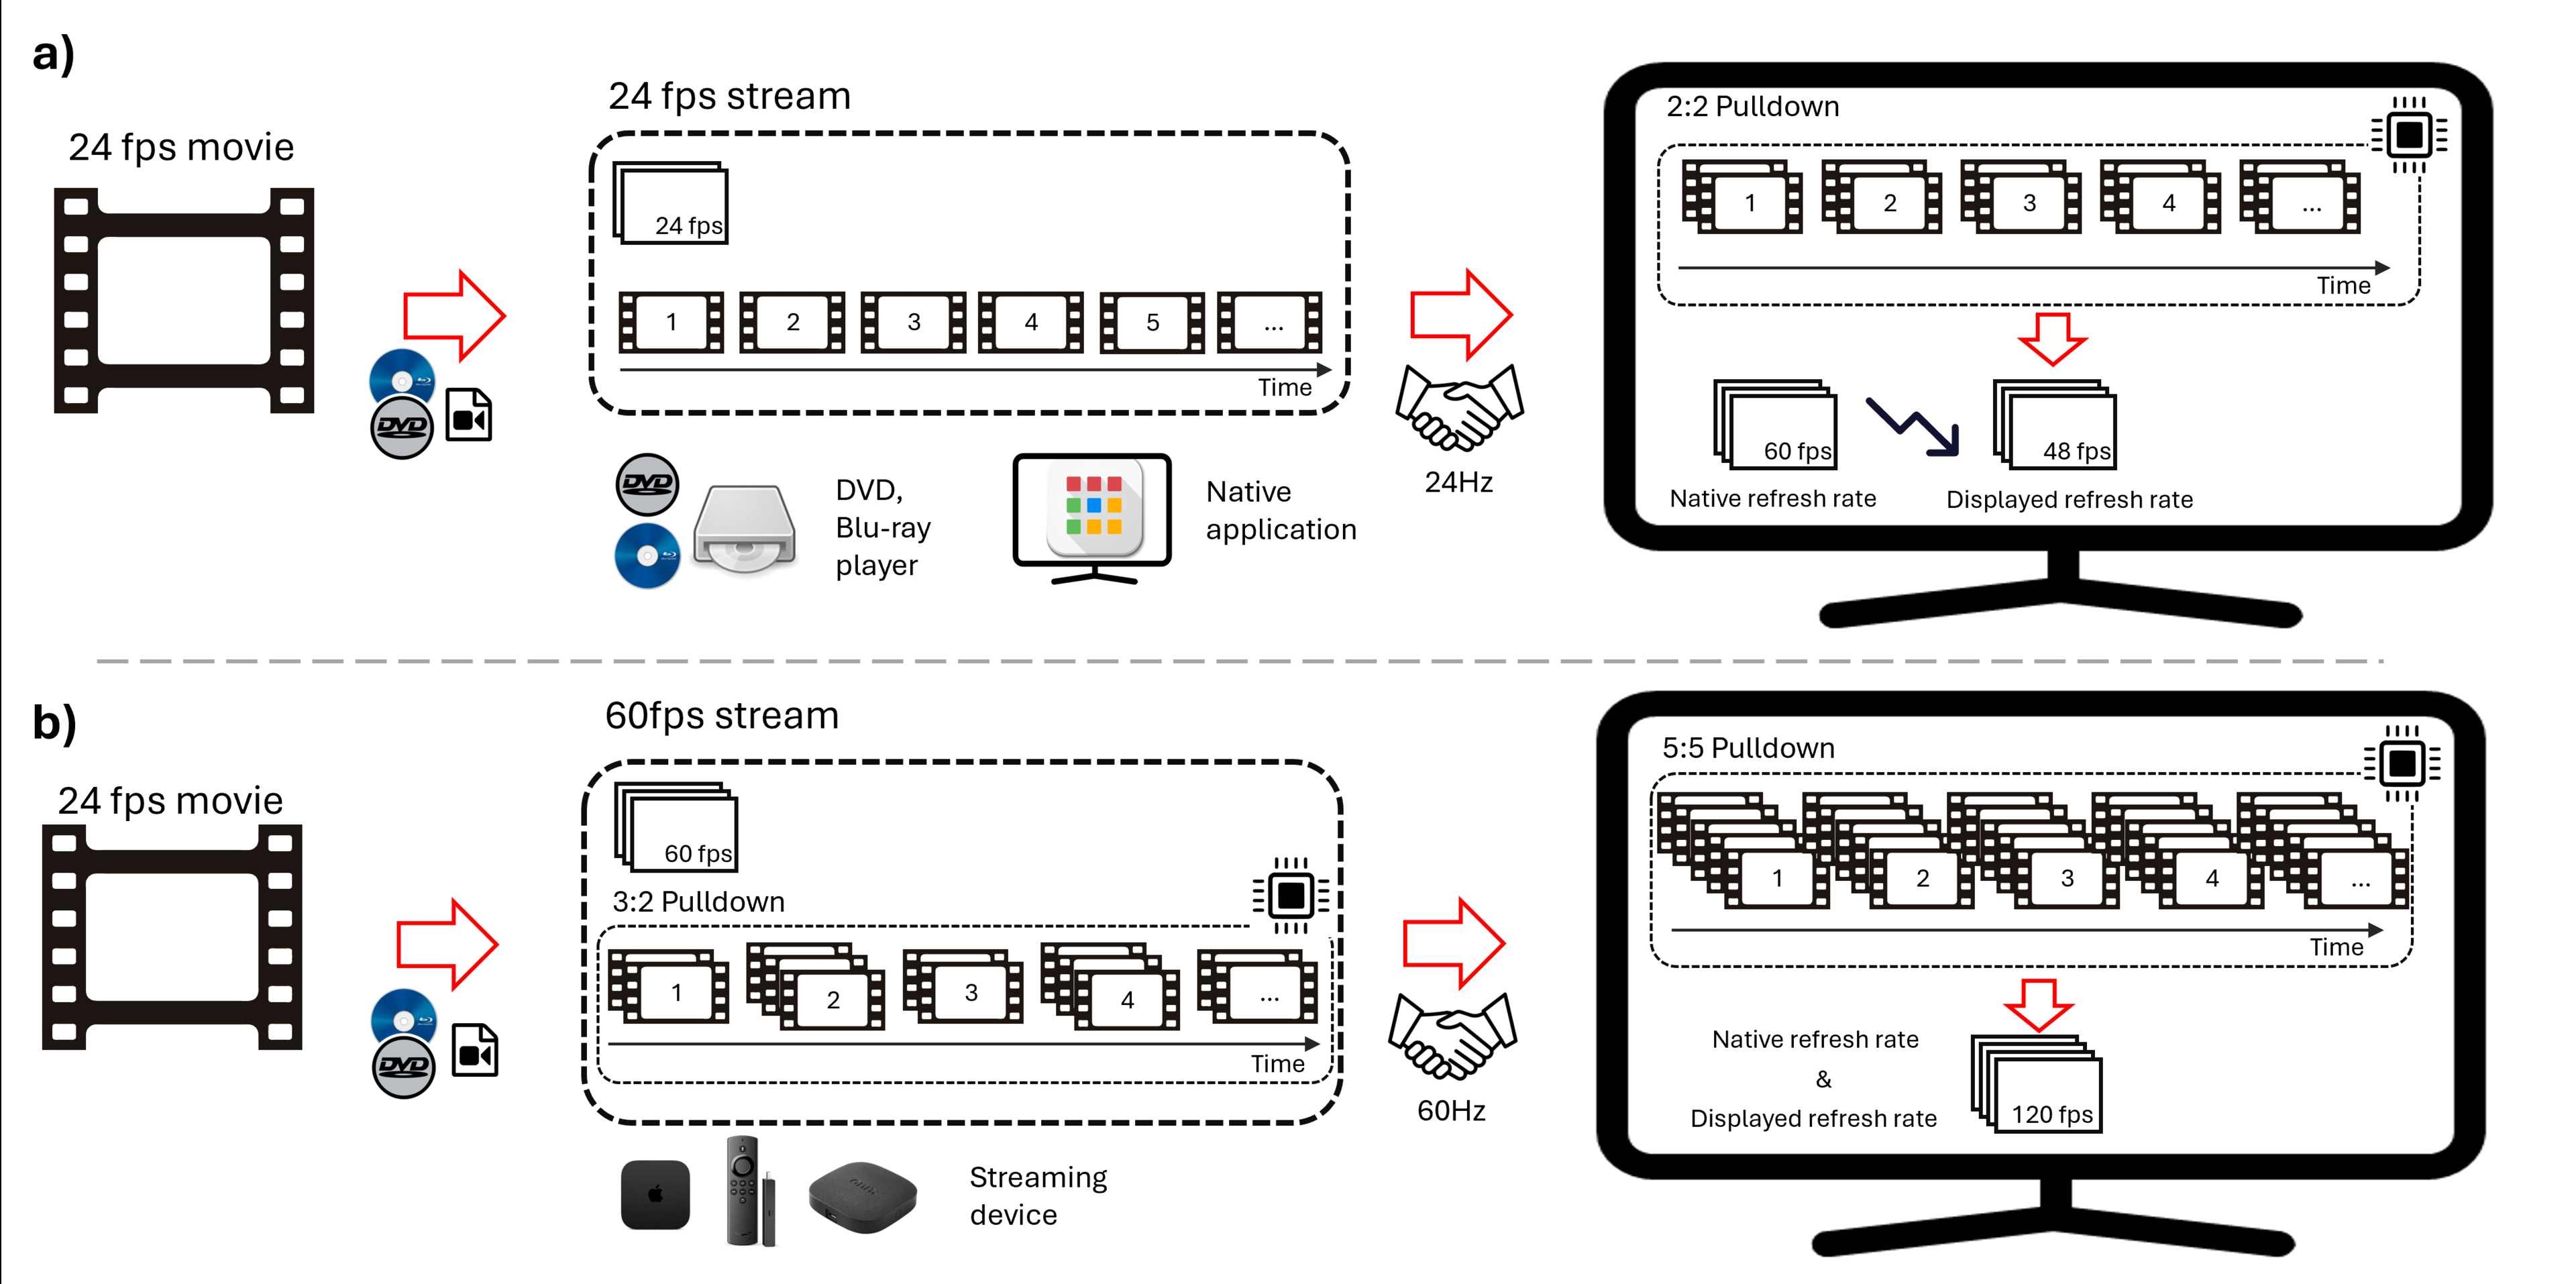
In the simplest case of scenario a) above, the video is encoded on a disk or a media file that can be played directly on the television. The content is played using a DVD, Blu-ray player, or the television's native apps, conserving the native frame rate, since the television handshakes to the video signal frequency. It often happens that the television can't lower its refresh rate as low as the video signal, so it might use a strategy such as a 2:2 pulldown to create a 48Hz signal.
It becomes slightly more complex with streaming devices, as shown in scenario b) above, which typically operate at a 60Hz signal. Since the media file is in a 24 fps format, it will first need to be 3:2 pulldown by the streaming device. Some television processors will be able to detect this sequence of 3 and 2 before sending the frame to be displayed. The processor will undo the 3:2 pulldown and recreate its own pulldown that matches the display. This scenario illustrates an example of a 120Hz television. Such television might decide to perform a 5:5 pulldown instead of lowering its internal frame rate to 48 fps. For the television that can't de-judder, it will replay content as it is received, and the display will present judder.
For cable boxes used to display broadcast content, the situation is similar to scenario b). Most broadcasters are using 60i, which is generated from original 30 fps content that is interlaced. Since cinematic content is mostly available in lower frame rates (fps), it's typically converted to a 60i format by either the broadcaster or producer, typically using a 3:2 pulldown. From that point, the television with the capability will detect the judder pattern and apply its own pulldown strategies to display the content.
The image above shows a typical example. There may be some variation in how television executes pulldown and the internal refresh rate it adopts for each strategy. Important points to keep in mind, though, are that the television always handshakes to a specific frequency signal and needs to transform this signal to an internal frequency it can display using some pulldown strategy.
Quick media switching (QMS)
Most of the streaming devices presented in scenario b) also offer a matching frame rate option. With this option activated, the handshake with the television will constantly change in response to the content. The downside is that every time you change content, a black screen appears with a re-handshake of your device and the television. Some televisions are starting to use quick media switching (QMS), which adds a step between the processor and display that automatically adapts to the inputted frame rate. There are only a few televisions that support that feature.
Stutter, Judder, and Micro-Judder Explained
Stutter and judder are often misused and confused with each other in the display community and scientific literature. Interestingly, judder is often used in scientific literature instead of stutter because stutter is more easily confused with research on speech impairments. Twenty-five years ago, one of the most visible cadence artifacts was judder. Displays were limited to 60Hz, while the content was recorded at 24 fps. As a result, the broadcast signal had to be sent using a 3:2 pulldown to match the 60Hz refresh rate of the television. With LCDs and OLEDs on the market today, these technologies can now mitigate the judder; however, they also enhance the perception of the stutter artifact. Stutter was also present for CRTs and plasmas, but these technologies, by the way they operate, didn't make the artifact very visible. As the judder artifact became less problematic, the stutter artifact became a problem. Both artifacts can be confused because they are mainly apparent in panning shots and share some similarities.
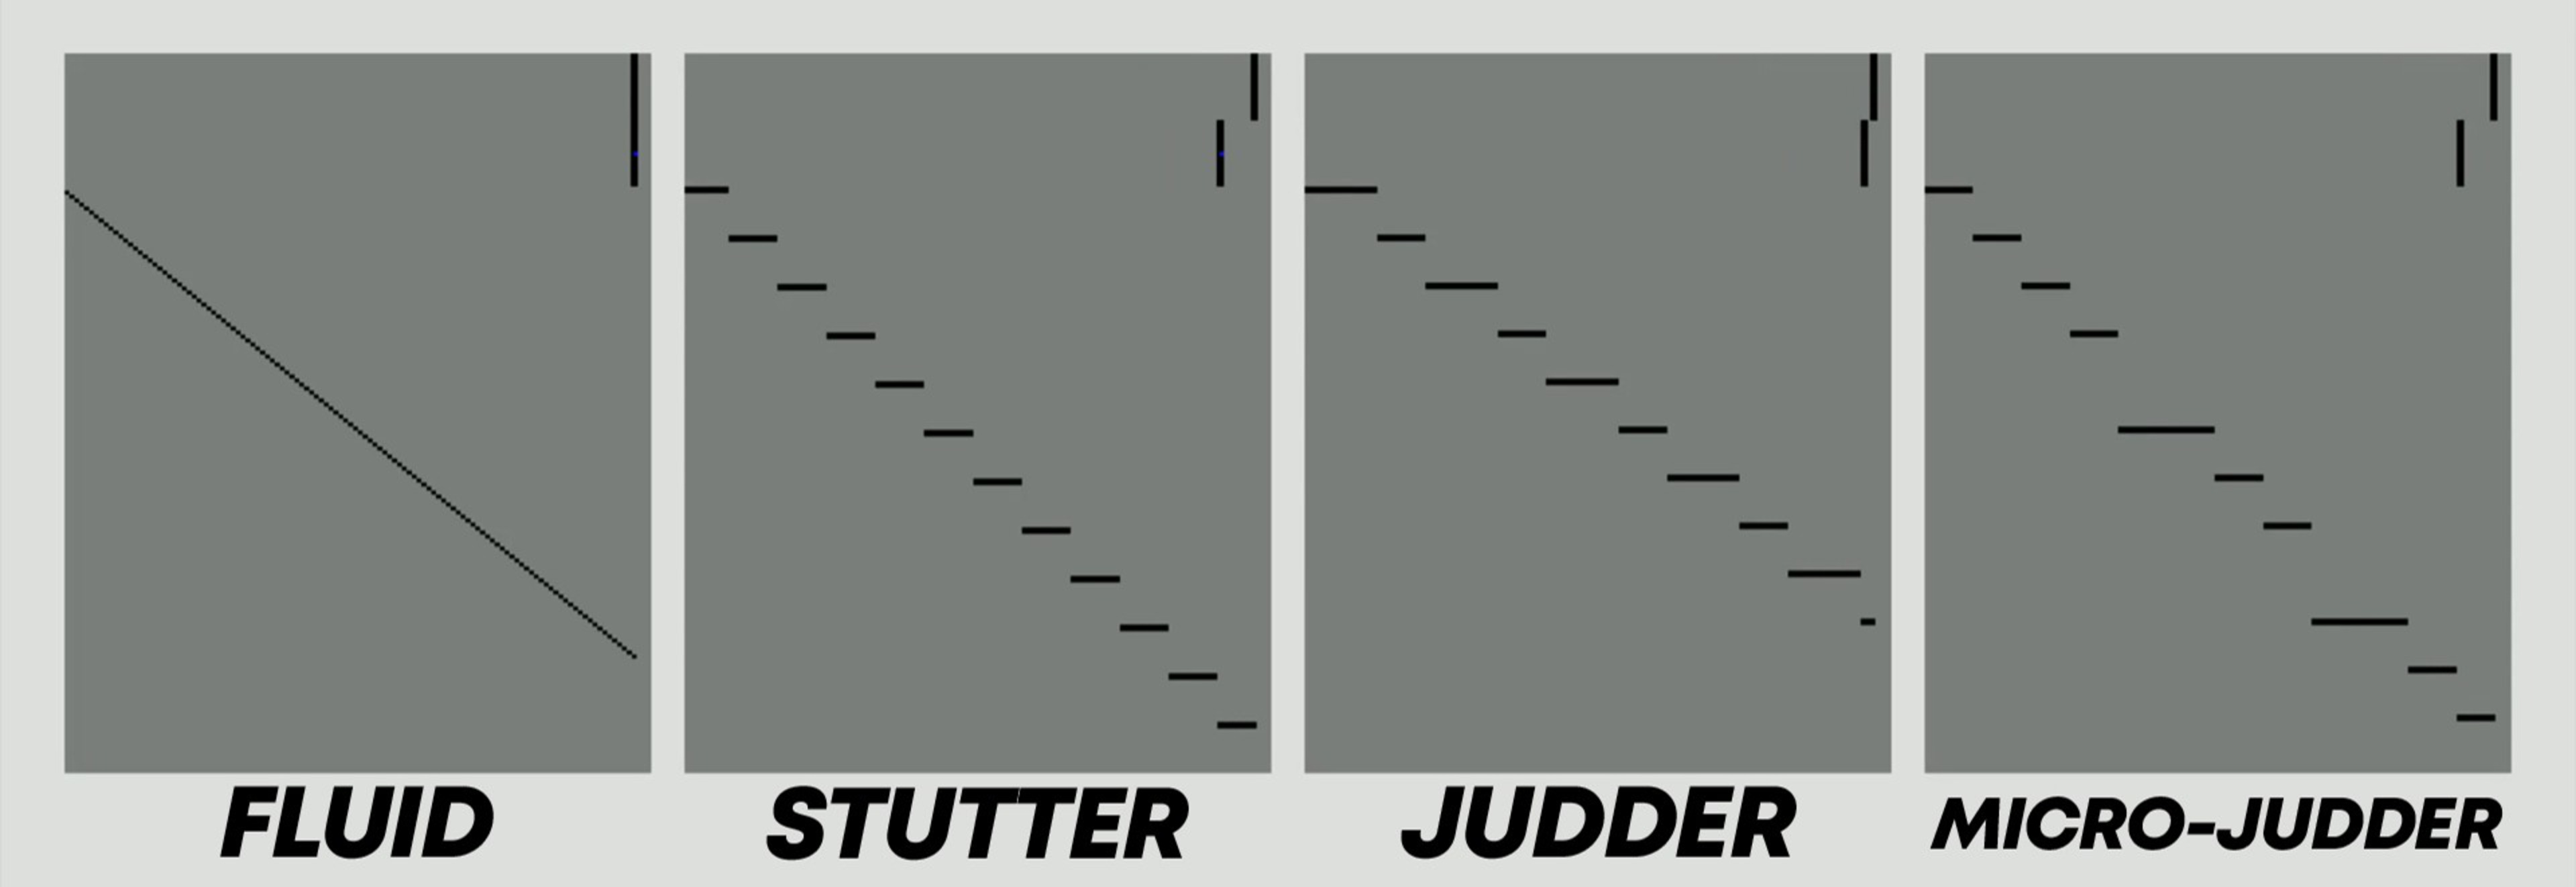
We'll use the image below to better explain the difference between stutter and judder. This is a time-position motion diagram popularized by Watson et al. The y-axis represents the position as a function of time on the x-axis. The perfect motion on such a diagram is presented by the purple line, which shows a new updated position of the moving object for each increment of time. To describe the effect of stutter and judder, we present the diagram with an example of a spinning wheel.
Stutter is seen as a choppy movement that results from a discrete number of steps (e.g., 24 movements per second) to replicate a continuous movement. The wheel information is available for each eighth of a turn, and the lack of information between those states creates the effect of stutter. On the time-space motion diagram, it results in a horizontal line distributed along a stair pattern. Each position of the wheel is held for a certain amount of time before it jumps to its new position. A straightforward solution to this problem is to increase the content frame rate; however, this creates what is known as the soap opera effect.
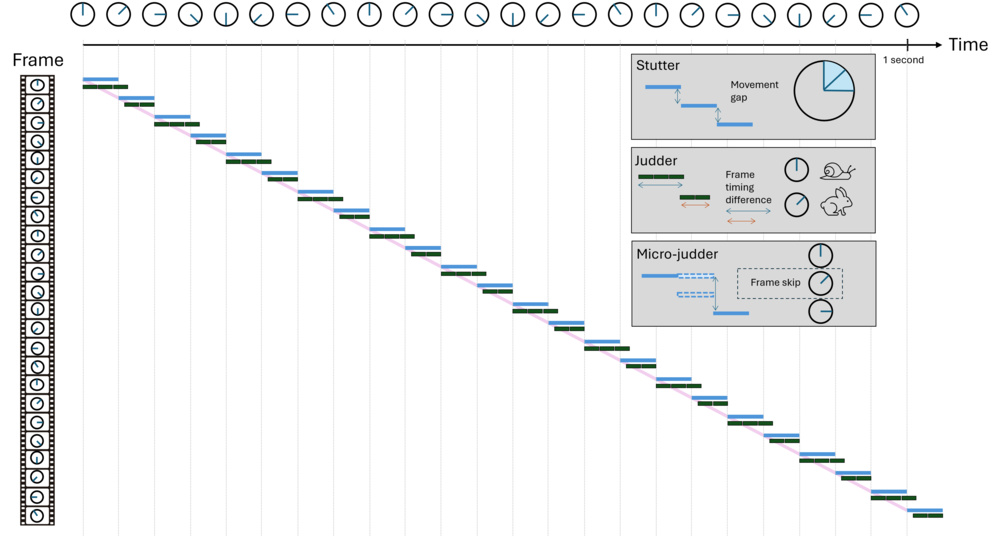
Judder occurs due to a non-uniform frame rate caused by the 3:2 pulldown process. Although the content remains at 24 fps, the television can only refresh 60 times per second. As a result, each odd and even frame is repeated three and two times, respectively, to convert the 24 fps to 60 fps. As illustrated above, this results in the wheel staying in one position longer than the others. From a perceptual perspective, it seems that the wheel constantly slows down on one frame and speeds up at the next.
Finally, micro-judder is seen as a sporadic latency in the content caused by the drop of one or multiple frames by the television. It typically occurs when the television is processing additional content. Since the processor must process the frame, if it can't do so on time, it will need to drop the current frame and start processing and displaying the next one.
How do these artifacts affect the viewer?
Micro-judder is the most disturbing artifact and can be seen in any content when it is present. Most of the time, the user blames the artifact on a poor internet connection, although it may be micro-judder from the television.
Judder and stutter are usually more subtle and highly dependent on the individual. From a quick survey of RTINGS.com employees and an extended discussion with the community, no one perceived those artifacts the same way. This isn't surprising, as scientific literature has shown that human perception of motion differs between individuals, so more subtle motion artifacts might be perceived differently across the population. Nonetheless, everyone will be able to see the judder and stutter effect on a long horizontal panning shot as the continuous tracking of our eyes on a discrete horizontal movement exacerbates the perception of stutter and judder. Someone from the community shared a good example of a long horizontal panning shot with us, available on YouTube, extracted from the R.E.D. movie (2010).
The effect of those artifacts is cumulative. One scene could have all three of those artifacts. The video below presents the effect of each artifact added artificially to an original 120 fps video. The top left video is lower to 60 fps and presents a fluid motion. The top right video reduces to a frame rate of 30 fps, which will add more stutter but not judder. Finally, the bottom video was reduced to 24 fps and pulldown to 60 fps to add judder. Judder is often seen in conjunction with stutter because judder is mainly seen in 24 fps and 25 fps content, which invariably presents stutter. The compiled video below is generated assuming it's displayed at 60 fps or any higher multiple (e.g., 120Hz).
The micro-judder video was placed on another video because its effect is so distracting that comparing it with the other artifacts is difficult.
Judder: 24 Doesn't Fit Evenly Into 60
Two factors need to be met to see judder in content:
- The video stream received by the television has some non-uniform pulldown (e.g., 3:2 pulldown).
- There is a lot of content today that is available at 30 fps, such as sports and news, which won't present any judder since 30 Hz fits evenly into both 60Hz and 120Hz. Judder is a common occurrence when watching cinematic content on a media player that has a handshake at 60Hz.
- The display shouldn't be able to apply de-judder correction.
- Often, a computer monitor or projector can't de-judder.
These days, most mid-range televisions and above can handle judder just fine. Our table tool with test bench 2.0 only shows 17 products out of 70 that can't de-judder. The worst is the Samsung Q70D, which can't de-judder a 24Hz signal. This means the television cannot change its internal frame rate to match the content's frame rate and must stay at 60 fps, inevitably introducing judder. In this specific case, the judder is added by the television to display the 24 fps content on the 60Hz display.
In this test bench update (2.1), we introduce the de-judder for 25 fps content. 25 fps is most common in Europe, and as streaming platforms democratize content from outside North America, 25 fps content is becoming more prevalent. A recent example is the Netflix mini-series Adolescence. Judder is particularly visible in that series because it was filmed in a single shot, which creates a lot of panning shots across all episodes. One of the best stress tests is the final drone shot at the end of episode 2.
Our test
Our test uses a video of a rectangle that moves across the screen to a new location at each frame, covering the whole screen in a second. We take a long exposure picture of 1 second from this video. A uniform picture, as shown below for the LG UT75 at 24 fps, proves that each square is displayed for the same amount of time, indicating a uniform frame rate. For the Samsung QN90F, each rectangle has some shading variation, but they're all identical. That shading variation inside each rectangle is the result of local dimming, which cannot be completely turned off on the Samsung. Among the 10 TVs we tested, the only one that still failed to display 24 fps from 60Hz is the LG UT75, which shows a checkerboard pattern revealing the 3:2 pulldown, with brighter and darker rectangles.

What is more interesting is comparing different televisions at 25 fps via 60 fps. None of the televisions can de-judder properly, but some are doing a much better job than others.
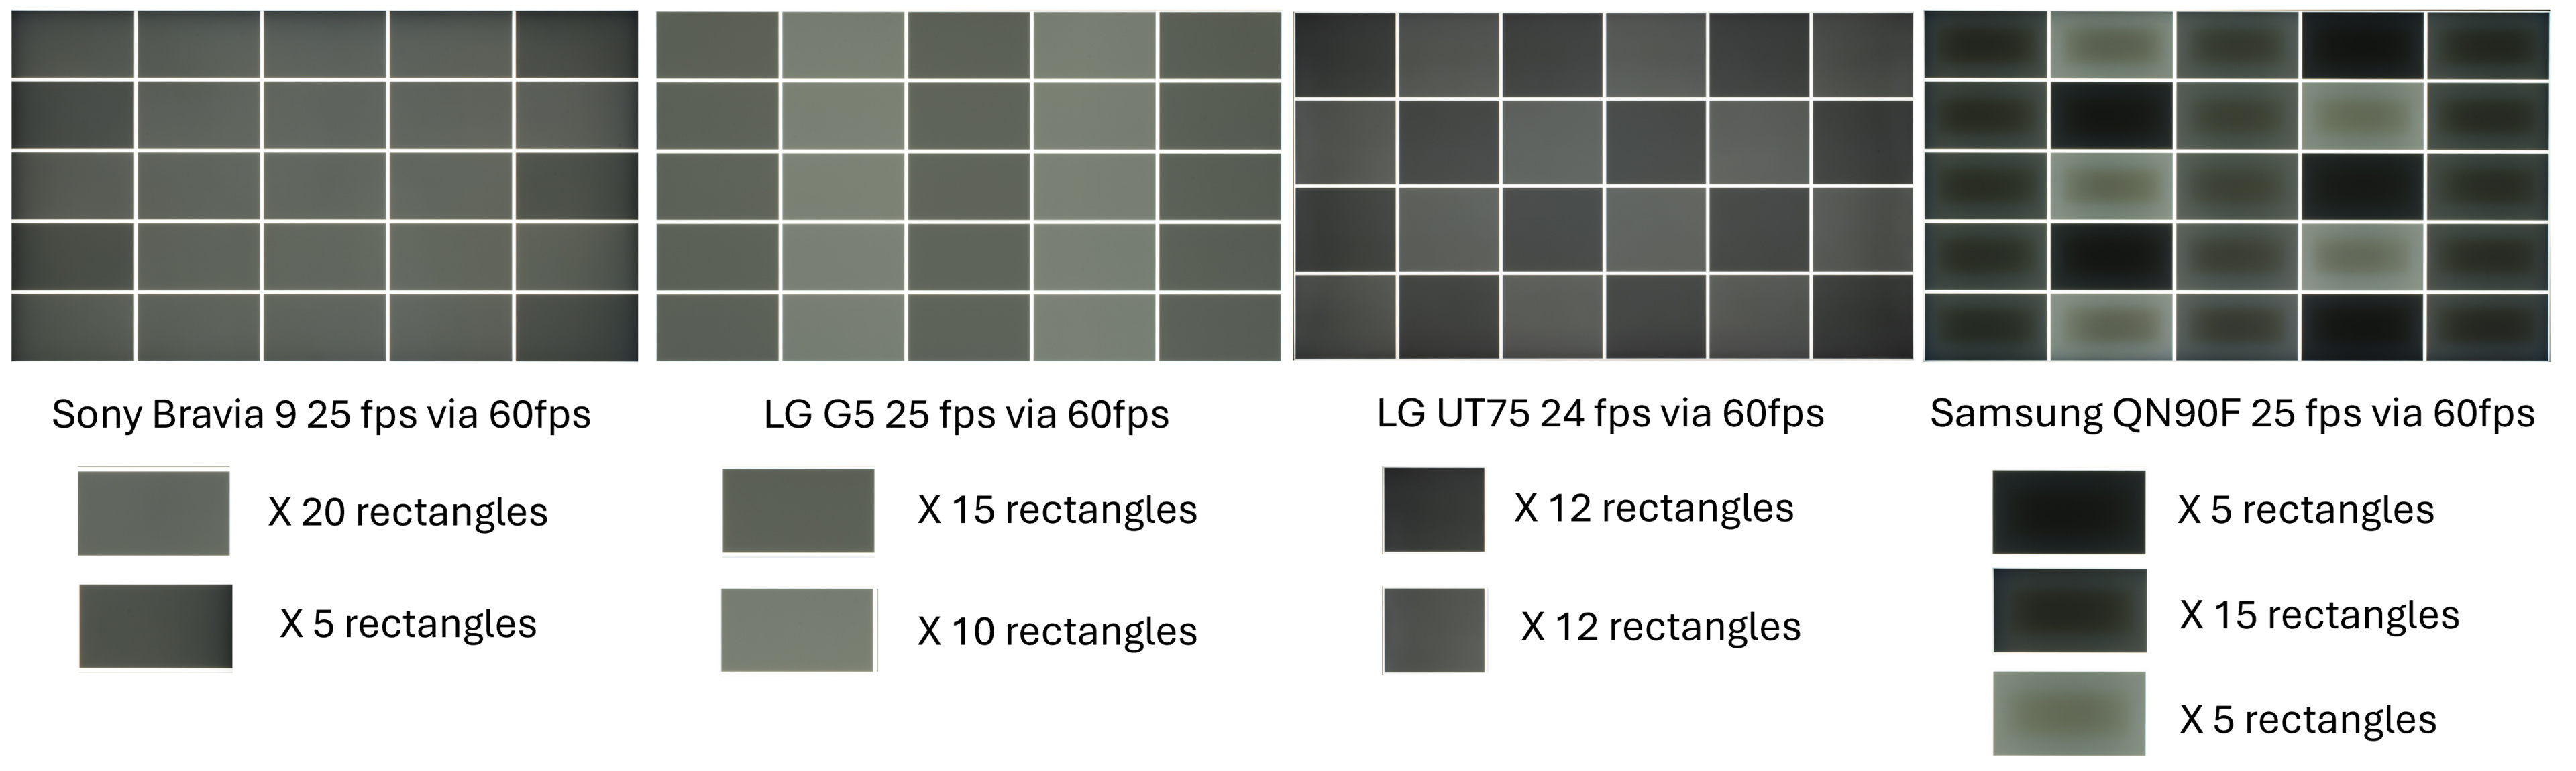
We initially ranked the judder with a simple yes or no, but the image above made us realize that not all judder is equal. As we mentioned before, judder is very difficult to evaluate, as no one perceives it the same way. For this reason, we decided to use a subjective score based on the number of equal rectangles, the number of different shades of gray, and the perceptual impact on real content. For this reason, we also included the photo of the different judder patterns in the test results, as it provides insight into the effect judder will have on motion perception.
Micro-Judder: No, Your Internet Isn't Lagging
Micro-judder presents itself as sporadic frame drops throughout the content. The term micro-stutter is also used to describe micro-judder; however, we decided to use micro-judder as the official term because "judder" better represents frame inconsistency than "stutter."
So far, our research has shown that it mainly occurs when the television is in a situation that requires more processing (e.g., de-judder mode), in which case, the television must drop a frame if it can't process the frame in time. For this reason, a television doesn't present any micro-judder when using a native application or when the content frame rate is matched. Additionally, television sets that lack de-judder functionality, such as the LG UT75, won't exhibit micro-judder, as they perform very little processing. For now, we only evaluate micro-judder for different frame rate modes; however, our work and that of other reviewers suggest that other, more demanding tasks, such as video format processing and motion interpolation, can also create micro-judder.
Our test
While the micro-judder can be observed in any content, we evaluate it using two panning scenes for 24p and 25p content, as it's more easily visible in these types of scenes. Each scene is replayed three times to ensure the frame drop isn't a one-time issue.
All of the Sony TVs we reviewed in test bench 2.1 exhibited the most micro-judder when using a streaming device via 60p with Cinemotion settings set to high to de-judder. For any Sony television, we strongly suggest using the native applications or using the settings on an external streaming device that matches the outputted signal to the frame rate of the content.
The Samsung QN90F was difficult to evaluate at 25p via 60p because the de-judder is so bad that it introduces a constant rate of micro-judder (dropped frames). The frame drops aren't sporadic and look more consistent, but we still decided to rank it as micro-judder. The Samsung also exhibits a small micro-judder every time we start the video.
While this isn't within the scope of this test, the Hisense U8QG proved to be a nightmare to test because it was very particular about the video format we sent it. We had to adjust the soundtrack and reduce the bitrate to ensure the video played consistently on the Hisense. The other format showed a very inconsistent result. In the end, even if the Hisense doesn't present any micro-judder at 25 fps, some video formats could trigger it. We often use the scene from The Queen's Gambit Episode 6 at the timestamp 41:30 in our test because it features a very long panning shot. This scene often triggers micro-judder on the Hisense, even on native applications. Those observations are outside the scope of our test, but this might trigger the development of future work to evaluate television consistency for different video formats.
Stutter
When we first released the "Four Pillars of Motion" article and video, stuttering was the most common topic from the community. Unfortunately, this is probably the most complex issue to fix.
What is stutter?
We will divide the discussion of stutter into three main aspects. First, we will discuss the origin of stuttering, which is due to low frame rate content. Next, we will examine television characteristics that influence the perception of stutter, such as brightness, screen size, and sample-and-hold strategy. Finally, we will explore how external factors, like scene content and user perception, can affect stutter perception based on content and user variability. To summarize, here is a list of parameters that influence stutter.
- Refresh rate (stutter generator)
- Brightness (stutter amplifier)
- Screen size (stutter amplifier)
- Sample and hold strategy (stutter amplifier)
- Scene (Perception variability)
- User sensitivity (Perception variability)
To analyze these various aspects, we will use the time-position motion diagram shown below. The diagram illustrates the movement of a pixel traveling from left to right at 240 pixels per second. As it moves, the pixel shifts color from bright gray to darker gray at each frame. This image focuses only on the first three frames for clearer visualization. Each jump at 24 fps results in a 10-pixel change in position (24 fps x 10 pixels = 240 pixels per second). Each frame at 24 fps is displayed for approximately 41.67 milliseconds. The diagram is set against a dark background to highlight that the absence of a signal appears as black. The continuous diagonal line indicates ideal motion if the content were displayed at an infinite frame rate.

It's All About Frame Rate
The cause of stutter lies in low frame rates. Stutter appears as a slide show effect that creates a perceived gap between every frame instead of fluid motion. Increasing the frame rate reduces the gap between frames. The image below shows the time-position motion diagram for various frame rates. As the frame rate increases, the stair-step pattern of stutter becomes narrower, and the motion approaches the continuous line that indicates smooth movement.

What Televisions Can Do
From a television perspective, brightness, screen size, and sample and hold strategy are the main factors that significantly affect stutter perception.
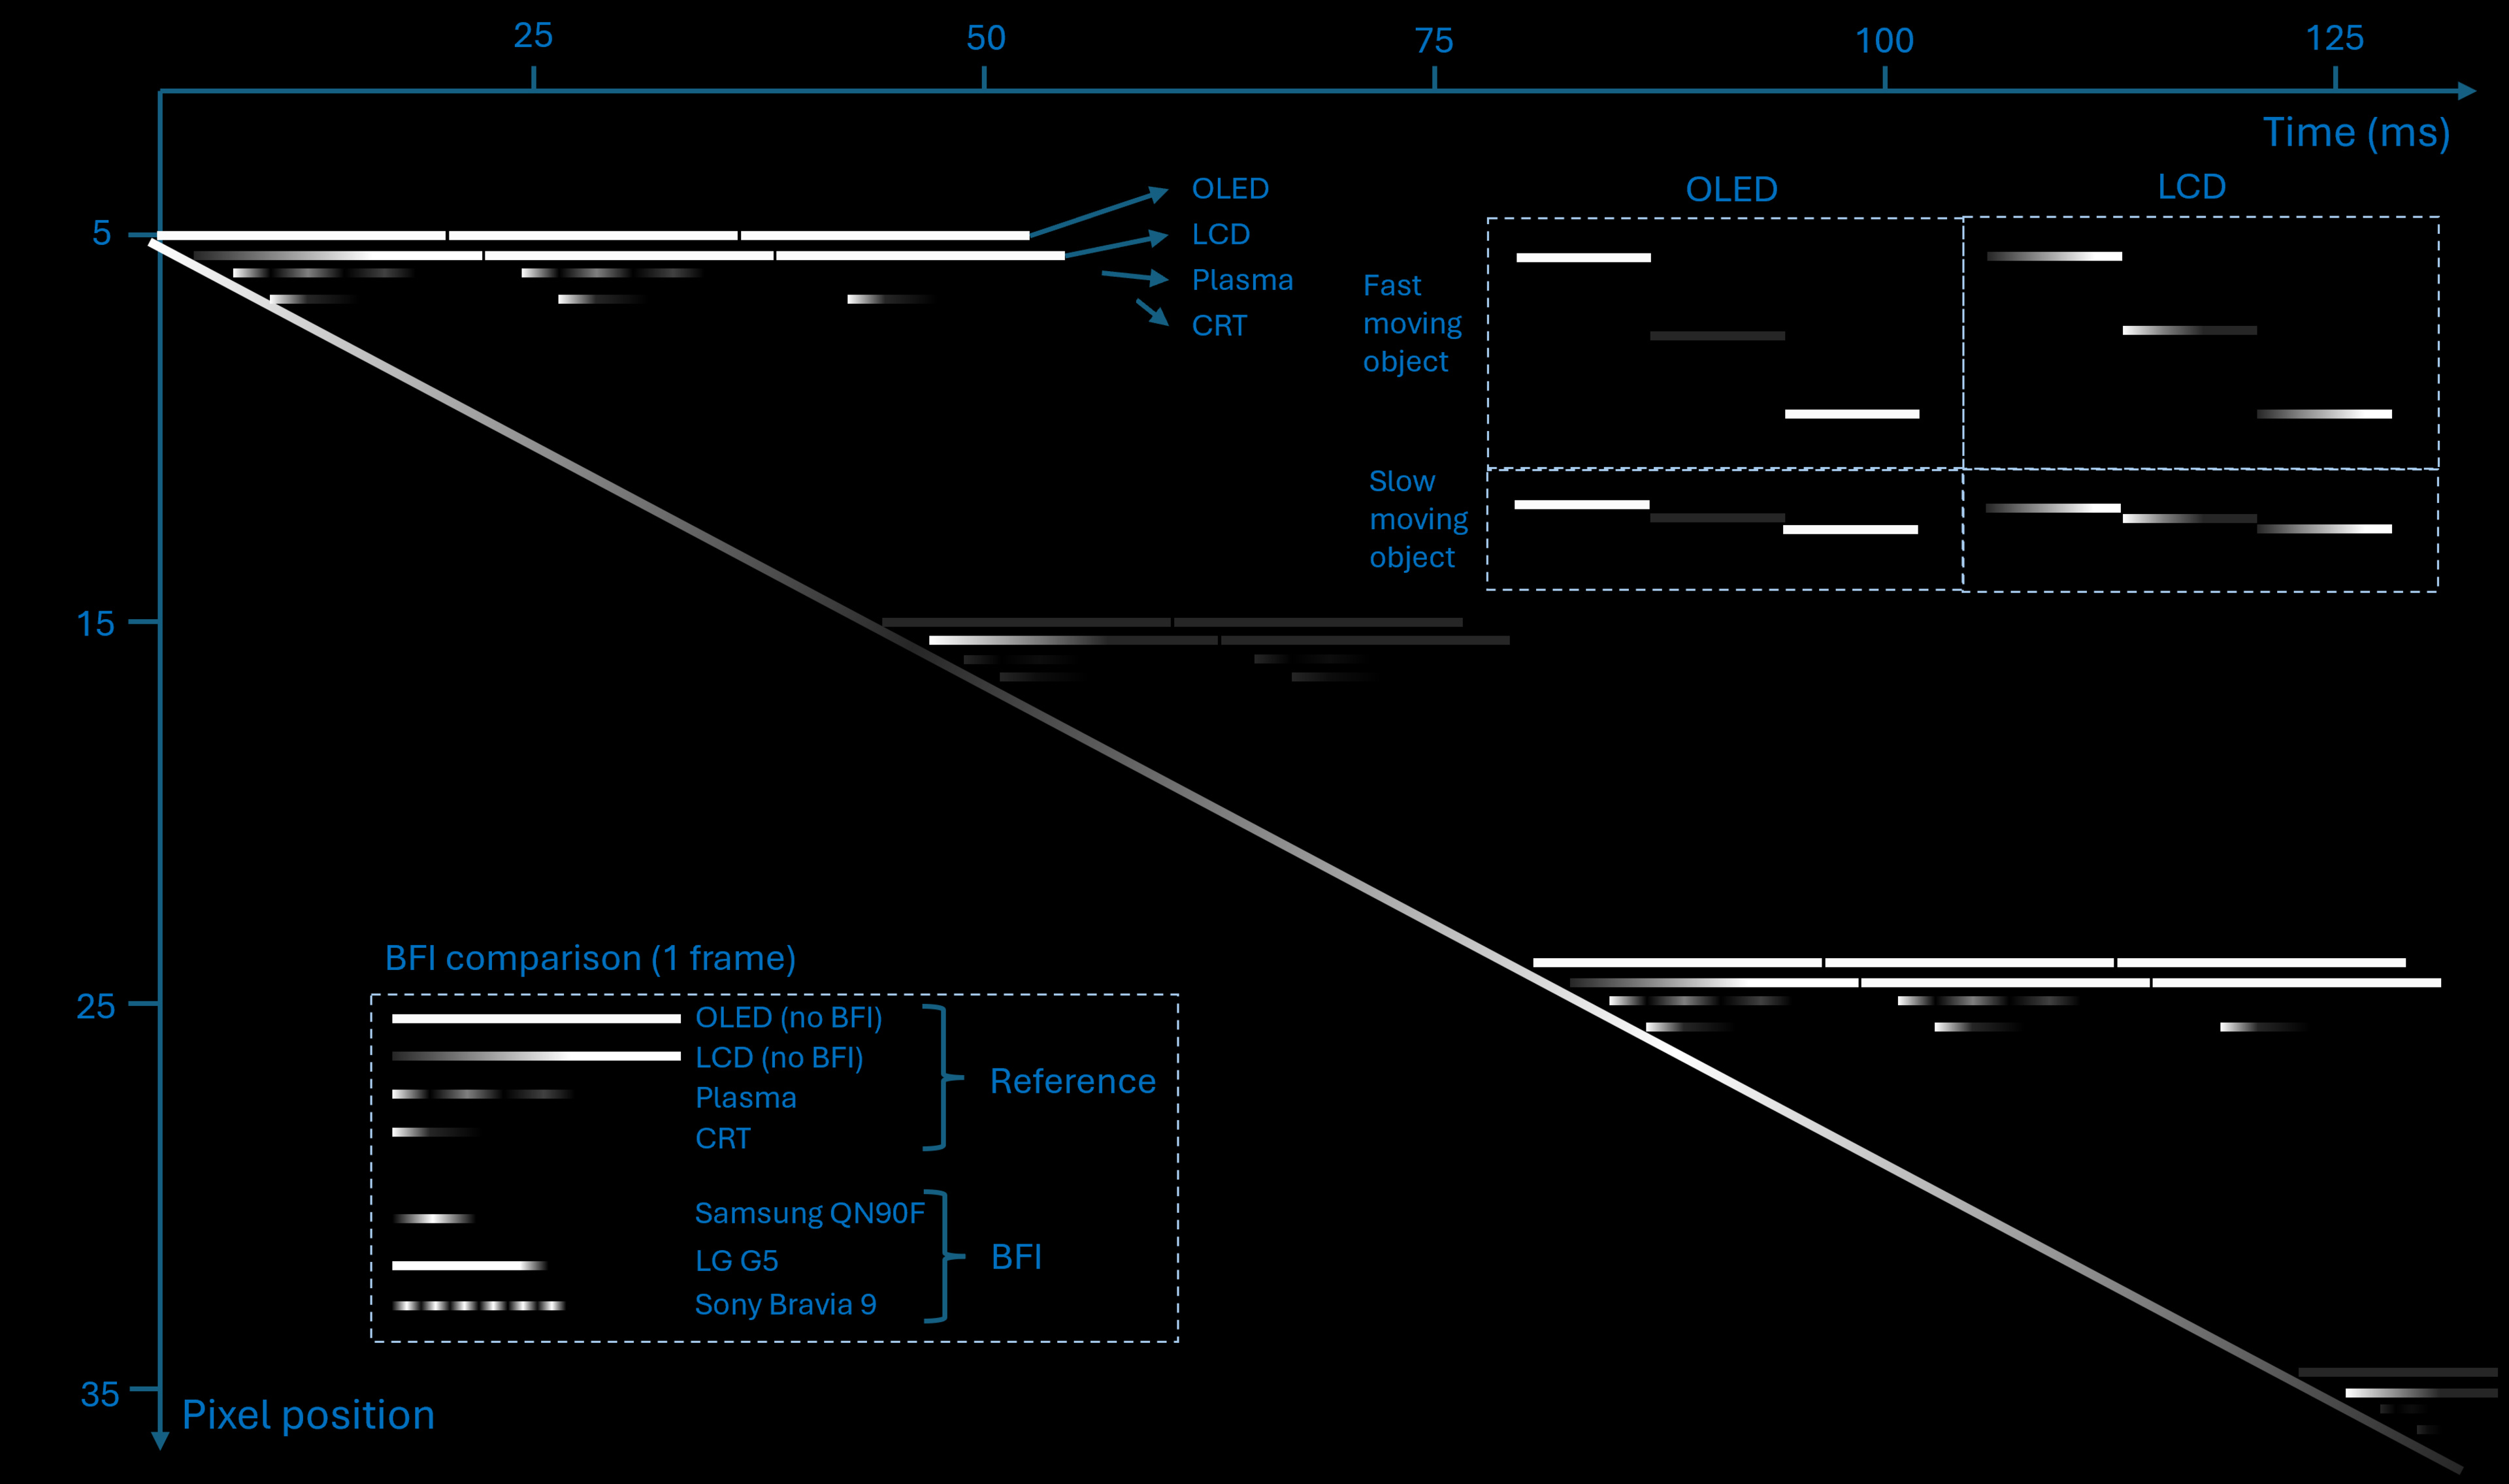
In the context of motion, people often highlight CRT and plasma technologies as the best for motion. These TVs used a very different approach compared to today's models, as shown in the image below. This image shows a generalisation for all television technologies, and the specific sample and hold might differ between two televisions using the same technology. Nonetheless, this generalisation shows that the hold time is much shorter for CRT and plasma than for LCD and OLED displays. Due to the reduced hold time, most of the content shown by CRT and plasma is closer to the ideal motion line. The image below depicts the time-position motion diagram at 60 fps, as CRT and plasma TVs operated at this frequency. However, they still display 24 fps content, which causes judder (different number of bright and dark lines: two brights, three darks). While they reduce the hold time, CRT and plasma methods also cause flicker and lower brightness. LCD and OLED screens use a sample-and-hold strategy, which improves brightness and reduces flicker but makes stutter more noticeable. LCD slightly differs from OLED because its response time is usually longer. Instead of a solid color change at each pixel, the transition is more gradual. For fast-moving objects, the benefit is limited because the position gap remains quite visible, but it helps make movement smoother for slower objects, as shown on the top right of the image below. The slow response time of LCDs can also cause blur, which some people find undesirable.
Users appreciated the motion look of CRTs and plasmas so much that most modern televisions include an option to emulate the look of those past televisions using what is often referred to as black frame insertion (BFI). BFI doesn't create a soap opera effect since it doesn't make any new frames; it simply reduces the hold time of every frame in the same way CRTs and plasmas do. The pattern of BFI varies significantly between televisions, and part of this information is already available in our review under the BFI metric. The image below highlights the differences among three different televisions and how they compare to a CRT and a plasma. The Samsung QN90F is closer to the CRT approach, while the Sony BRAVIA 9 is closer to the look of a plasma. Characterization of BFI between television is outside the scope of this article.
The next important factor is brightness. Chapiro et al. recently demonstrated in a paper that stutter perception could be reduced by lowering the brightness of the screen. We created a similar experiment internally by making OLED televisions appear better than LCD televisions simply by reducing the brightness. Another situation where brightness impact was observed is when the television interpreted SDR content as HDR. The SDR content gets tone-mapped using an HDR curve, which tends to push most of the content toward dark tones and keep the brighter parts of the dynamic range for highlights in the scene. The same scene on the same television looked very different depending on whether the streaming device was set to HDR or to match the content's dynamic range. For example, the R.E.D scene has many bright areas, which get tone-mapped to darker values when HDR is enabled. You can very easily test this at home by enabling and disabling the content dynamic range match on your streaming device.
Finally, size also influences how stutter is perceived. For example, a bar moving 10 pixels per frame will create a noticeably larger gap on a 100-inch TV compared to a 55-inch TV when viewed from the same distance. We tested displaying a 42-inch OLED side by side with a 65-inch LCD from the same viewing distance; observers tend to prefer the OLED over the LCD in terms of stutter perception.
External Factor
Finally, even for specific television and content, there may still be a change in the perception of stutter.
The type of motion in the scene can amplify the perception of stuttering. When your eyes can follow the movement, the continuous eye motion conflicts with the discrete movement of the display. If the panning speed is too slow, the stutter will be too subtle to notice. Conversely, if it's too fast, your eyes won't be able to fully follow the scene, also diminishing the perception of stutter. For a relatively slow panning shots, however, the eye will be able to track it, making the stutter more noticeable.
Finally, stutter perception varies greatly among individuals. Some people can only notice a stutter in a slow panning shot, while others can see it in almost every scene.
Our research: When science hit the floor
A few papers in the scientific literature, one from the Optics Express journal and one from the IEEE Transactions on Circuits and Systems for Video Technology journal, introduce different metrics for characterizing stutter. Most approaches are based on the work of Watson et al., which uses the time-position diagram. We researched this option but decided not to pursue it further because it would require significant work to implement and adapt to all our display types.
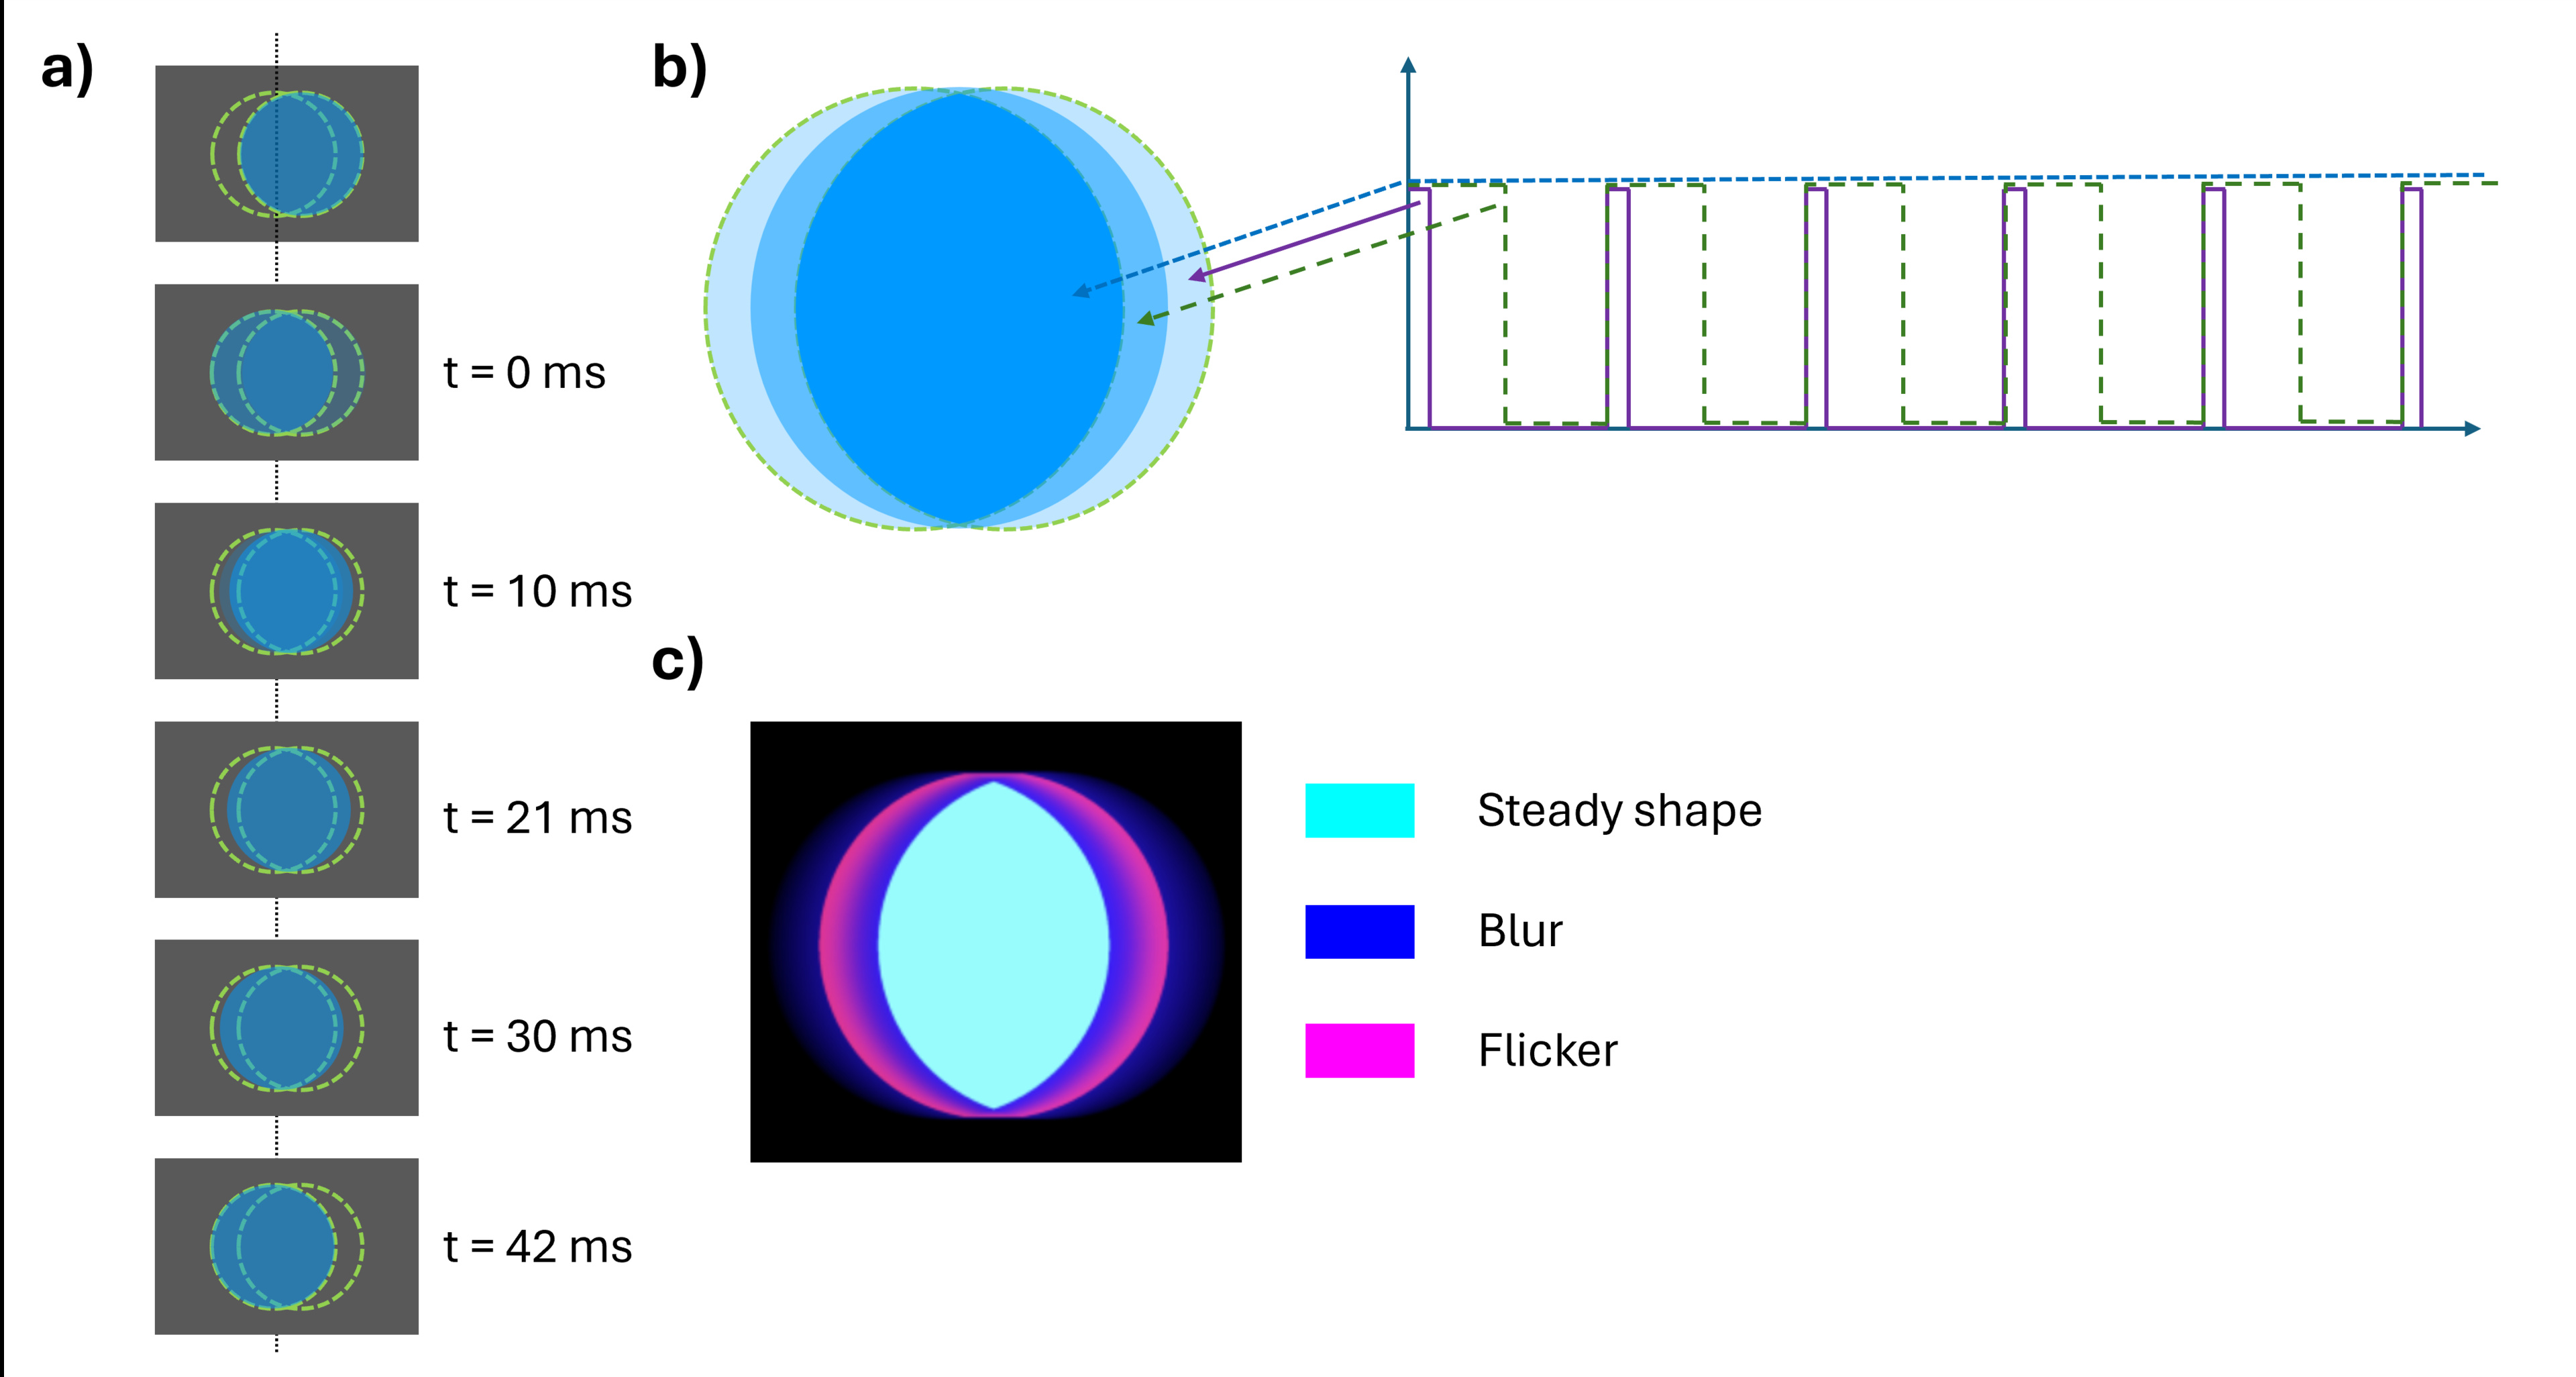
We decided to focus more on content with highly visible stutter, such as slow panning shots that the human eye can track. We attempted to record a video, but it only showed the display being reviewed stuttering, not the display where it was filmed (stutter inception). Our last idea was to depict stutter through an image. We took a simple ball shape and analyzed its movement from left to right across the screen at 24 fps, with your eyes tracking it, as shown in scenario a) above. The result in scenario b) above shows a ball duplicated in the direction of movement. The outer edge of the new shape flickers at a frequency of 24Hz, with the duty cycle decreasing as it nears the edge. Assuming that very low and very high duty cycles are perceived as static by our eyes, the flickering shape takes the form of the purple region shown in scenario c) above. Cyan and blue regions represent a solid shape and a blurred region, respectively. The result in scenario c) closely resembles what most RTINGS employees saw in the office when playing the video of the moving ball. We've shared the video for you to test on your display. The video is generated at 30 fps to avoid judder and emphasize the impact of stutter.
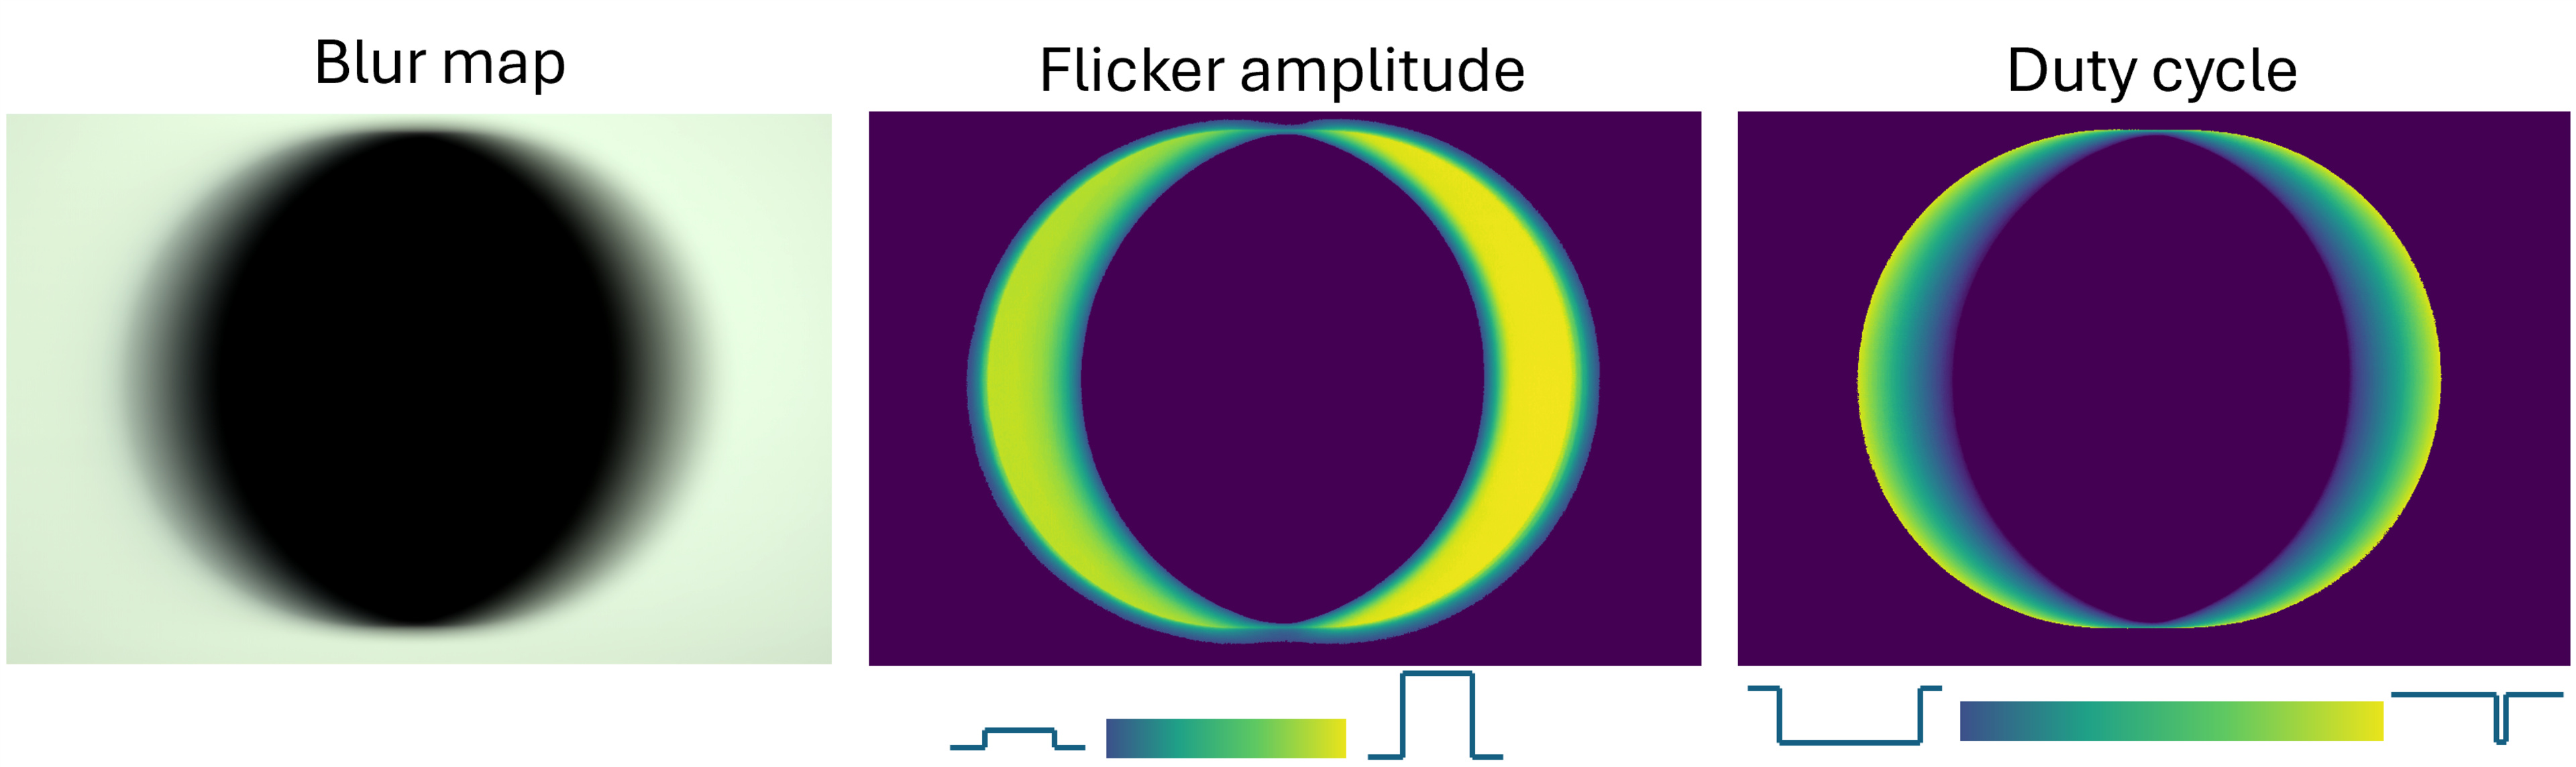
Using our high-speed Chronos camera, we were able to take a 2,142 frames per second video of those moving balls. With this, we could obtain a pixel map as shown in scenario b), enabling us to extract the blur profile (perceptual and motion blur) and flicker frequency detail, as shown in the image below. We weren't able, though, to interpret the flicker profile information and translate it into a perceptual model that matches all the televisions we reviewed. The blur profile was a very accurate depiction of the perceptual static view of the moving ball, and we intend to use some of that work in test bench 2.2 for our work on the blur pillar.
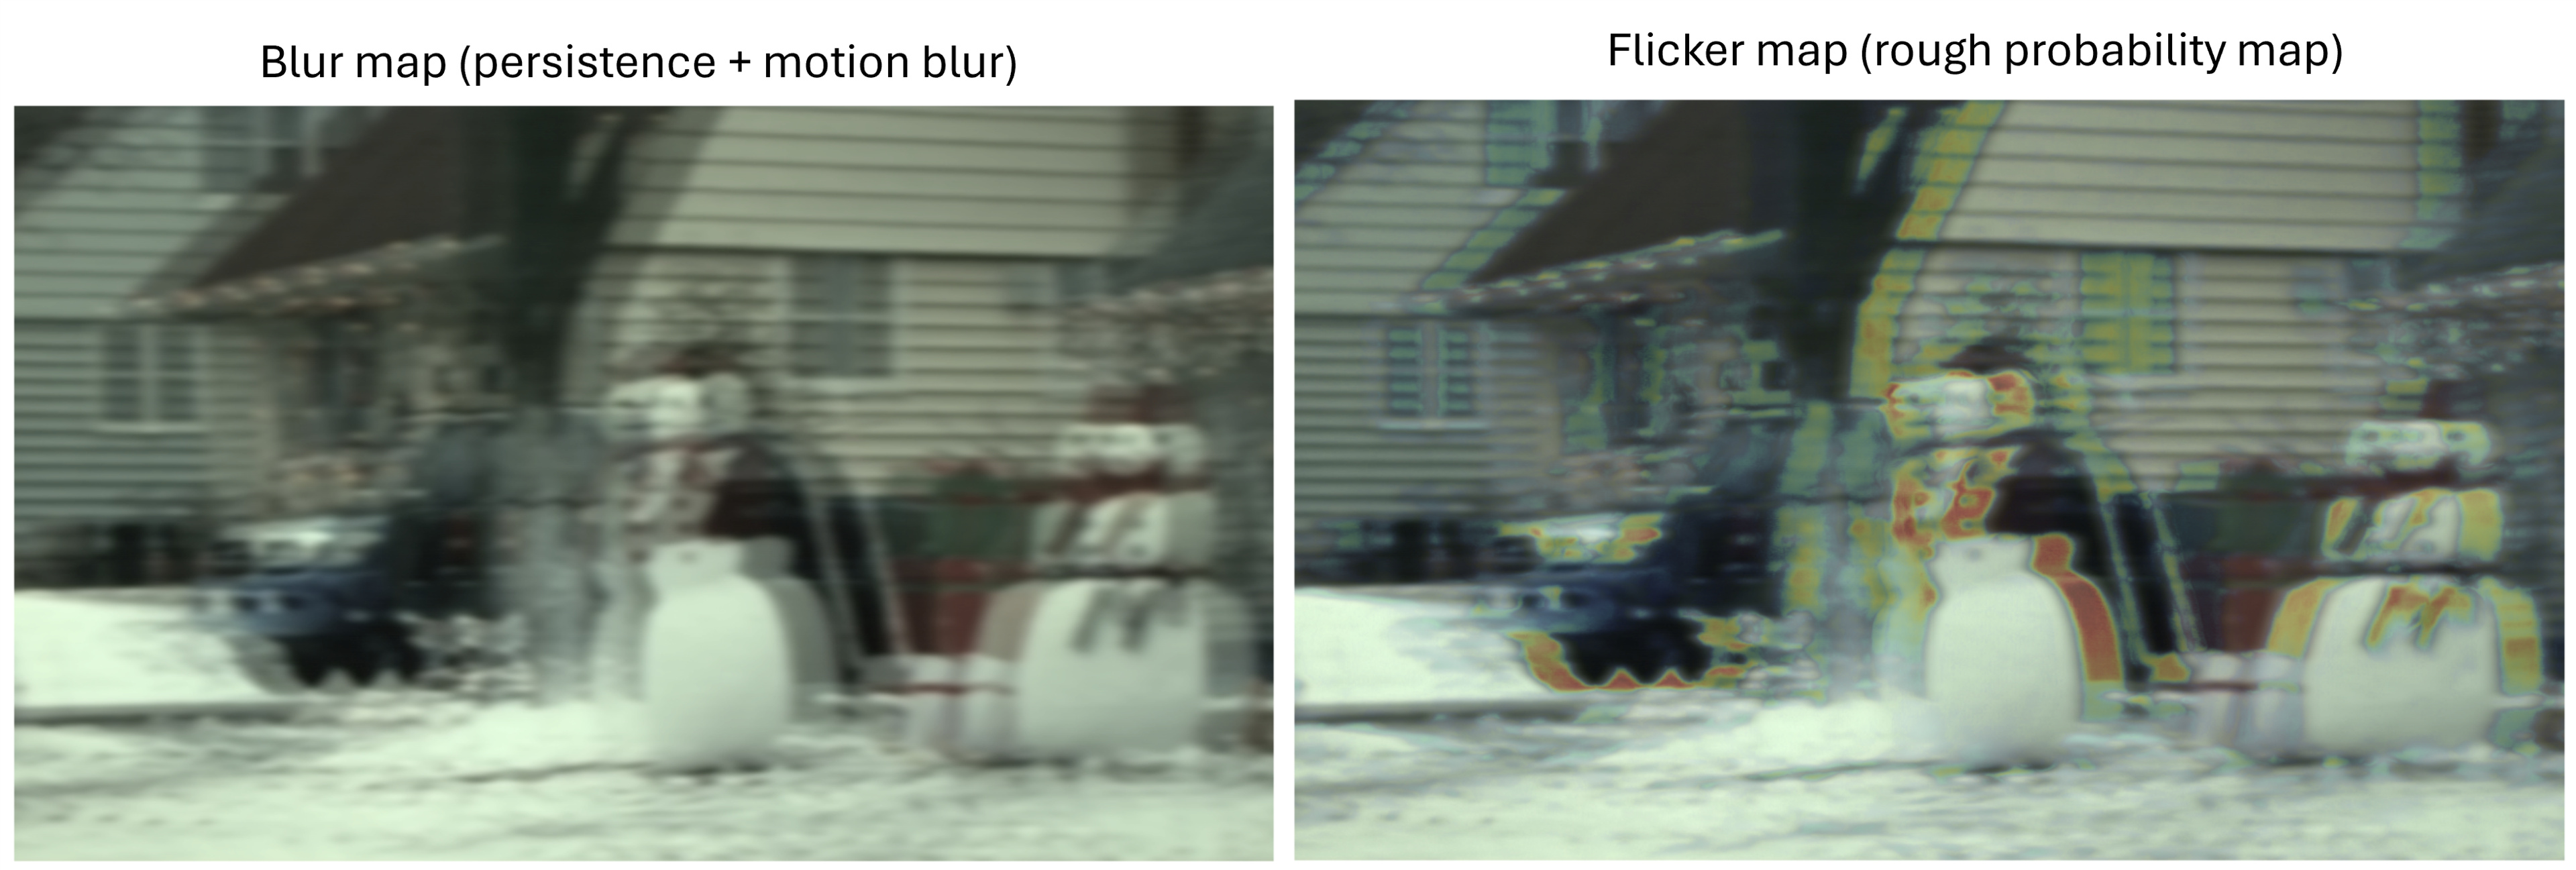
Ultimately, our research provided an overall view of how stutter appears in slow panning shots. The object is duplicated in the direction of movement, with its outer edge becoming blurry while a solid shape remains in the center. Between the solid part and the outer edge, there's a flickering region. We can create an accurate perceptual map for blur perception on television, but we haven't found an appropriate model to create the flicker map that overlays it. The image below highlights the perception of stutter in a real scene. On the left, the blur map is pretty accurate to the perceptual view of this scene. The flicker part only provides a very rough estimation of where the flicker might appear in the scene. Ultimately, this approach is nice for viewing what stutter looks like, but not for comparing televisions with each other.
Our test
Our previous test of stutter was essentially the opposite of response time. Specifically, we measured the total duration that the pixel value was held. Since LCDs have a slow response time, the transition period helps reduce the holding time and merge frames. As shown in the theory section, response time is one of the few parameters that vary between televisions and can be assessed. We can't include brightness and television size in the stutter metric, as the user selects these. To better indicate that this metric doesn't fully capture the overall picture of stutter, we changed the name of our metric from "Stutter" to "Response Time Stutter."
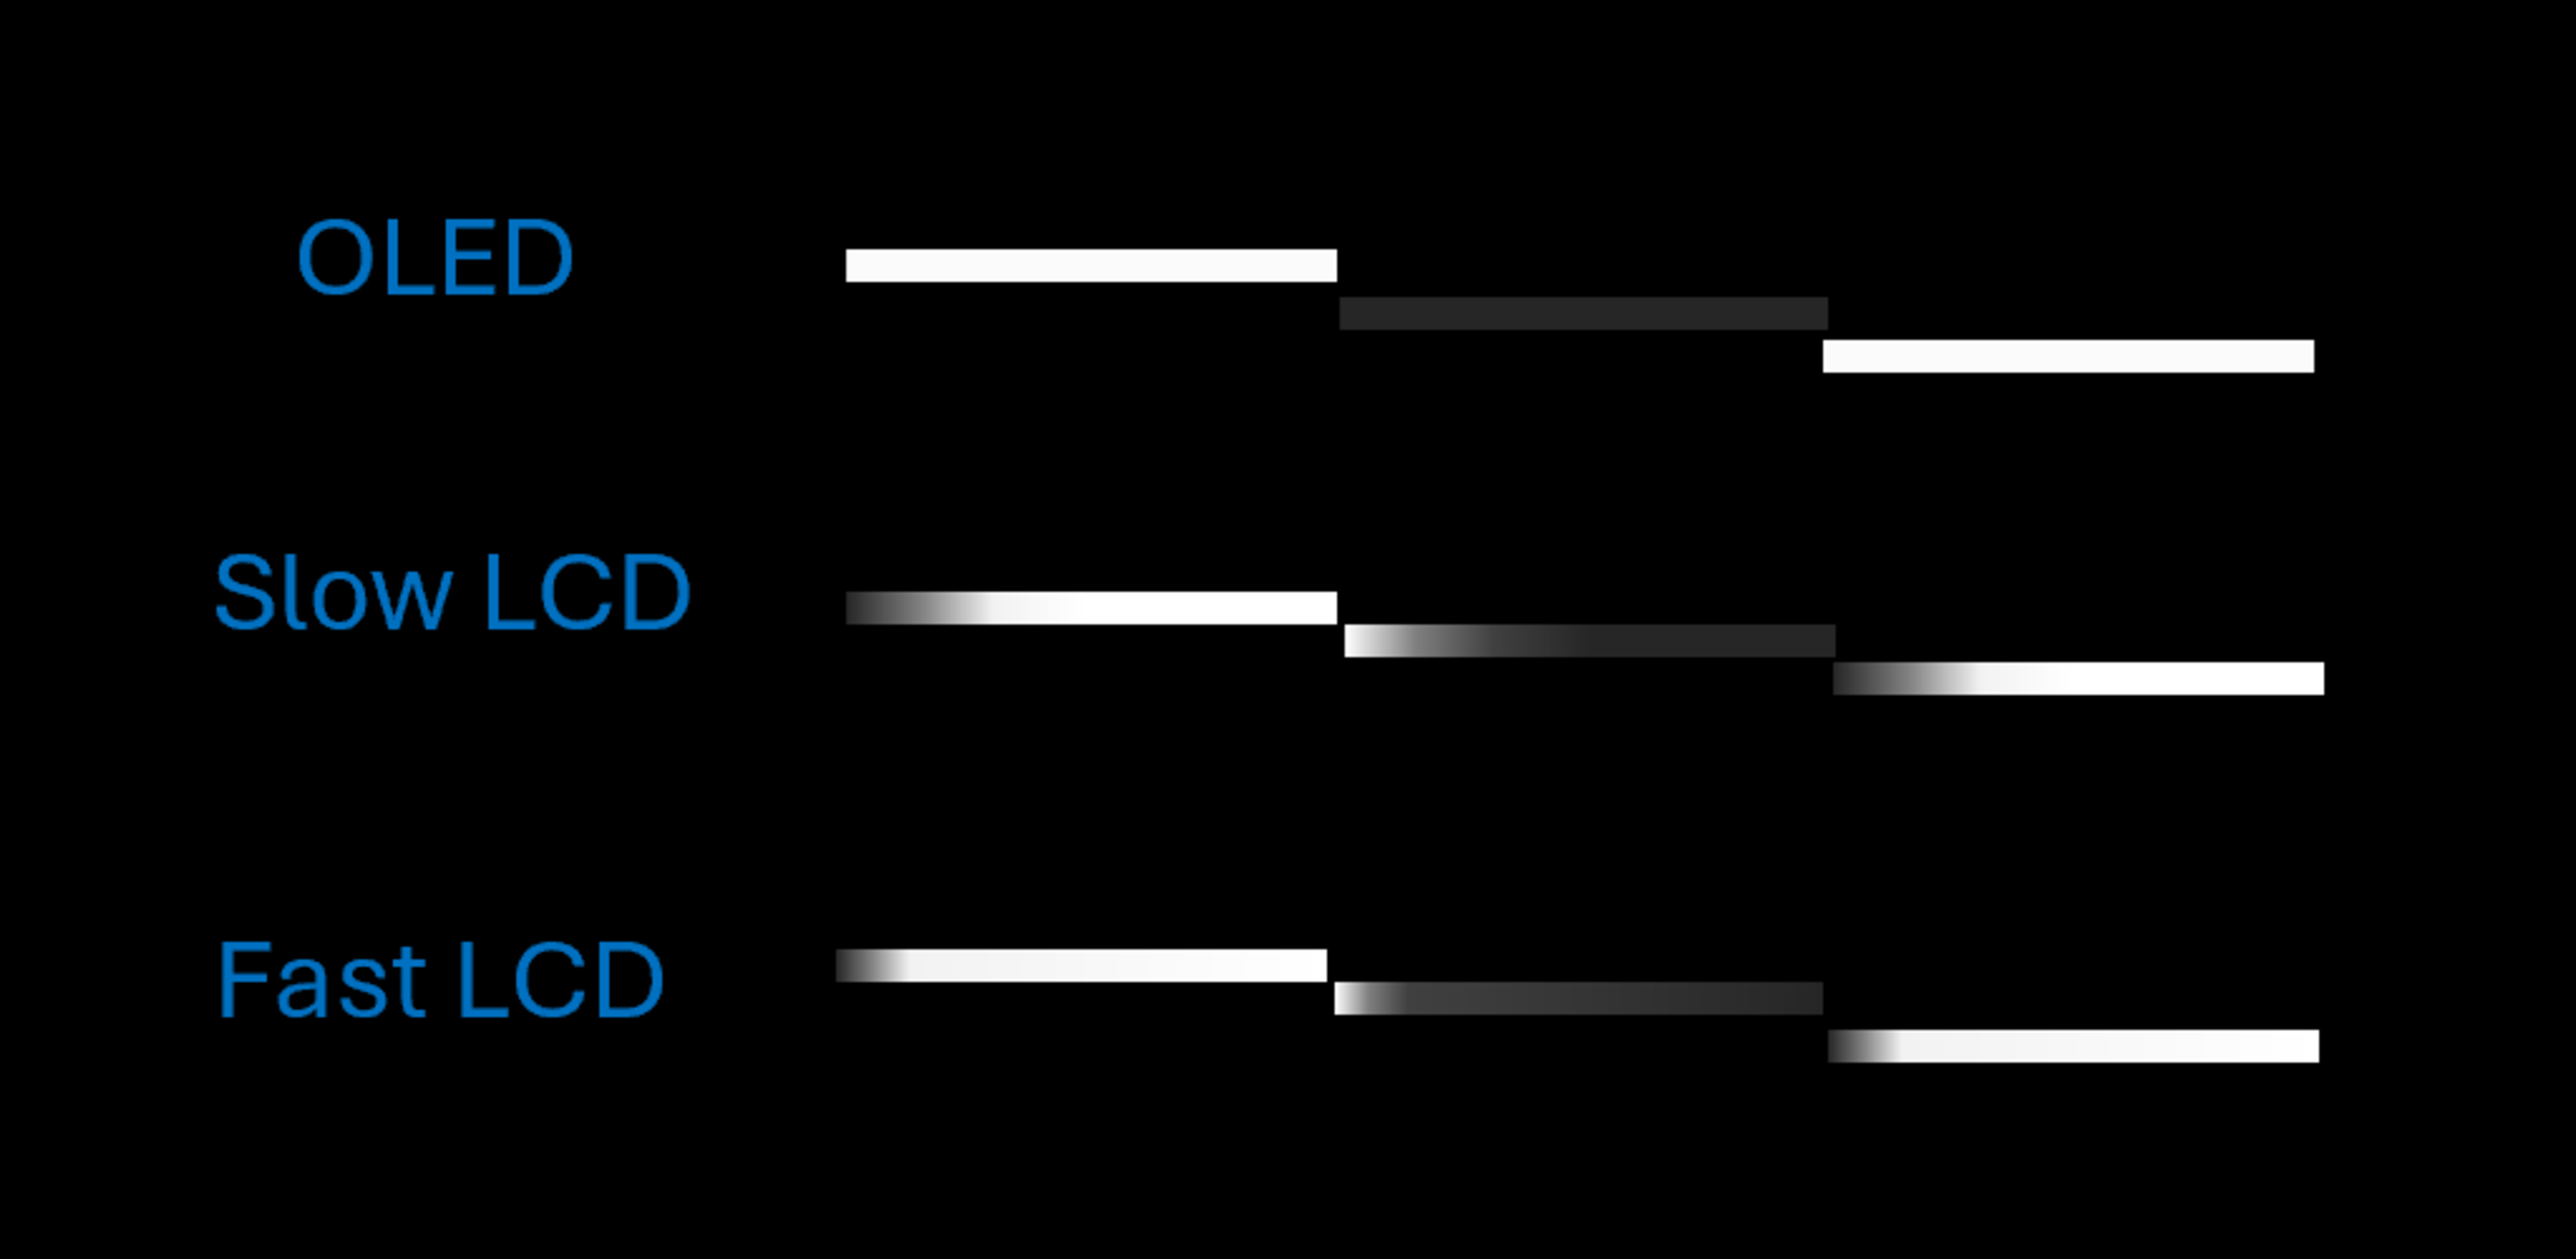
Most of the televisions we reviewed since test bench 2.0 have had relatively fast response times, as response times improve each year. For comparison, the image below shows the transition between an OLED, our fastest, and a slow-moving LCD, using alternating white and dark gray patches at 24 fps on a time-position motion diagram for a slow-moving object.
Should you use this metric to base your decision on stutter? To make an informed choice, keep in mind that everyone has different sensitivities to stutter. If you are slightly sensitive to stuttering in slow-motion scenes, the metric might help you choose an LCD instead of an OLED, which often assists with mild stutter sensitivity. However, LCDs aren't free of stutter either, so for users who are highly sensitive to stuttering in any scene, even the slowest LCD wouldn't improve the appearance of stutter. Therefore, the metric might not be the best option, as it would rate the slowest LCD as green. Finally, for users who only notice stuttering during large panning shots, the metric might not influence my TV choice, and they might choose an OLED even if it scores poorly.
Solution for stutter
Ultimately, is there a solution for stuttering if we want to get the biggest, brightest, and fastest TV on the market? Well, yes, introduce some motion enhancement technique. It doesn't need to be set to maximum, but minimal use can help reduce stutter without creating too many artifacts and the soap opera effect.
The reality is that television technologies have changed significantly over the past 100 years. It now achieves peak brightness levels much higher than those possible with CRT screens. Additionally, TV sizes now extend to fill the viewer's entire field of vision, something that was only feasible in cinemas a few years ago. On the other hand, the content's frame rate has largely remained limited to a value chosen based on technical and budget constraints from a century ago. Nevertheless, the cinema industry has based its practices around the 24 fps limit, adhering to it during filming and release, which gives movies their distinctive cinematic look. Therefore, the solution isn't as simple as just increasing frames per second; the cinema industry must also evolve its practices to preserve the artistic feel of movies.
A study completed in 2015 has shown that people tend to prefer higher frame rates for fast-moving scenes and are less indifferent to scenes with slow movement. The same study also notes in the discussion that there's some mitigated review with the high frame rate look, and that filmmakers could use a variable frame rate to create a look that is more suitable for most viewers. Ultimately, what we need is technology that bridges the gap between high frame rate and cinematic appearance. We already see great potential ahead. Recently, TrueCut motion has been used on some of the latest high frame rate movie releases, such as Avatar: The Way of Water (2022) and Wild Robot (2024). It allows filmmakers to adjust the frame rate based on the content and movement within the scene. The film, in the end, maintains a static fps (e.g., 60 fps), but scenes with less motion can be reduced to 24 fps using a pulldown technique.
Lately, there has also been the release of Dolby Vision 2, which introduces authentic motion and allows embedded motion data into content. For example, that metadata could be used by the television to know when to enable motion interpolation and when not to use it.
In a few years, we might see remastered films with a "motion remastered" label instead of the current "4k remastered." In fact, this trend has already begun with TrueCut motion, which recently remastered Titanic (2023) and the original Avatar (2022).
What's Next?
In this test bench update, we introduce a new metric for micro-judder and add additional comparisons to evaluate judder at 25 fps. Unfortunately, there's no metric we could've added to address stutter that would've really helped the user. Nonetheless, we hope that through this article, we were able to highlight the real source of stutter better and differentiate it from other cadence artifacts.
Through recent discussions with the community, we've realized that stutter is an important factor when considering motion. However, our research has clearly shown that one of the few options for addressing stutter is enabling some form of motion enhancement, such as BFI or motion interpolation. We generally view motion interpolation as an enhancement we prefer not to evaluate, since it doesn't always align with the creator's intent. Nevertheless, based on community feedback and our research, we see undeniable value in it for reducing stutter. Motion enhancement wasn't part of our original motion plan, but given the current discussions, we may reconsider including it.
For the next test bench update 2.2, we have already started some work on blur evaluation, as indicated in the stutter section. The community engaged very nicely when we released our initial plan about motion, and we want to hear more from you now that we have more tangible results. You can leave a comment below or email us at feedback@rtings.com.