Co-authored with Dr. Sean Olive.
Why We Tested Distortion Audibility
You've probably seen distortion measurements, those percentage numbers that tell you how "clean" headphones sound, in headphone reviews. But do those numbers actually matter? Can you actually hear the artifacts that show up in our lab tests? In our earlier literature review, we researched what we knew and what we were missing about distortion measurements. Two big gaps stood out: we didn't have clear thresholds for when distortion becomes audible, and even when it's audible, we didn't know if it actually affects which headphones you'd prefer. As a result, we partnered with Dr. Sean Olive to find out by conducting comprehensive listening tests using real headphone recordings.
What We Found
For the headphones we tested, distortion is largely inaudible at normal listening levels. Our detection threshold tests revealed that distortion only becomes audible at 104–112 dBA SPL, which are levels that would be uncomfortable or even harmful for extended listening. When comparing recordings made at our standardized 94 dBA SPL level, some listeners could rate subtle differences between recordings in similarity tests, but when put to the test in ABX discrimination (the gold standard for proving you can actually hear something), almost everybody failed. Only one listener out of many could distinguish between the headphones above chance. These recordings are genuinely difficult to decipher, which tells us something important: even when differences exist, they're extremely subtle. Therefore, when it comes to practical listening, distortion measurements aren't something you need to lose sleep over.
Methods: How We Captured and Measured Real Headphone Distortion
Instead of relying on mathematical models or artificially generated distortions, we did something more direct: we recorded real headphones playing real music at multiple volume levels (85–110+ dBA SPL, stepping up in 3 dB increments). dBA stands for A-weighted; it was measured using pink noise at equal LUFS (Loudness Units relative to Full Scale) as the music clip.
Binaural Recordings: Capturing Real-World Distortion
Using binaural recording, we captured everything the headphones produced: both linear (frequency-response-related ) and nonlinear distortions. Then we removed the frequency response, leaving only nonlinear distortion and level differences between headphones. After this, we normalized all these recordings at -16 LUFS , so that listeners heard distortion, not frequency response or level differences.
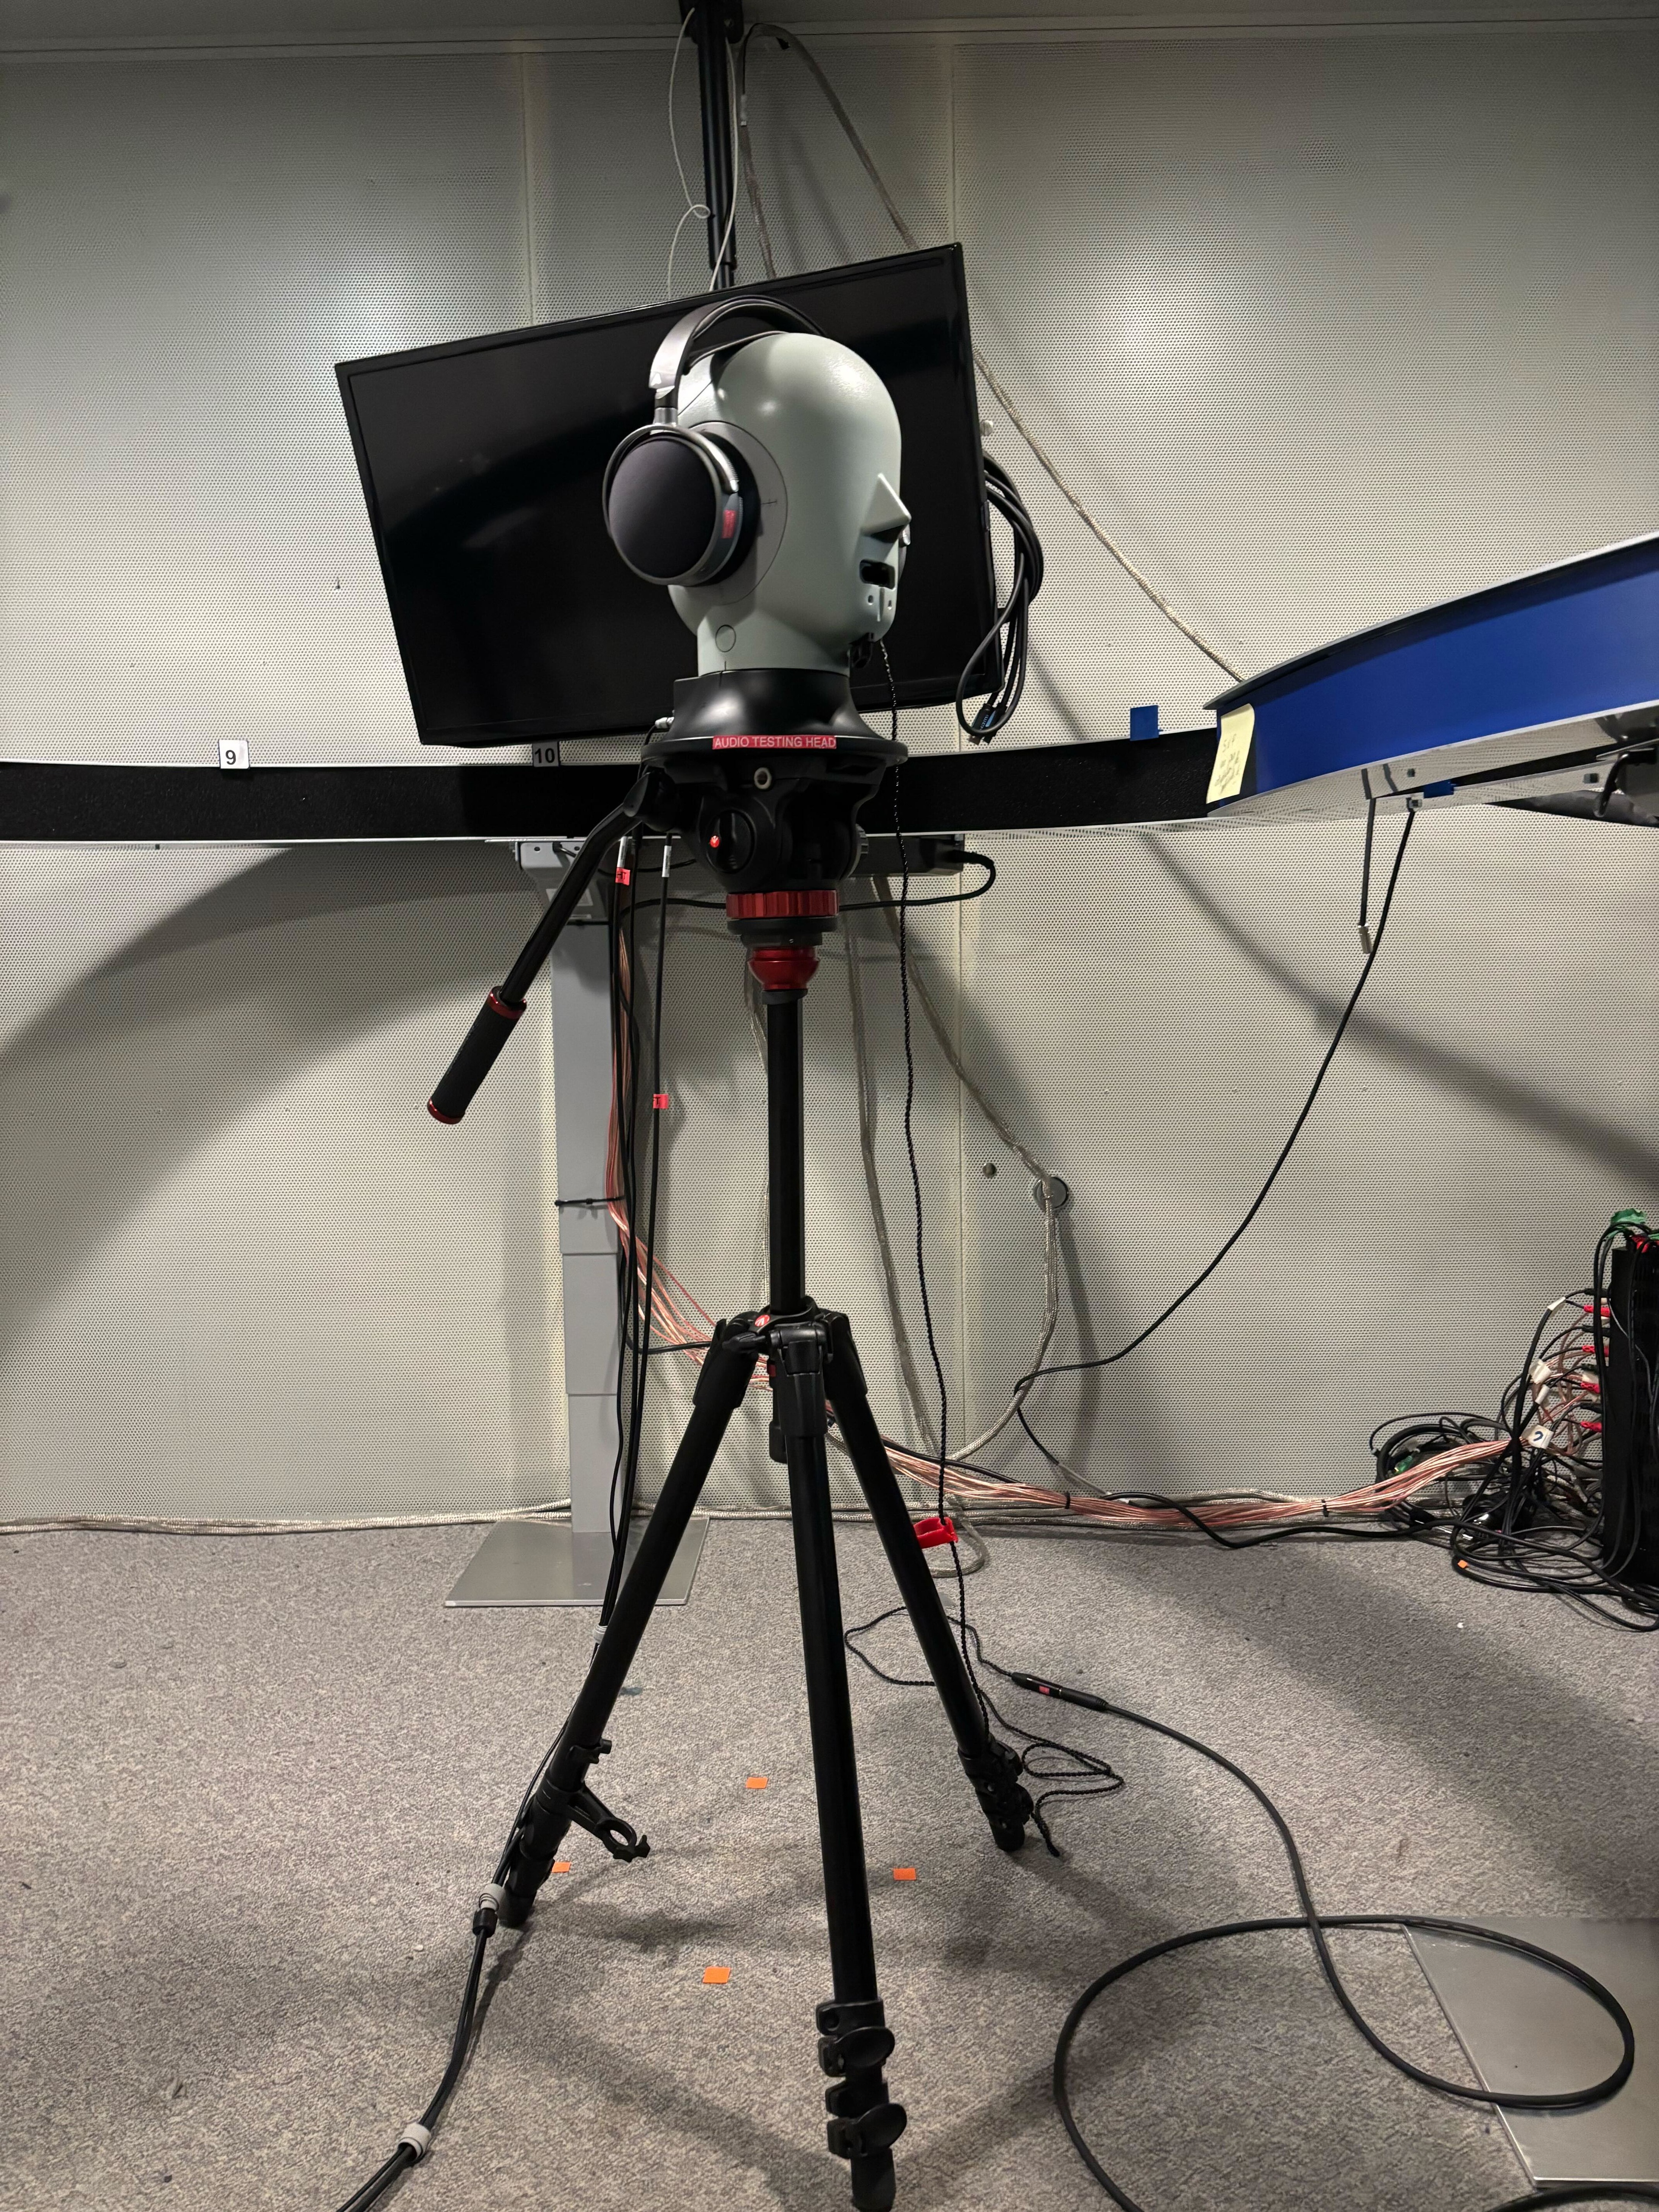
This approach captured real distortion, though it may include some recording noise. We used a quiet audiometric booth to keep that noise to a minimum.
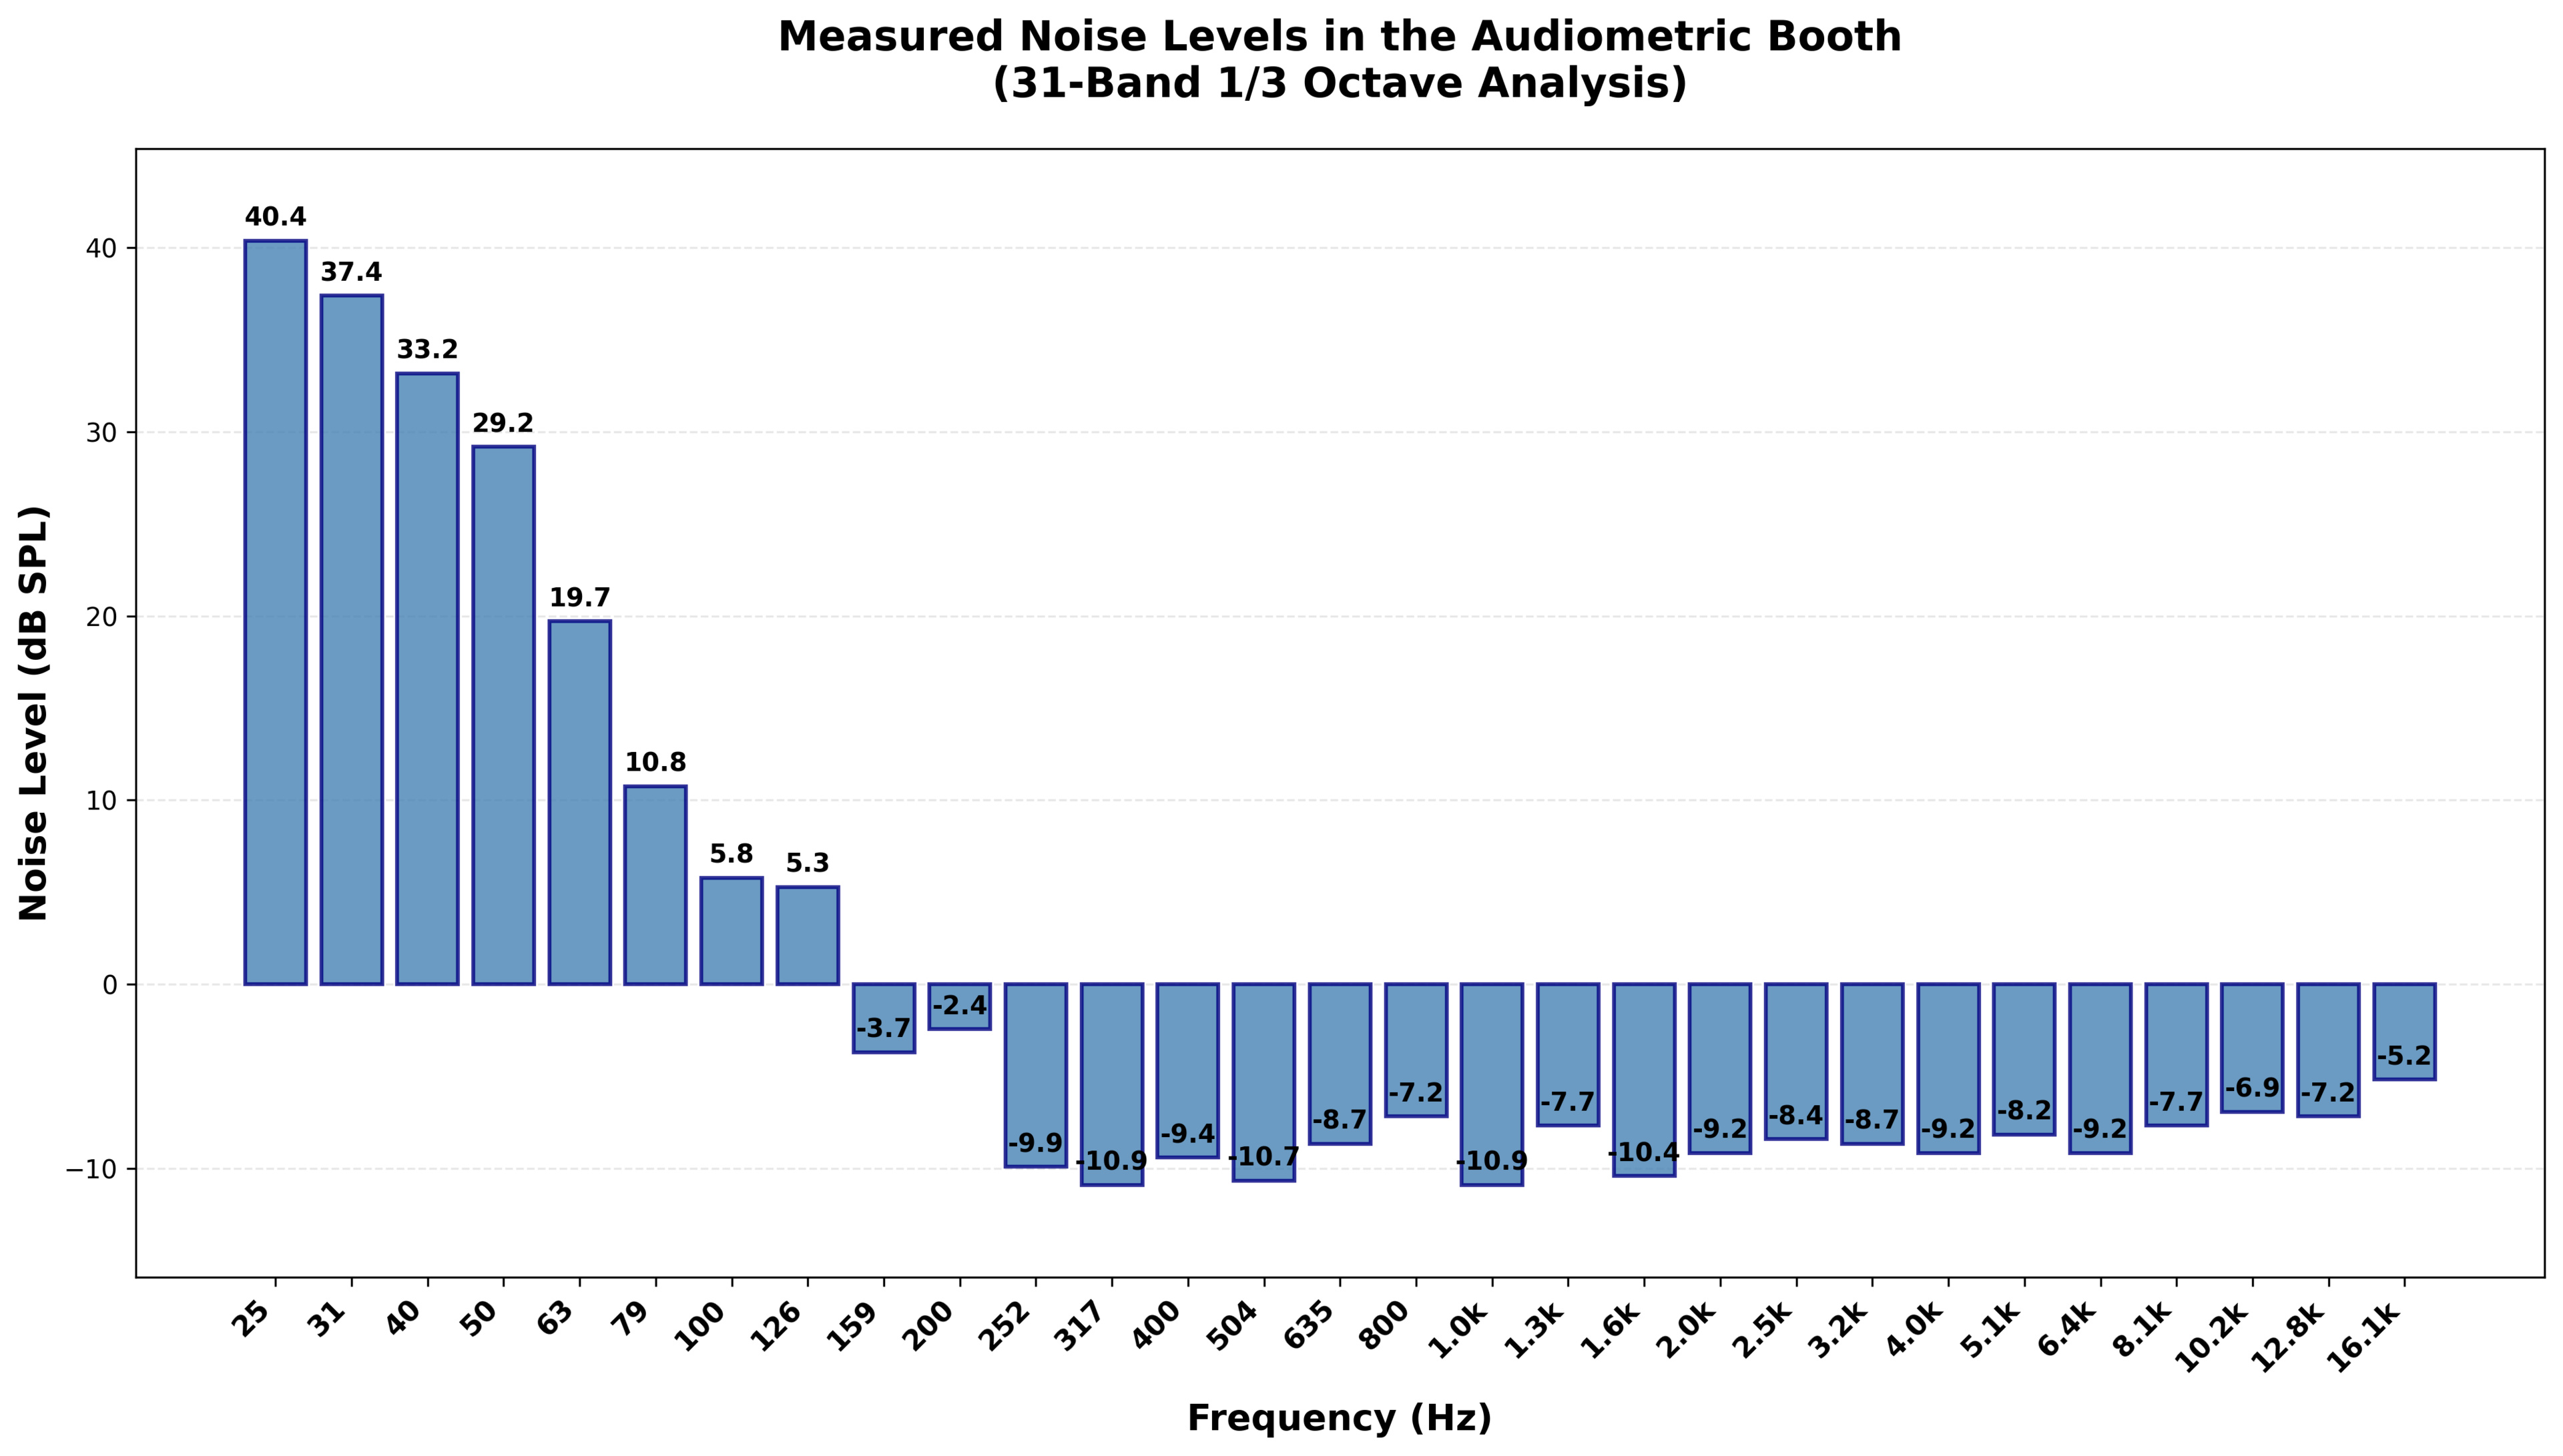
As you can see in Figure 2, there was still non-negligible noise in the bass region. It was a compromise that needed to be taken into account.
Headphones and Test Setup
In Experiment 1 (threshold detection tests), we tested three headphones: the TRUTHEAR x Crinacle ZERO: RED, the AKG K361, and the Audeze LCD-S20. In Experiment 2 (similarity tests), we tested five headphones: the TRUTHEAR x Crinacle ZERO: RED, the Beyerdynamic DT 770 Pro, the Sennheiser HD 650, the AKG K361, and the Lorelei X6. The "Clean" reference in our experiments is the original recording file, not a binaurally recorded headphone. These headphones were selected to represent a range of distortion characteristics.
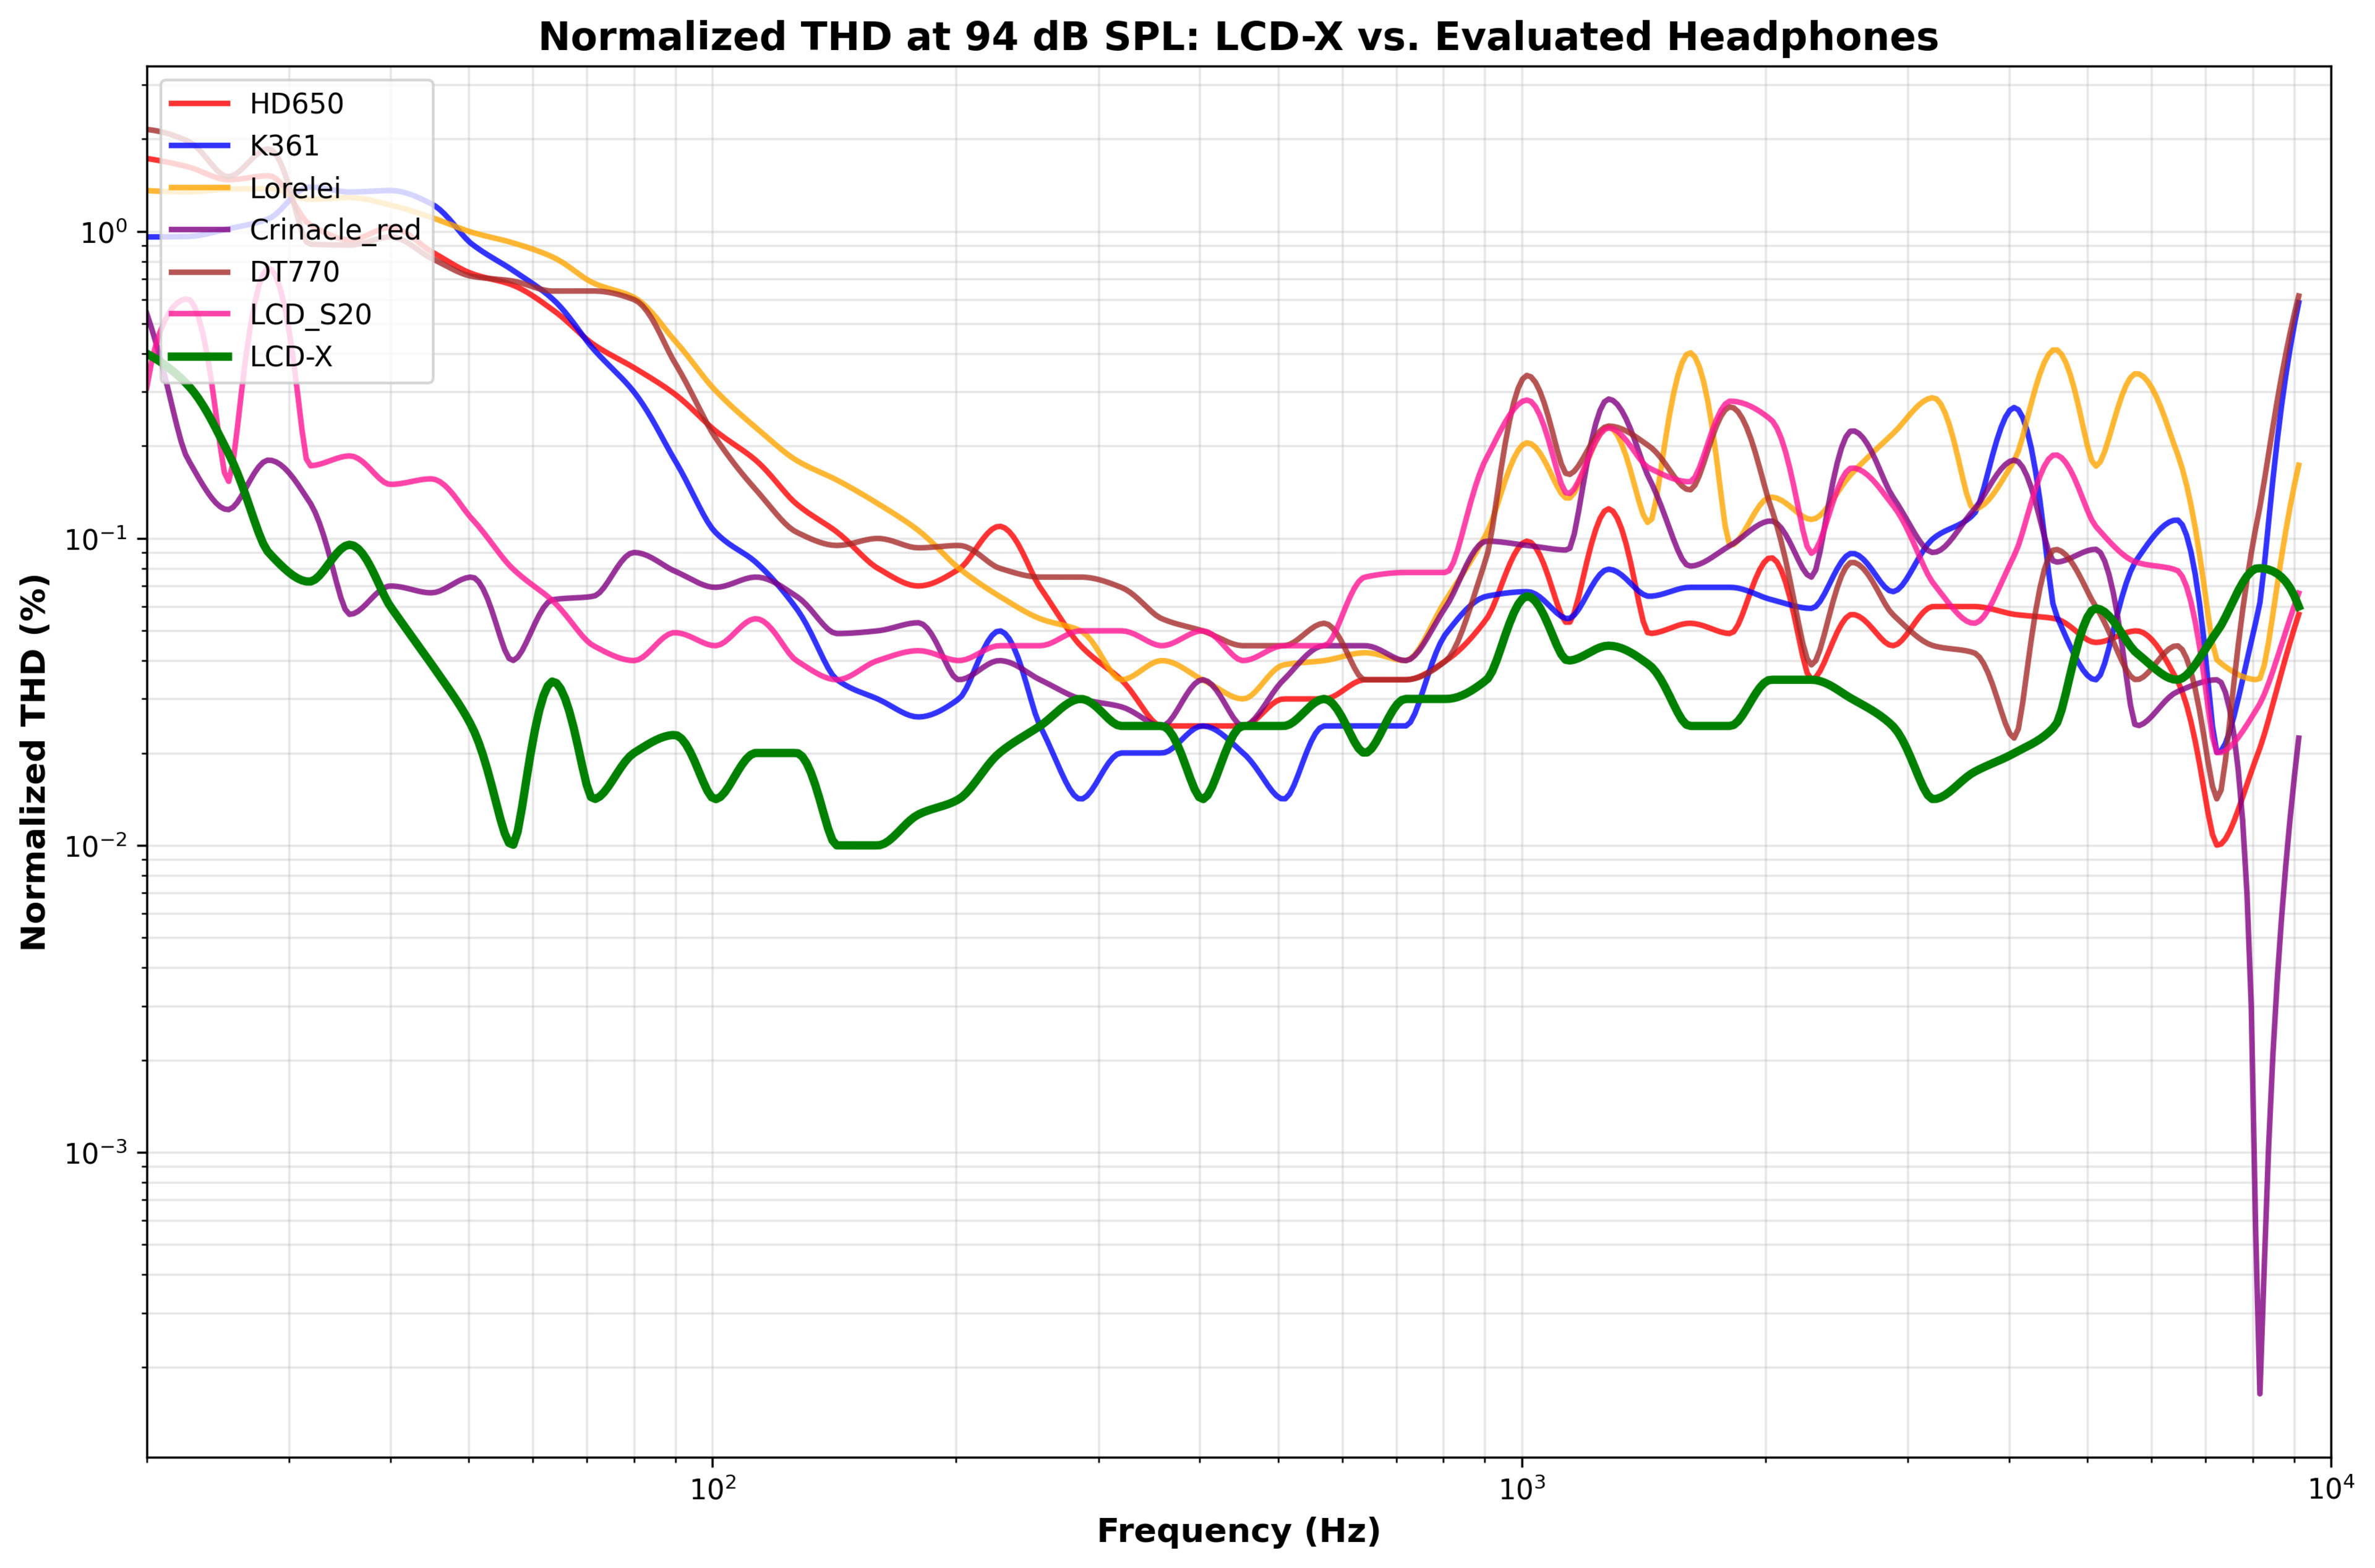
We used the Audeze LCD-X as the playback headphones for listening tests because they have lower measured distortion than the evaluated headphones. The LCD-X aren't distortion-free, but listeners still struggled to detect distortion, suggesting that headphone distortion itself is largely inaudible.
Distortion Measurements
We measured six headphones (the ZERO: RED, the K361, the DT 770, the Lorelei X6, the HD 650, and the LCD-S20) across multiple distortion metrics at 94 dB SPL. The LCD-S20 were tested in threshold detection but not in similarity tests. We correlated these measurements with listening test results to identify which metrics predict perception. Note that we included the Lorelei X6, which are cheap headphones, as we also wanted to see if very inexpensive headphones may have more consistent audible artifacts.
Total Harmonic Distortion (THD)
THD measures the predictable harmonics, which are the clean multiples of the original frequency that show up when you push a driver. We measured both normalized THD (also called Frequency Normalized Distortion) and unnormalized THD using sine sweeps at 94 dB SPL for all six headphones. We chose to show normalized distortion because it separates linear frequency response from nonlinear distortion, ensuring we measure distortion itself rather than frequency-dependent loudness differences. This method was first proposed by Steve Temme in 1993 (Listen Inc.).
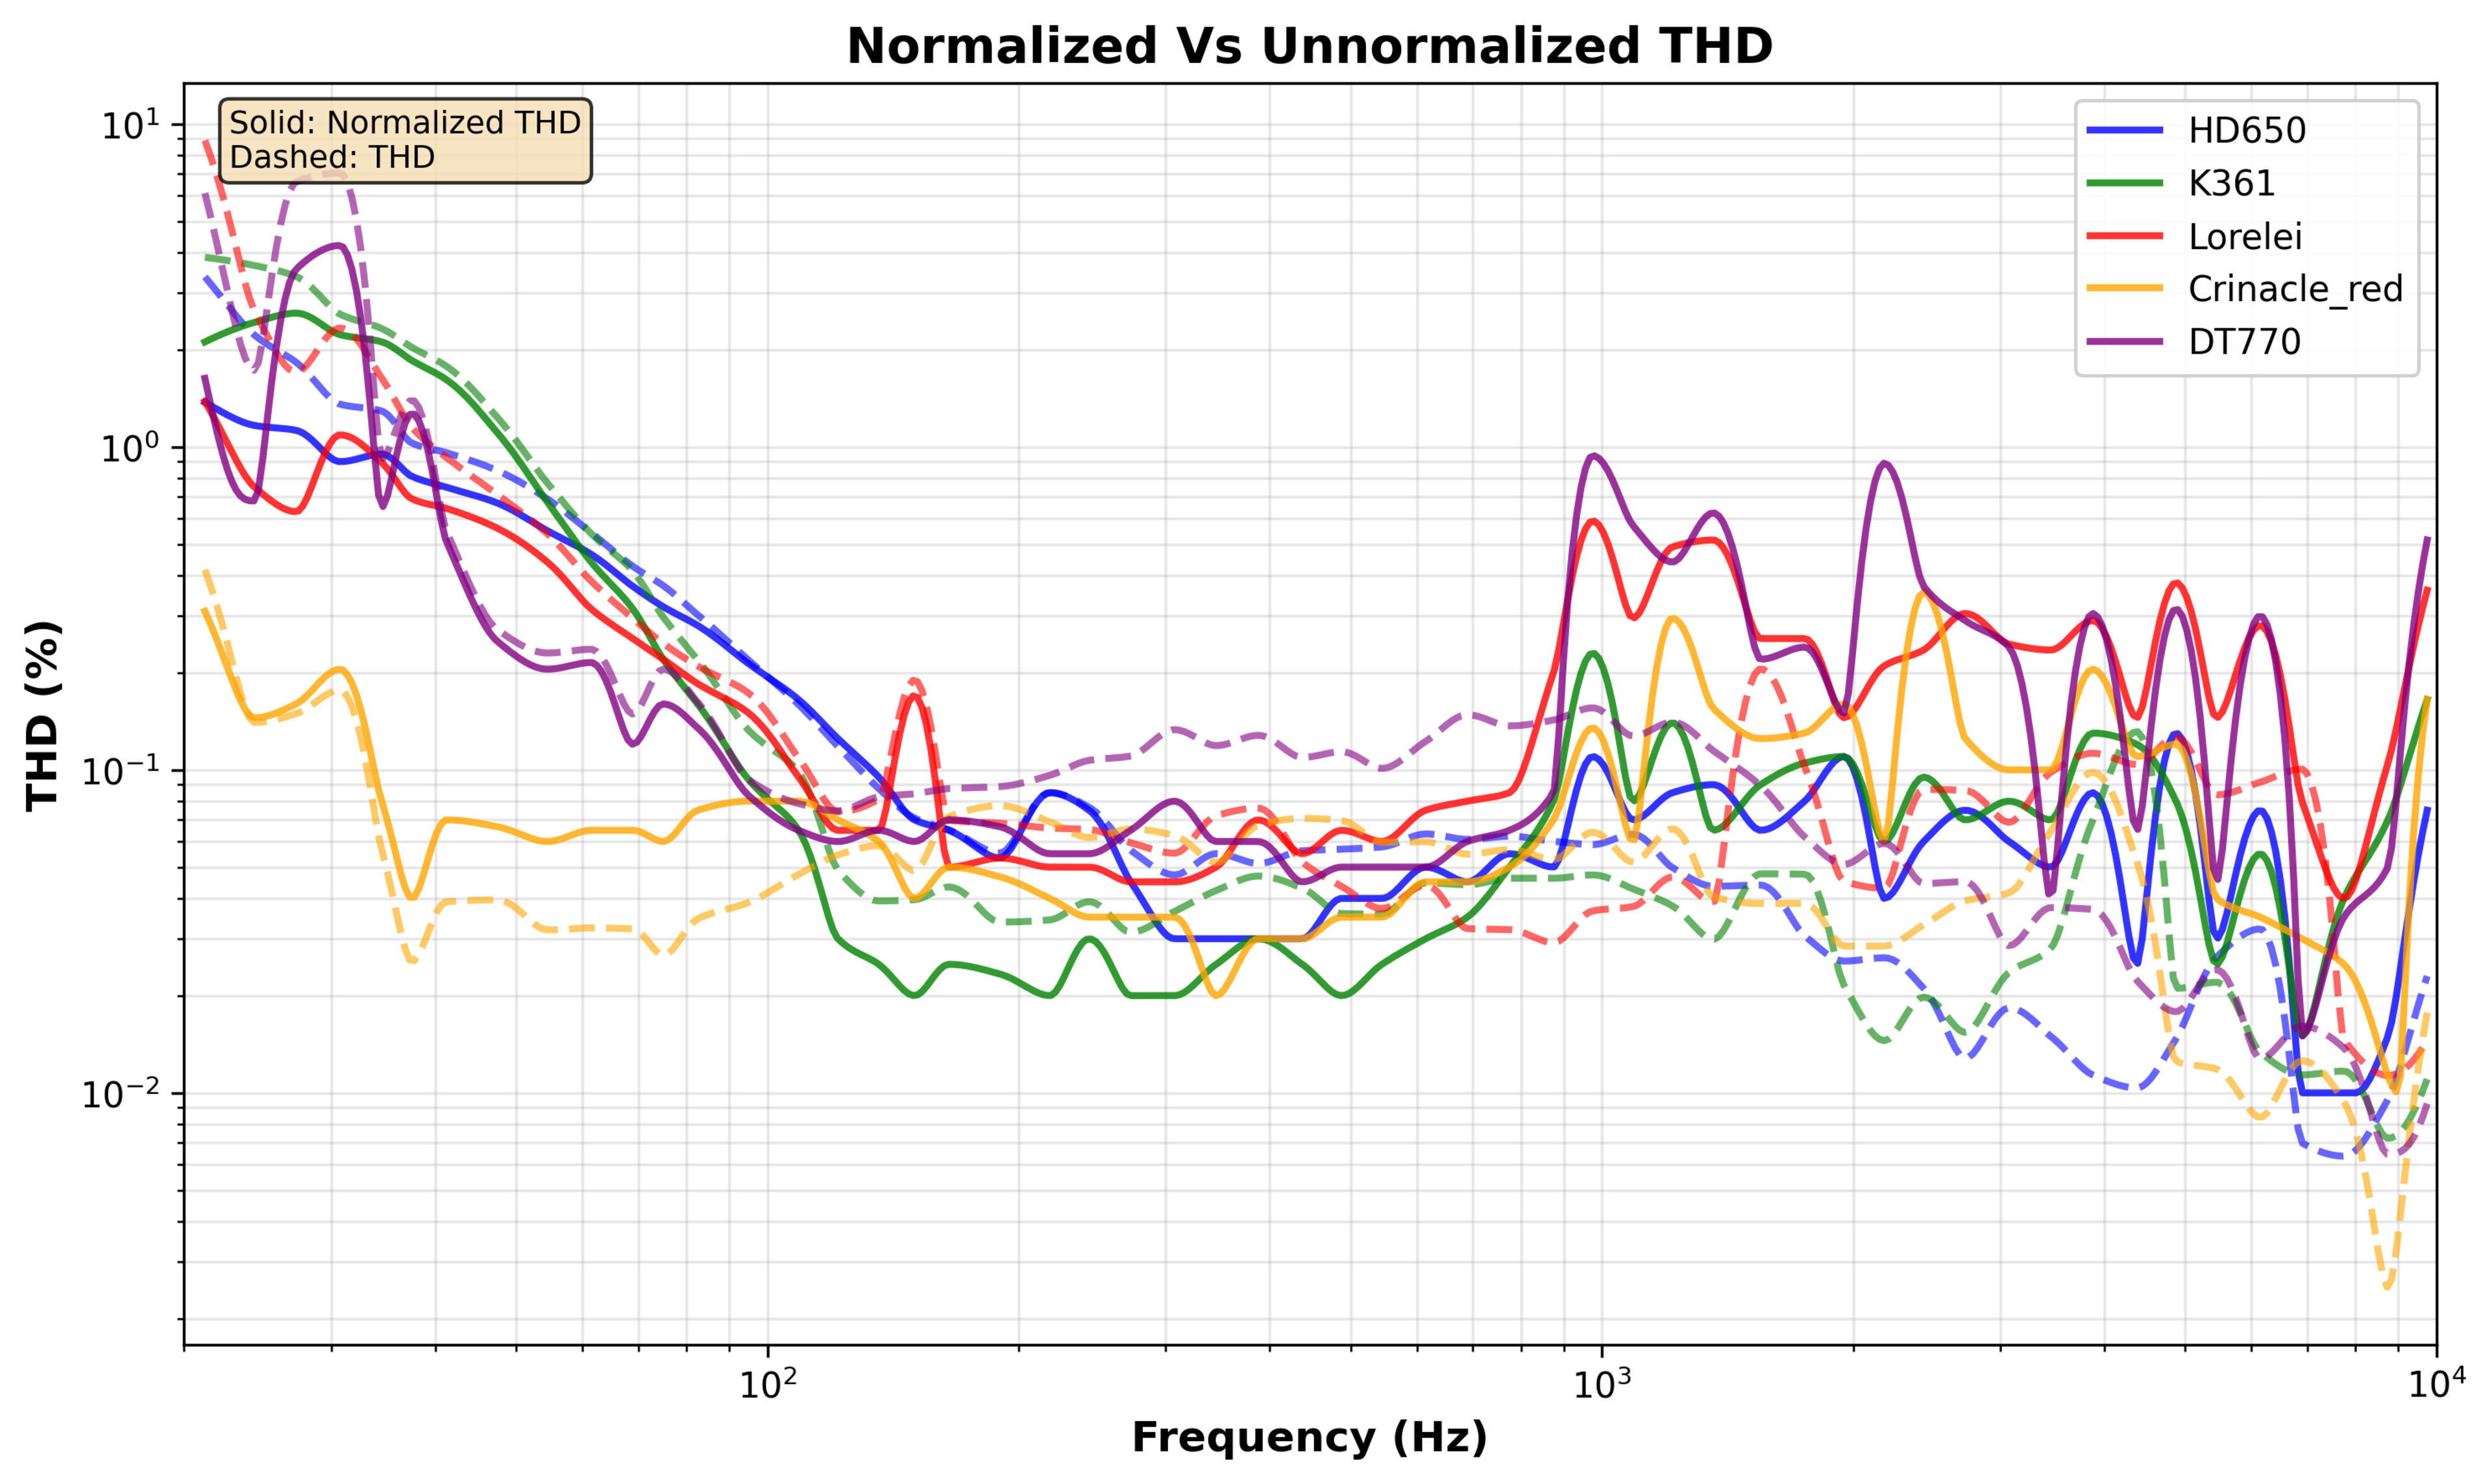
Figure 4 shows normalized THD measurements with relative differences between headphones, with the X6 and the DT 770 showing higher THD than the ZERO: RED, the K361, and the LCD-S20, though the differences aren't dramatic. Most headphones show higher distortion in the bass range, which is typical for dynamic drivers. These levels are representative of what we measure at RTINGS.com for the vast majority of our headphone reviews. Essentially, all these headphones have THD below 1% (100) throughout most of the audible range. The Frequency Normalized curve shows more elevated distortion in the mid- to high-mid frequency range (approximately 1–4kHz), which could potentially provide more insight into audibility since the human ear is more sensitive at these frequencies.
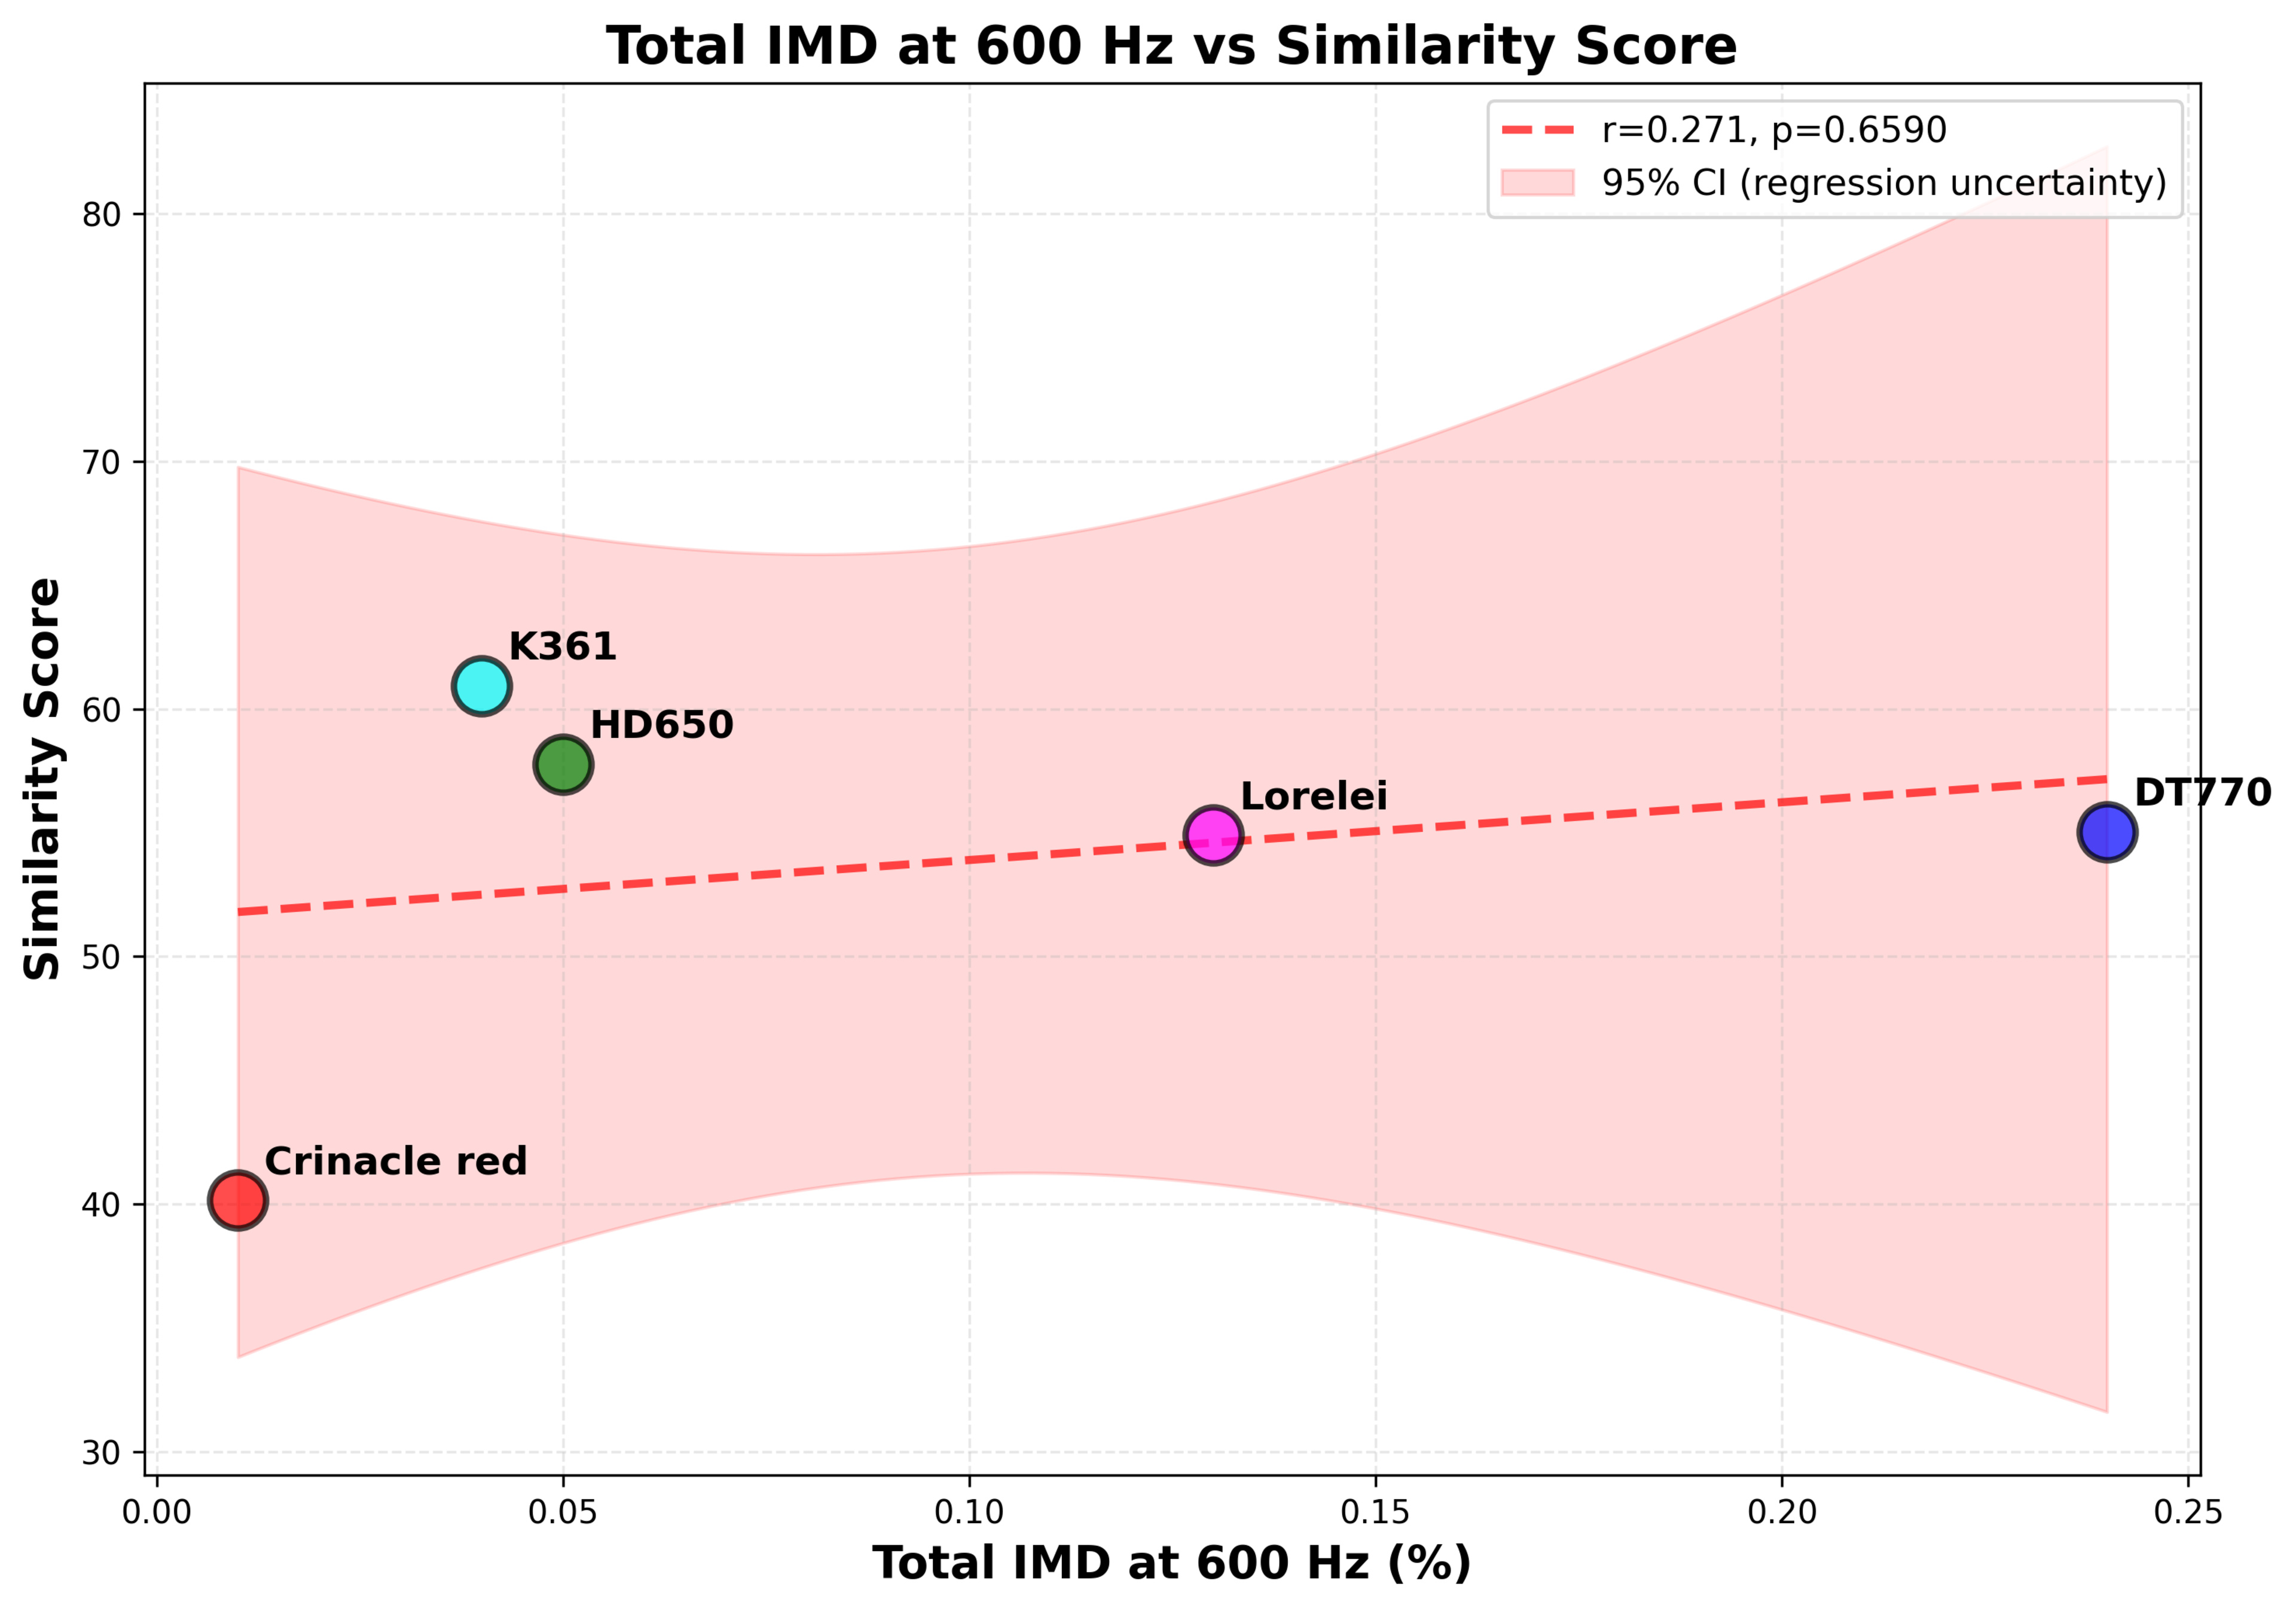
Intermodulation Distortion (IMD)
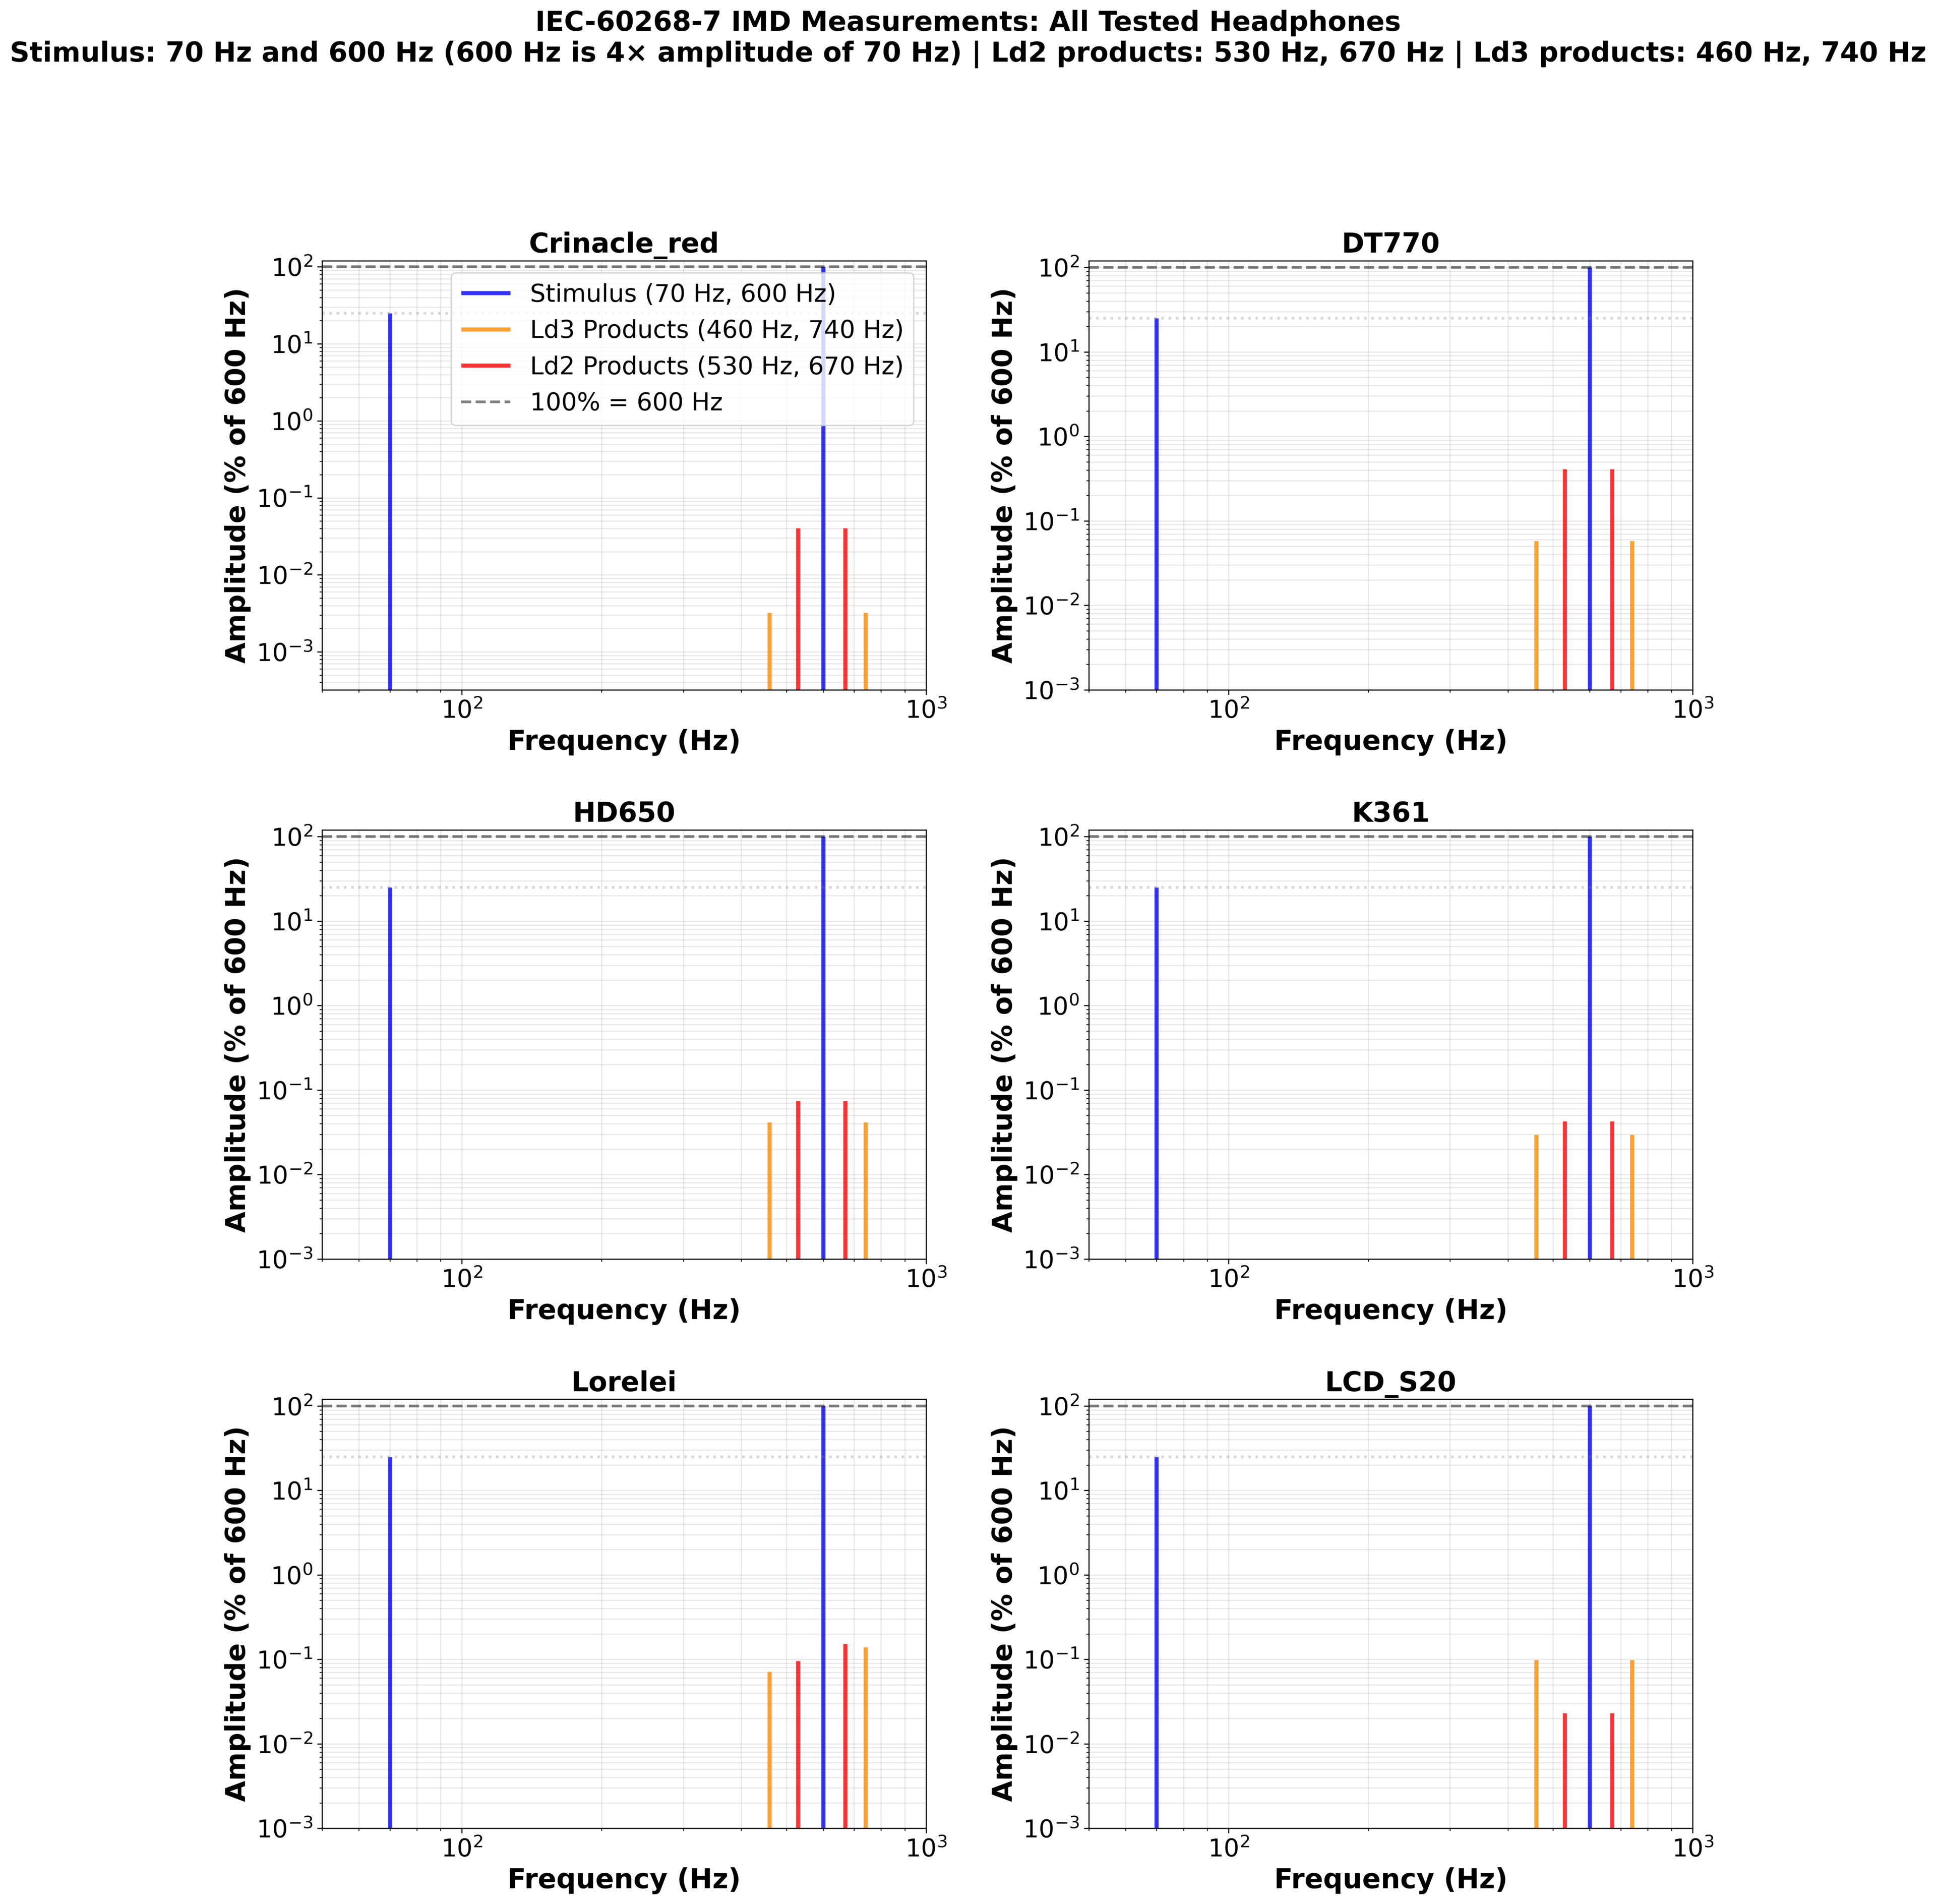
What happens when you play two frequencies at once? IMD measures the unwanted frequencies that appear, which are frequencies that weren't in the original signal. We measured IMD using the IEC-60268-7 standard: two tones at 70Hz and 600Hz (with a 4:1 amplitude ratio). The standard gives us two numbers: Ld2 (2nd-order distortion products at 530Hz and 670Hz) and Ld3 (3rd-order products at 460Hz and 740Hz). Lower values mean less distortion.
The following table summarizes IMD measurements for all tested headphones:
| Headphone | Ld2 (dB) | Ld3 (dB) | Total IMD at 600Hz (%) |
| ZERO: RED | -61.84 | -83.83 | 0.01 |
| DT 770 | -41.72 | -58.71 | 0.24 |
| HD 650 | -56.52 | -61.61 | 0.05 |
| K361 | -61.40 | -64.55 | 0.04 |
| LCD-S20 | -66.73 | -54.09 | 0.03 |
| X6 | -52.09 | -53.50 | 0.13 |
IMD measurements reveal some differences: the DT 770 show the highest IMD, while the ZERO: RED and K361 show the lowest. These differences are visible in the FFT plots and are confirmed by the Total IMD at 600Hz values. Interestingly, the headphones also have different IMD profiles, with the X6 and LCD-S20 having more third-order products than second-order.
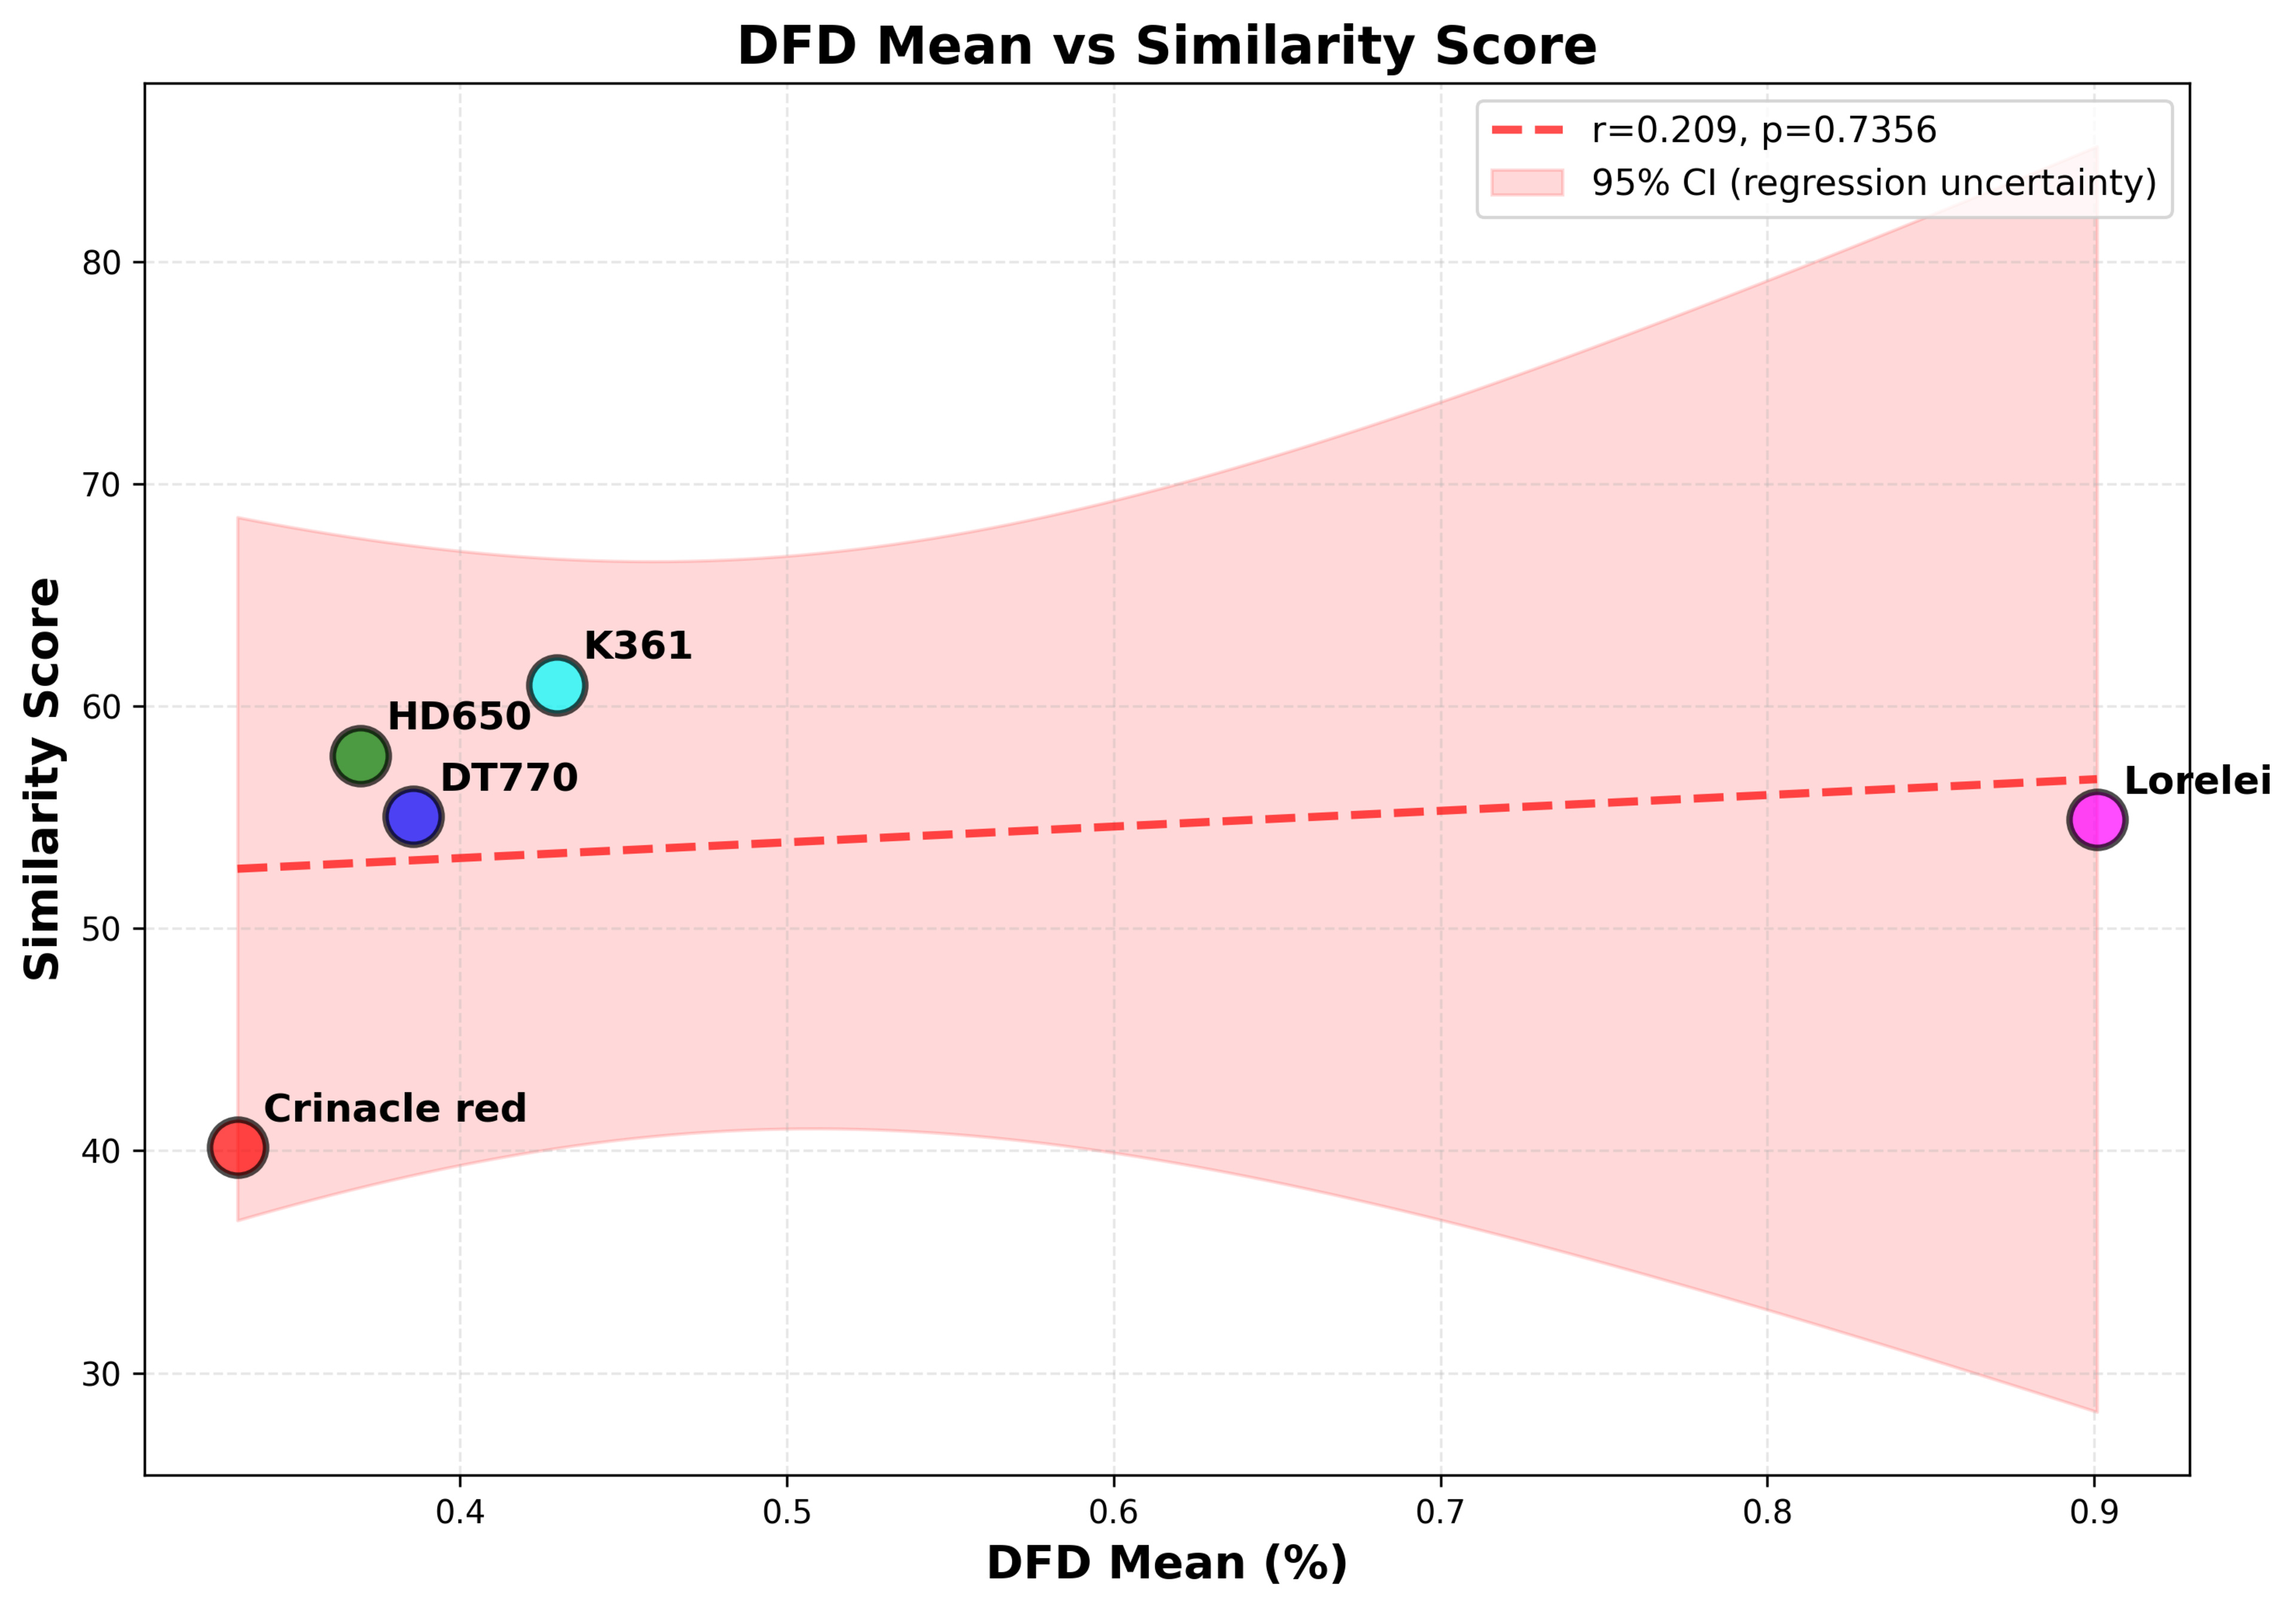
Difference Frequency Distortion (DFD)
Difference Frequency Distortion (DFD) measures intermodulation distortion using two simultaneous tones separated by 80Hz, as specified in the IEC 60268-7 standard. We measured DFD across a wide frequency range (100Hz to 20,000Hz) using a tone train with 12 points per octave, with each measurement point consisting of a primary tone and a secondary tone 80Hz apart. The graph starts at 100Hz, with the secondary tone sitting at 80Hz below, making it at the edge of the audible band (20Hz). This measurement revealed how headphones handle frequency interactions across the frequency range.
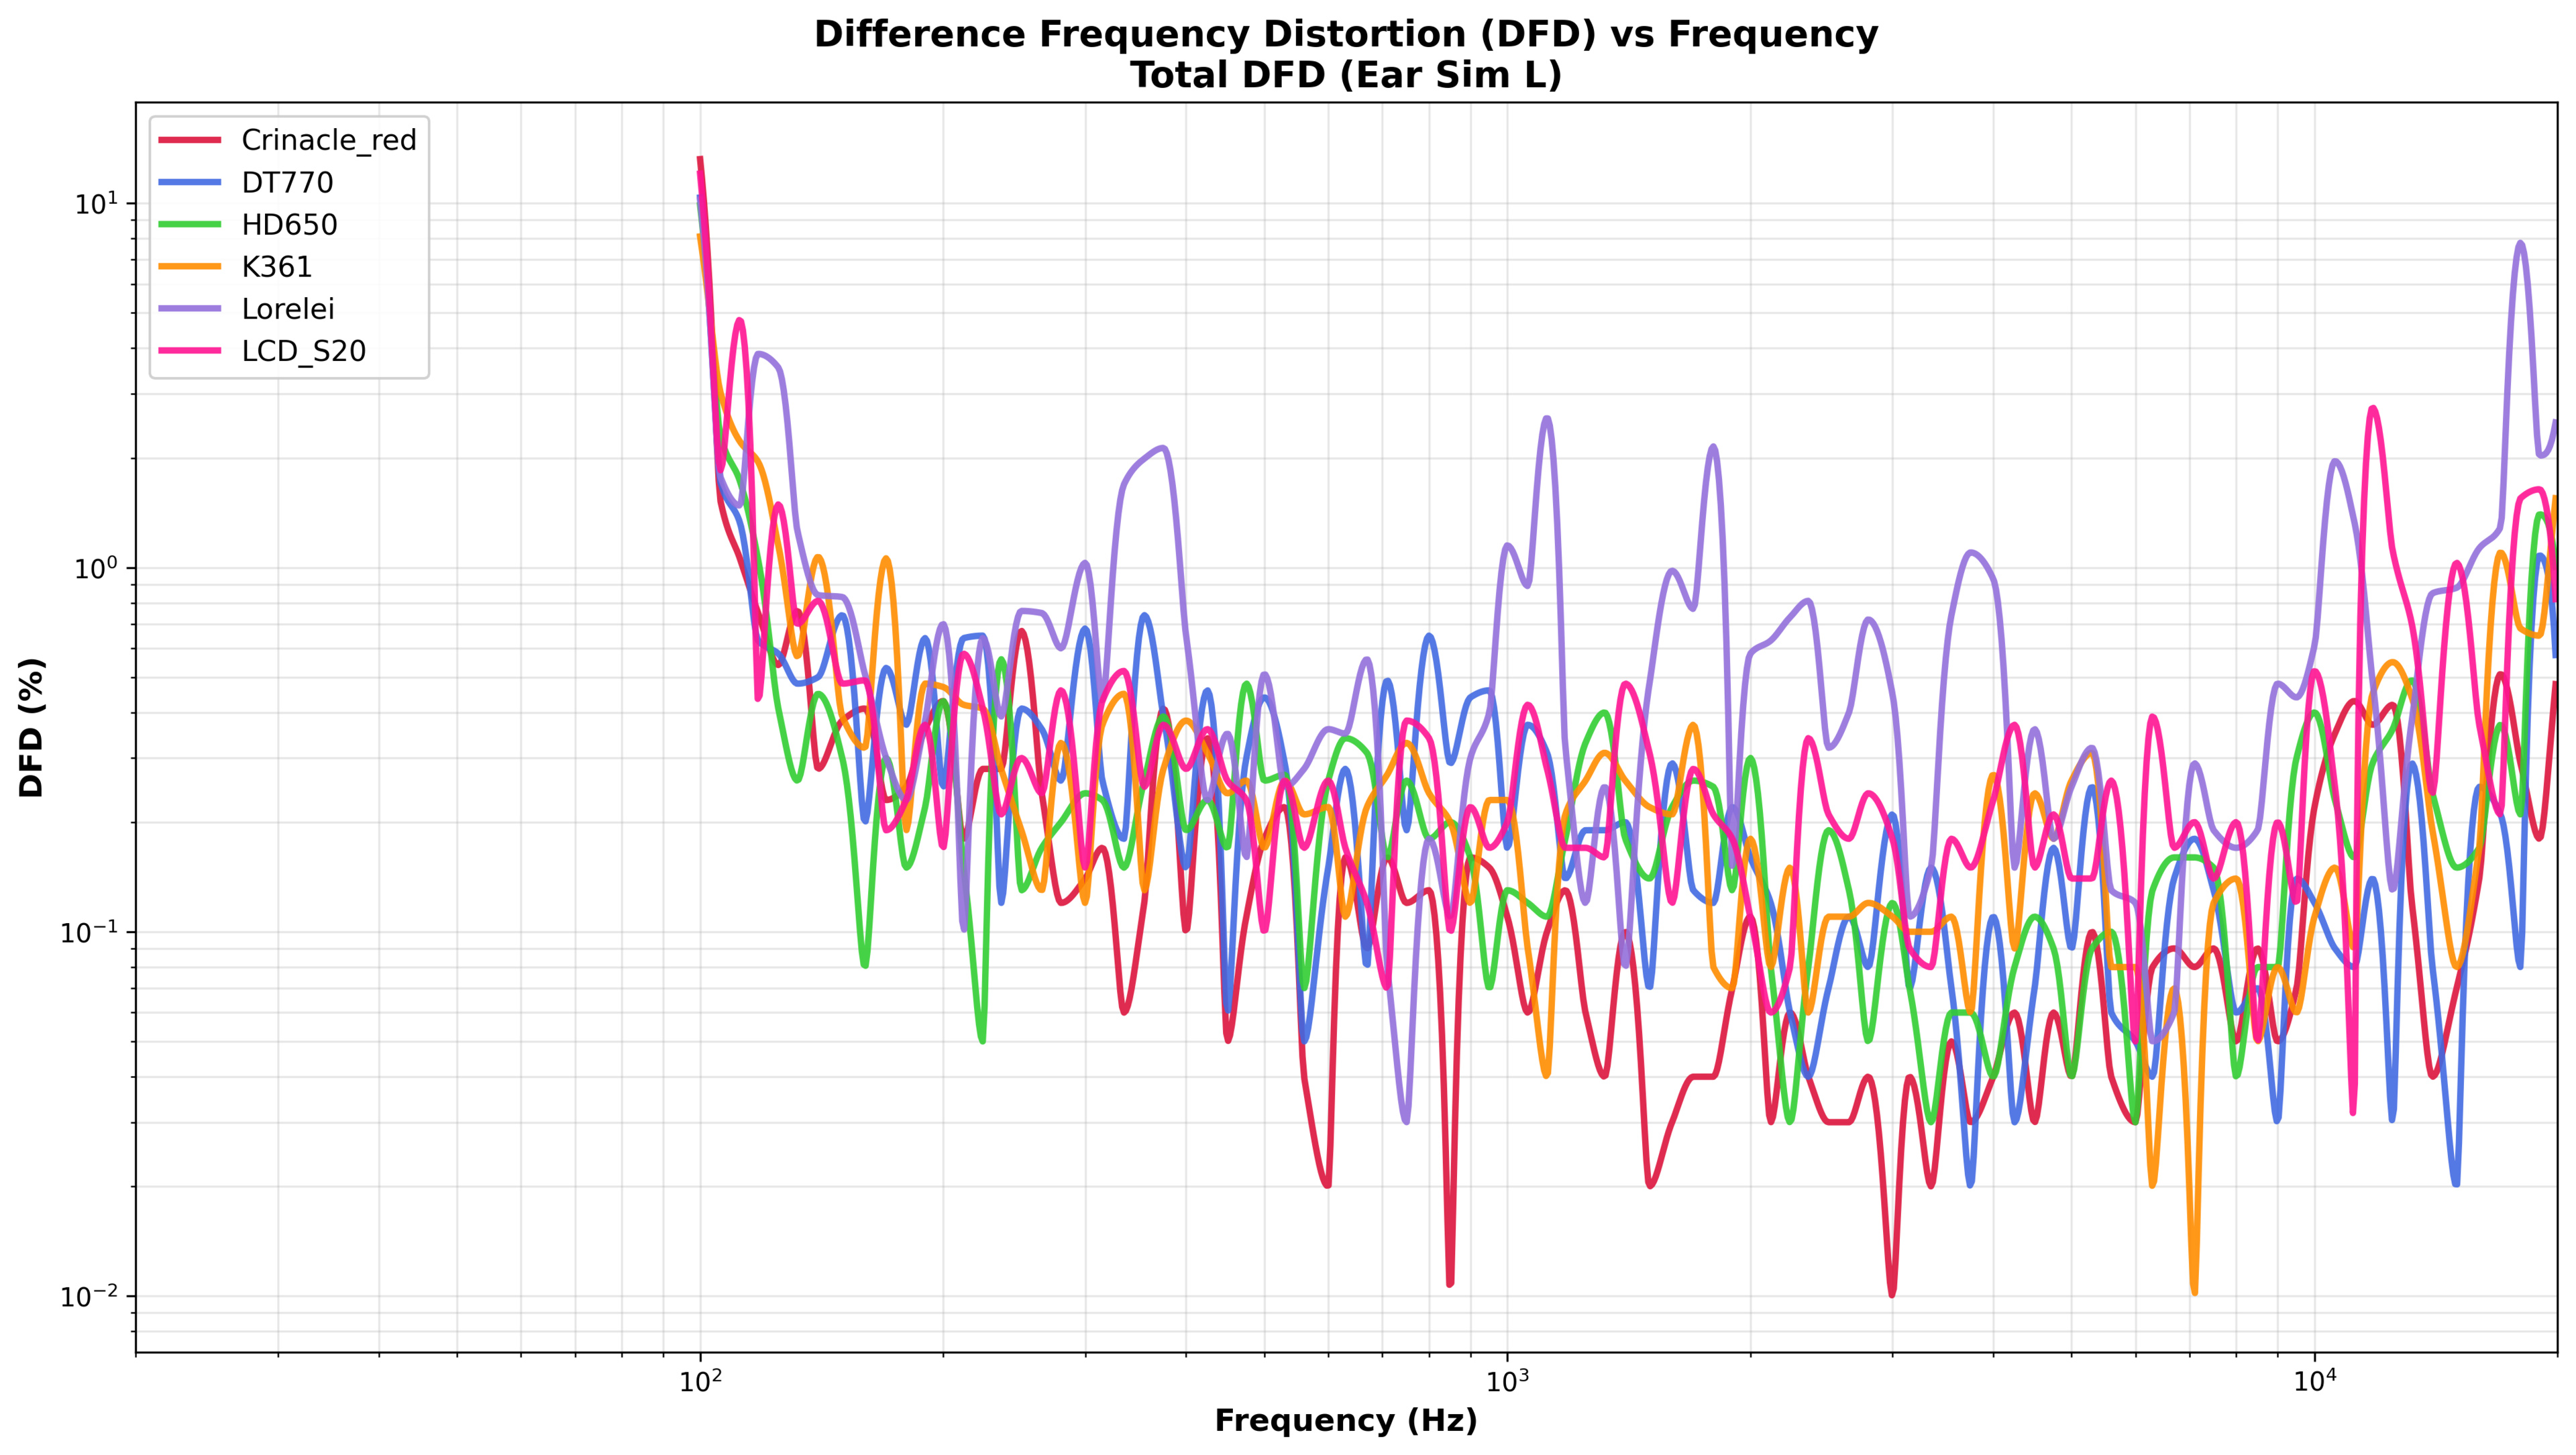
All headphones exhibit maximum DFD in the bass range, with values within the same order of magnitude across the frequency range. The X6 show significantly elevated DFD levels compared to the other headphones.
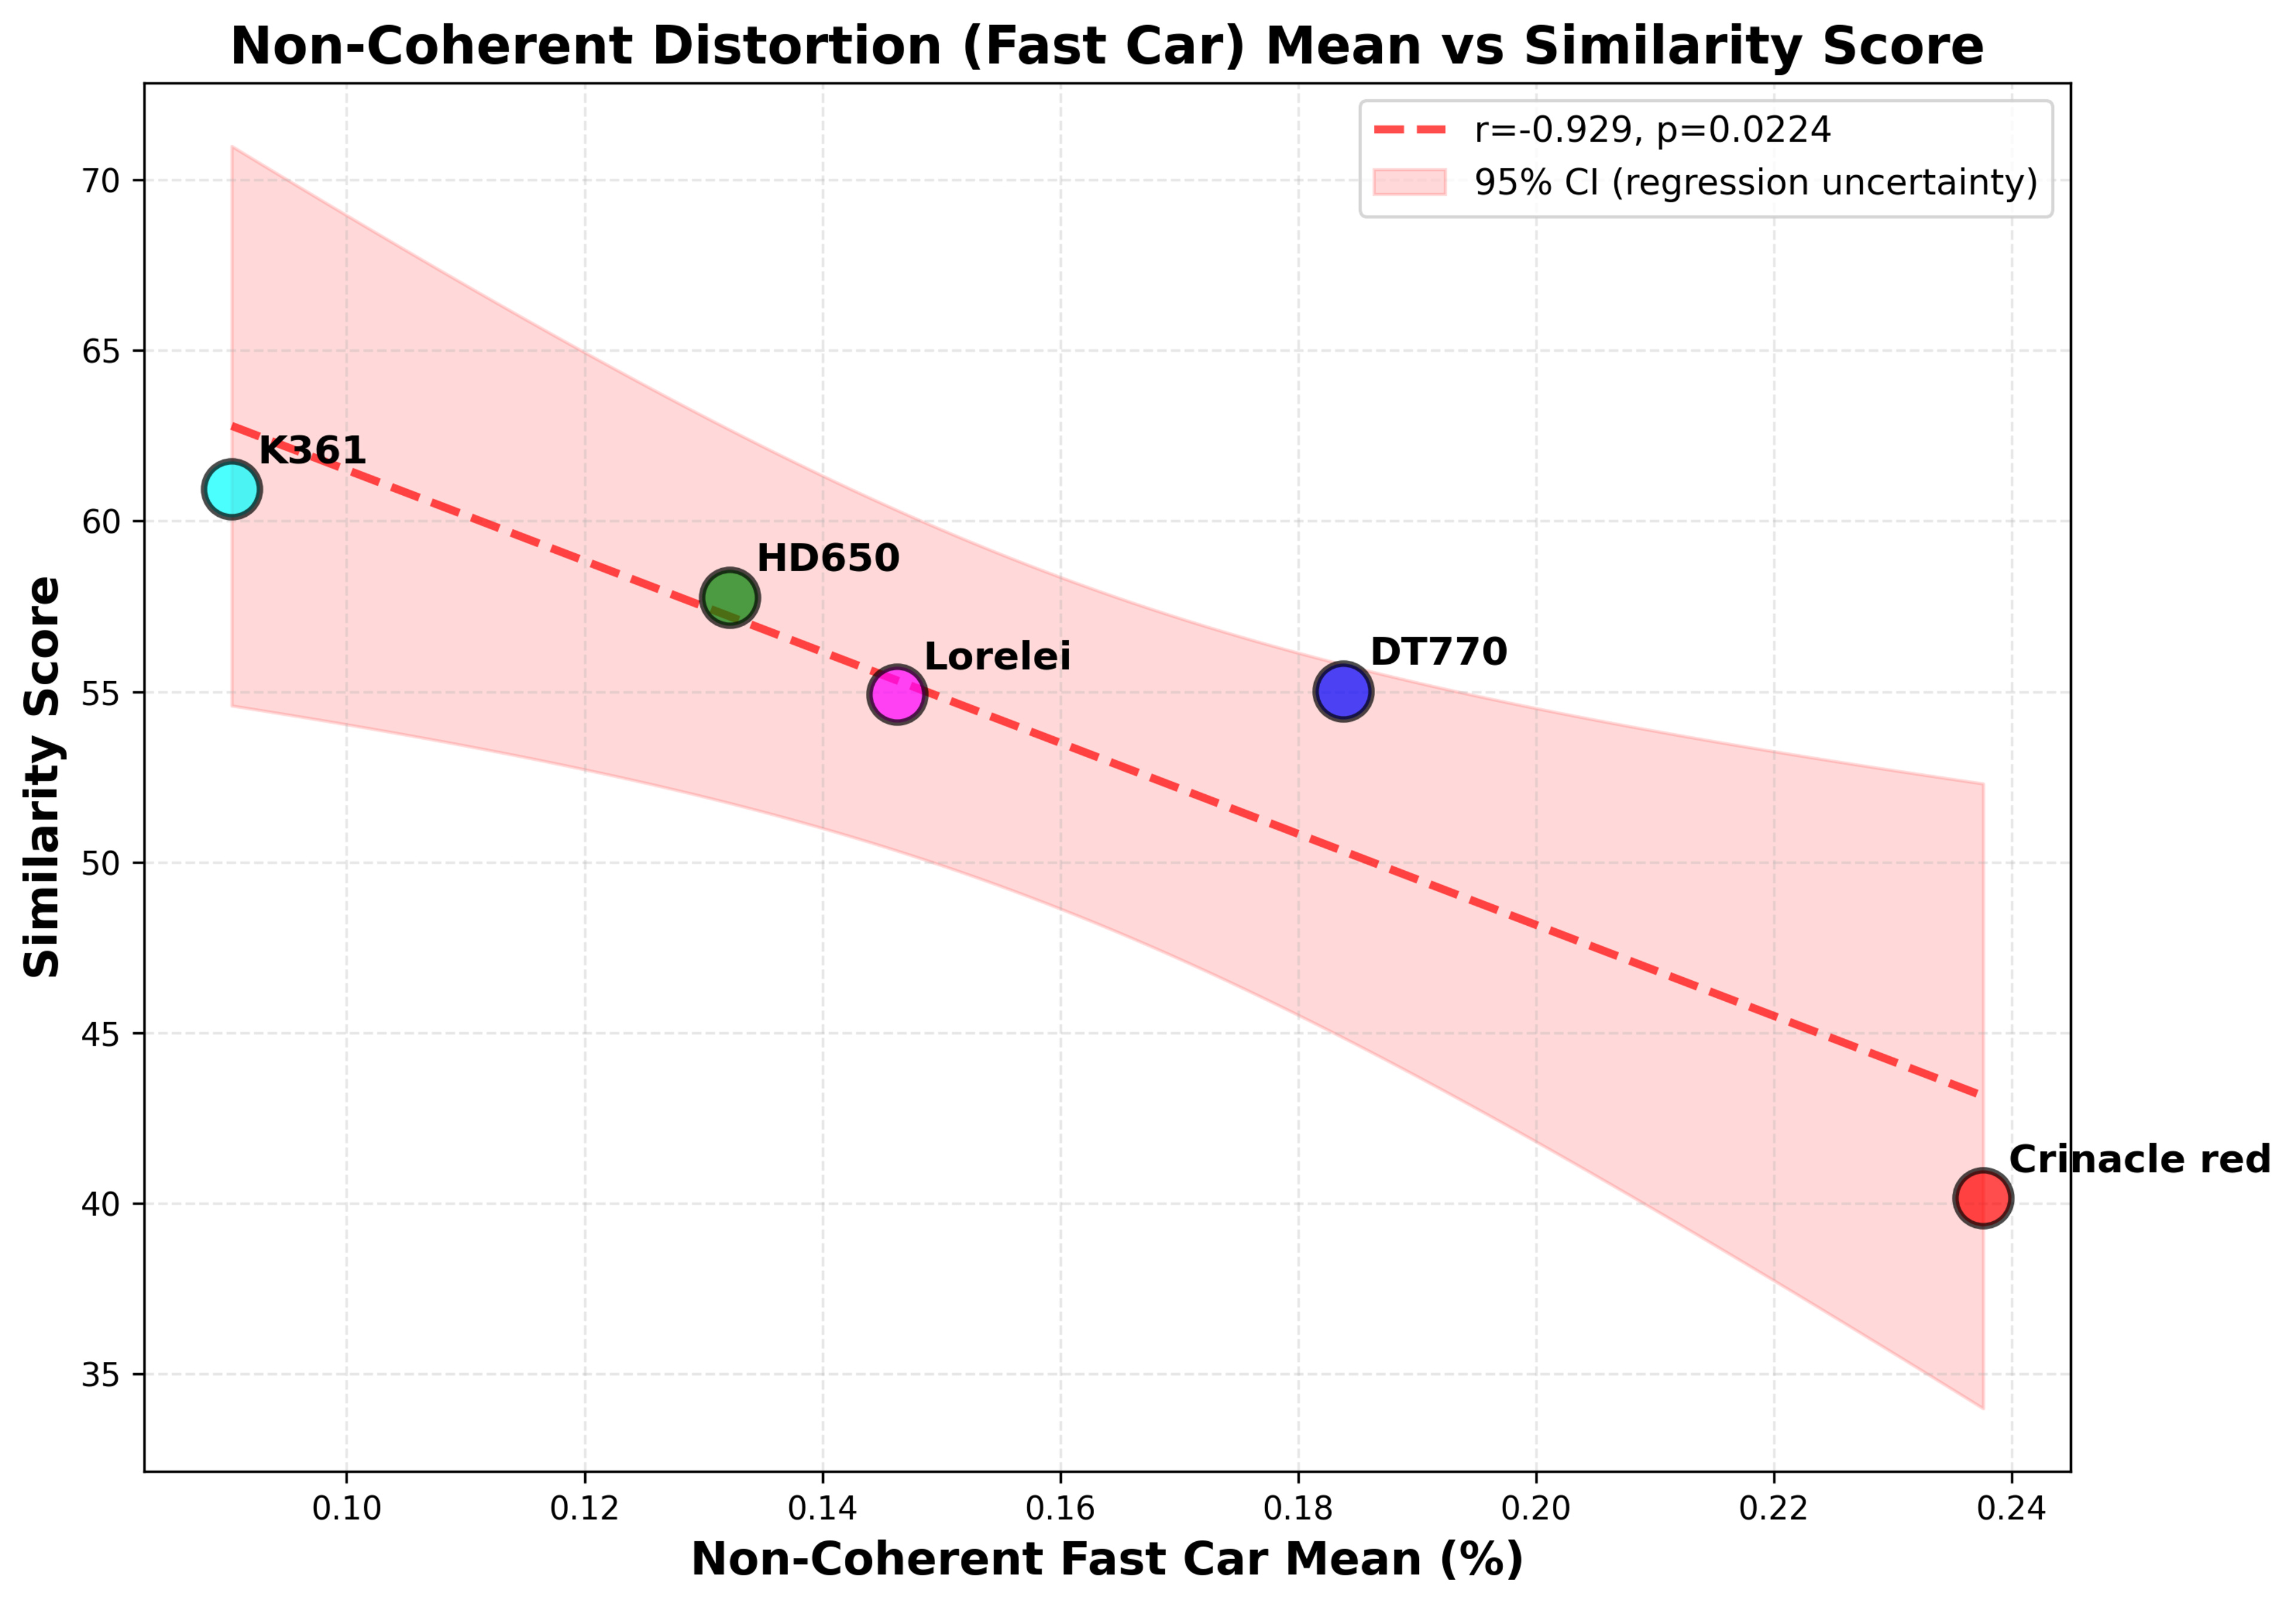
Non-Coherent Distortion: Musical Stimuli
Non-coherent distortion captures all non-linearities: noise, intermodulation products, and unpredictable artifacts. Unlike harmonic distortion, these components can appear anywhere in the spectrum. We measured non-coherent distortion by comparing the processed files used in our listening tests against the Clean reference files: this is why we specifically mention "Fast Car" (a song by Tracy Chapman) and "Spanish Harlem" (a song by Rebecca Pidgeon), as these refer to the musical stimuli that listeners actually heard. Measurements were taken at 94 dBA SPL. The plots show non-coherent distortion with frequency response overlaid to illustrate how distortion relates to the headphones' frequency response characteristics.
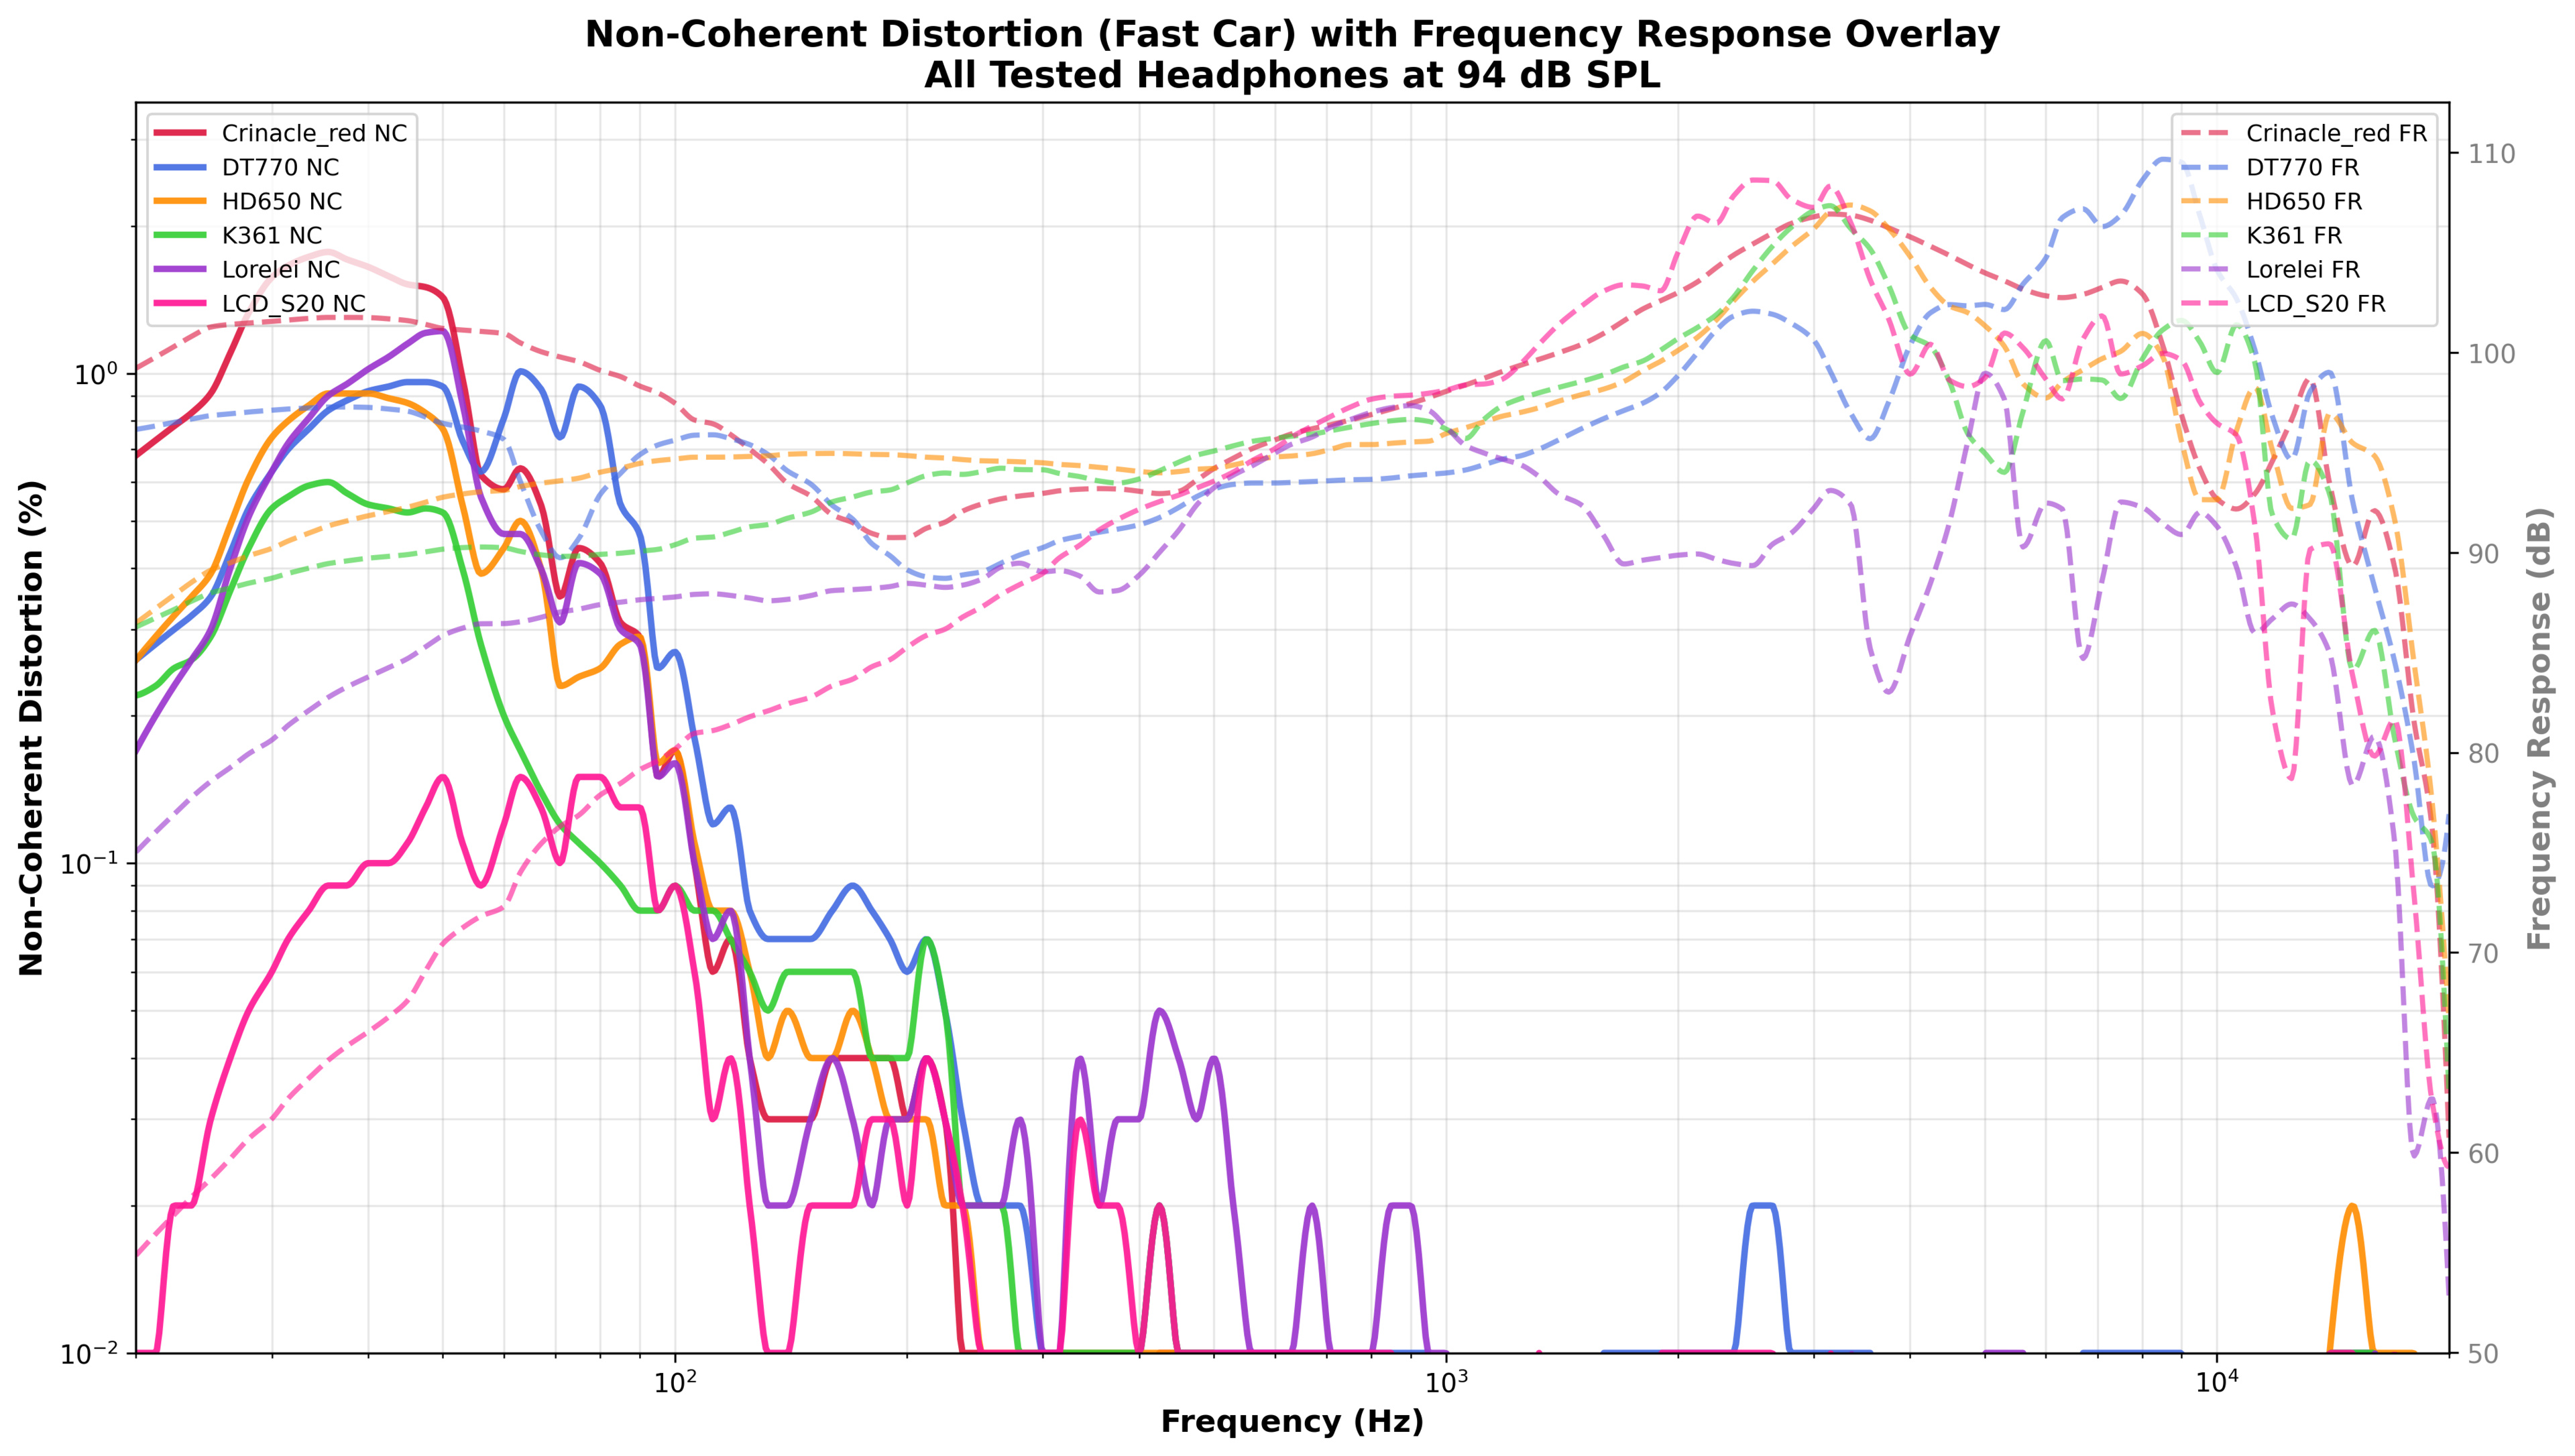
Figure 7 shows non-coherent distortion measurements revealing that the ZERO: RED show high levels despite low THD, while the LCD-S20 show significantly less non-coherent distortion (but also significantly less bass, as non-coherent distortion isn't a normalized measurement).
Experiment 1: Distortion Becomes Audible at Levels Above Normal Listening
The only way to really know if you can hear distortion is through ABX blind testing, so we gathered some colleagues and put the headphones to the test.
Method: Adaptive Staircase Threshold Detection
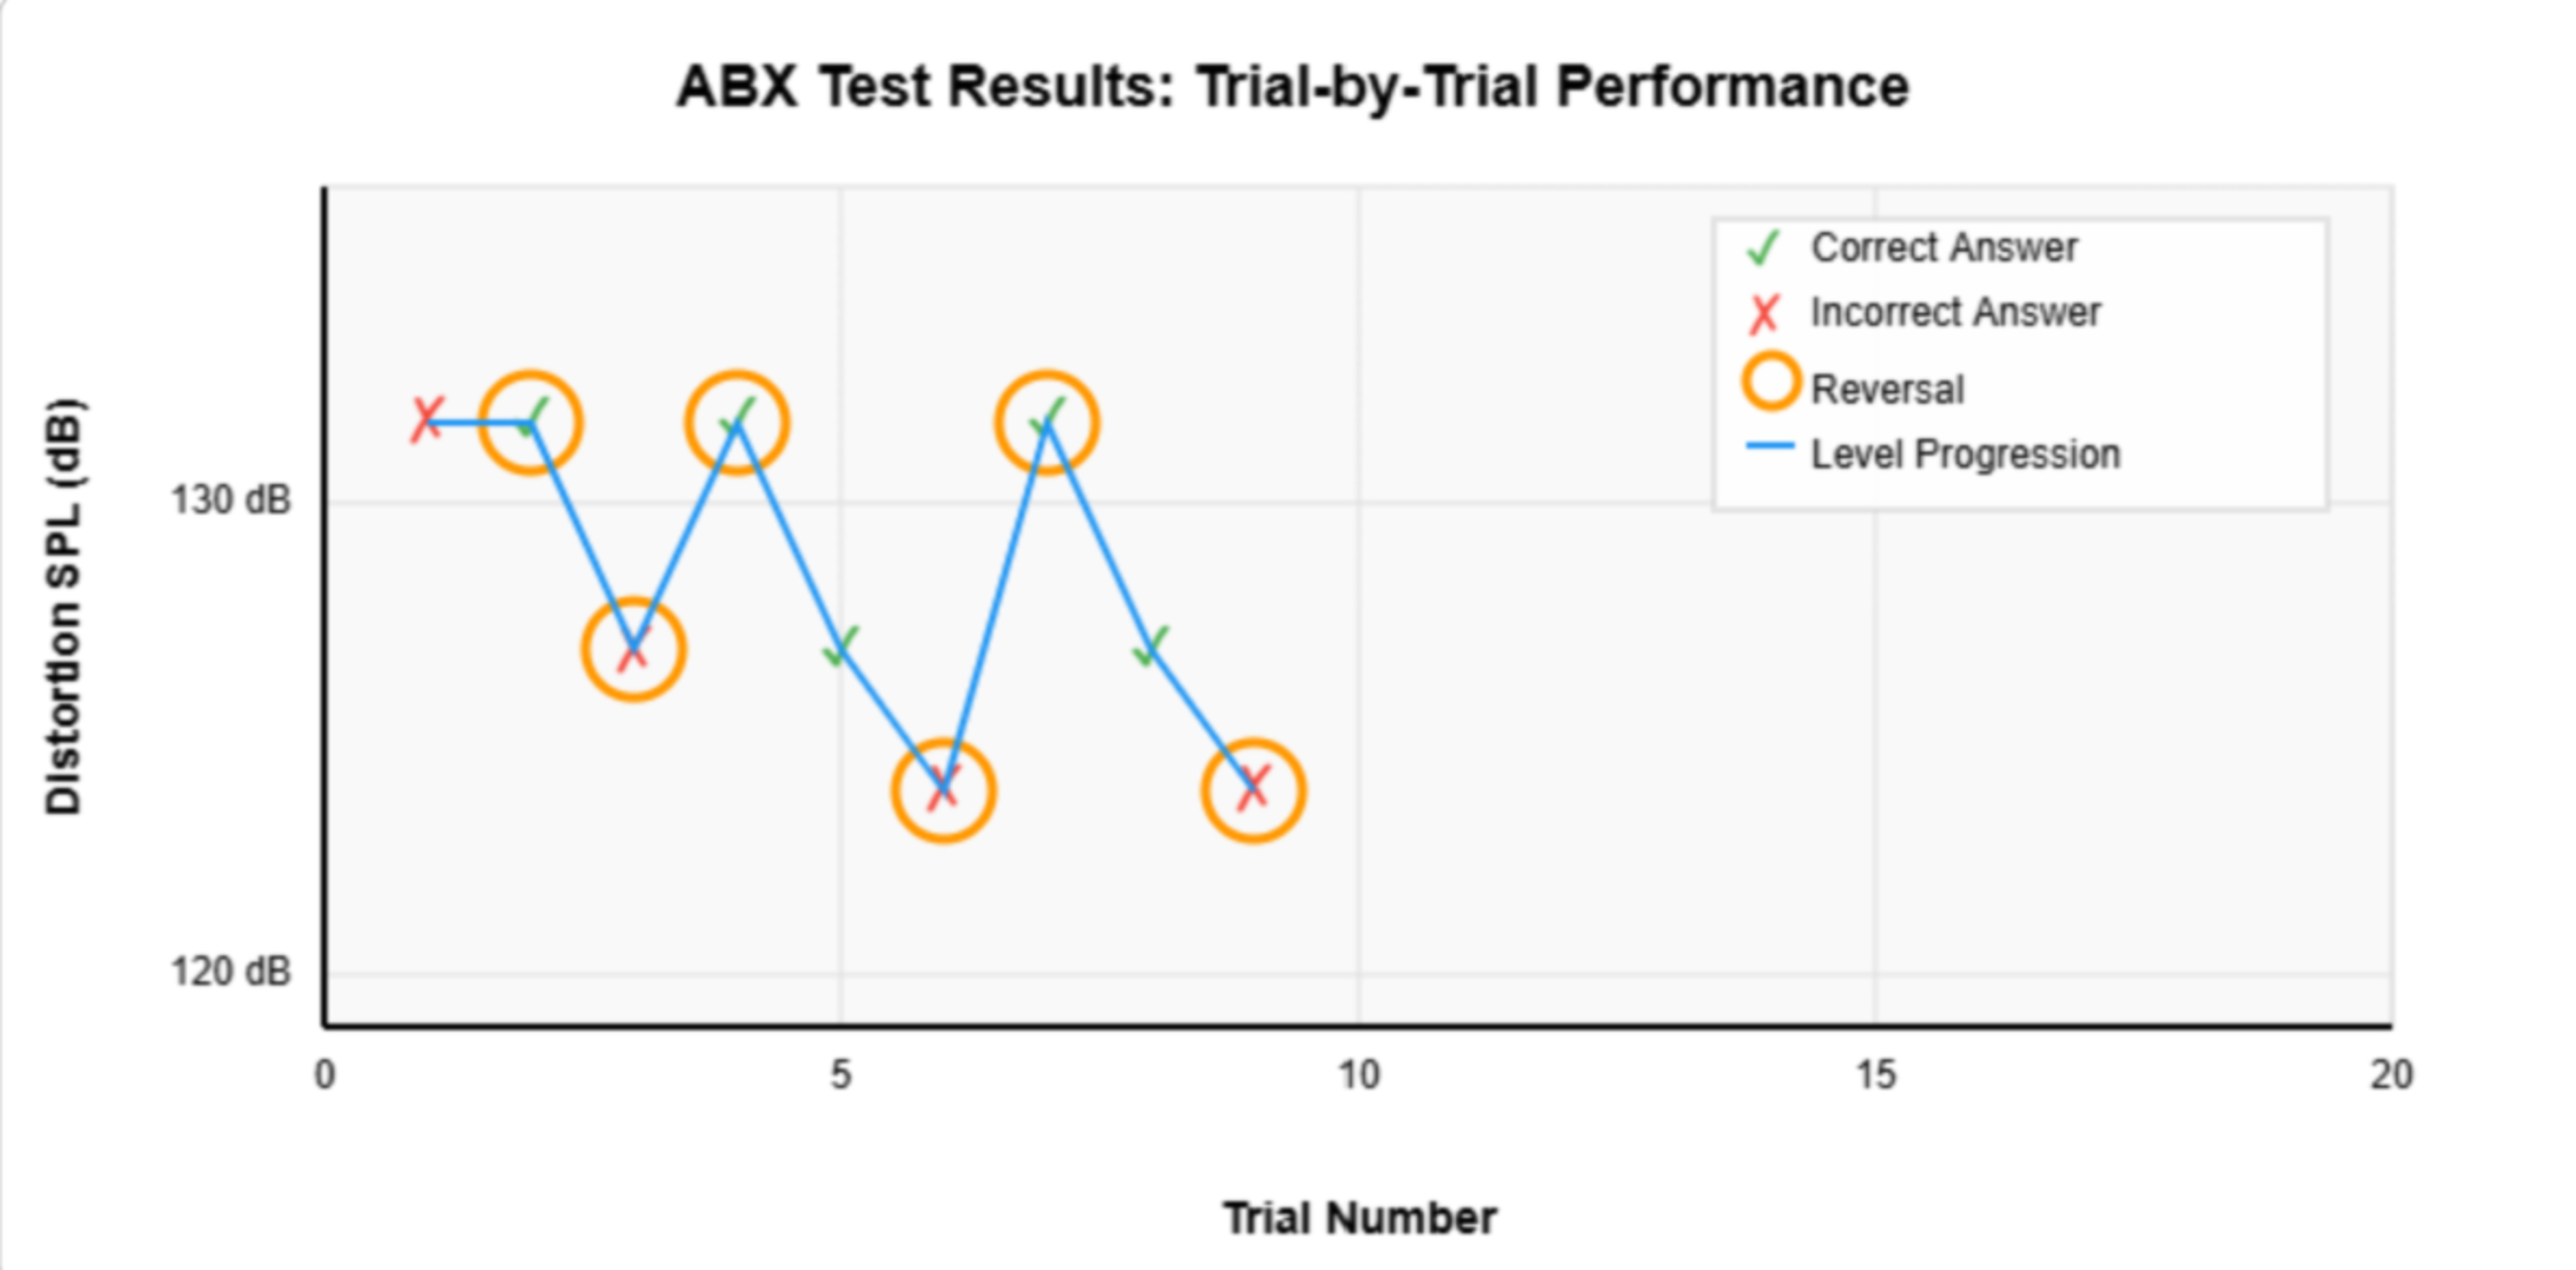
To find out at what level distortion becomes audible, we used ABX discrimination tests with an adaptive staircase procedure based on the Kaernbach method. In each ABX trial, listeners heard three samples: A (either a random clean file or a binaurally recorded version of the same extract), B (either distorted or clean, but of the two, the algorithm picked the one that is not A), and X (which matches either A or B). Listeners must identify whether X matches A or B. We started with recordings at high distortion levels (high SPL), where differences were easier to detect, and then adaptively adjusted the distortion level based on performance.
The adaptive staircase works by decreasing the distortion level (making discrimination harder) after correct answers and increasing it (making discrimination easier) after incorrect answers. A reversal occurs when performance changes direction: for example, if, after a series of correct answers at a given level, the listener gets an incorrect answer, then the staircase would reverse direction. The step size started at 6 dB and was halved after the second reversal, allowing the procedure to converge on the threshold where listeners can just barely detect differences.
We tested three headphones (the ZERO: RED, the K361, and the LCD-S20) using two musical stimuli: 11 seconds of "Fast Car" and 9 seconds of "Spanish Harlem." Thirteen listeners participated in the threshold-detection tests, nine of whom had formal distortion-discrimination training. Training consisted of around 30 hours over three months, during which the listeners acquainted themselves with the same discrimination process using the Klippel Online Listening test. We weren't asking if they could detect the distorted extract; the goal was to see if the listener could hear a difference. Thresholds were calculated as the mean of the last four reversals, corresponding to a 67% correct detection rate (d' ≈ 1.0). All audio files were normalized to -16 LUFS, and participants listened at a calibrated playback level of 83 dBA SPL.
Results: Thresholds Occur at Levels That No One Listens At
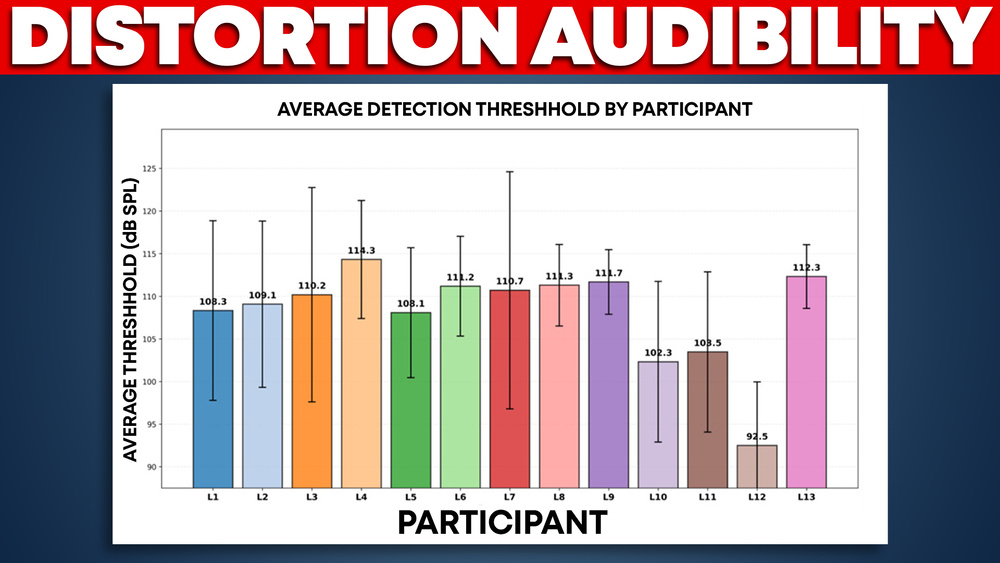
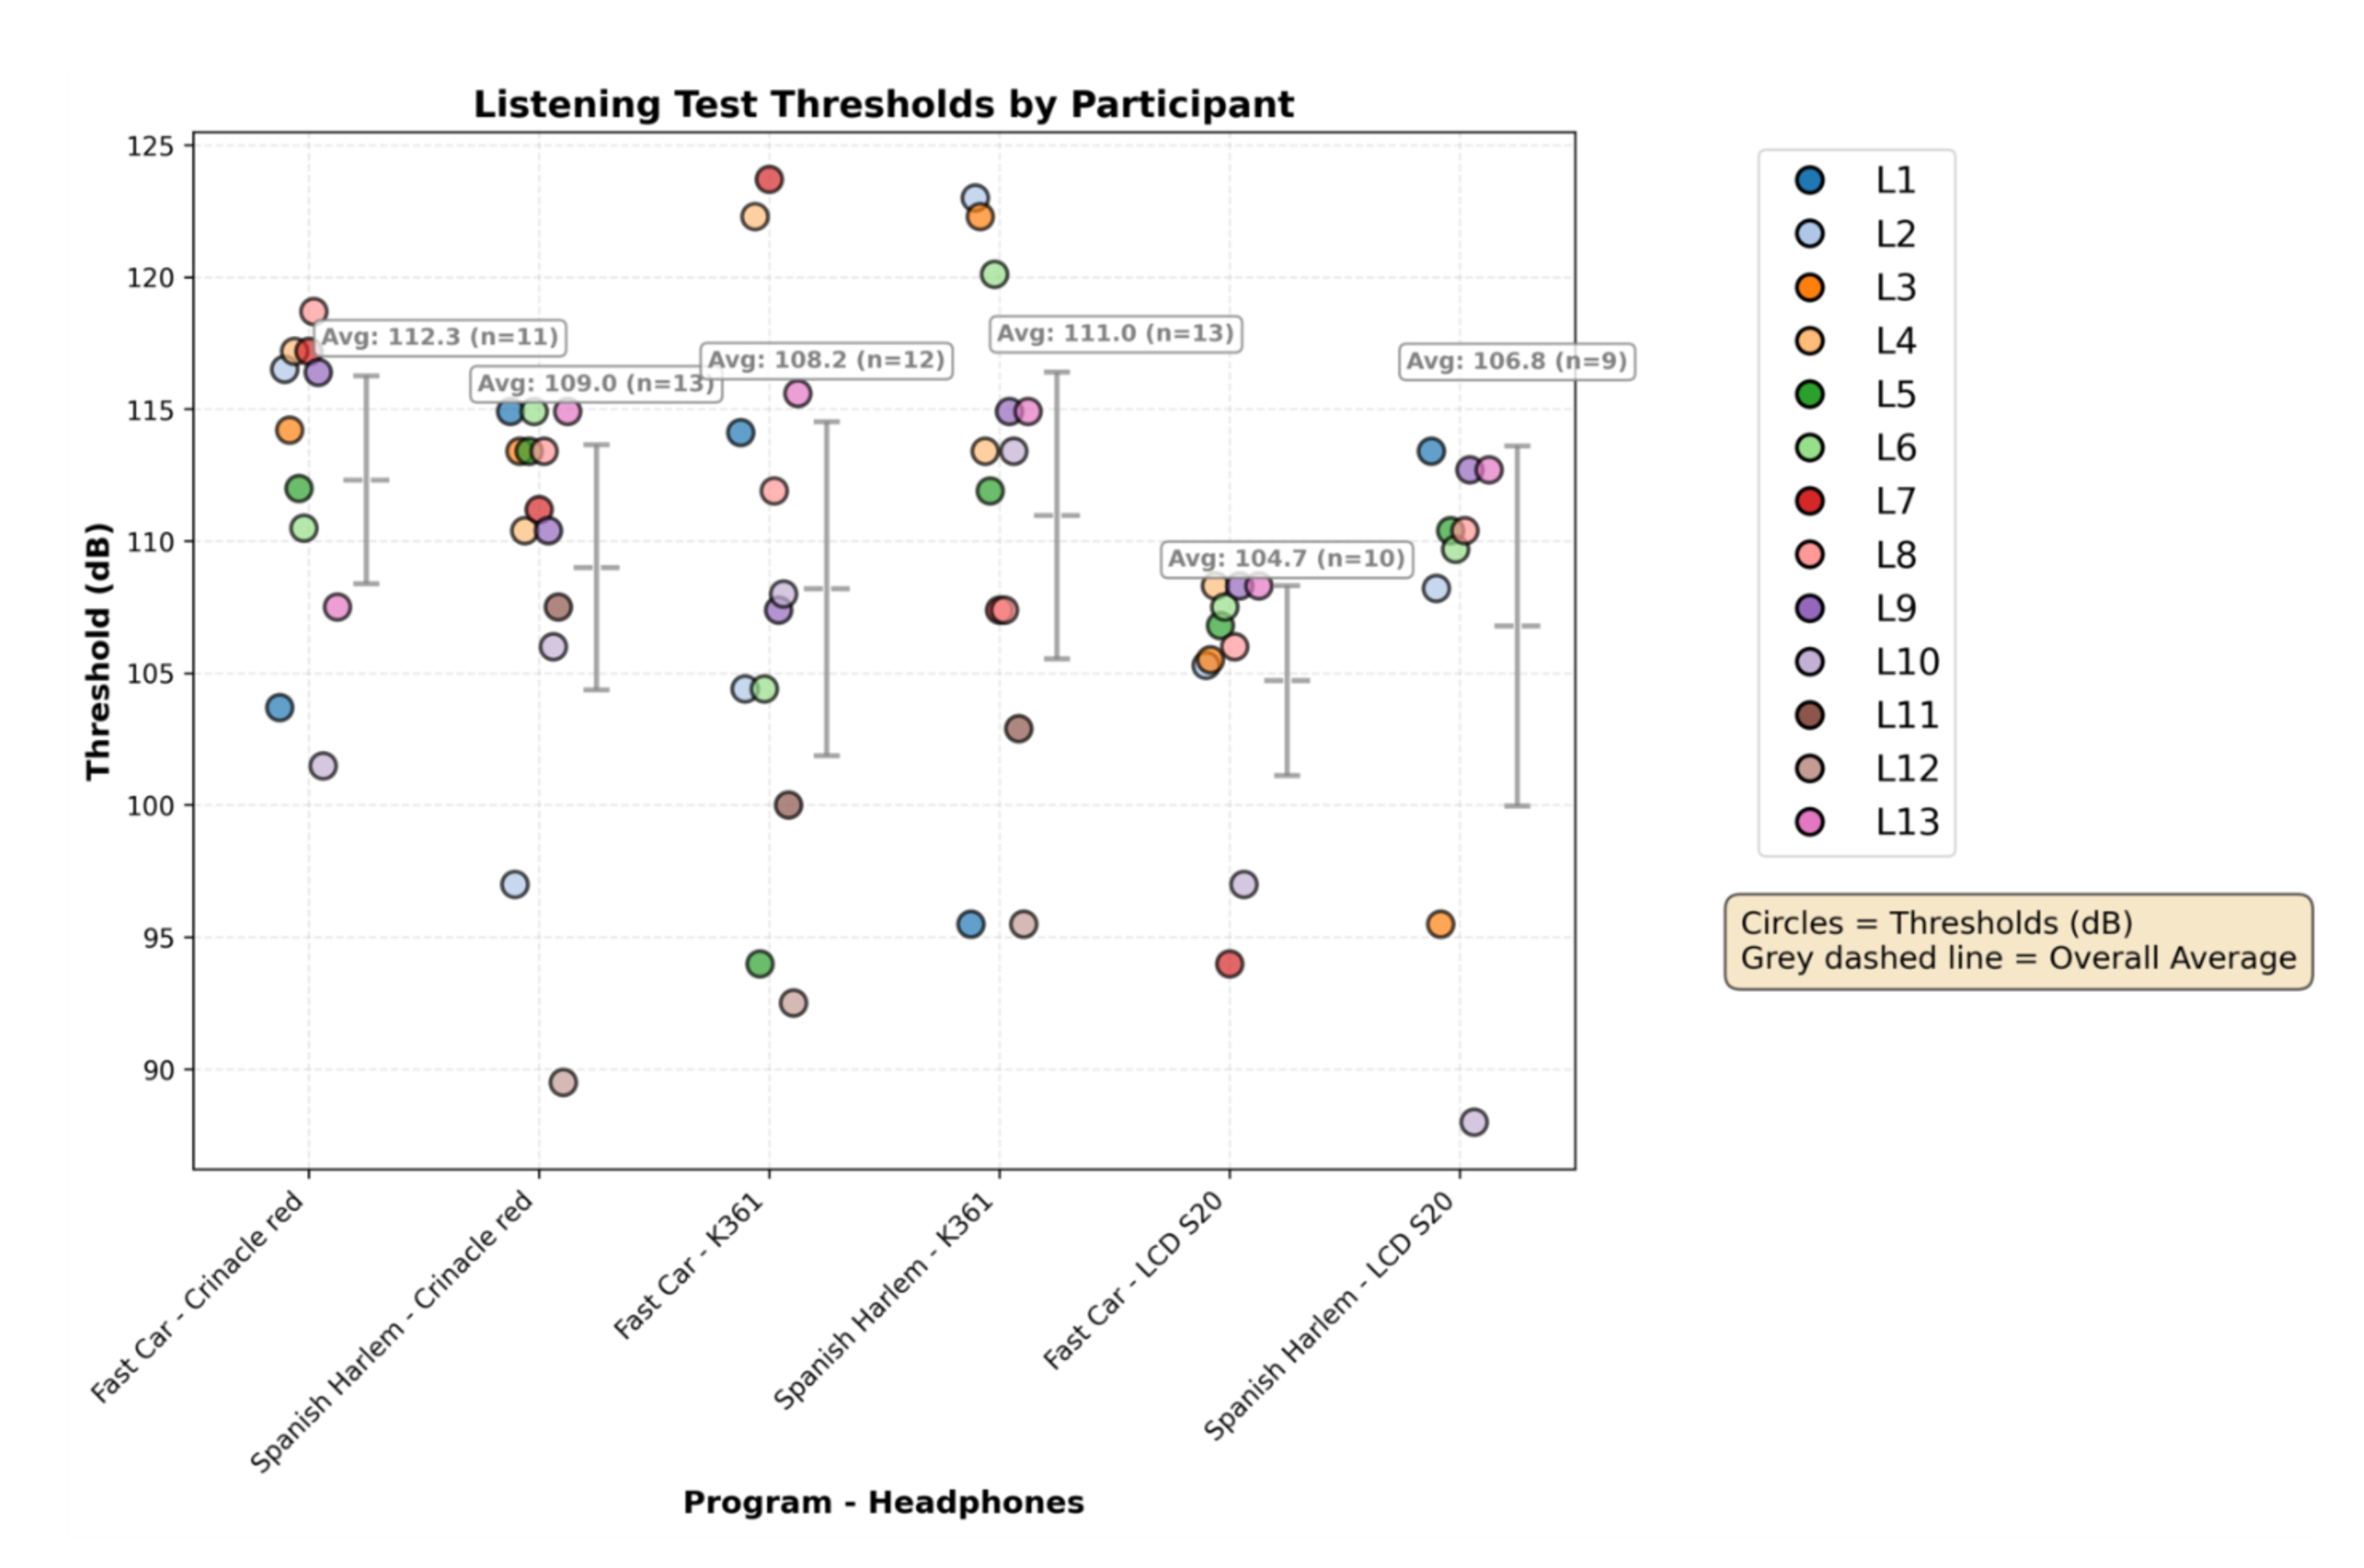
Figure 9 shows that thresholds (104–112 dBA SPL) were well above normal listening levels (typically 70–85 dBA SPL). Even the LCD-S20, which showed the lowest thresholds, required 105 dB SPL on average before distortion became reliably detectable, which is well above comfortable listening levels.
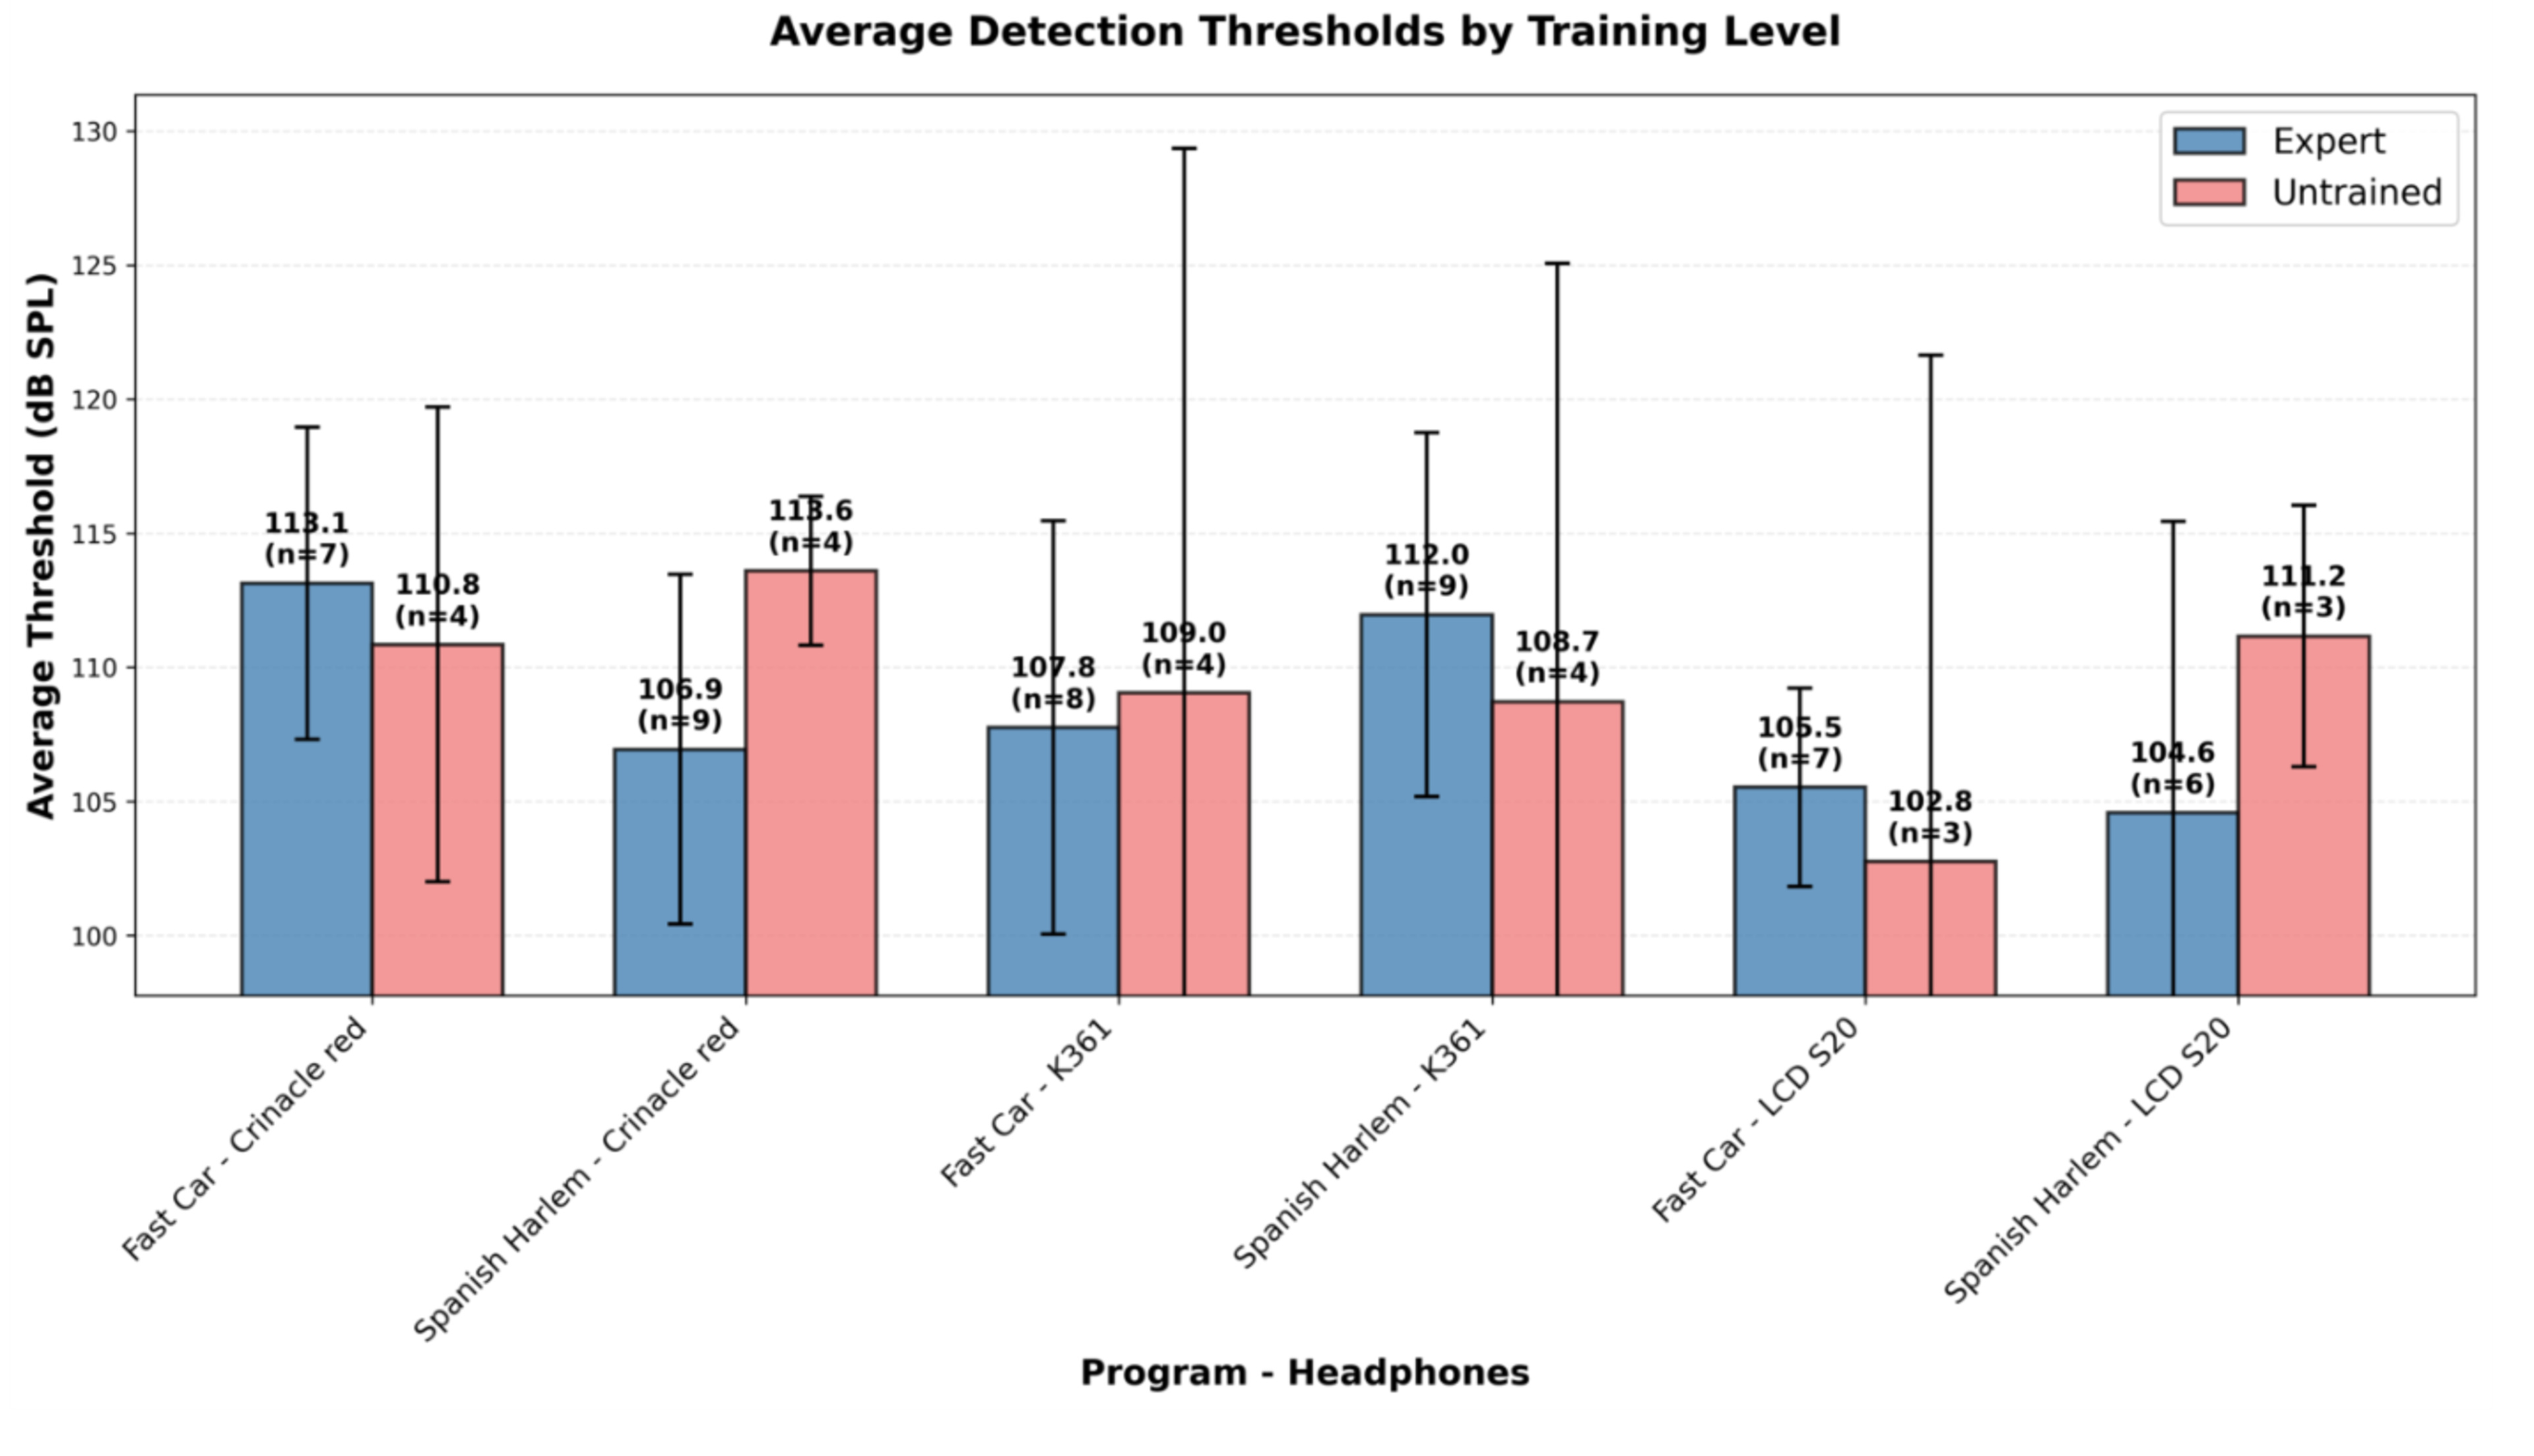
Even with our sensitive methodology, distortion was genuinely difficult to detect, suggesting how subtle these differences really are. Here is how the results were distributed. In the experiment, we had nine trained listeners and four untrained listeners. We didn't see a correlation between their thresholds and their training level.
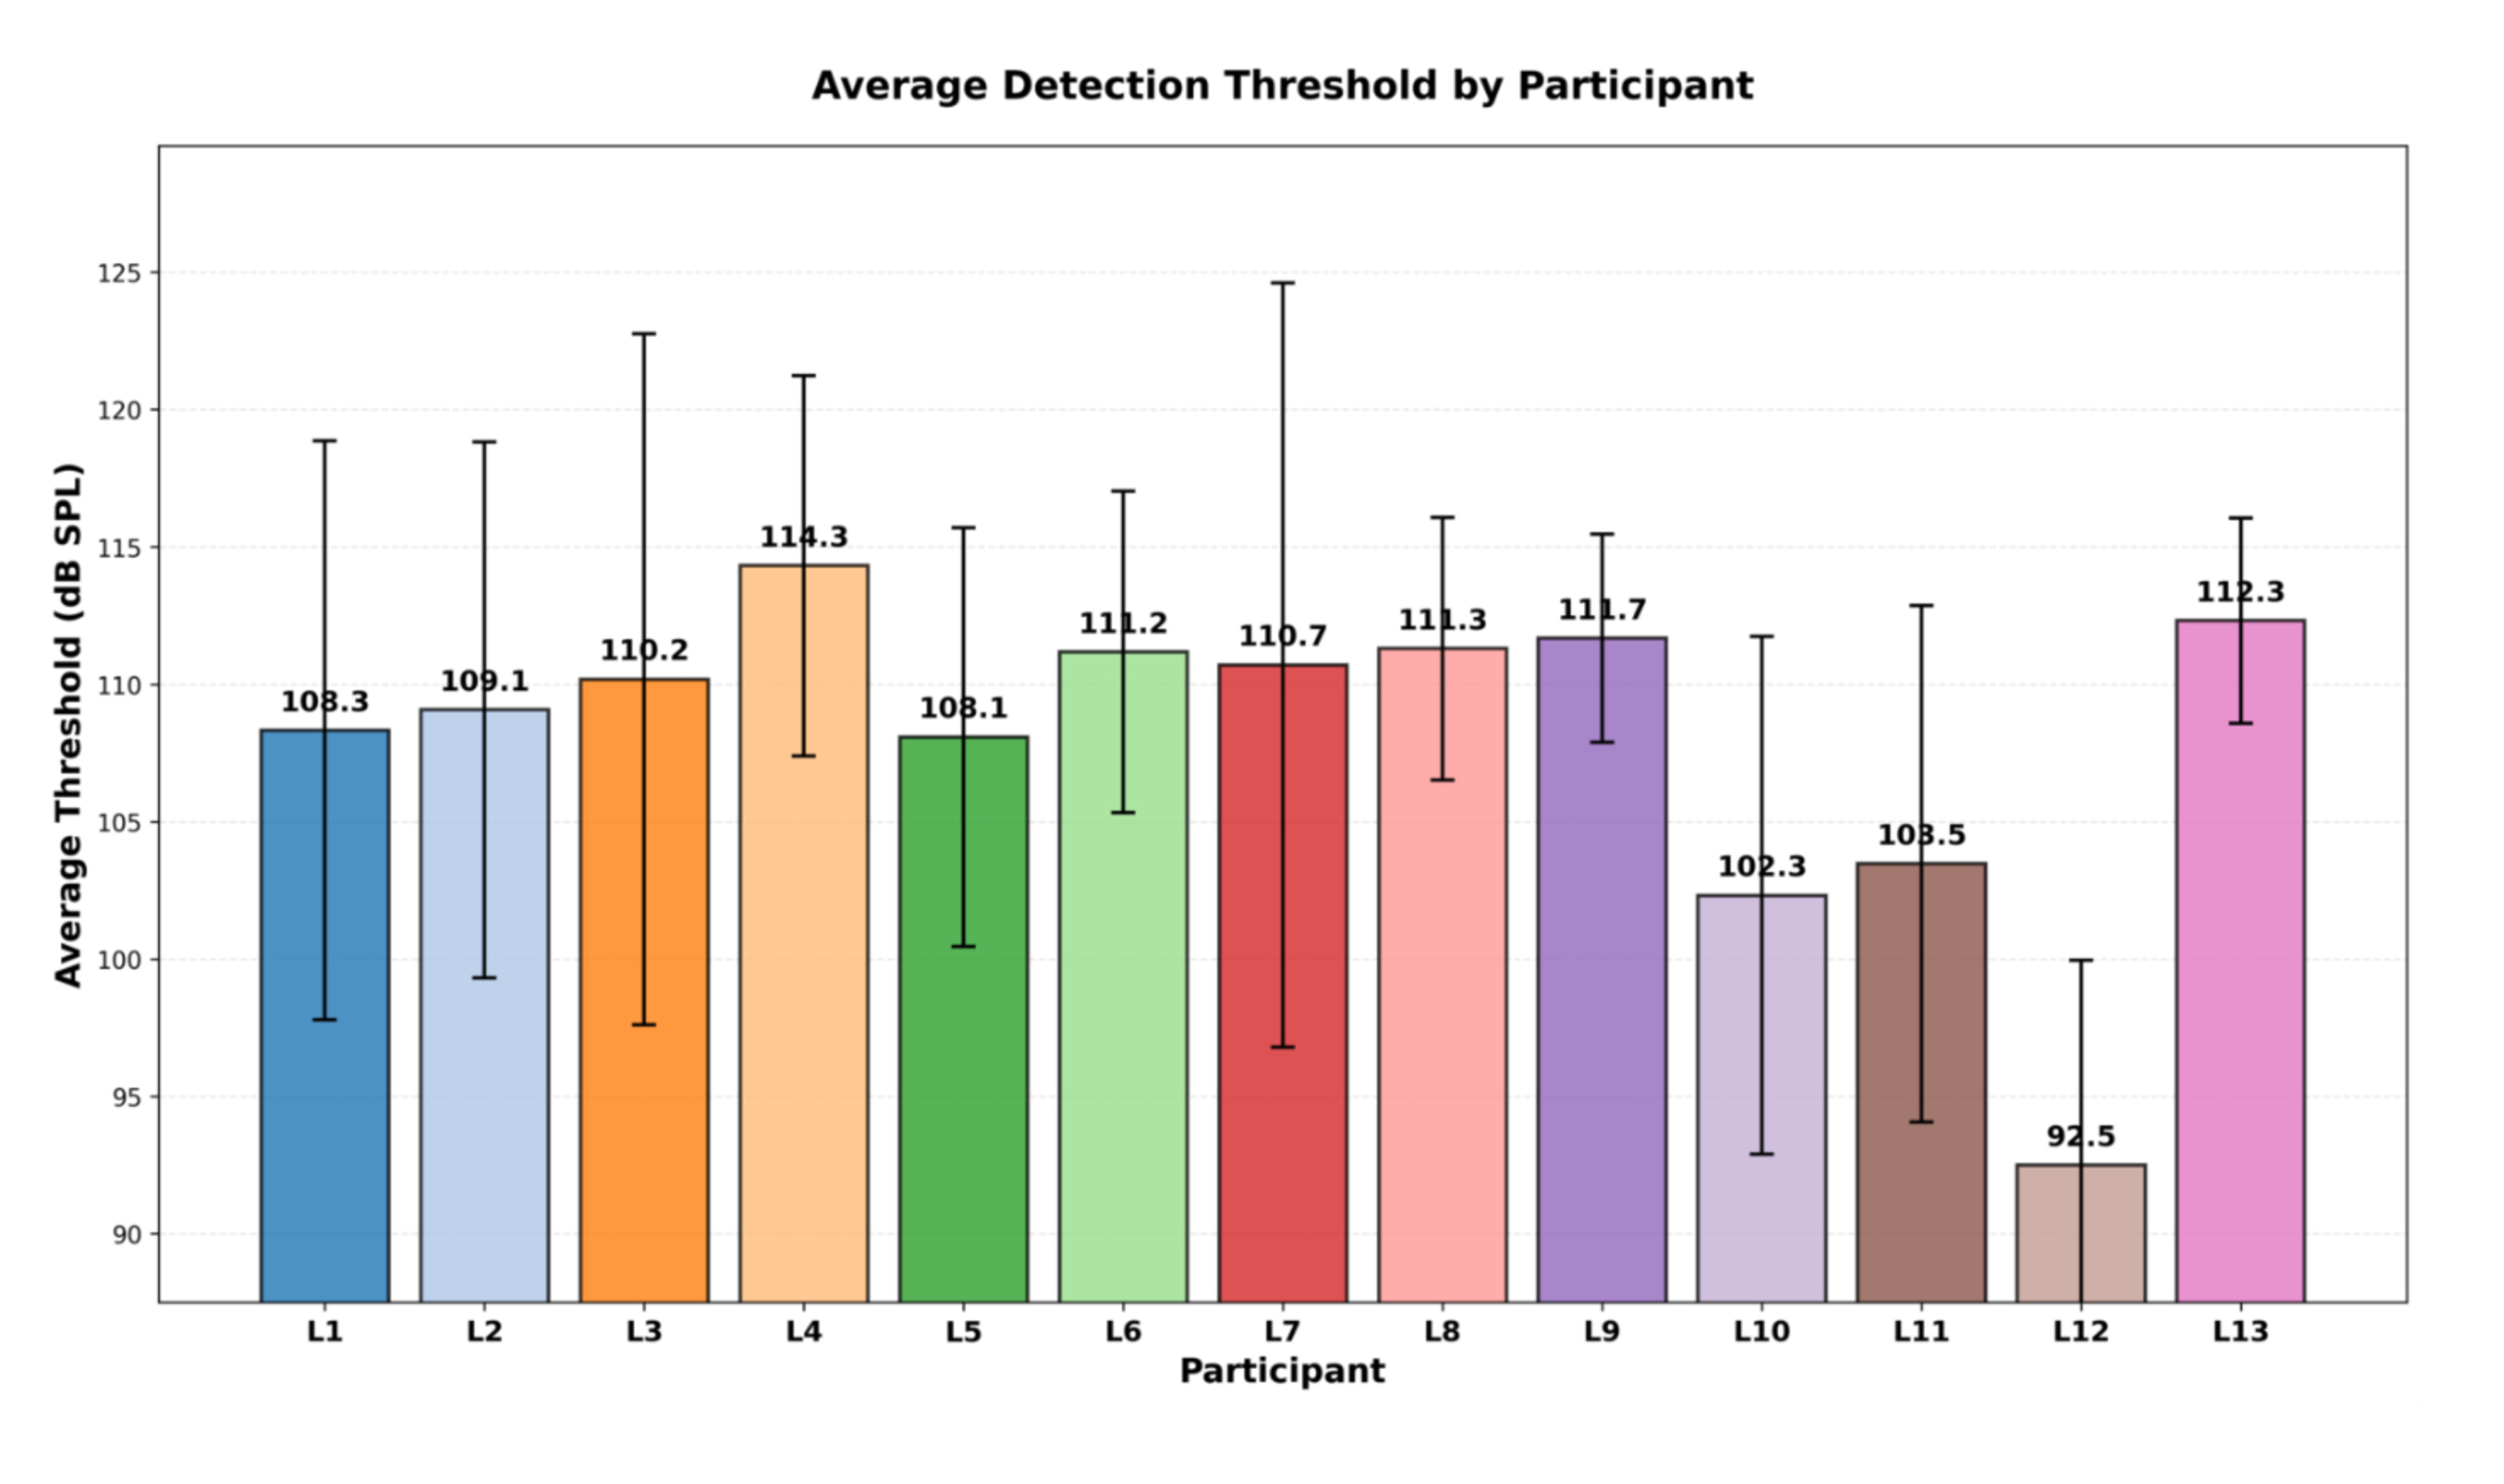
There's a lot of variability in the level at which participants started detecting distortion. As you can see in Figure 11, the twelfth listener was much more sensitive to distortion.
Experiment 2: Can People Distinguish Headphones at Normal Listening Levels?
Our ABX tests showed us that distortion becomes audible at levels that you're not likely to experience. But does that mean that any headphones sound the same once we remove the frequency response?
Method: Similarity and ABX Discrimination Tests
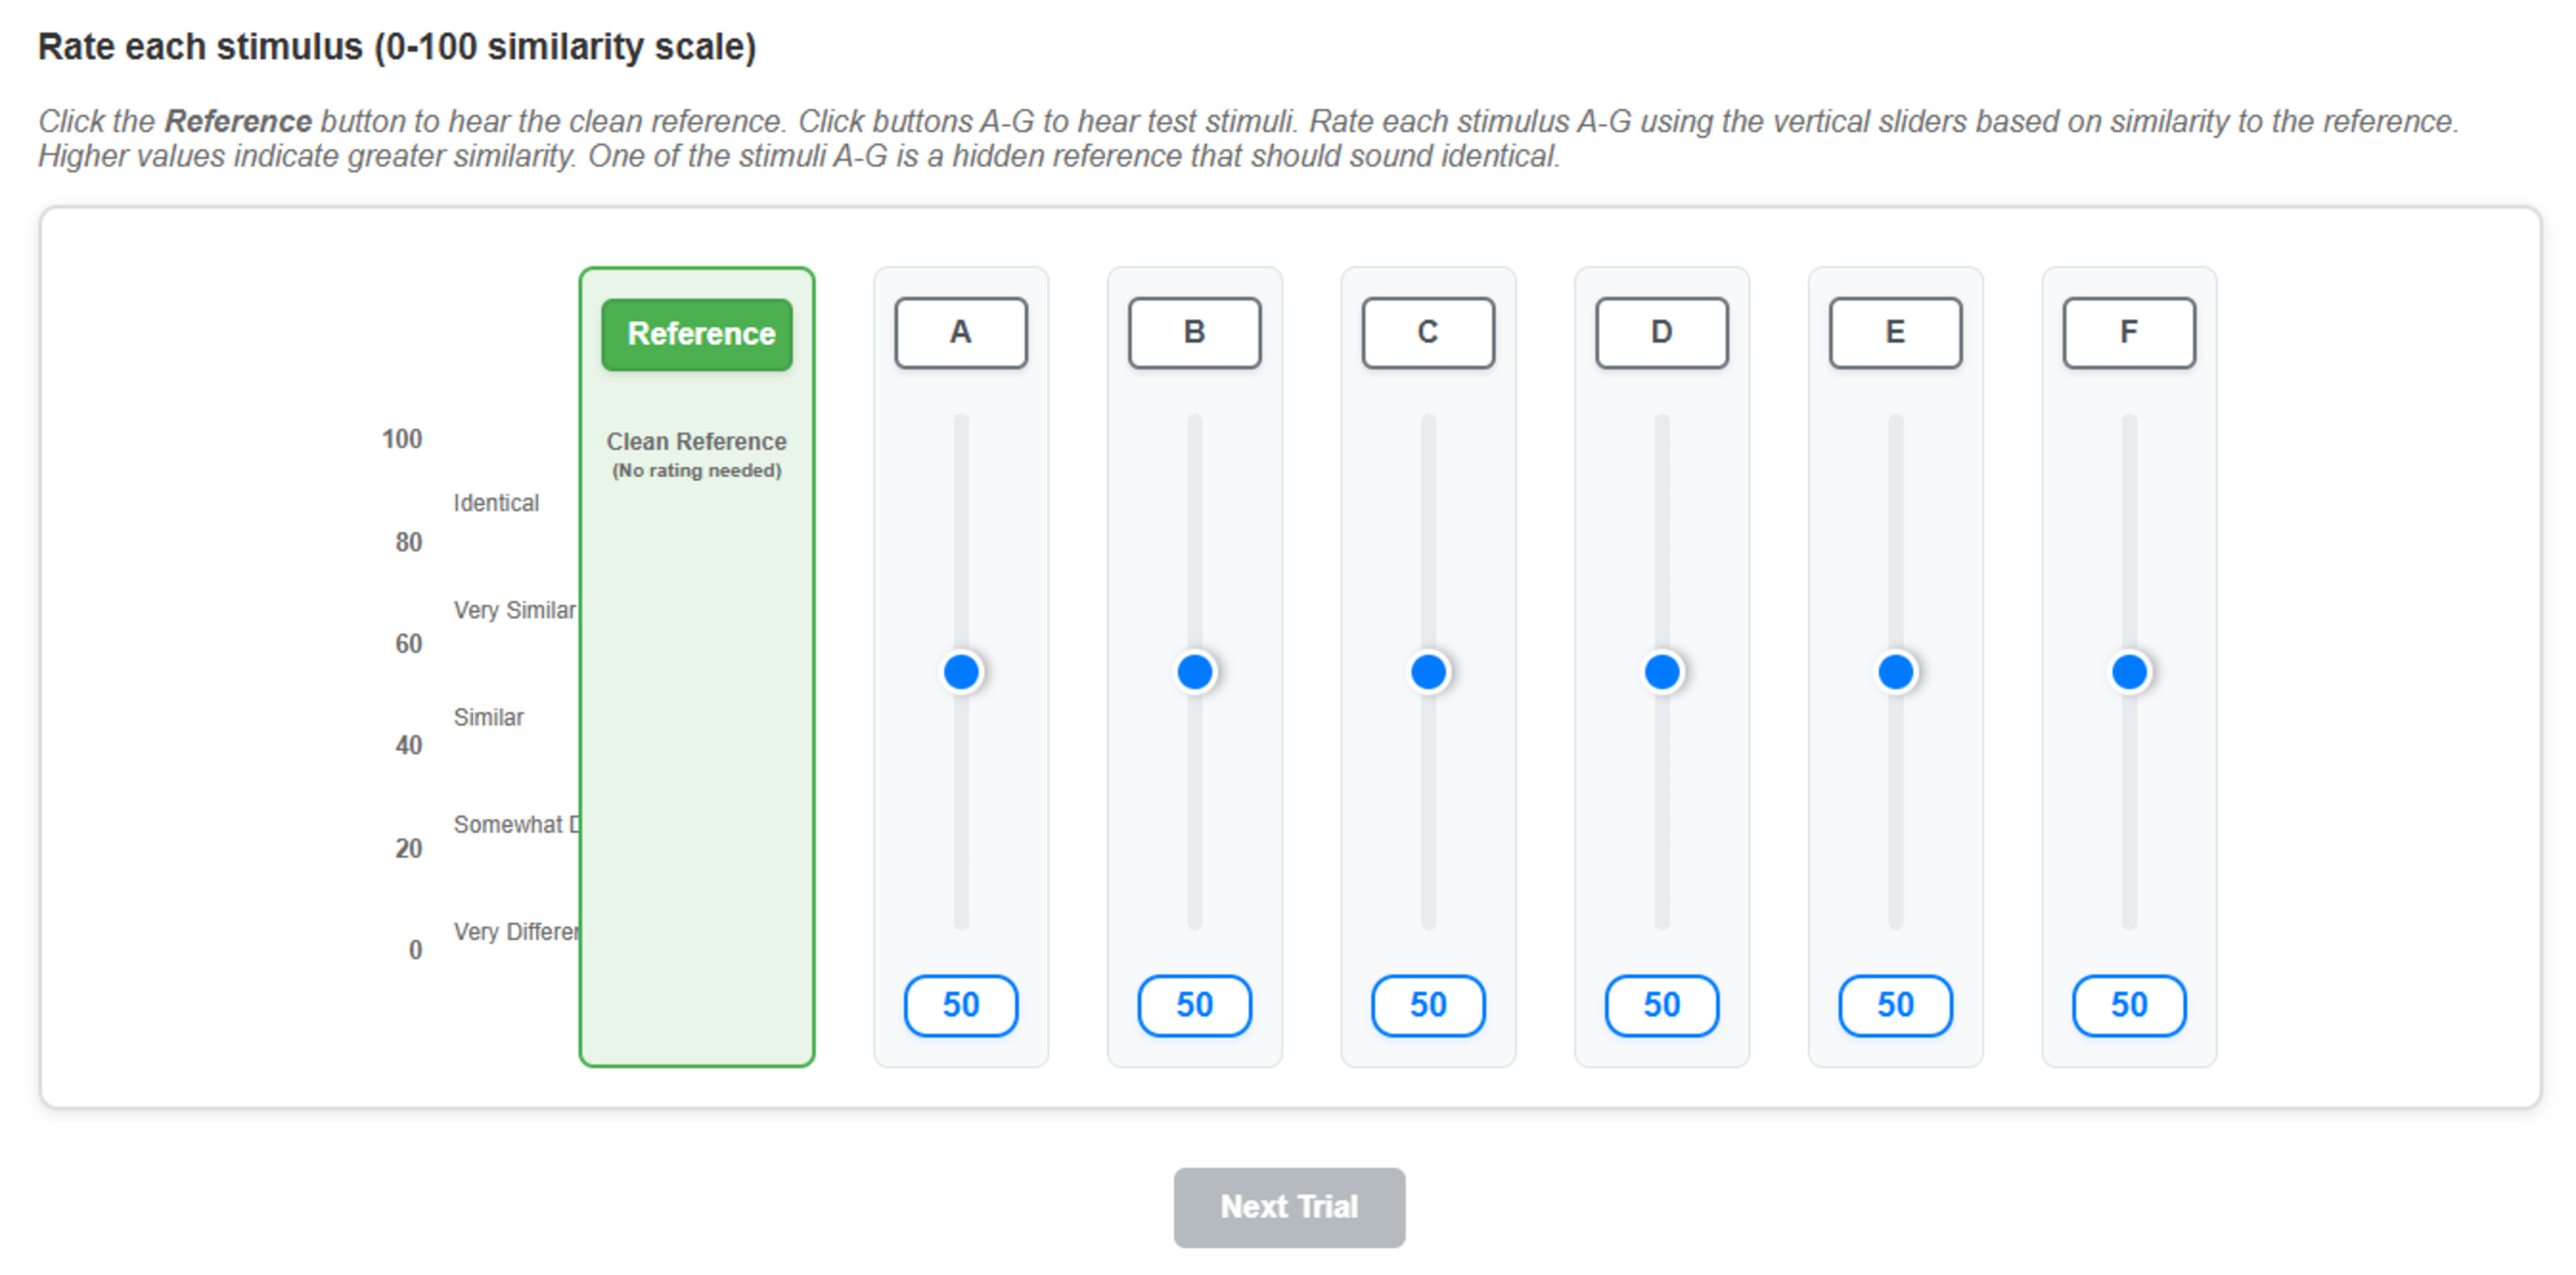
To determine whether people can distinguish distorted headphones from clean audio at normal listening levels, we conducted MUSHRA-like (Multiple Stimuli with Hidden Reference and Anchor) similarity tests. In our case. There was no low-quality anchor, as we weren't assessing preferences. We tested five headphones: the ZERO: RED, the DT 770, the HD 650, the K361, and the X6. Nine listeners participated (eight with formal distortion discrimination training), each completing five trials rating similarity to the Clean reference (original recording file) on a 0–100 scale. The Clean reference was hidden among stimuli, and listeners weren't informed which headphones each recording came from. For each trial, the files were reshuffled to prevent order effects. The calibrated listening level was again 83 dBA SPL, but in this case, we used the binaural recordings made at 94 dBA SPL. The 94 dB SPL measurement was chosen for two main reasons: 94 dB SPL is the standardized level at which our published measurements are made, so we can directly assess if a certain level of distortion is audible, and if it would be more representative to use recordings made at 83 dBA SPL, it gives significantly less signal to noise ratio to the recording, and we wanted to insure the listeners wouldn't be hearing noise as a differentiator.
Results: Subtle Differences That Are Extremely Difficult to Detect.
The similarity test results revealed substantial individual differences in listener performance, with most listeners effectively guessing rather than reliably detecting differences.
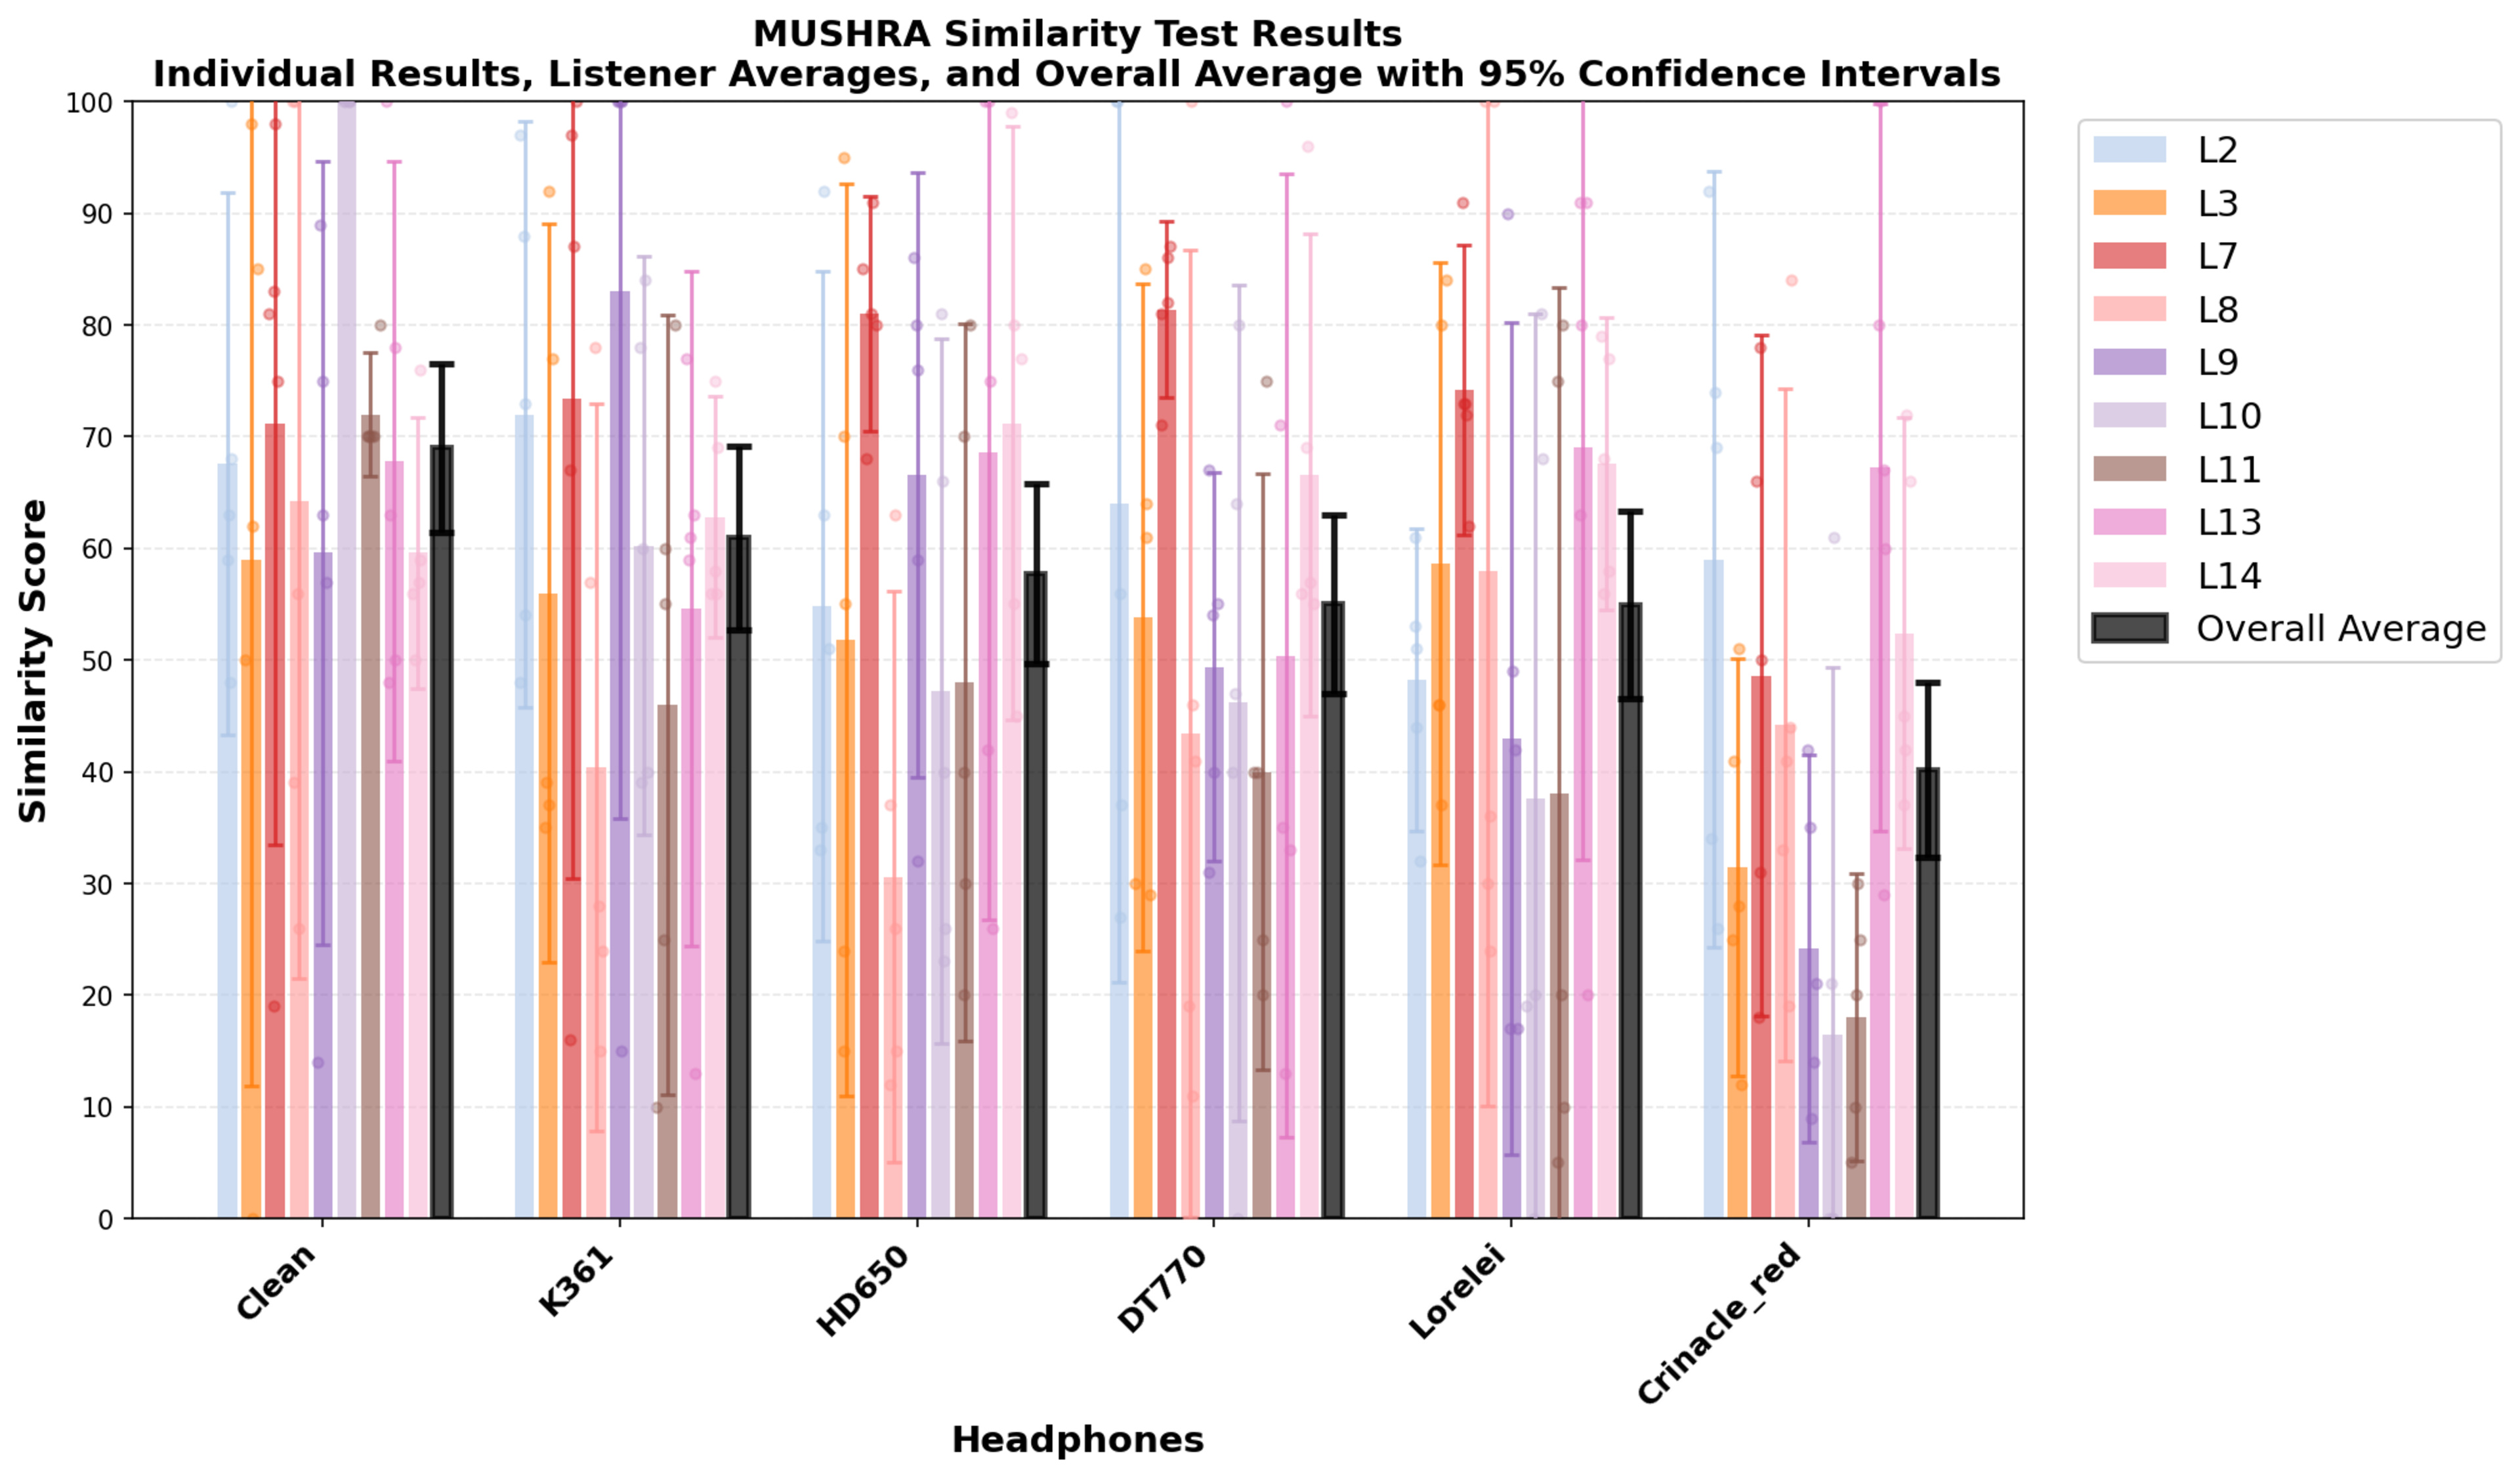
At the group level, Clean achieved the highest mean similarity score (69.0) and was rated significantly higher than four out of five test headphones (p < 0.05), validating the methodology. However, only one listener (L10) consistently rated the hidden Clean reference as 100% similar across all trials, demonstrating perfect recognition of the undistorted original. Interestingly, L10 had perfect recognition of the Clean file but also had the highest standard deviation in all other headphone ratings (34.8). They recognized the Clean reference well, but couldn't differentiate between different headphones. Five out of nine listeners (56%) didn't even rate the Clean reference as the most similar on average, mistakenly selecting binaural recordings with the frequency response removed over the original untouched clip. Among the test headphones, the ZERO: RED were rated significantly lower than the Clean reference and were the only pair of headphones that were significantly different from the other four test headphones. The high variability in ratings (mean SD: 26.3) is characteristic of guessing behavior, where listeners lack the perceptual resolution to reliably distinguish between stimuli. In summary, only one listener achieved perfect recognition of the Clean reference, and the fact that the majority failed to identify it as most similar is strong evidence that distortion is largely inaudible for most listeners at normal listening levels.
ABX Discrimination: Almost Everyone Failed
We also conducted ABX discrimination tests. For each listener, we identified their most and least similar headphones (excluding the hidden Clean reference).
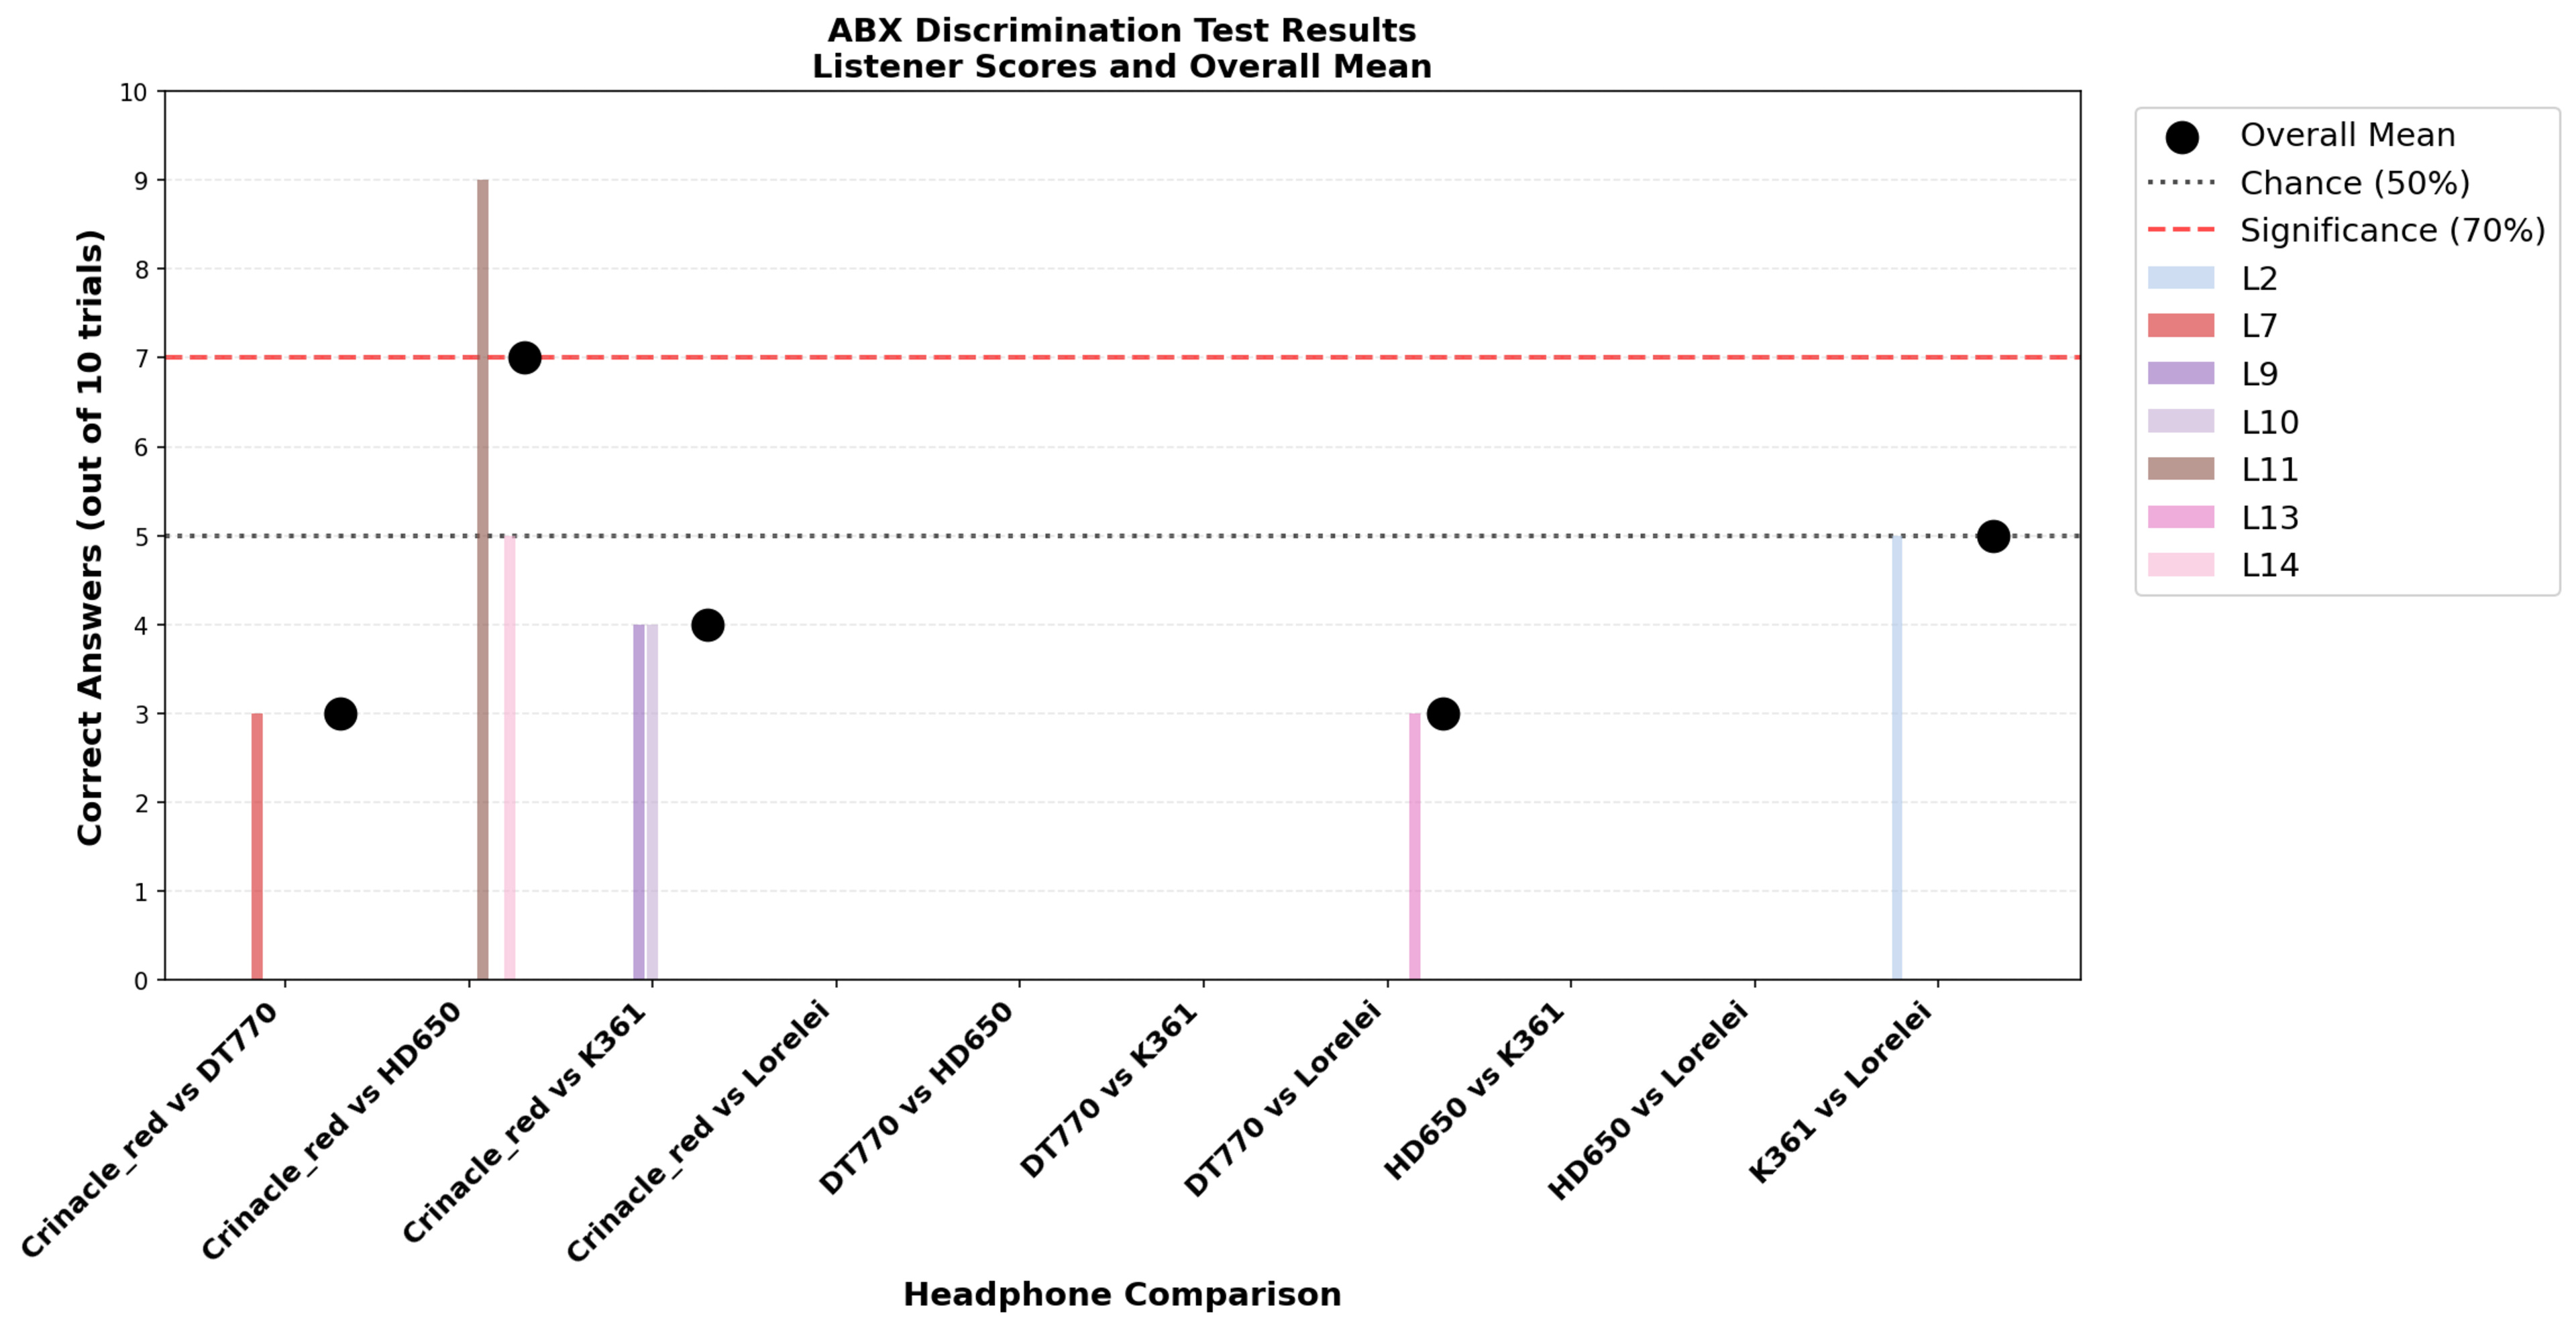
Two listeners chose not to participate after concluding that they couldn't hear meaningful differences. Seven listeners completed ABX tests (10 trials per pair), identifying whether X matches A or B.
Only one listener (L11) was able to distinguish the ZERO: RED from the HD 650, providing proof that discrimination is possible. The ZERO: RED were the only headphones that were reliably differentiated from others in the similarity test, making it the only recording we can definitively identify as having audibly different characteristics.
Both MUSHRA-style and ABX tests converge on the same conclusion: listeners couldn't reliably distinguish between headphones, as ANOVA analysis confirms that at least four out of five headphones are statistically equivalent (all pairwise p > 0.83), with no listener demonstrating reliable discrimination between them.
While ABX should theoretically be more sensitive to small impairments than MUSHRA, MUSHRA detected statistical trends (p < 0.05) in three listeners that didn't translate into reliable discrimination in ABX. This discrepancy likely reflects limitations of both methods when applied to very subtle differences: MUSHRA's five-trial design may produce false positives from weak effects, while ABX may have been affected by listening fatigue, as it was conducted after the similarity test.
Correlating Measurements with Perception
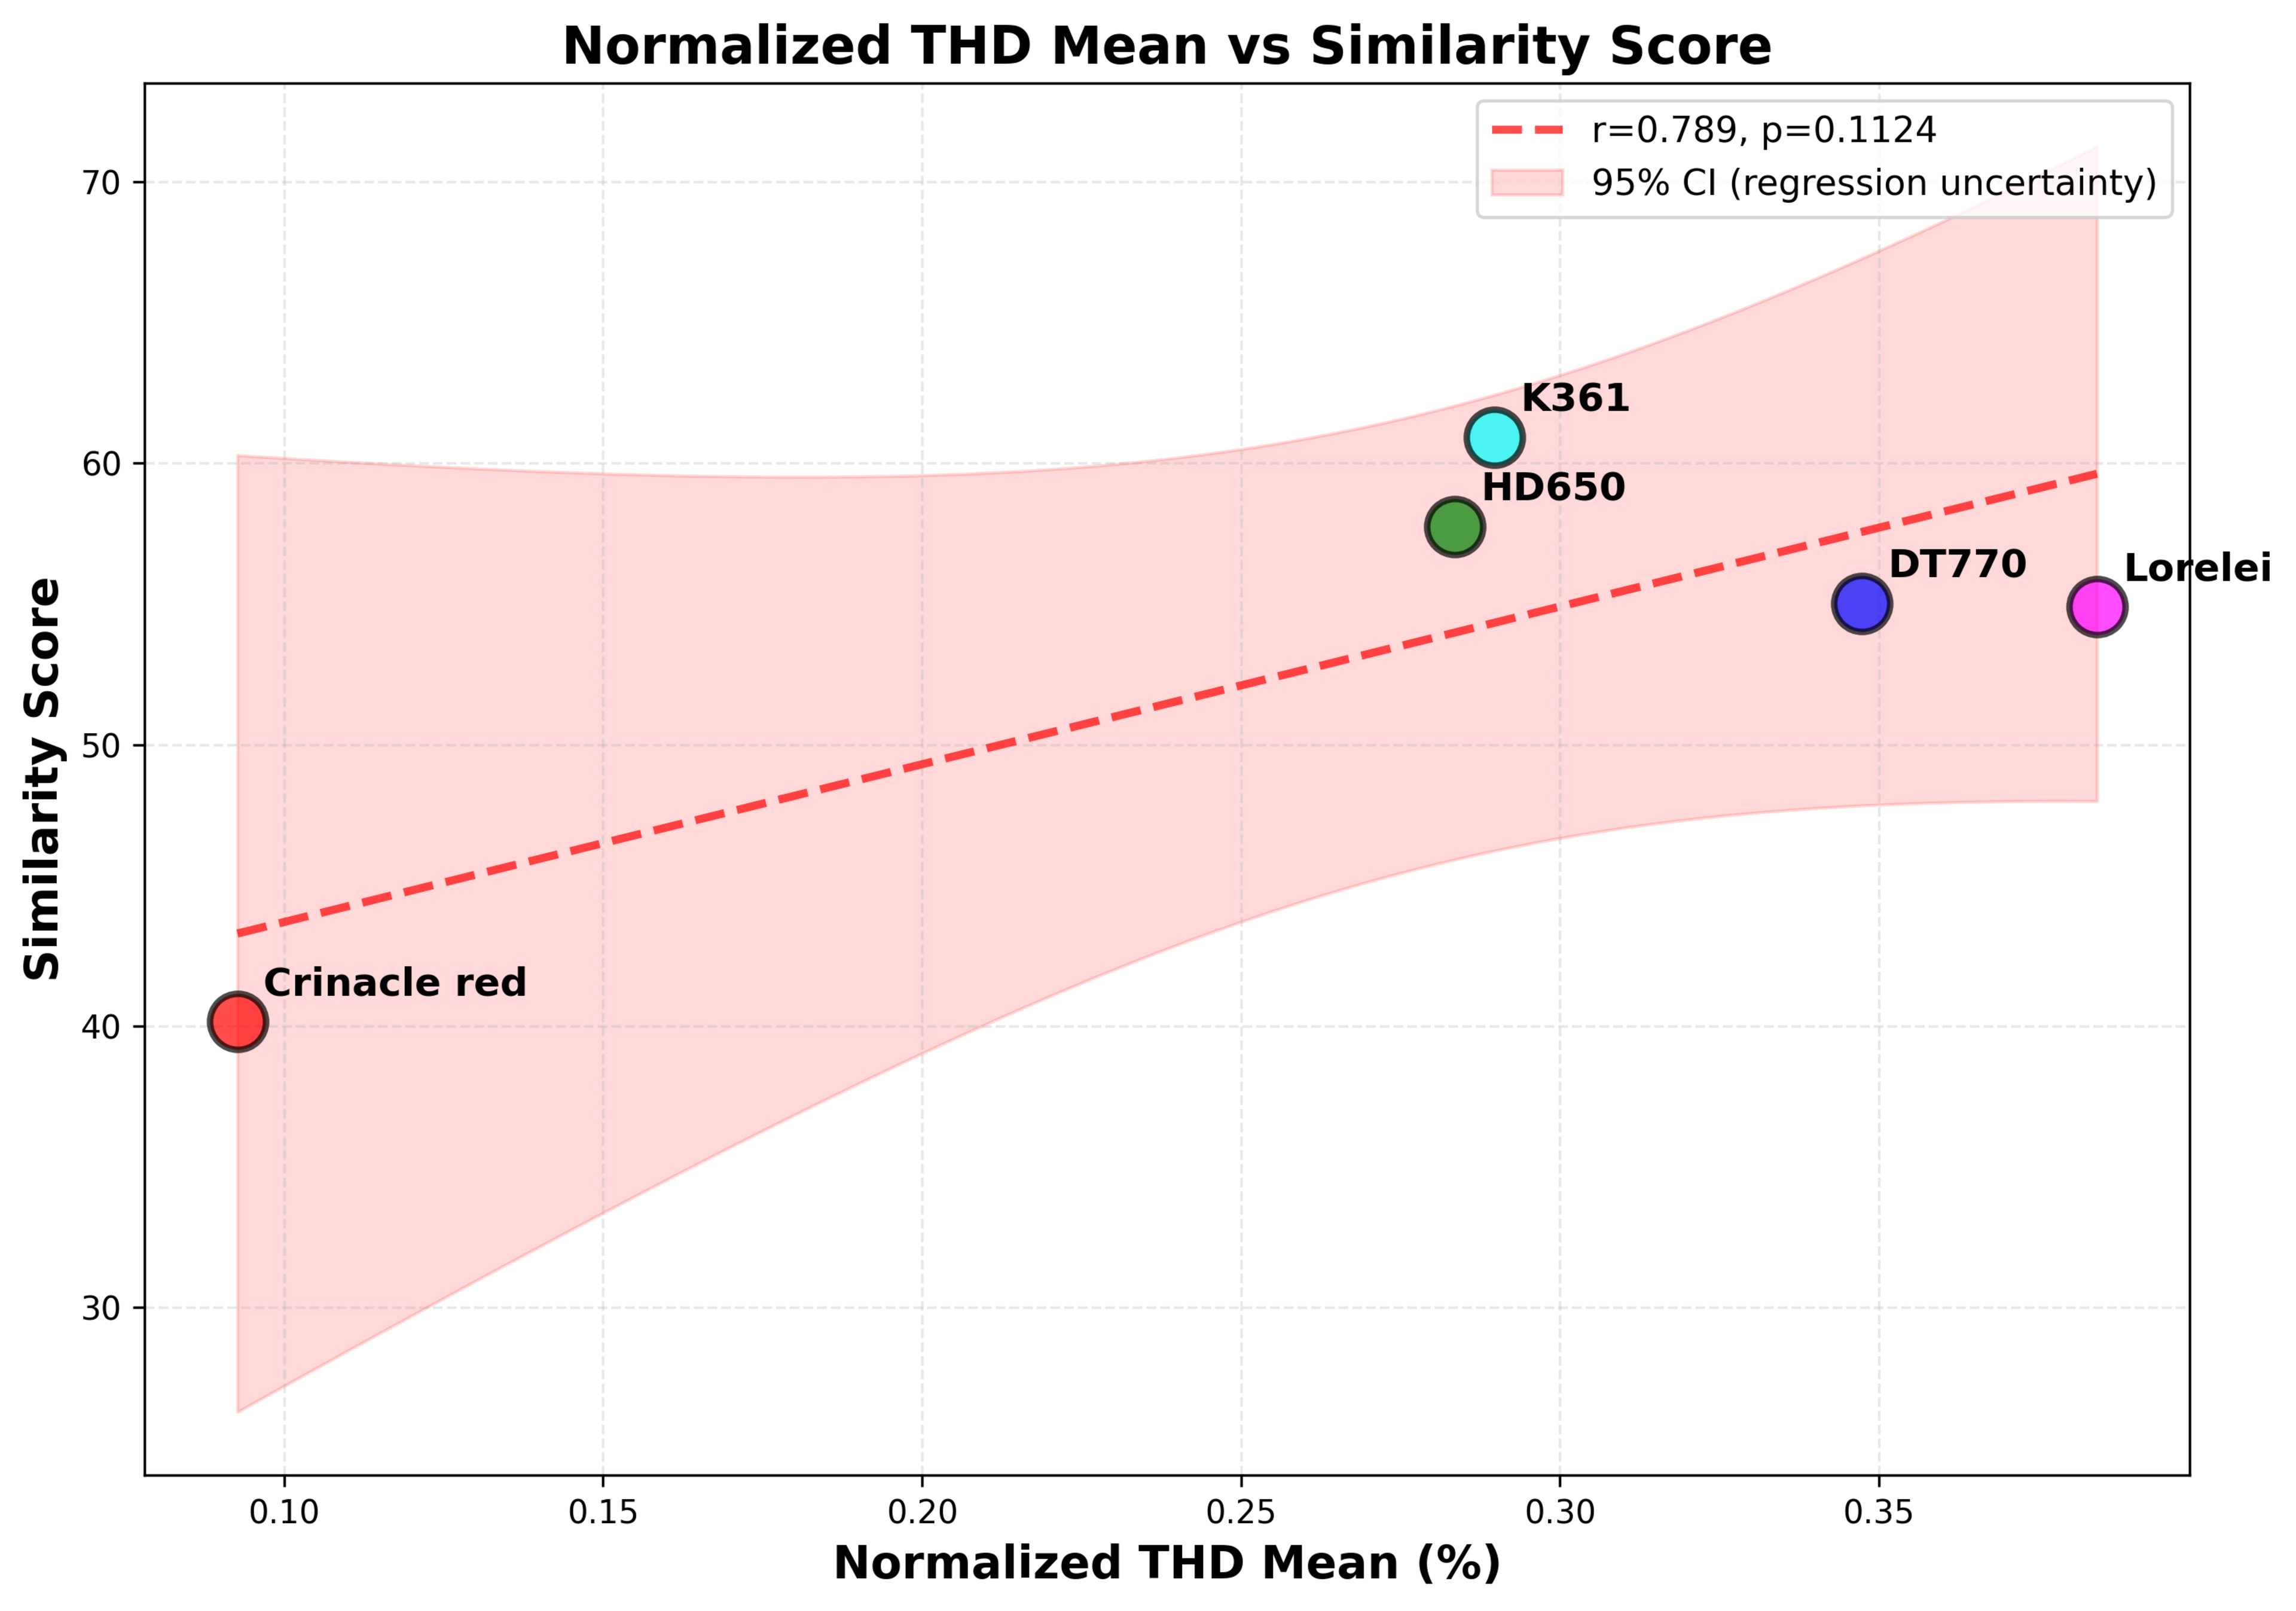
We correlated the distortion metrics that we measured at our Standard 94 dB SPL with both detection thresholds (Experiment 1) and similarity scores (Experiment 2) to identify which measurements predict perception. Here are our two main findings: THD (both normalized and un-normalized) appears to predict detection thresholds, and "Fast Car" non-coherent distortion shows a strong correlation with similarity scores. Most other traditional metrics show weak or no correlation. However, we must be cautious about the limits of what we can conclude from these correlations, as we will discuss in further detail later.
Correlation with Detection Thresholds
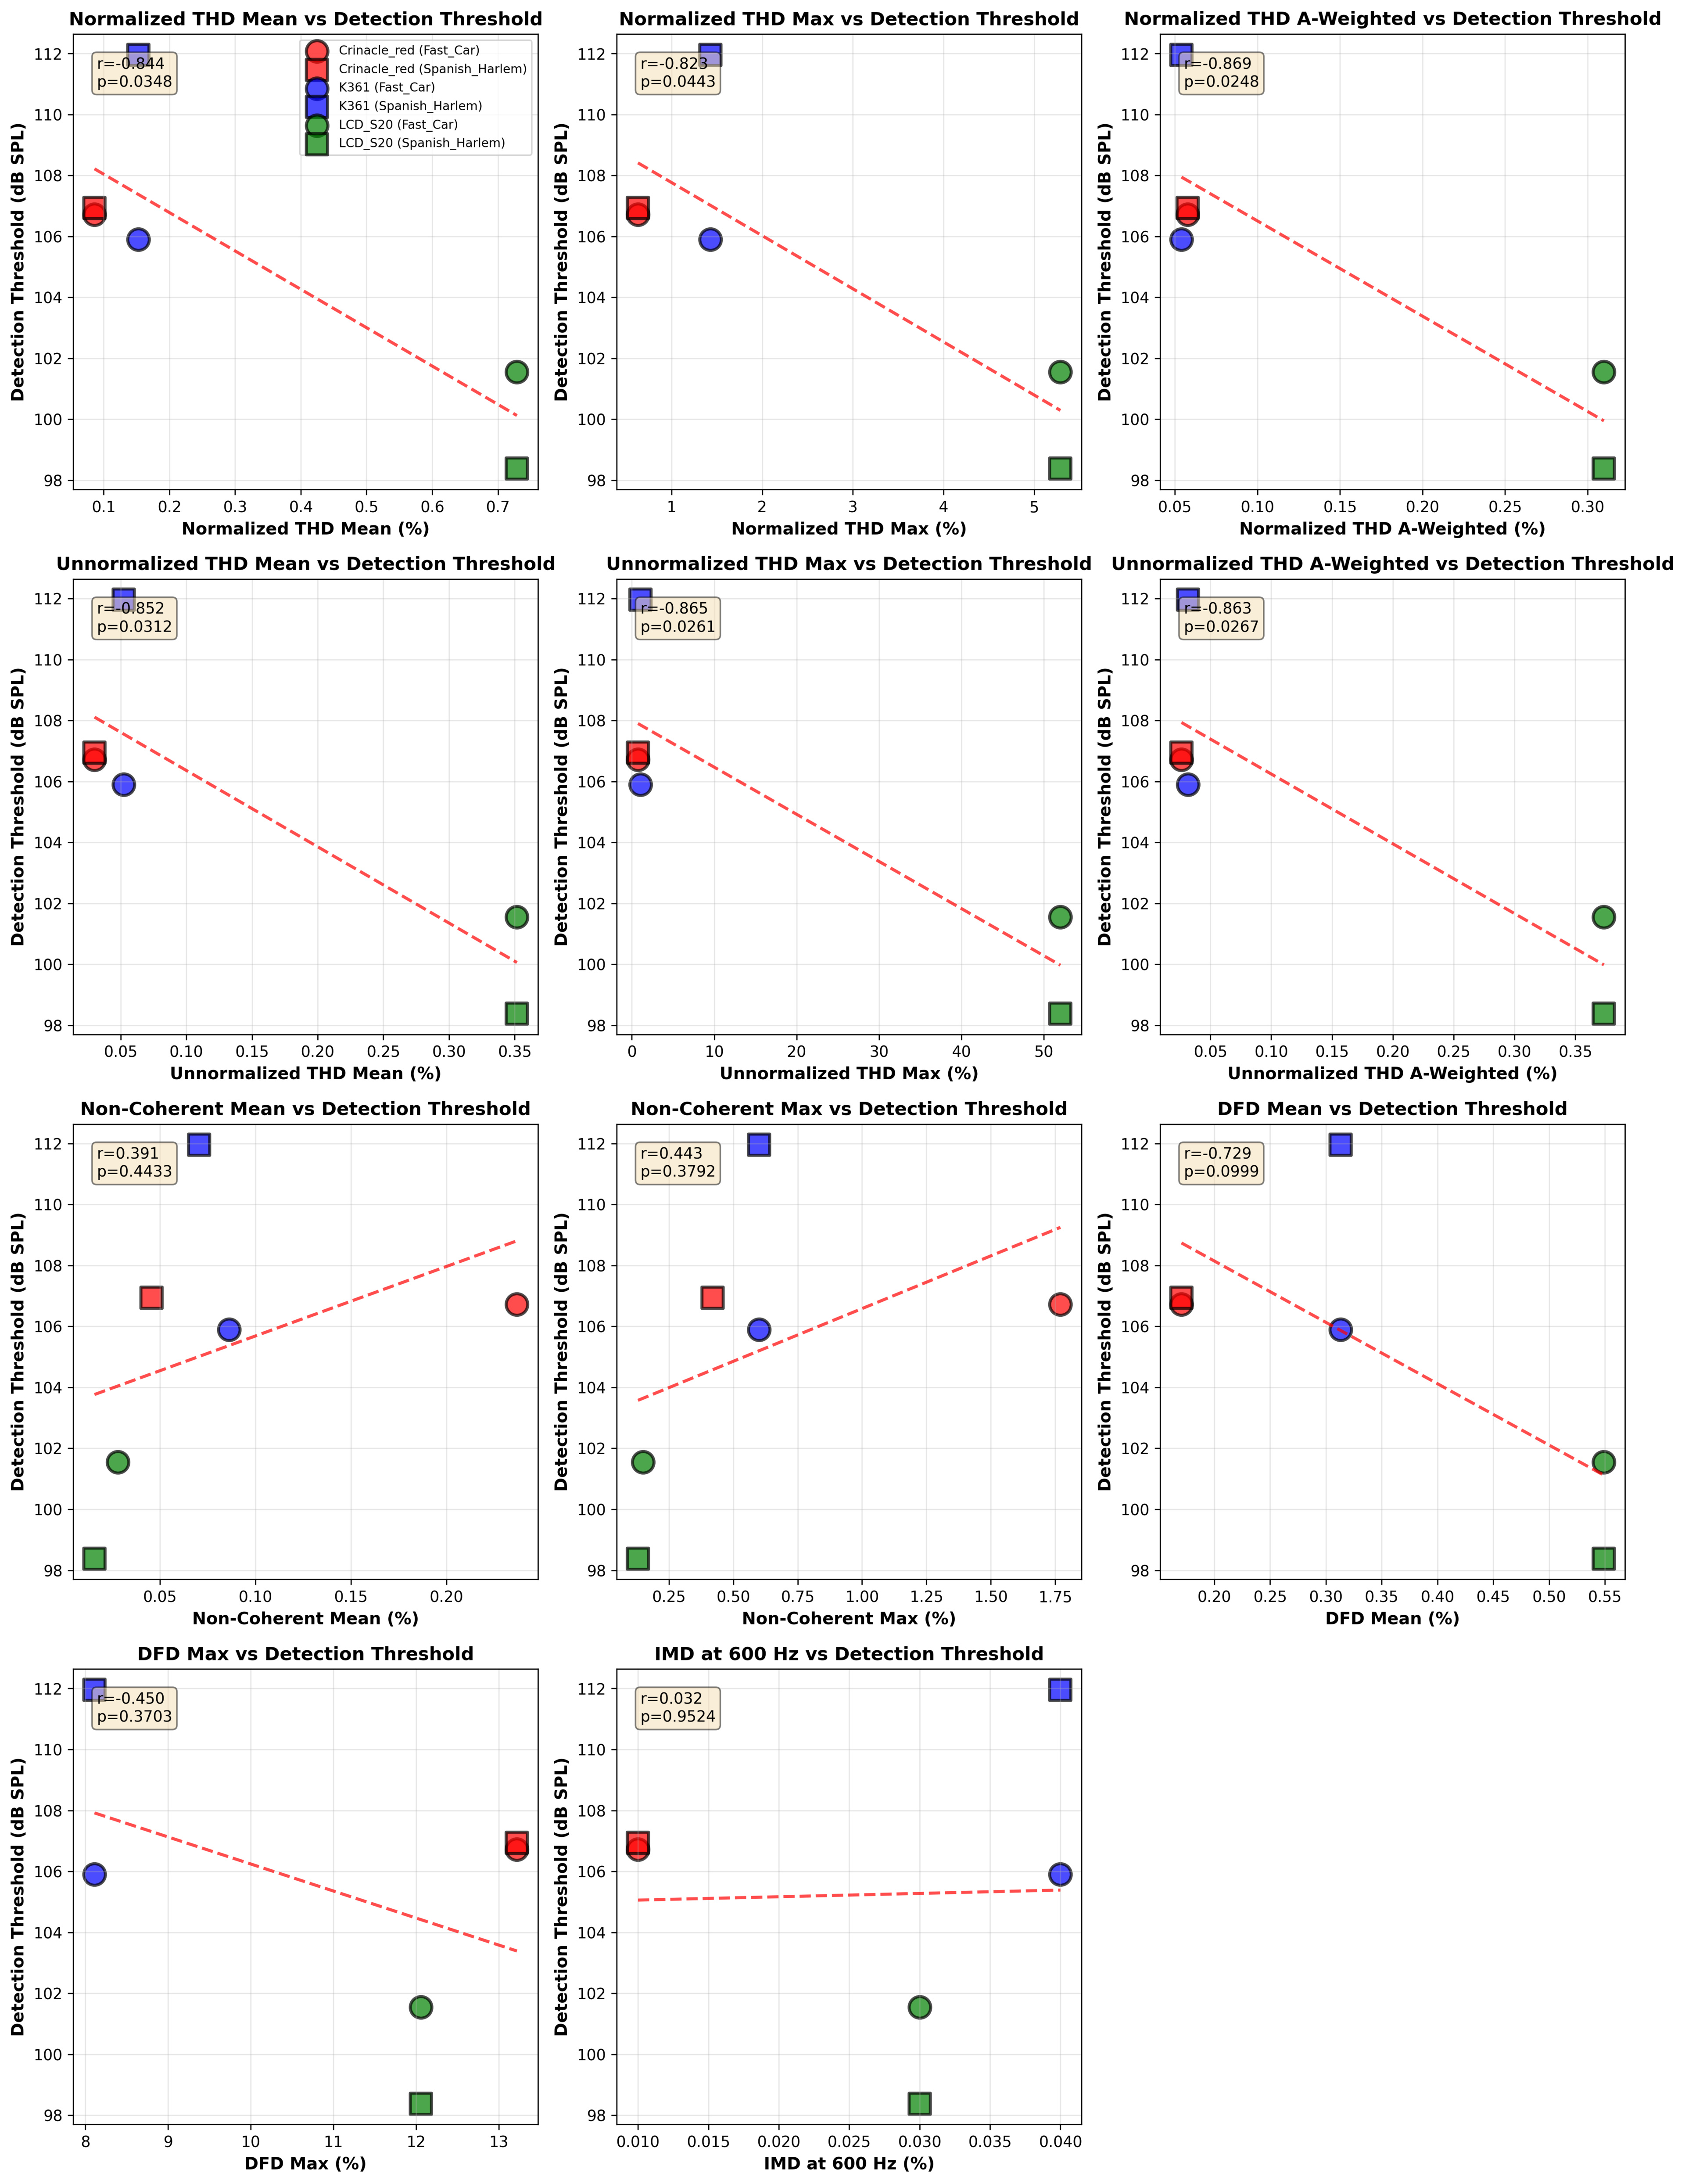
Figure 15 shows scatter plots demonstrating moderately strong to strong correlations between normalized THD and detection thresholds (r ≈ 0.85, p ≈ 0.03), meaning higher normalized THD leads to lower detection thresholds. The correlation was similar to regular (non-normalized) THD. Non-coherent distortion shows weak correlation with thresholds. It's important to note that threshold correlations are based on only three headphones, which limits the statistical power and generalizability of these findings.
THD: No Significant Correlation
IMD: No Significant Correlation
Non-Coherent Distortion: Strong Correlation with Musical Stimuli
Predictive Measurements, Inaudible Differences
So THD shows moderately strong to strong correlations with detection thresholds, but what does that mean? In short, you don't need to push headphones as hard to detect distortion when THD is higher. That said, these thresholds occurred at 98–112 dBA SPL, which is well above normal listening levels. So while THD can predict when distortion becomes audible, it's not something you need to worry about at normal volumes.
For similarity ratings at normal listening levels, traditional metrics (THD and IMD) show no significant correlations. Non-coherent distortion shows solid correlations, but it captures artifacts that may include recording and environment-induced nonlinearities, not just intrinsic headphone distortion. However, the correlations we see are with the average similarity ratings, which are based on very dispersed individual results. As we showed, four of these headphones are statistically equal in similarity when we account for the Standard Deviation, meaning that correlating their average score with a measured metric should be taken with a grain of salt.
The bottom line? Within the scope of our study, none of the captured non-linearities matter for practical listening.
LCD-S20: Noise as a Potential Confounding Factor
The LCD-S20 showed lower thresholds (104–106 dBA SPL on average) than other headphones, and several threshold tests failed to reach the required six reversals, including four perfect ABX tests (100% accuracy at 85 dBA SPL) that were excluded due to zero reversals. The most likely explanation is that the LCD-S20's frequency response overlay in Figure 20 shows greatly reduced bass compared to all other headphones and even our own published review, suggesting there may have been a seal issue during the recording that we could've missed, necessitating a higher-than-normal gain correction in the bass region.
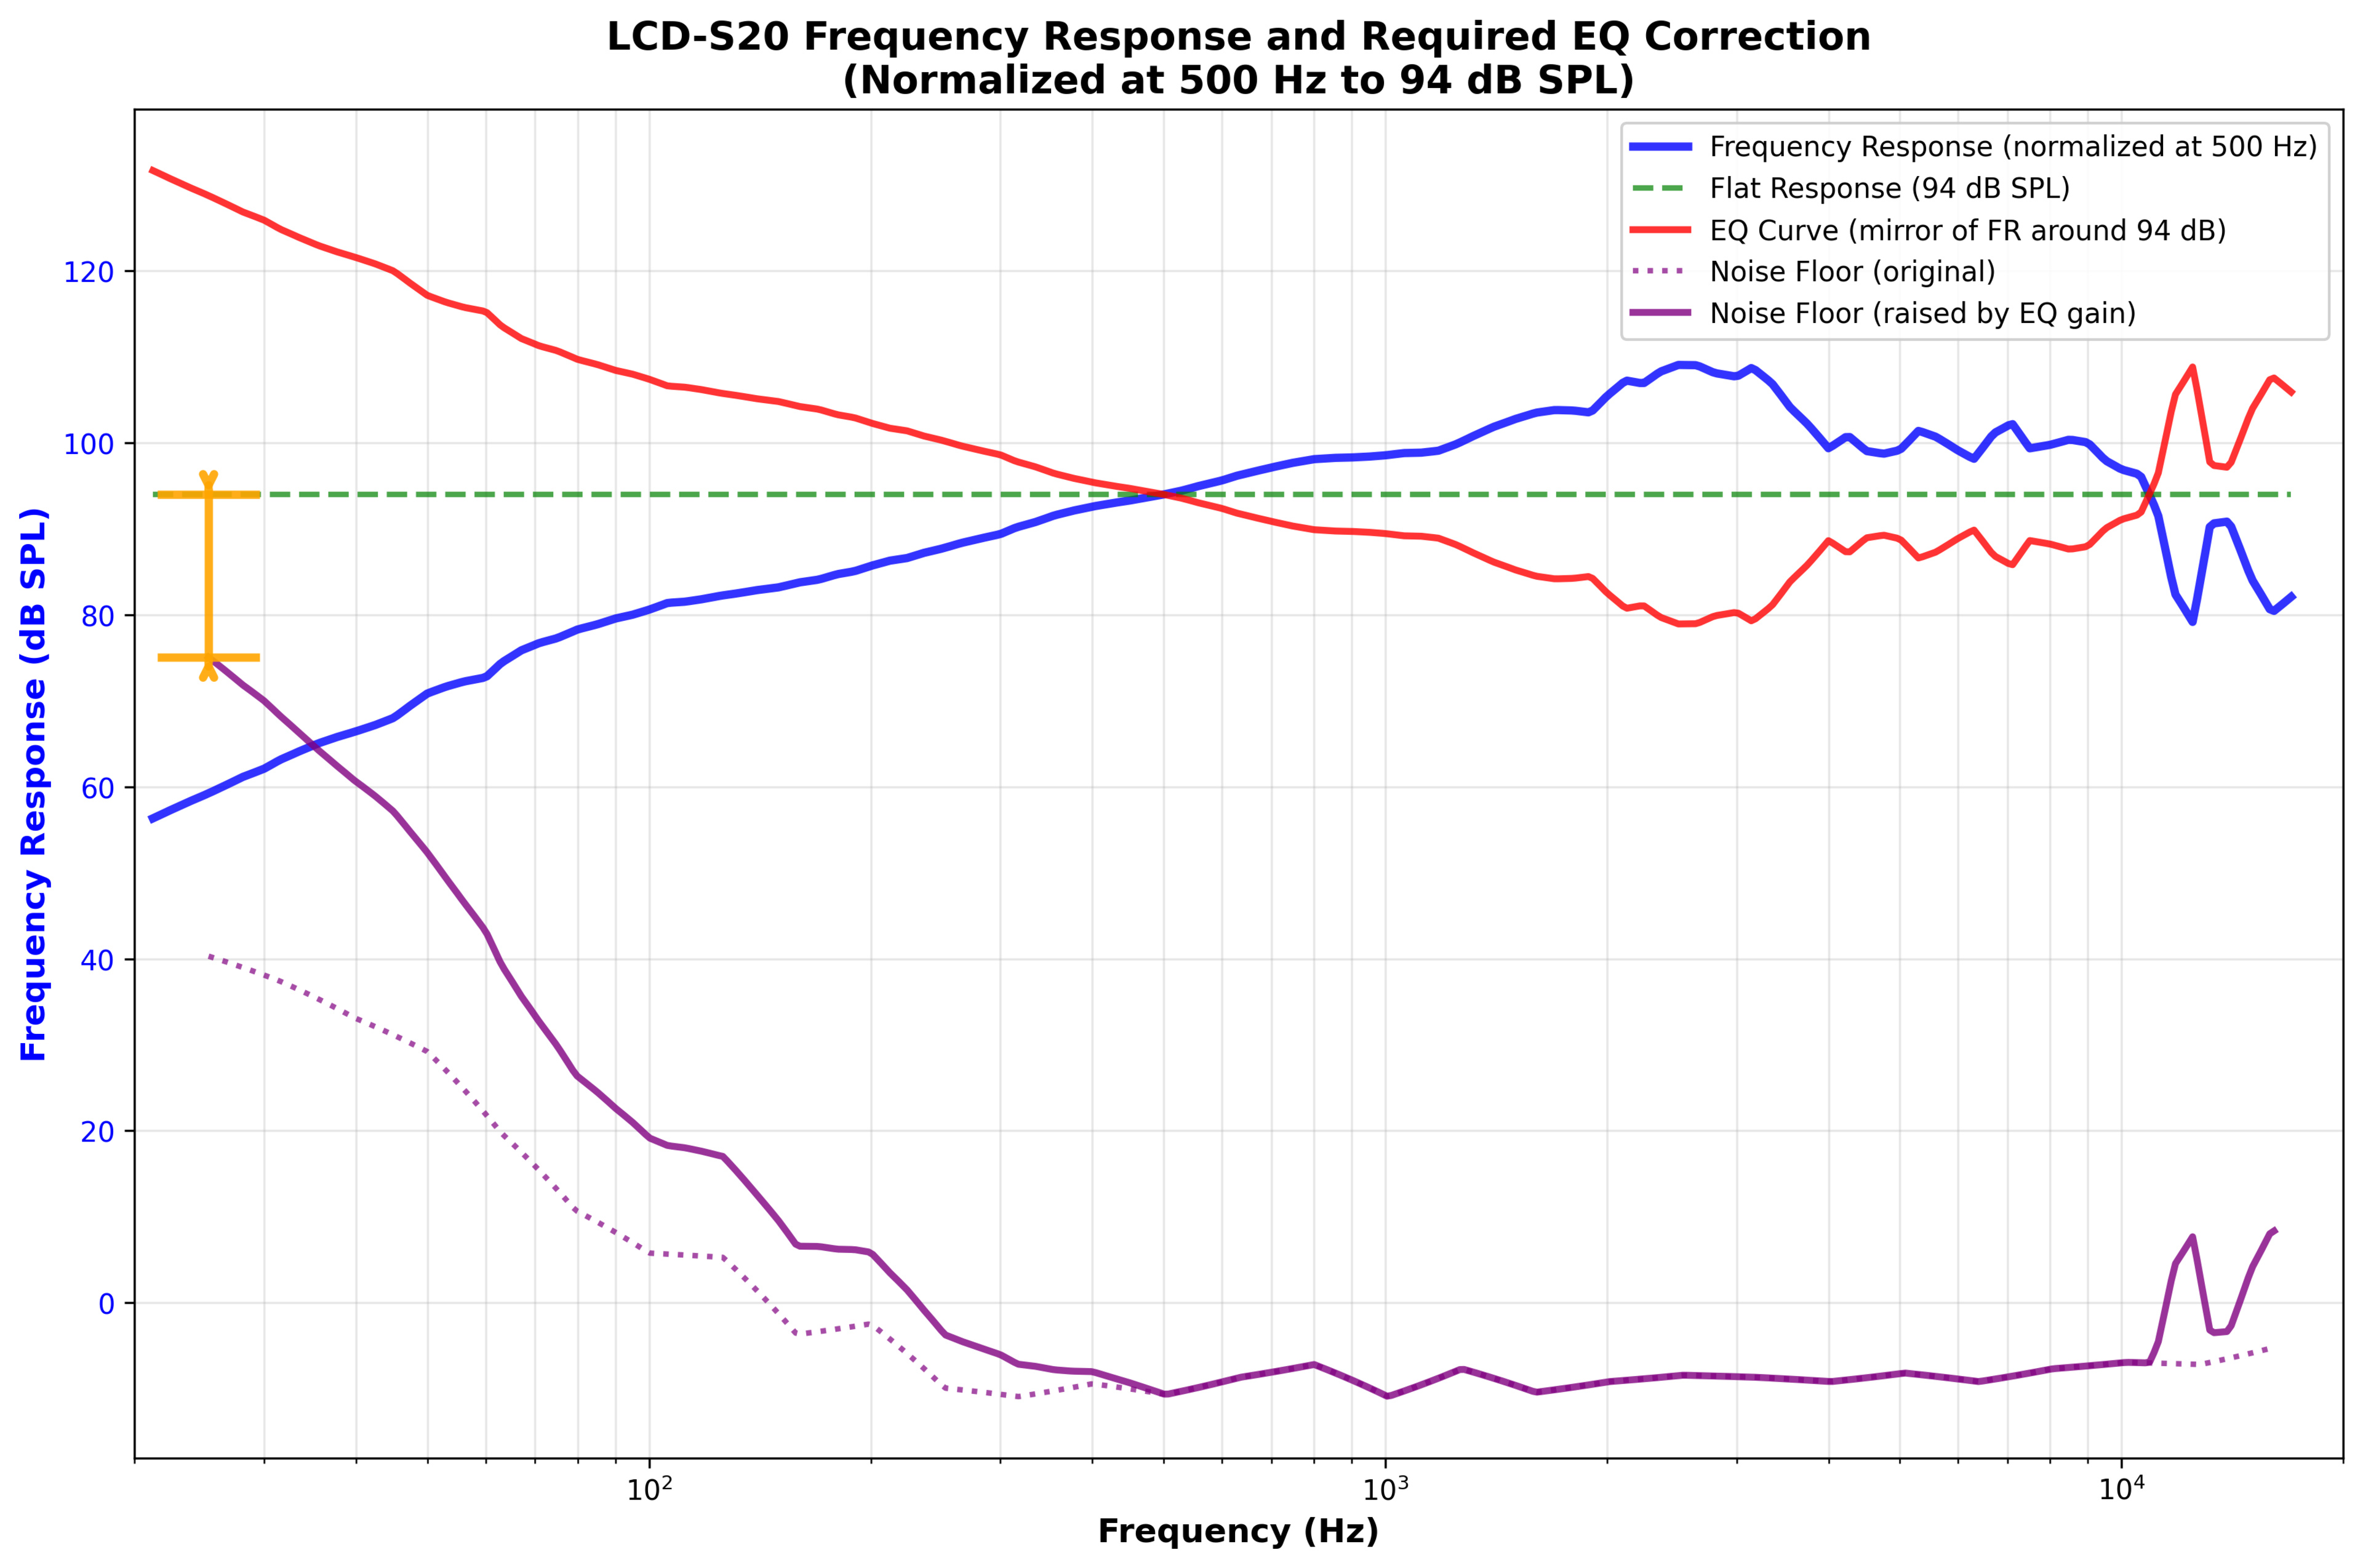
Perfect detection at the lowest SPL levels (where amplification is highest) suggests these listeners may have detected noise-related artifacts rather than headphone distortion, especially since the LCD-S20's measured distortion isn't dramatically higher in traditional metrics. The threshold we measured may have been artificially low because of these factors, but the LCD-S20's thresholds remain well above normal listening levels.
Given these concerns, we chose not to use LCD-S20 recordings in Experiment 2. That said, if we had been able to avoid these signal-to-noise ratio (SNR) concerns, it could only have pushed the threshold higher, not lower.
The ZERO: RED Case: An Outlier
The ZERO: RED received the lowest similarity score (40.2) despite having THD and IMD measurements among the lowest of all of the tested headphones. This apparent contradiction points to non-coherent distortion as the driver of perception. However, the ZERO: RED's non-coherent distortion (mean) measured with "Fast Car" is clearly an outlier at 0.24% compared to 0.03–0.09% for other headphones in Figure 21 (detection threshold correlation plot). Yet when measured with "Spanish Harlem" at the same SPL (~94 dB at 500Hz), the ZERO: RED show only 0.05% non-coherent distortion: a difference of approximately 14 dB.
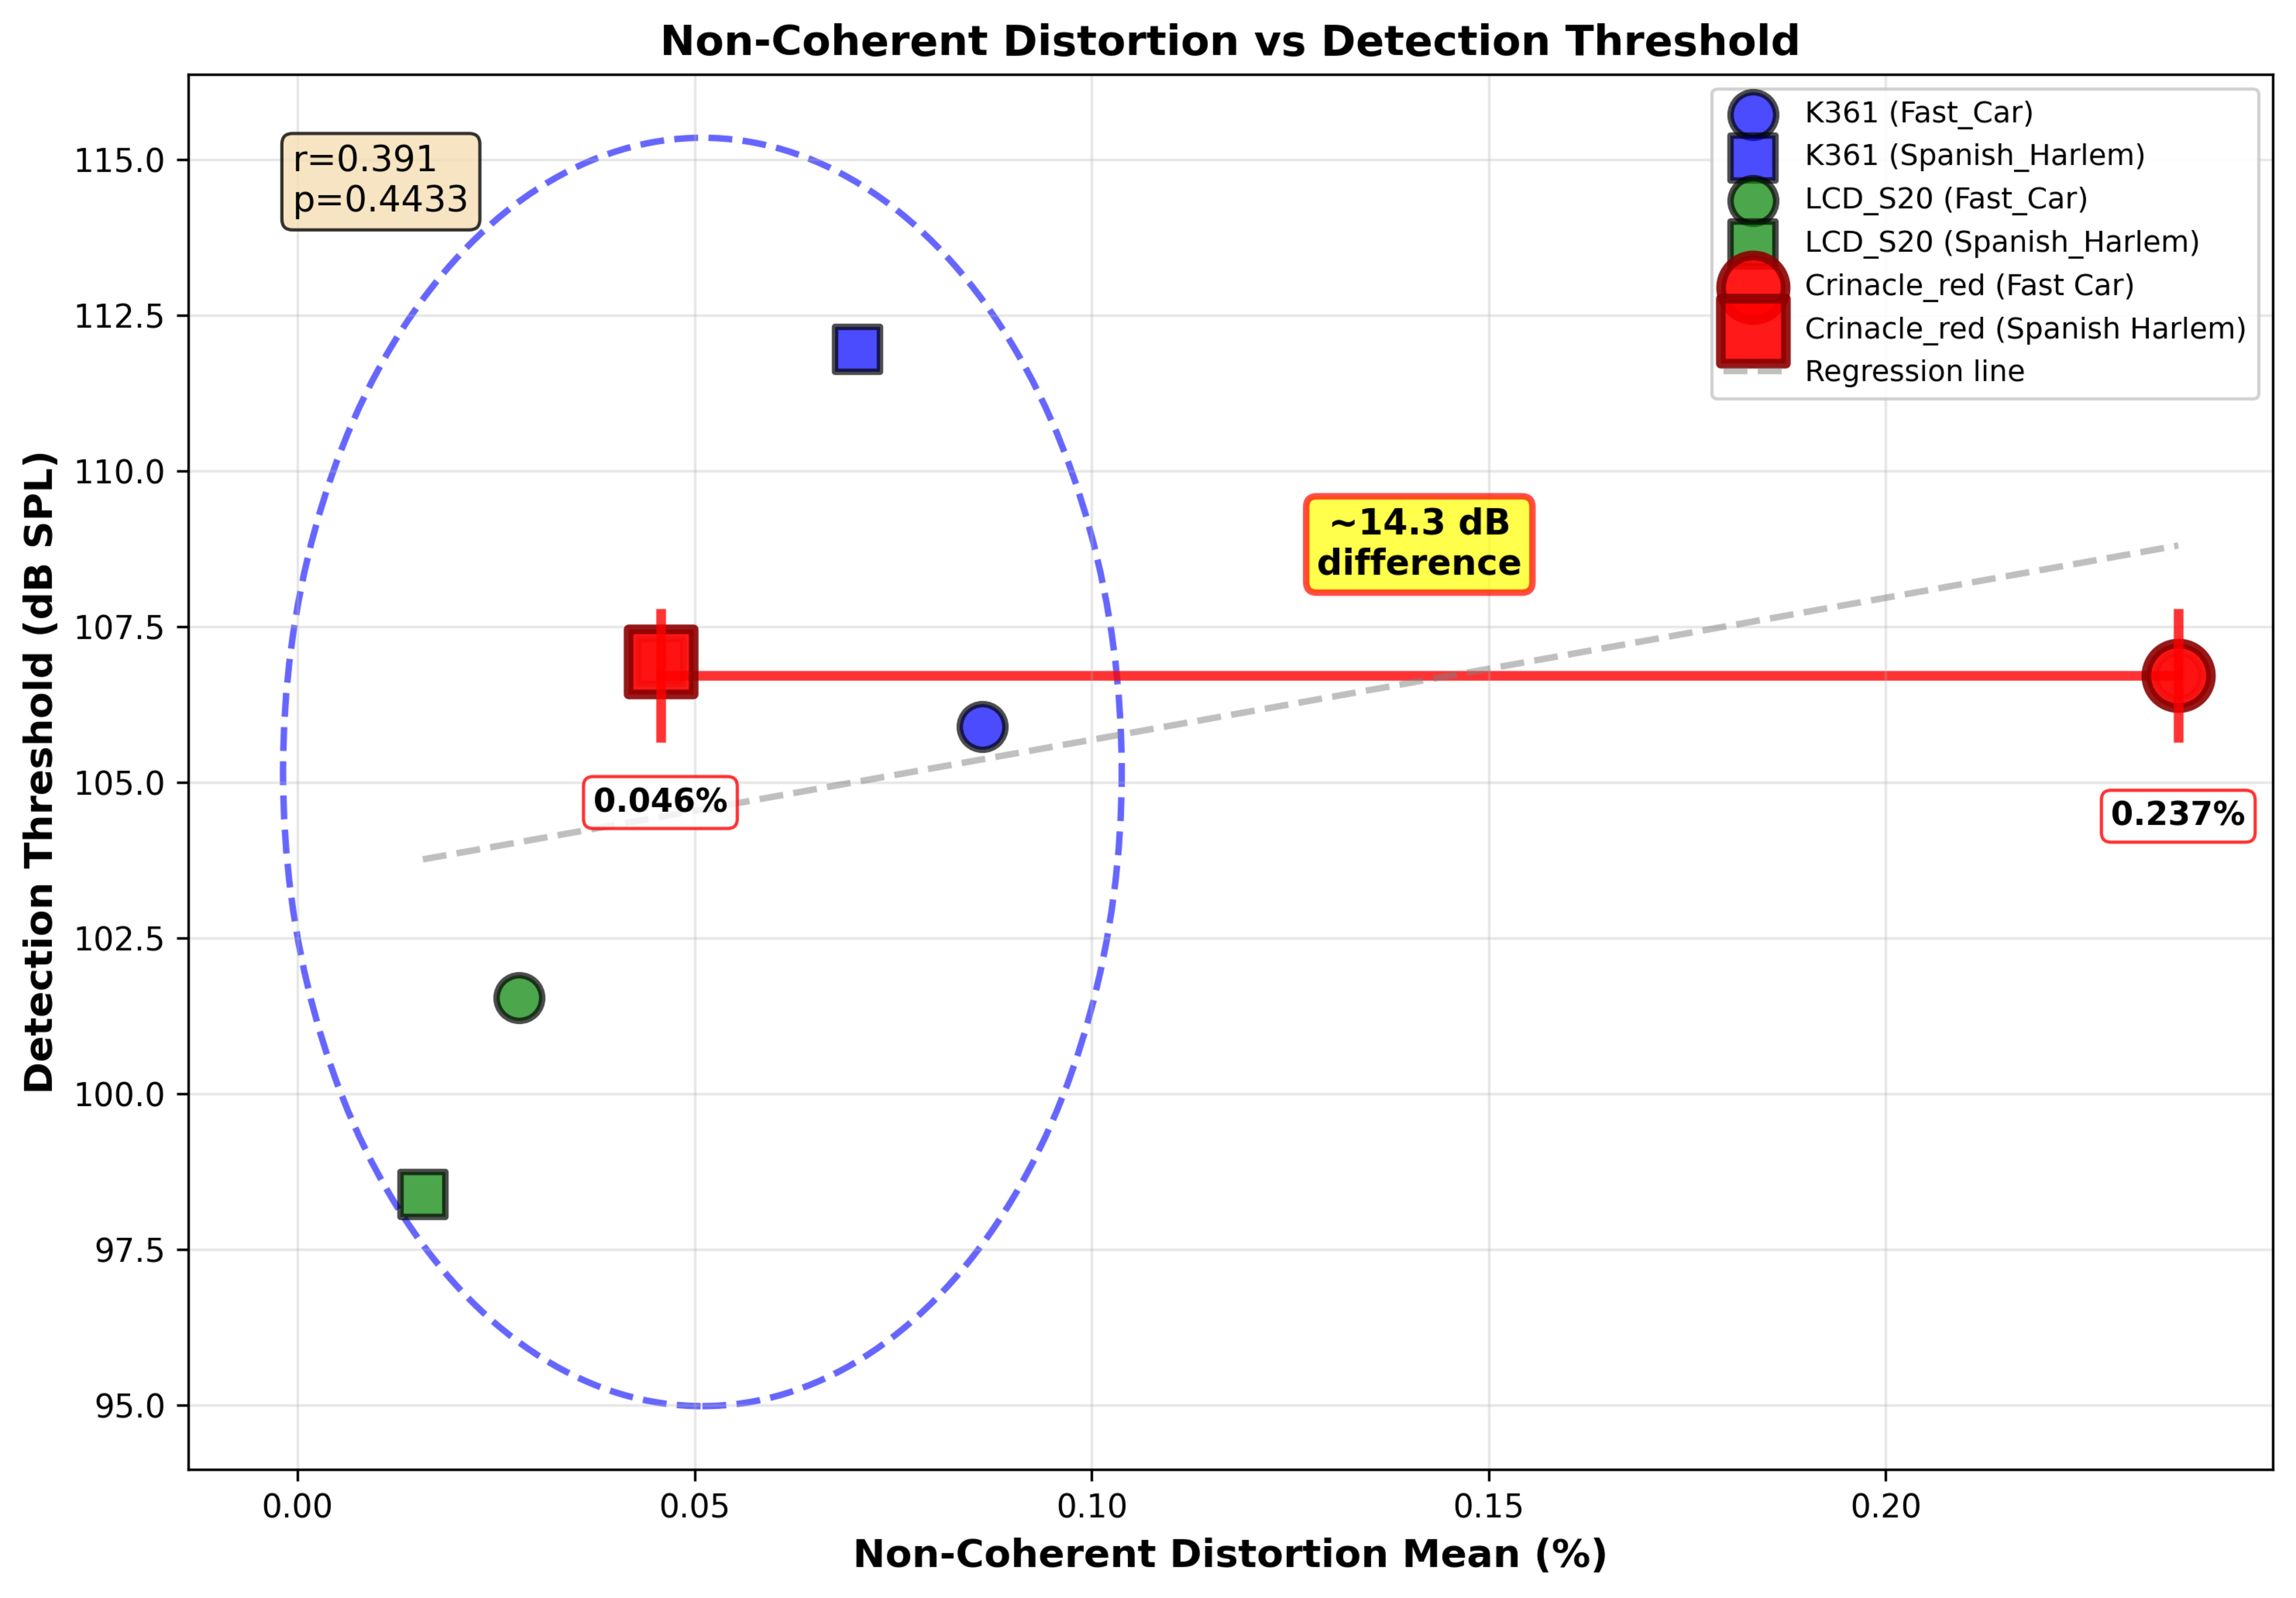
We also had two threshold tests for the ZERO: RED "Fast Car" that were rejected due to insufficient reversals (<6), suggesting listeners detected something audible in that specific recording. In contrast, all threshold tests for the ZERO: RED "Spanish Harlem" met the six-reversal criterion.
This dramatic variation, combined with the ZERO: RED's consistently low distortion on all other measurements (THD, IMD, and DFD), suggests the high non-coherent distortion in the "Fast Car" recording may not be intrinsic to the IEM itself. It could be recording artifacts or stimulus-dependent interactions. The nature of IEMs, with their ear canal resonances that are specific to the test fixture and insertion depth, may also have been a contributing factor, assuming post-equalization cannot compensate for this fully. Non-coherent distortion captures more than just headphone distortion: it includes recording and environment-induced nonlinearities, which we cannot prove are intrinsic to the headphones. Listeners reported "different airiness in the vocals," and "slightly different spatial presentation" as distinguishing cues.
We must stress that those are very small differences. Although the lower average similarity rating isn't insignificant when taking the experiment as a whole, the average ratings show a real trend. However, no listeners gave it the lowest note on all five trials; even the best listeners have rated a headphone worst at least once, and no listeners, when taken individually, rated it significantly lower than all other headphones.
Our Golden Ears: When Individual Listeners Skew Results
Based on these results, we're not saying distortion is universally inaudible. Our findings show that distortion is inaudible for most listeners at normal listening levels, but some listeners deserve special mention.
In Experiment 1 (threshold detection), two listeners (out of 13) showed exceptional results that prompted us to investigate further. L12 had multiple rejected tests across different headphones, including two LCD-S20 tests with perfect 100% accuracy at 85 dBA SPL. We can also see that L12's average threshold for all six tests was at 92.5 dBA SPL, at least 10 dB below everyone else. Objectively, those levels are in the linear behavior zone of these headphones and getting near reasonable listening levels. Unfortunately, L12 couldn't participate in the second phase, but we can reasonably think that they could've detected differences in distortion.
L11 also had several rejected tests at the lowest tested level. These exceptional performances suggested these listeners might be detecting differences even at the cleanest available file, preventing the adaptive staircase from converging properly. L11 was also the only participant who achieved significant discrimination, correctly identifying the ZERO: RED vs the HD 650 in nine out of 10 trials (p < 0.05). This stands out in stark contrast to the group results, where no headphone pairs were distinguishable above chance when aggregated across all listeners.
In similarity tests, L10 could recognize the clean recording against our "distorted" binaural recordings 100% of the time, but not L11. This means that even our best listeners would sometimes miss the difference between the original released version and a recording that went through headphones, let alone differences between headphones. This is quite telling about how small these differences truly are. These outlier cases highlight an important point: individual differences exist, and exceptional listeners can detect subtle differences that most people cannot. But when we look at the group data, distortion remains largely inaudible at normal listening levels for most listeners. The fact that only one listener out of many could reliably discriminate headphones in ABX tells you just how difficult these recordings are to decipher for the vast majority of listeners. Our findings show that distortion is inaudible for most people, not that it's inaudible for everyone.
Conclusion
Our comprehensive listening tests revealed that headphone distortion is largely inaudible at normal listening levels. Detection thresholds occurred at 104-112 dBA SPL, which are levels that would make your ears ring. At normal playback levels, differences are detectable in similarity tests but extremely difficult to distinguish in ABX discrimination. Most traditional distortion metrics (THD and IMD) don't predict perception, while "Fast Car" non-coherent distortion shows a strong correlation. However, even when measurements predict subtle differences, those differences remain extremely difficult to detect.
What It Means for You
In the Introduction, we explained that there were two gaps that we'd identified. Now we've addressed the first one, as we have thresholds for when distortion becomes audible, but our experiment demonstrated that you will never experience them. Regarding preferences, if listeners can't reliably hear differences at normal listening levels (as our ABX results show they can't), then asking which they prefer doesn't make sense. Everything in our study points to one conclusion: distortion doesn't affect which headphones you'd prefer, at least for the headphones we tested.
Now, we should stress that these findings are specific to the headphones we tested. We can't say this applies to every pair of headphones on the market. However, for practical listening with headphones similar to those we tested, you can stop worrying about distortion measurements. Focus on what actually matters for your listening experience: frequency response, comfort, build quality, and features. The distortion numbers? They're not going to make or break your listening experience. In fact, we've updated our methodology in Test Bench 2.1 to better reflect distortion's (lack of) impact on most products.
Acknowledgments
We would like to thank Steve Temme and the support team at SoundCheck (Listen Inc.) for loaning us the software suite used for audio measurements in this study.
We also extend our gratitude to Jérémie Voix and the team at École de technologie supérieure (ÉTS) for providing the audiometric measurement room free of charge. The facilities were made available through ÉTS-EERS Industrial Research Chair in In-Ear Technologies (CRITIAS) laboratory.