The Hisense U8QG is one of the best mid-range TVs on the market in 2025, and it's available in a wide range of sizes, from 55-inch up to a massive 100-inch TV. Each size has different specifications for brightness and zone count, and it appears that certain sizes even utilize a completely different panel, making it difficult to know exactly what you're buying with that model. So we decided to buy and review the 100-inch version (100U8QG) of this TV to complement our existing review of the 65-inch model (65U8QG).
Unfortunately, when we started digging in to how these two TVs perform, we found some very obvious downgrades in the 100-inch model. While it's still a decent TV overall, it has worse contrast, lower peak brightness, and worse colors. Below, we'll break down those key differences between them and more, and show you how they impact the viewing experience. If you want to skip the analysis and go straight to the data, check out our compare tool instead.
Panel Technology
Although we usually jump right into performance differences, in this case, there are some surprising differences in the technology used on the two displays that warrant a closer look. Feel free to skip ahead to the Performance Differences section if you just want to see how they stack up against each other.
Panel Technology And SPD
| Hisense 100U8QG | Hisense 65U8QG |
|---|---|
 |
 |
There was some debate and discussion over what panel technology the 100-inch version actually used, with some reviewers suspecting that it used an ADS Pro panel. We can confirm that that's not the case, and the 100-inch version uses a VA panel. It's not the same VA panel as the 65-inch, though, and there are some considerable differences between them.
Looking at the spectral power distribution of both with a full-width at half-maximum analysis, we can see that both TVs use a very similar blue backlight. The similarities stop there. Greens on the 65-inch model show a very narrow 24 nm emission band consistent with cadmium-based quantum dots. The 100-inch model exhibits a significantly wider 44 nm FWHM and less precise color separation, which suggests that it utilizes a lower-quality quantum dot material, such as InP. Reds show the telltale peaks of a KSF phosphor on the 100-inch, whereas the 65-inch again shows a very narrow emission band consistent with CdSe quantum dots. These changes came as a bit of a surprise, and the technology used in the 100-inch model is clearly inferior to the 65-inch model, but that doesn't necessarily mean it's a worse TV.
Performance Differences
Now that we've explored the technical differences between the panels, let's examine how these two TVs perform. It's normal for some metrics to change slightly even between individual units of the same size, so we'll only examine the real differences between them that aren't likely caused by panel variance.
HDR Brightness
| Hisense 100U8QG | Hisense 65U8QG |
|---|---|
 |
 |
 |
 |
 |
 |
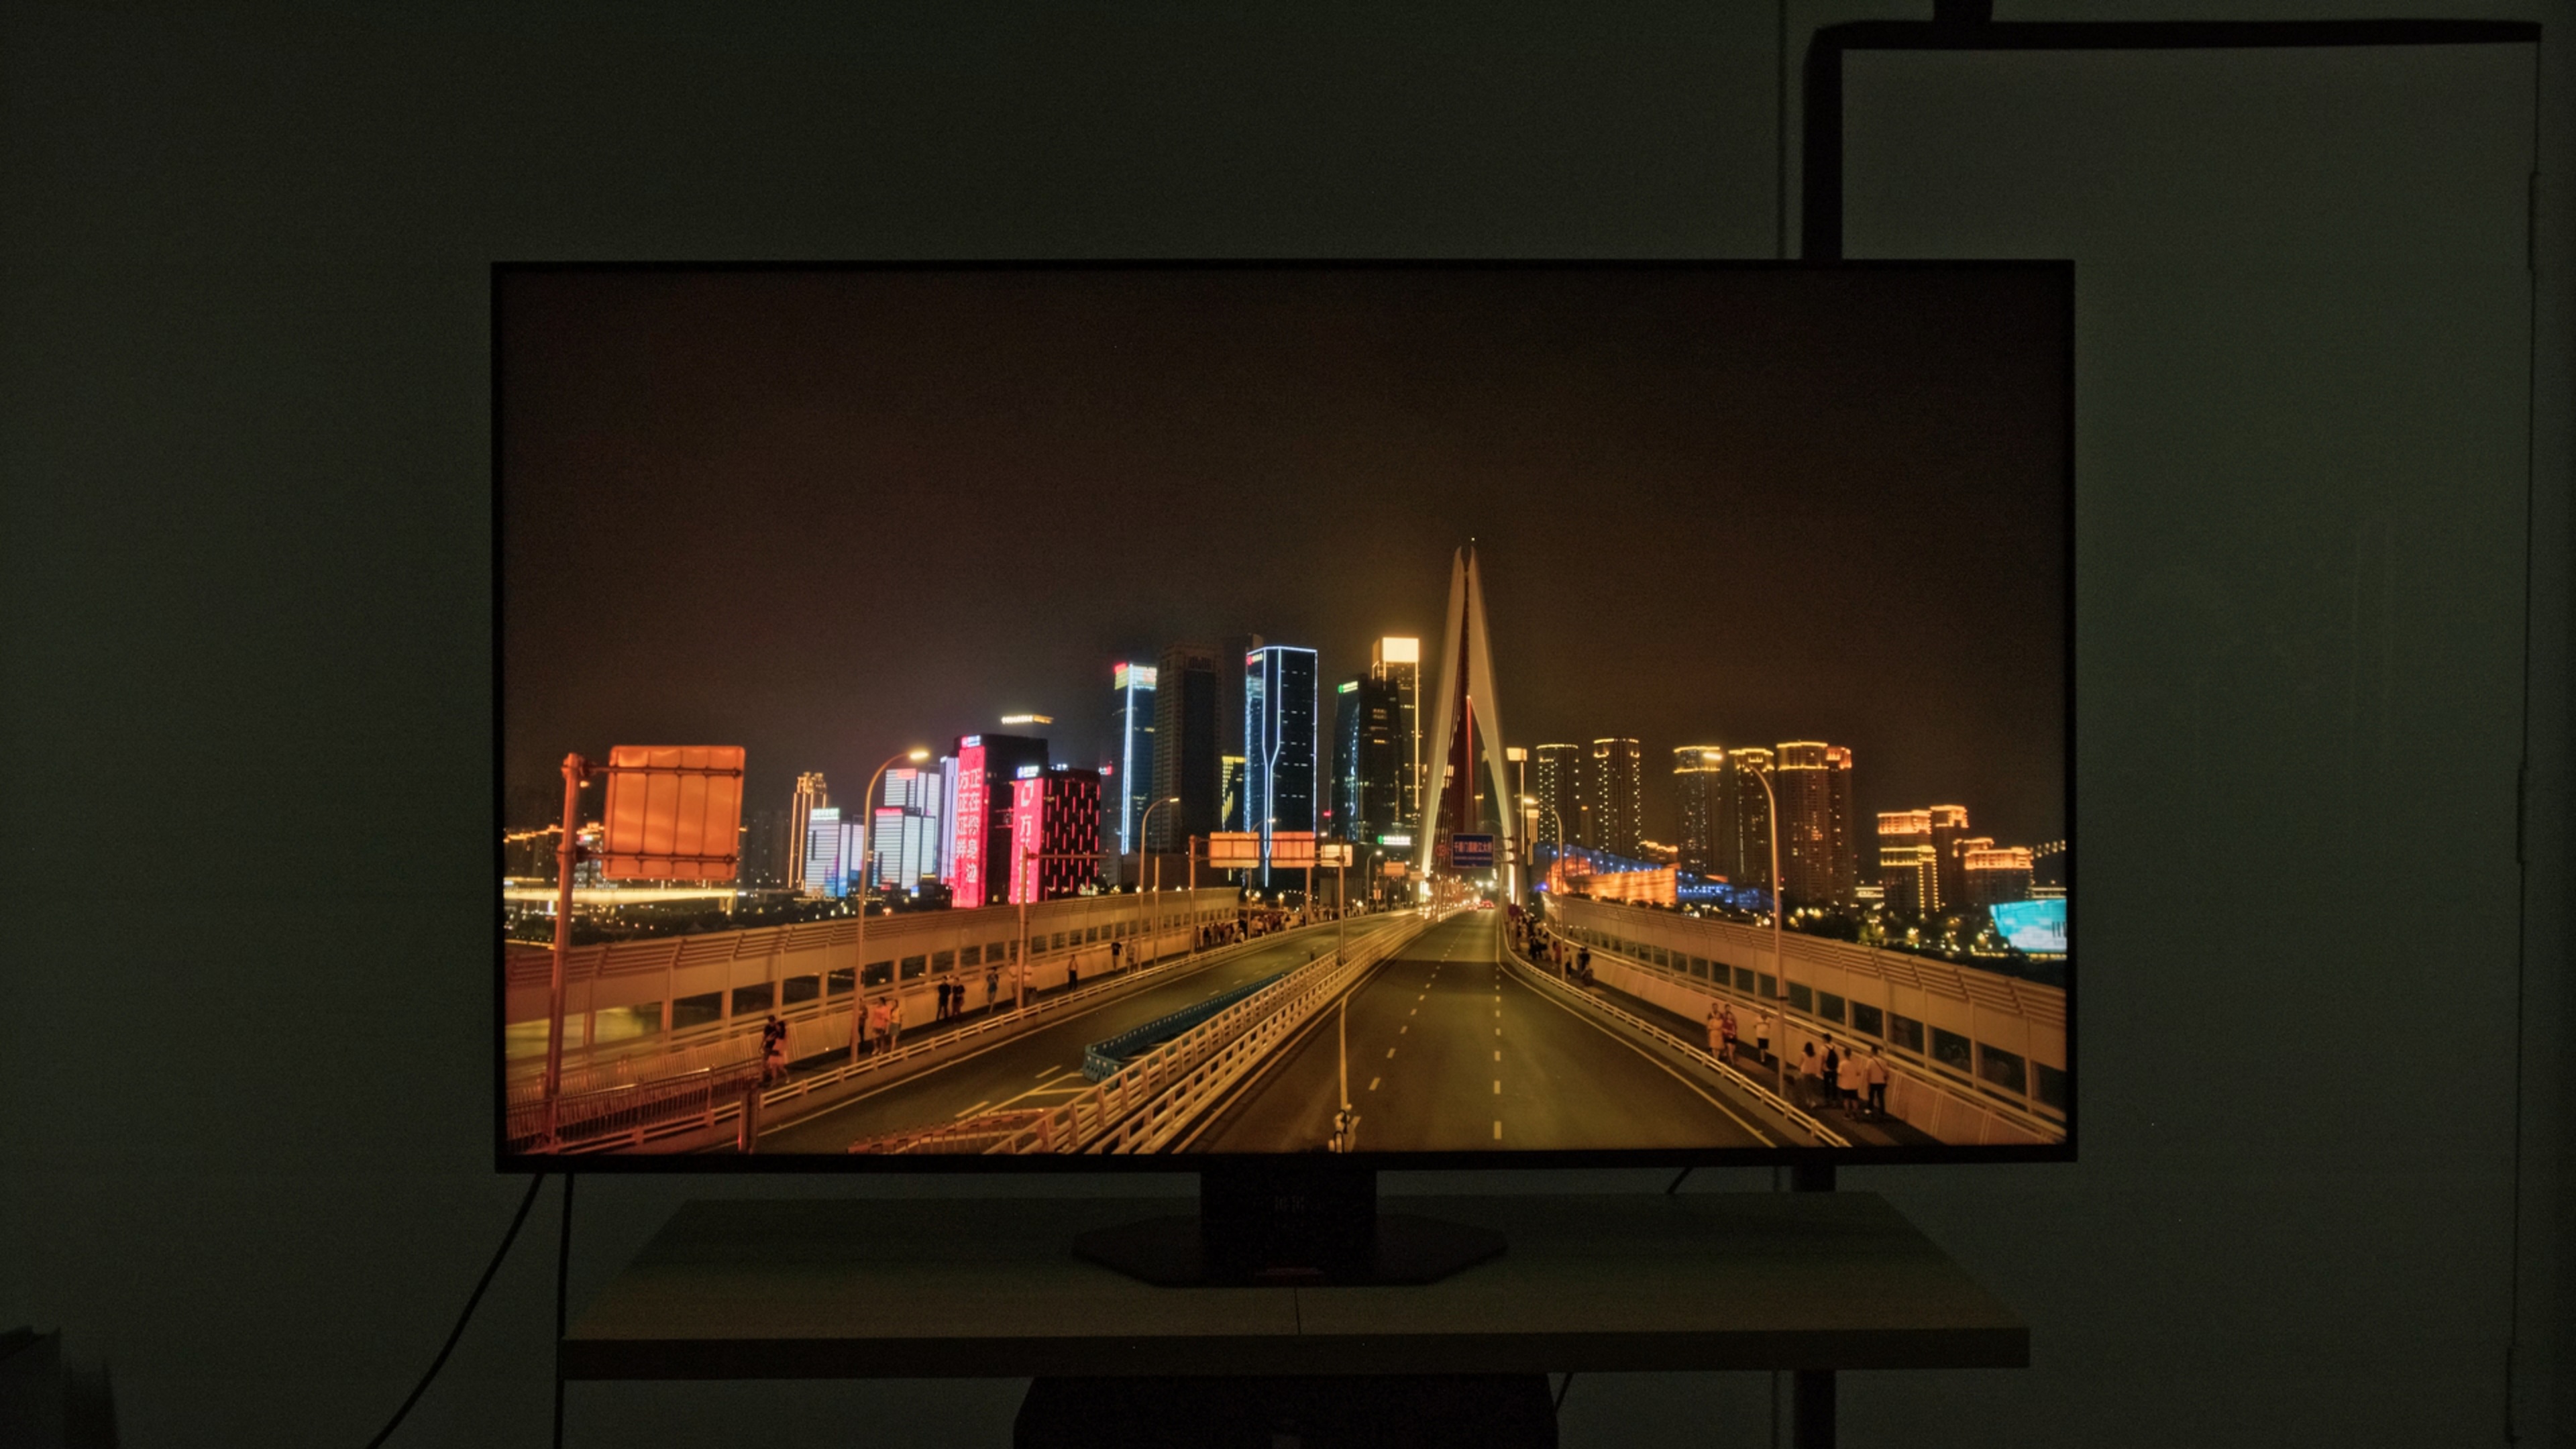
| Test | 100" (cd/m²) | 65" (cd/m²) | Difference In cd/m² | % Difference |
|---|---|---|---|---|
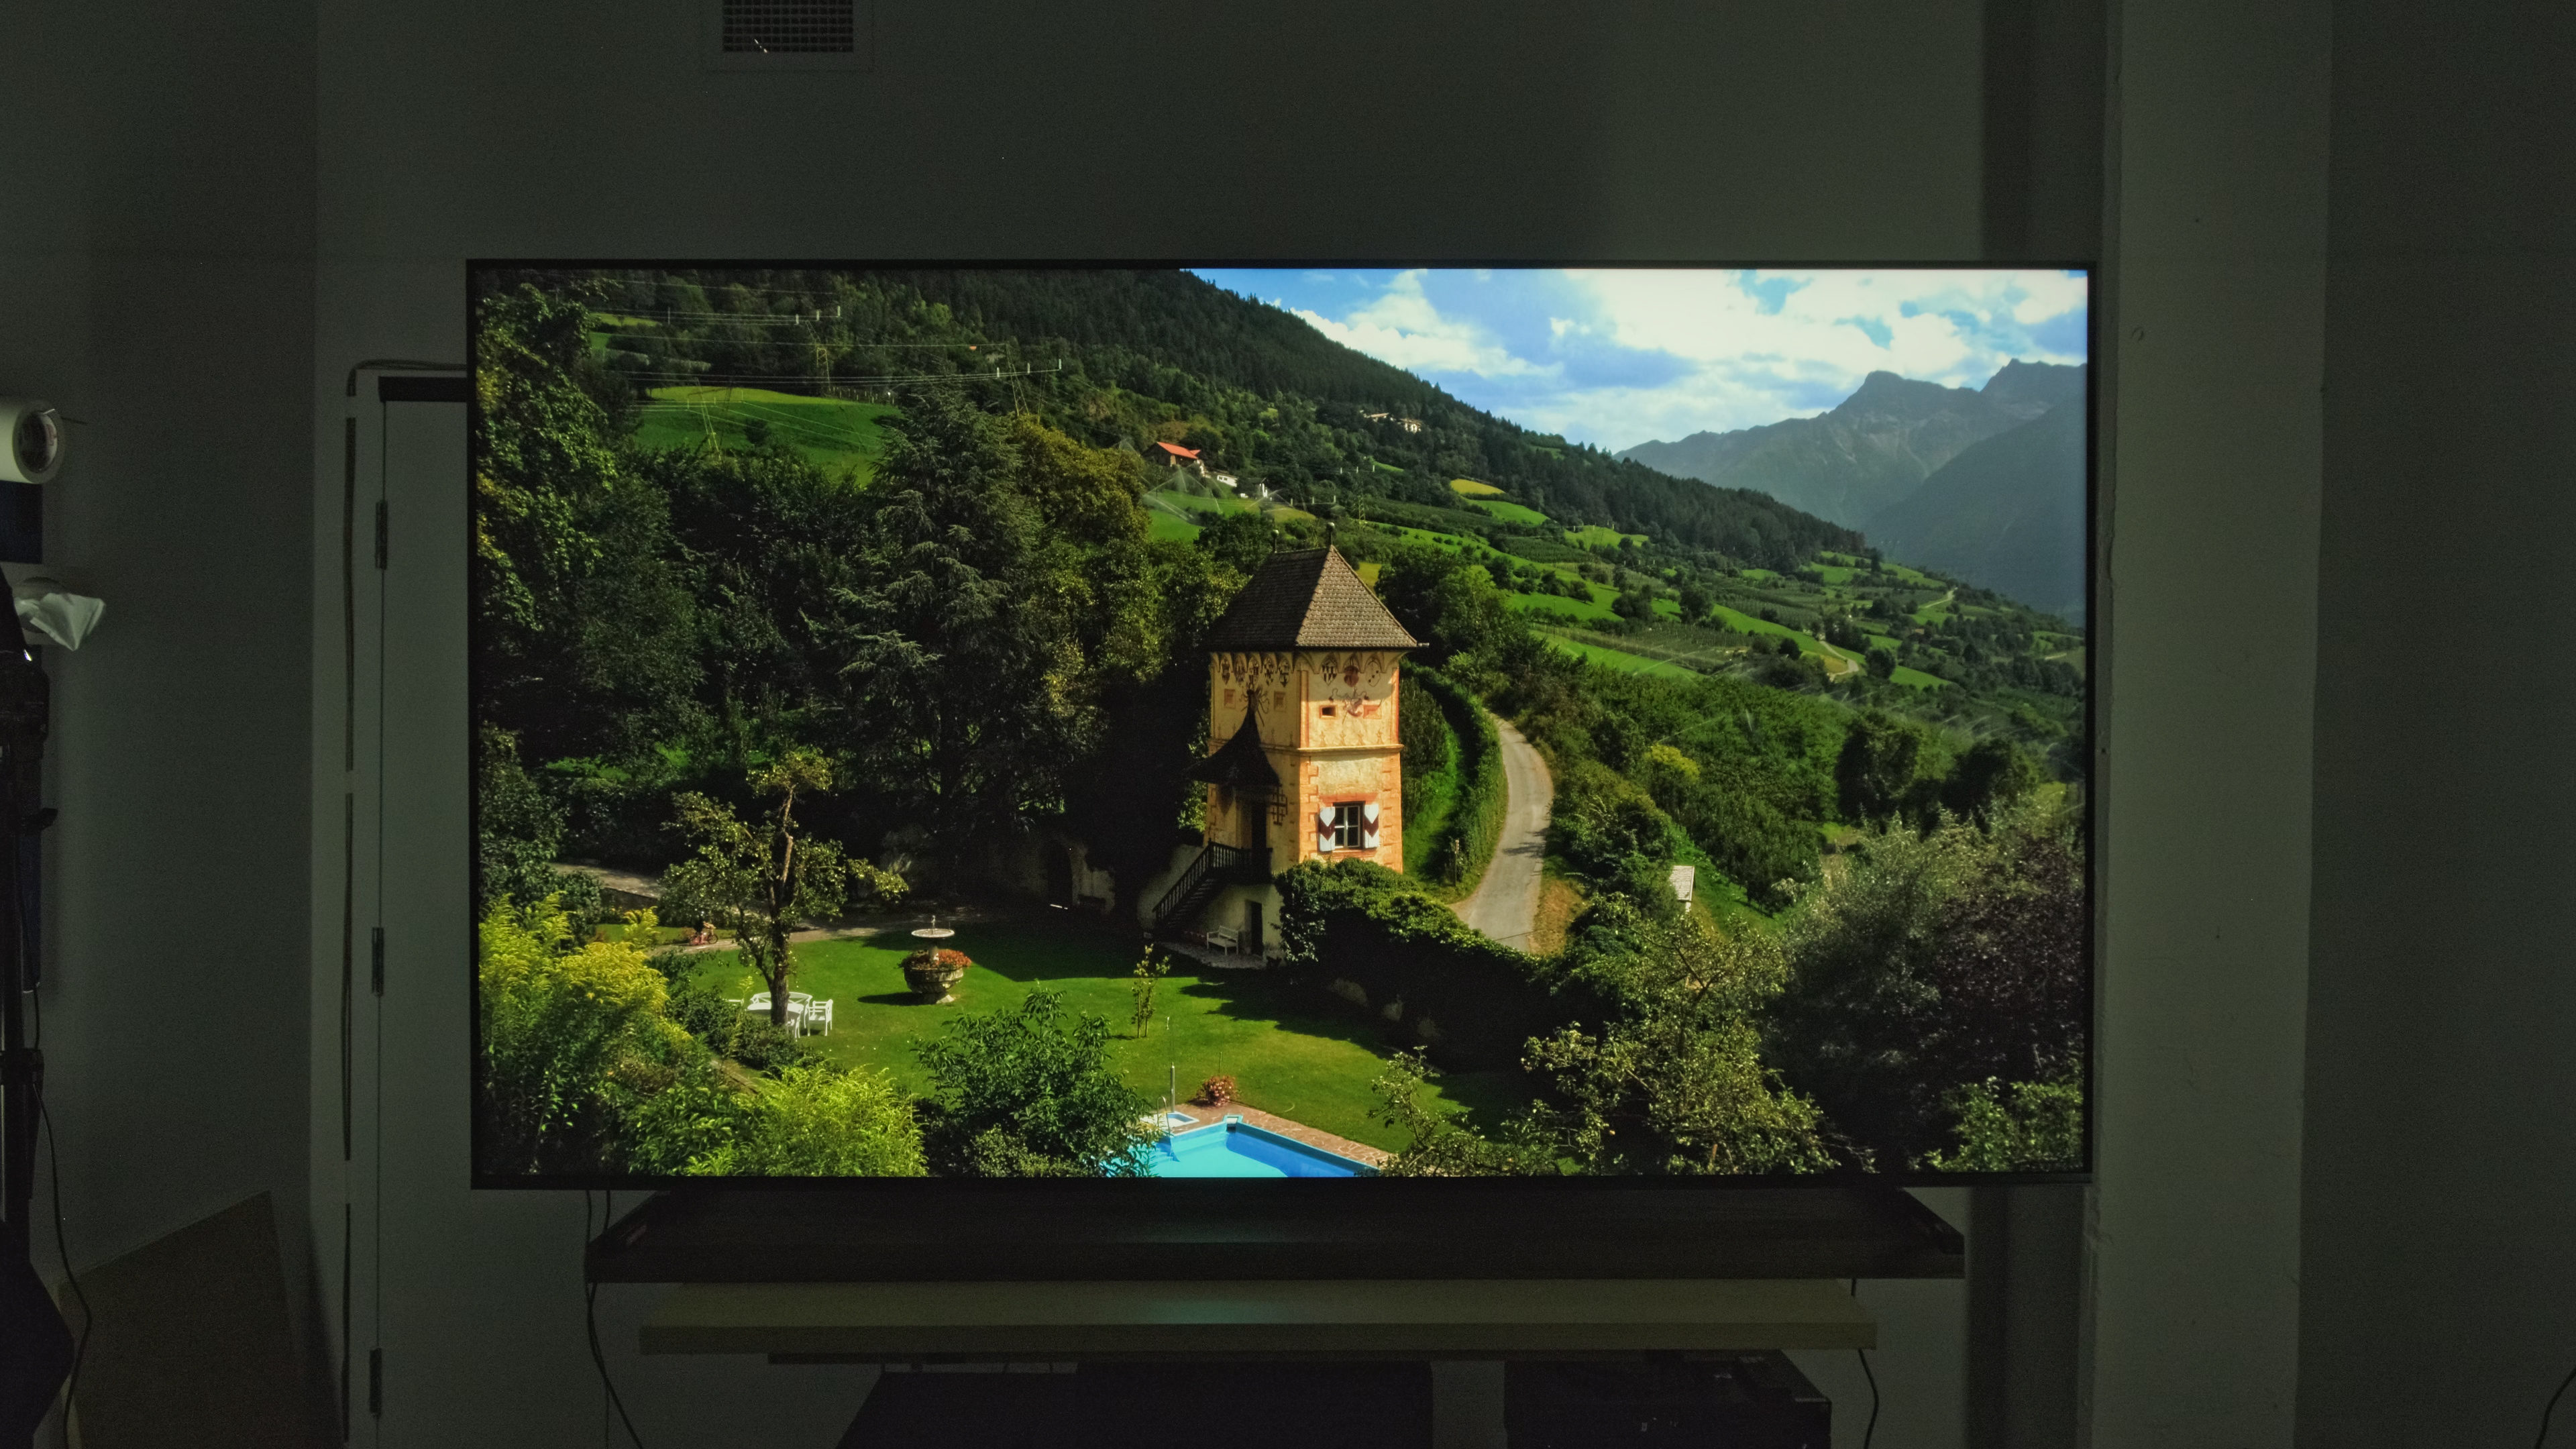
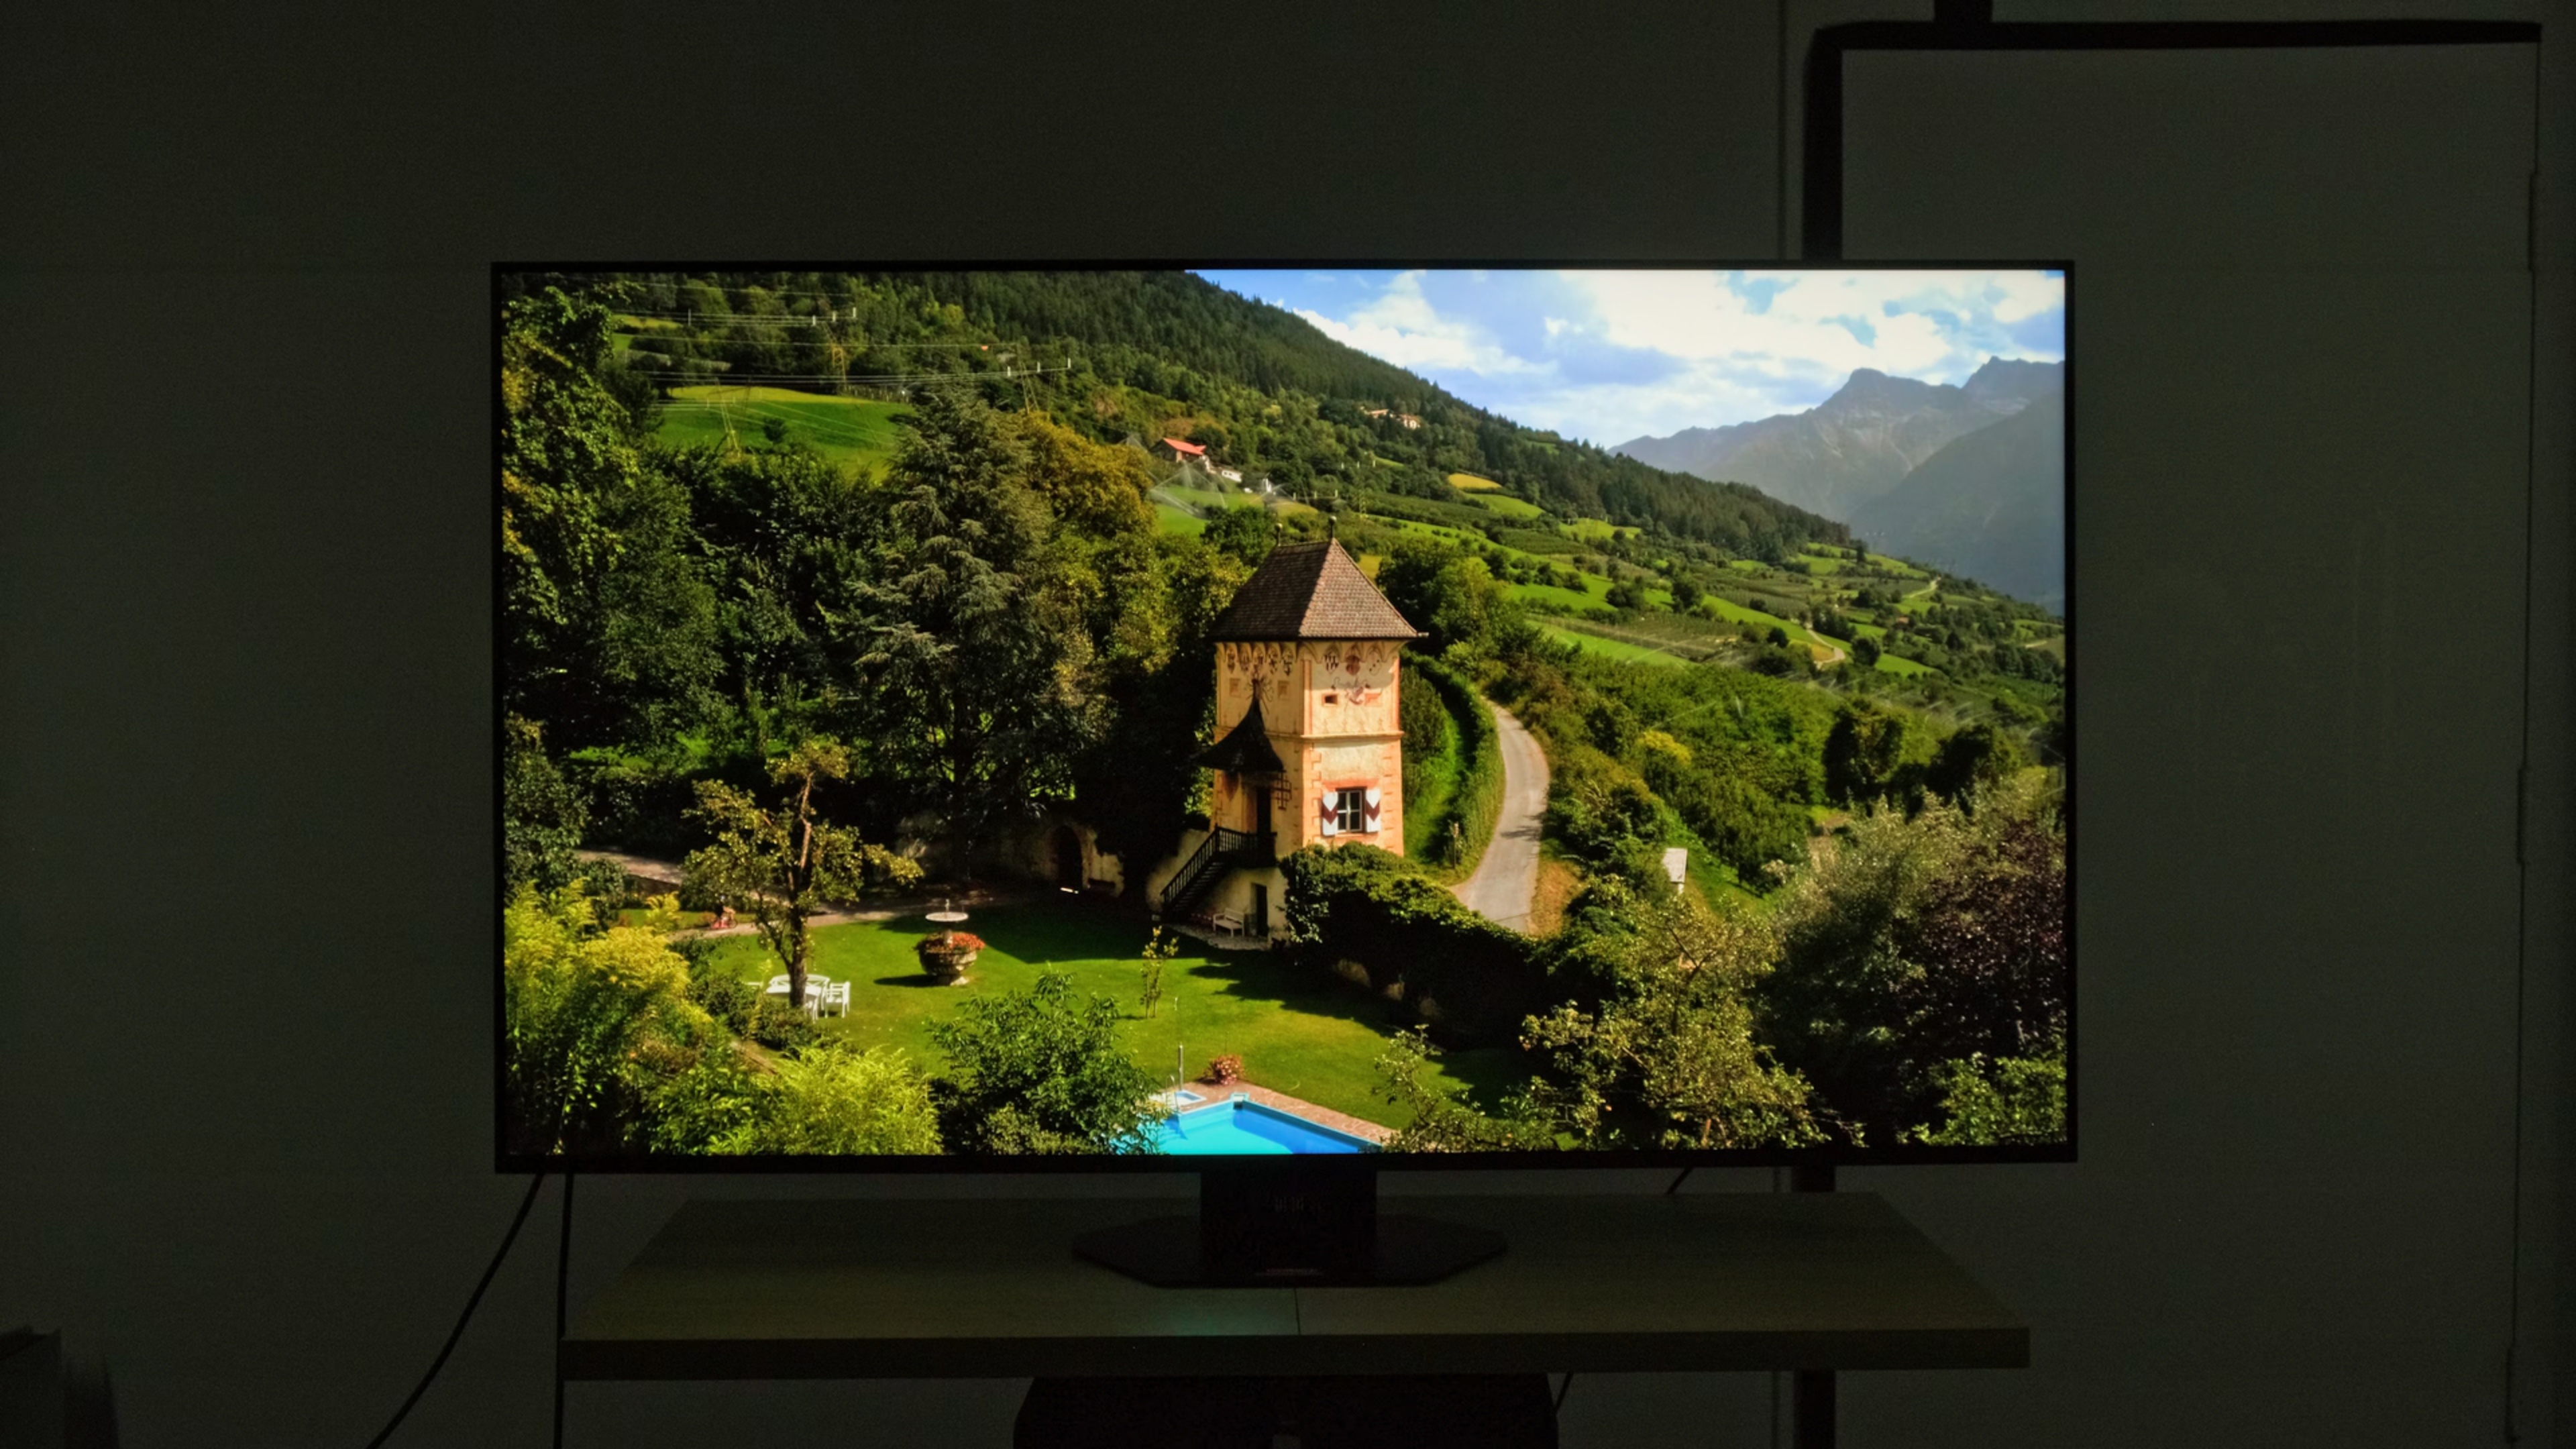
| Hallway Lights (~1950 cd/m²) | 903 | 952 | -49 | -5.1% |
| Yellow Skyscraper (~700 cd/m²) | 544 | 790 | -246 | -31.1% |
| Landscape Pool (~300 cd/m²) | 387 | 460 | -73 | -15.9% |
| Peak 2% Window | 4,983 | 5,552 | -569 | -10.2% |
| Peak 10% Window | 3,916 | 4,380 | -464 | -10.6% |
| Peak 25% Window | 2,593 | 2,554 | 39 | 1.5% |
| Peak 50% Window | 1,382 | 1,503 | -121 | -8.1% |
| Peak 100% Window | 763 | 867 | -104 | -12.0% |
| Sustained 2% Window | 2,511 | 3,051 | -540 | -17.7% |
| Sustained 10% Window | 3,421 | 4,057 | -636 | -15.7% |
| Sustained 25% Window | 2,240 | 2,512 | -272 | -10.8% |
| Sustained 50% Window | 1,263 | 1,500 | -237 | -15.8% |
| Sustained 100% Window | 712 | 866 | -154 | -17.8% |
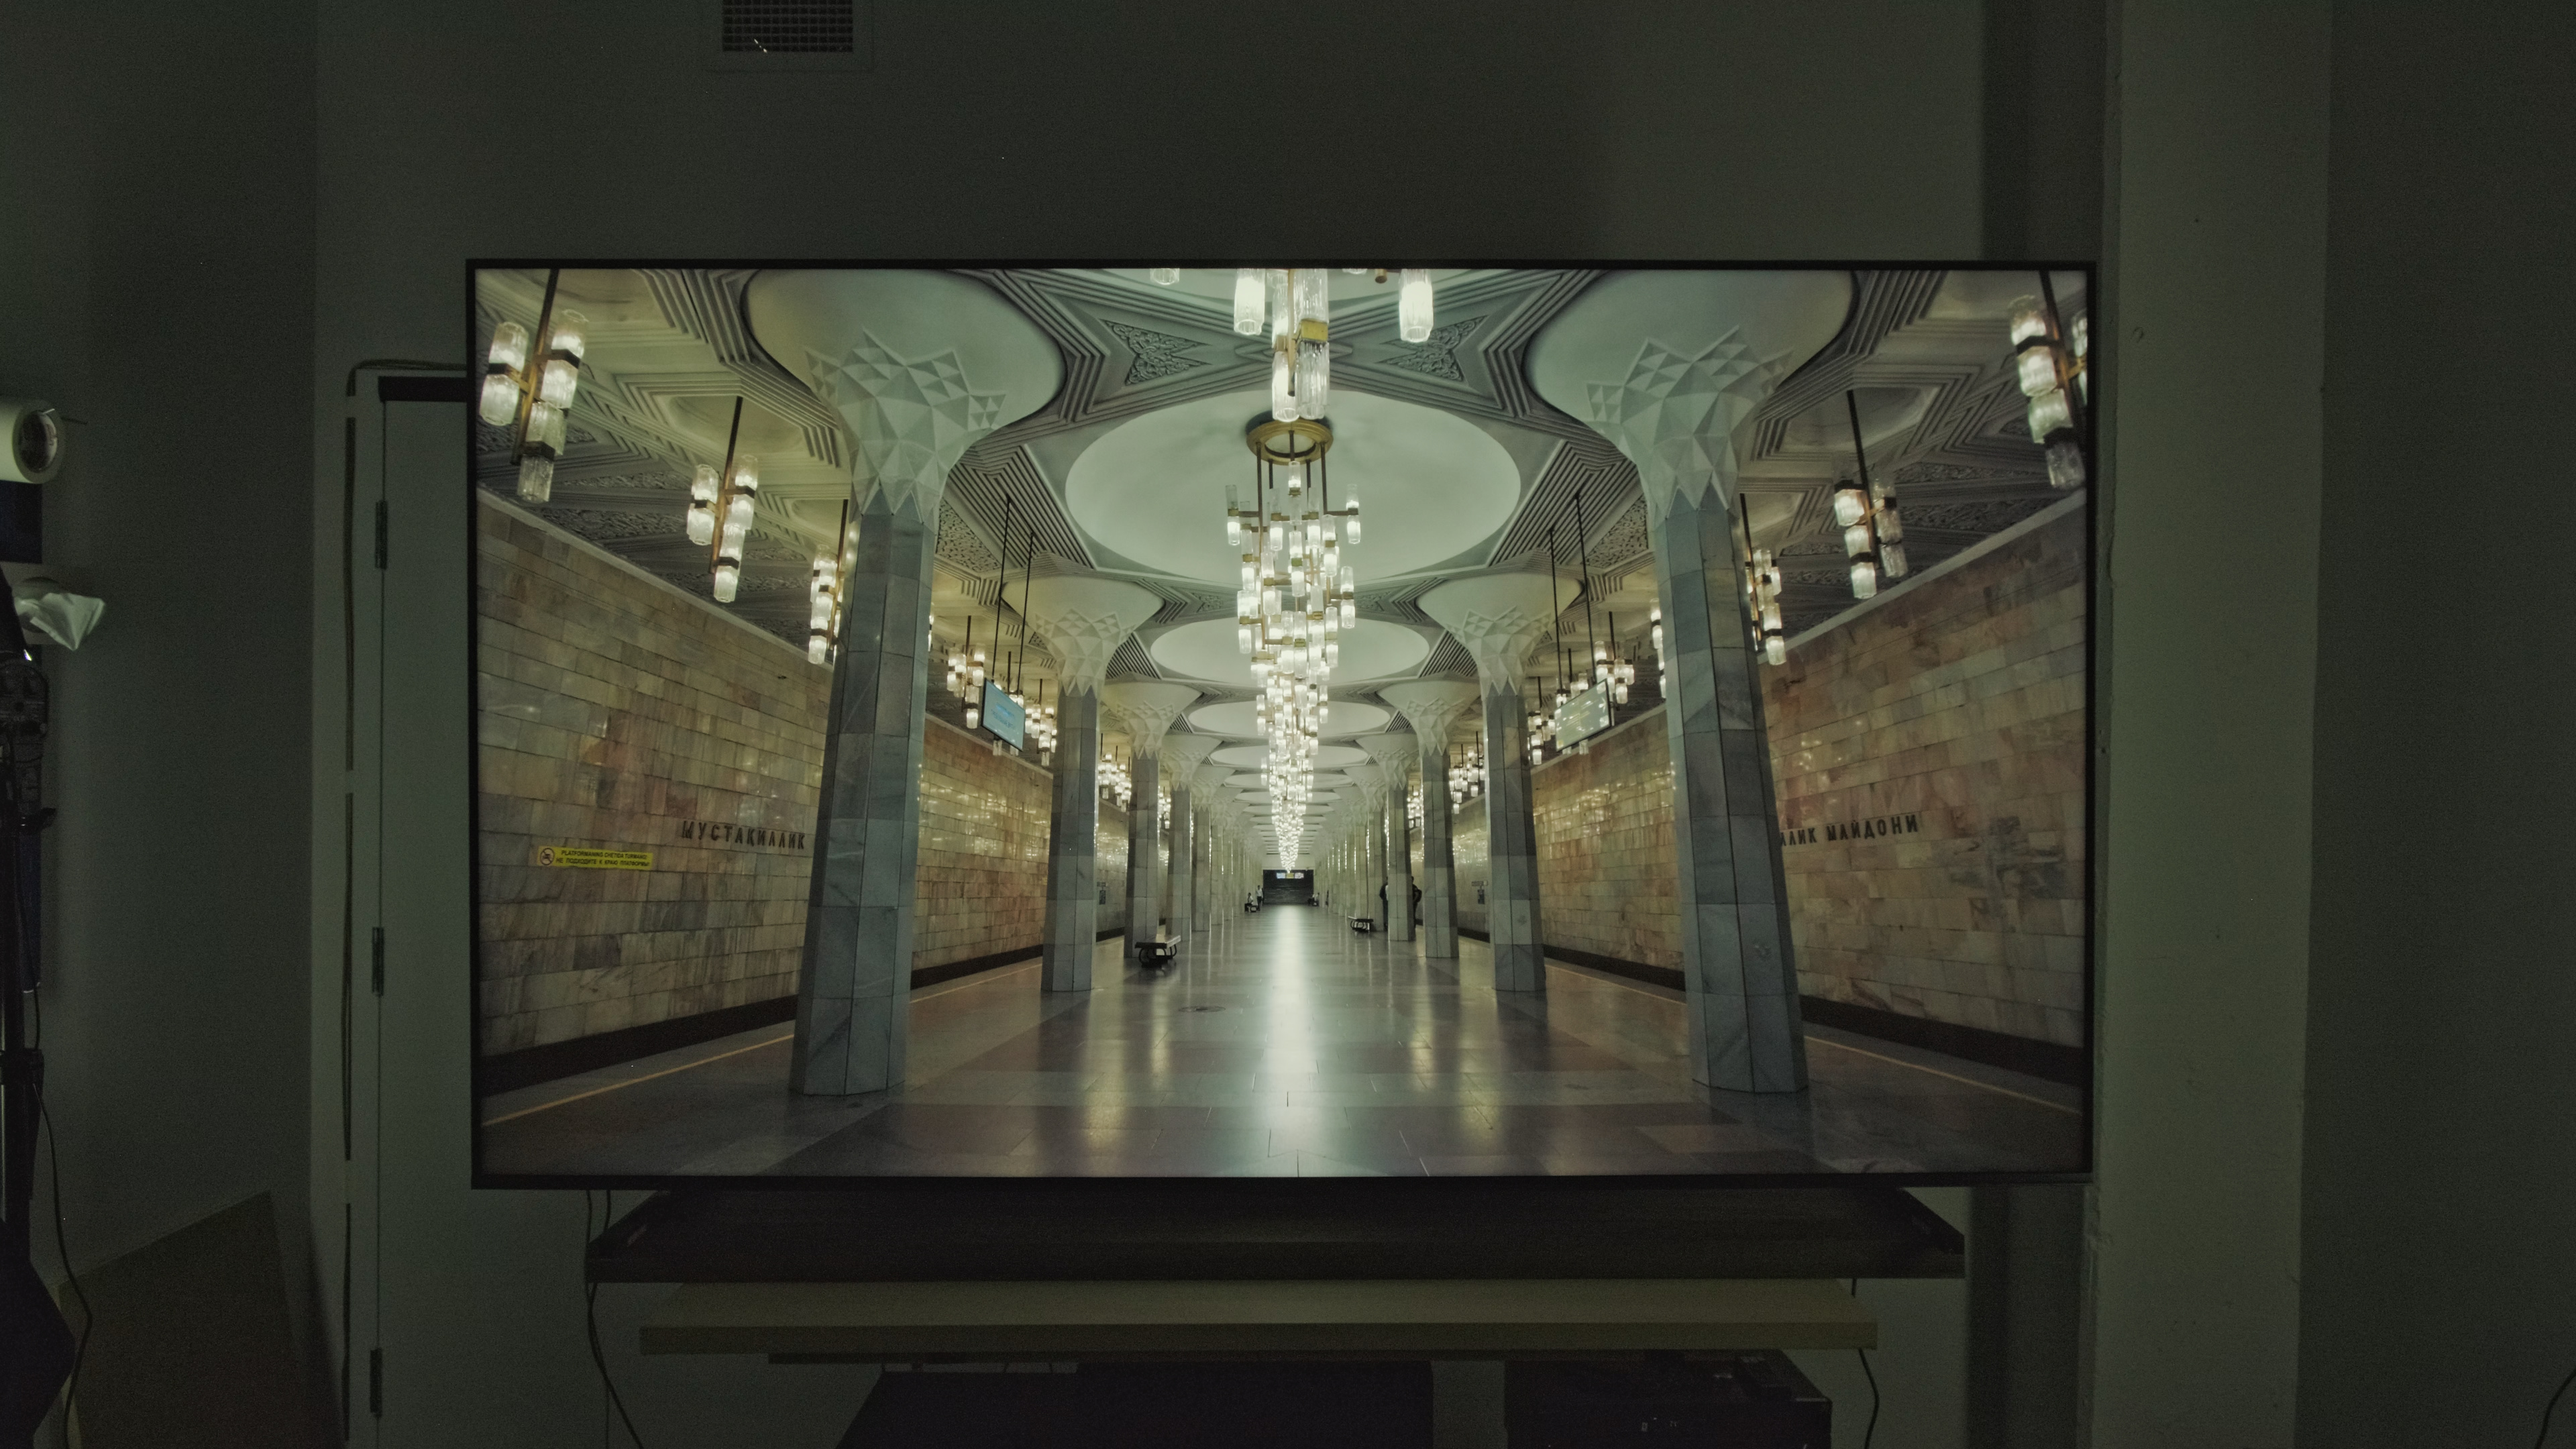
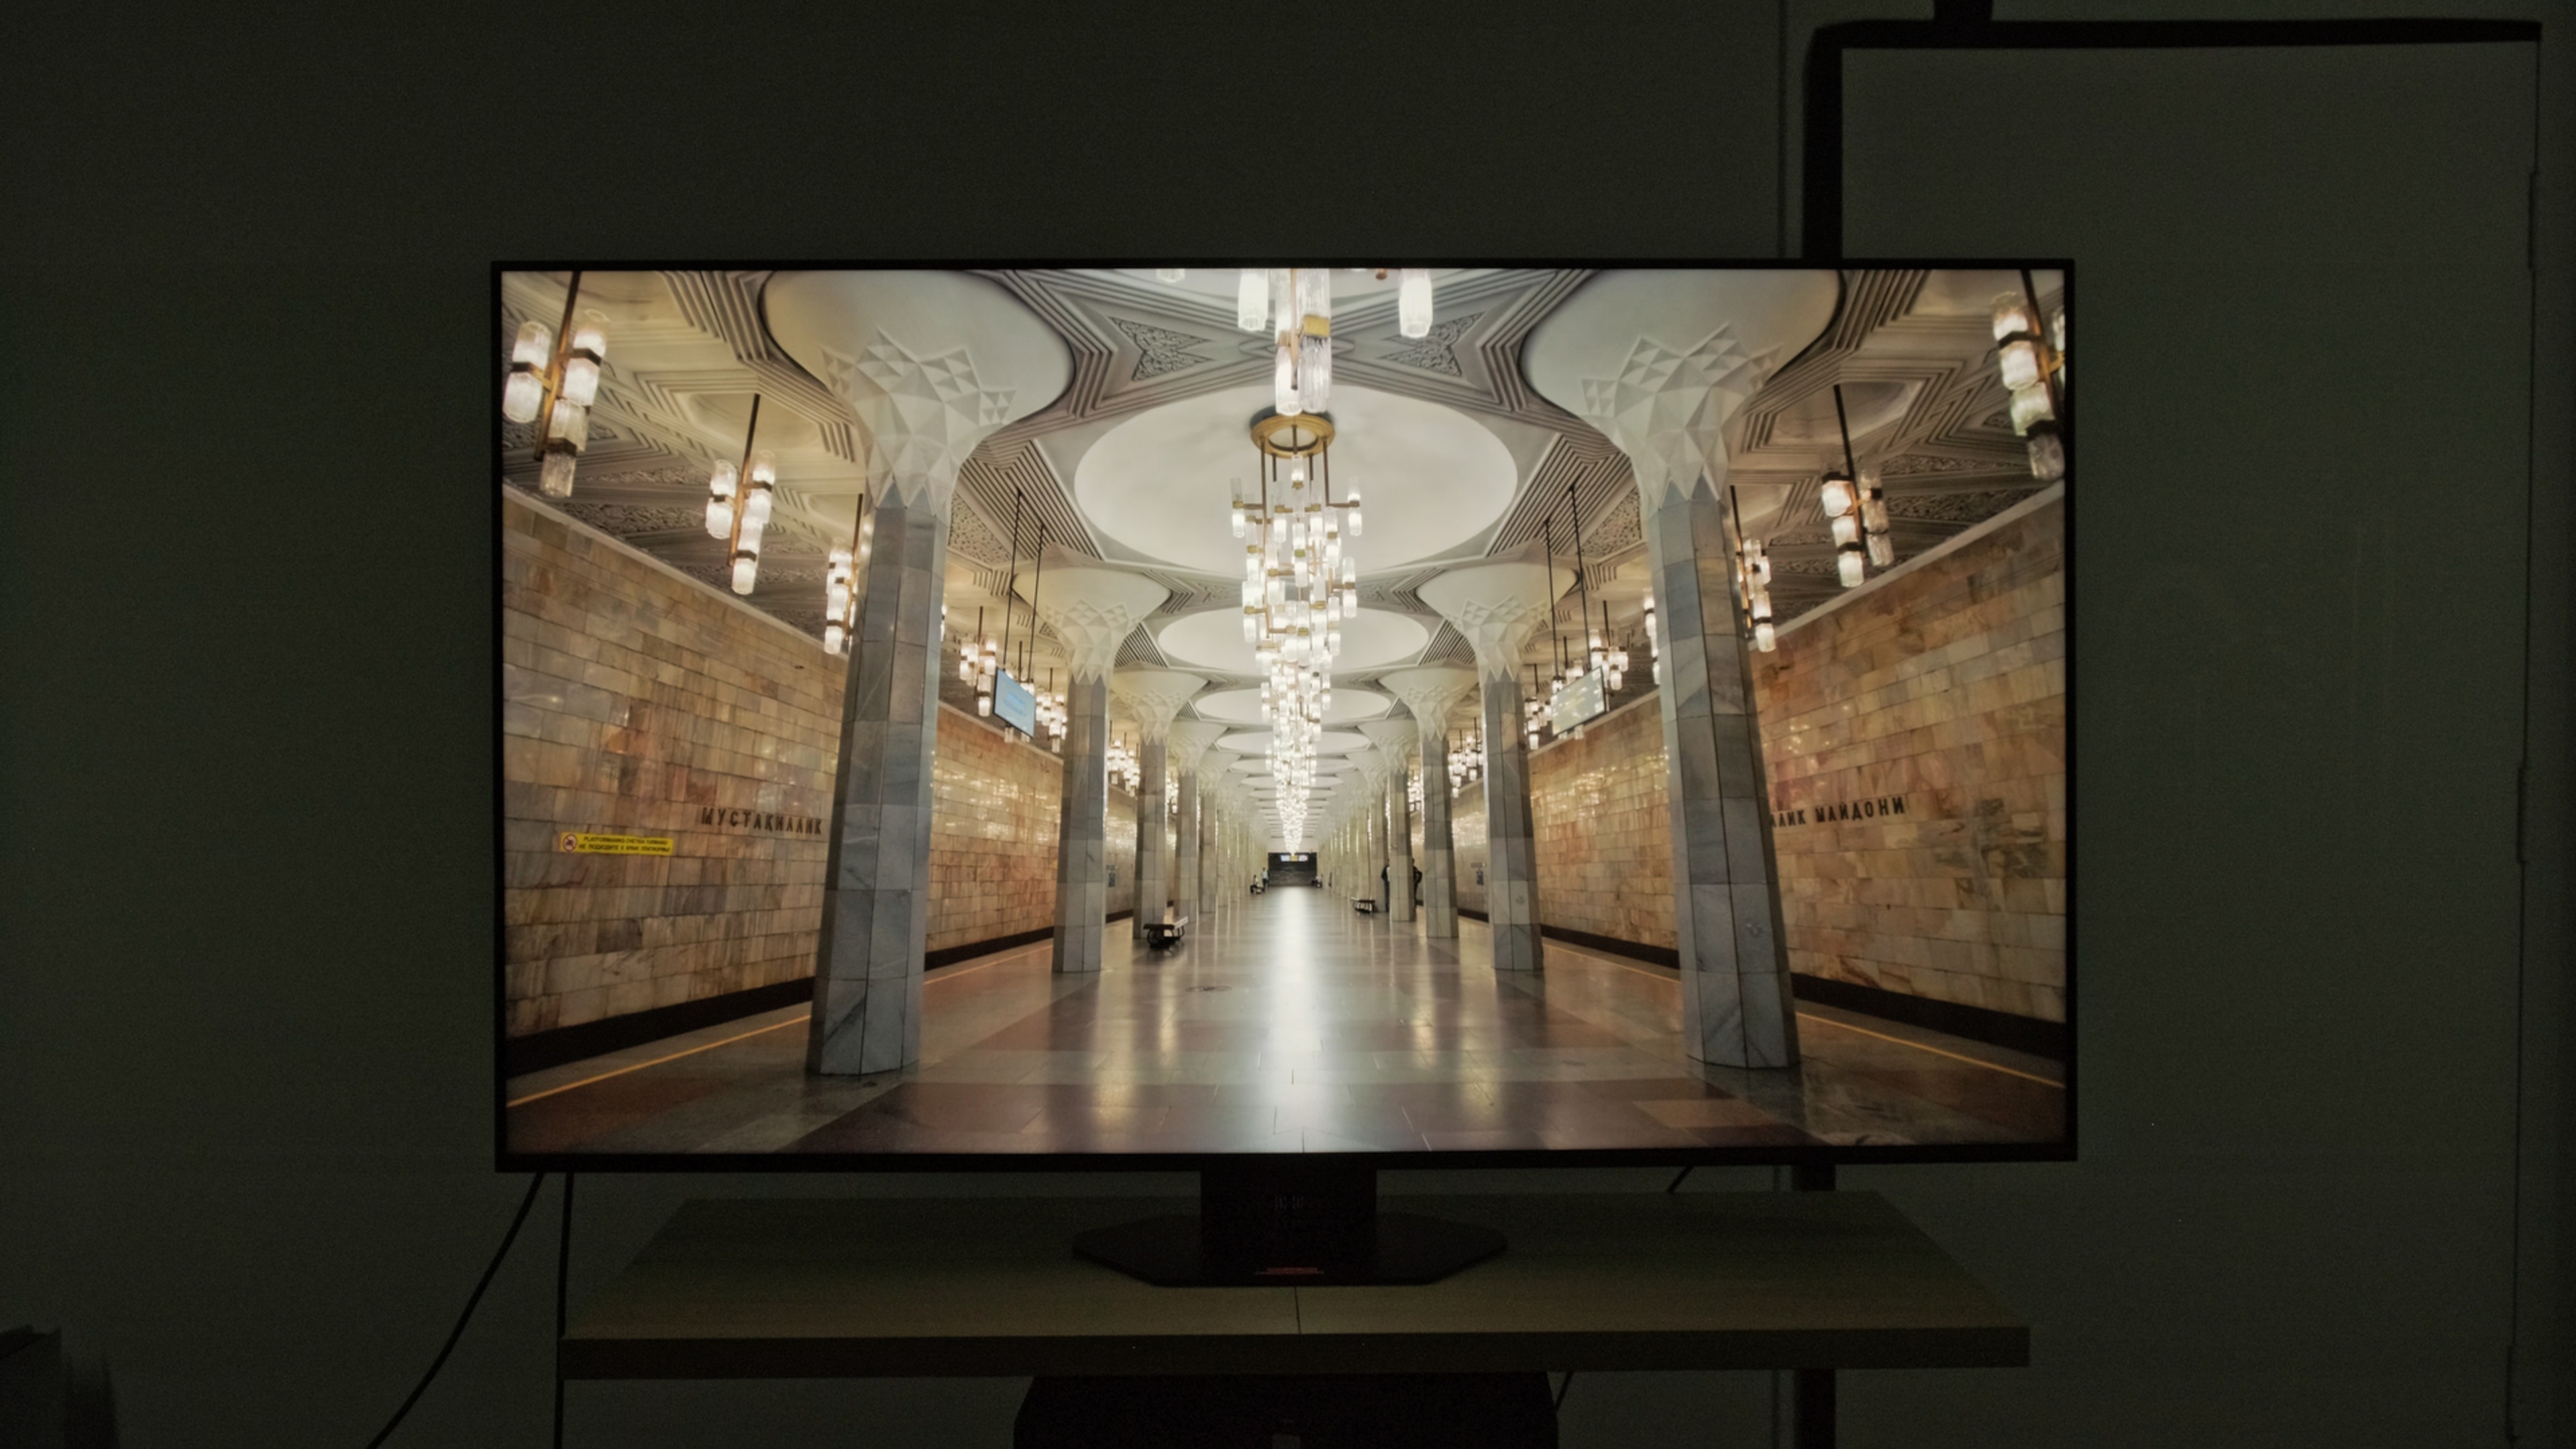
HDR brightness measures how bright a TV can get when displaying HDR content. Higher peak brightness produces brighter highlights that stand out more effectively. Surprisingly, most window test slides are roughly 10-15% brighter on the 65-inch model. With real scenes, the difference is a bit more pronounced, as the EOTF tracking is significantly different on these two TVs, so they don't handle brightness mapping in the same way. However, the 65-inch model is still brighter in this scenario as well.
The good news here is that, although the larger TV is slightly dimmer, both TVs are already so bright that it doesn't make much of a difference. Both TVs are sufficiently bright to display the vast majority of HDR content well and deliver an impactful HDR experience. Therefore, it's mainly a question of gaining some extra headroom for the absolute brightest content available and for future-proofing.
Contrast
| Hisense 100U8QG | Hisense 65U8QG |
|---|---|
 Native Contrast 5,562 : 1 |
 Native Contrast 7,363 : 1 |
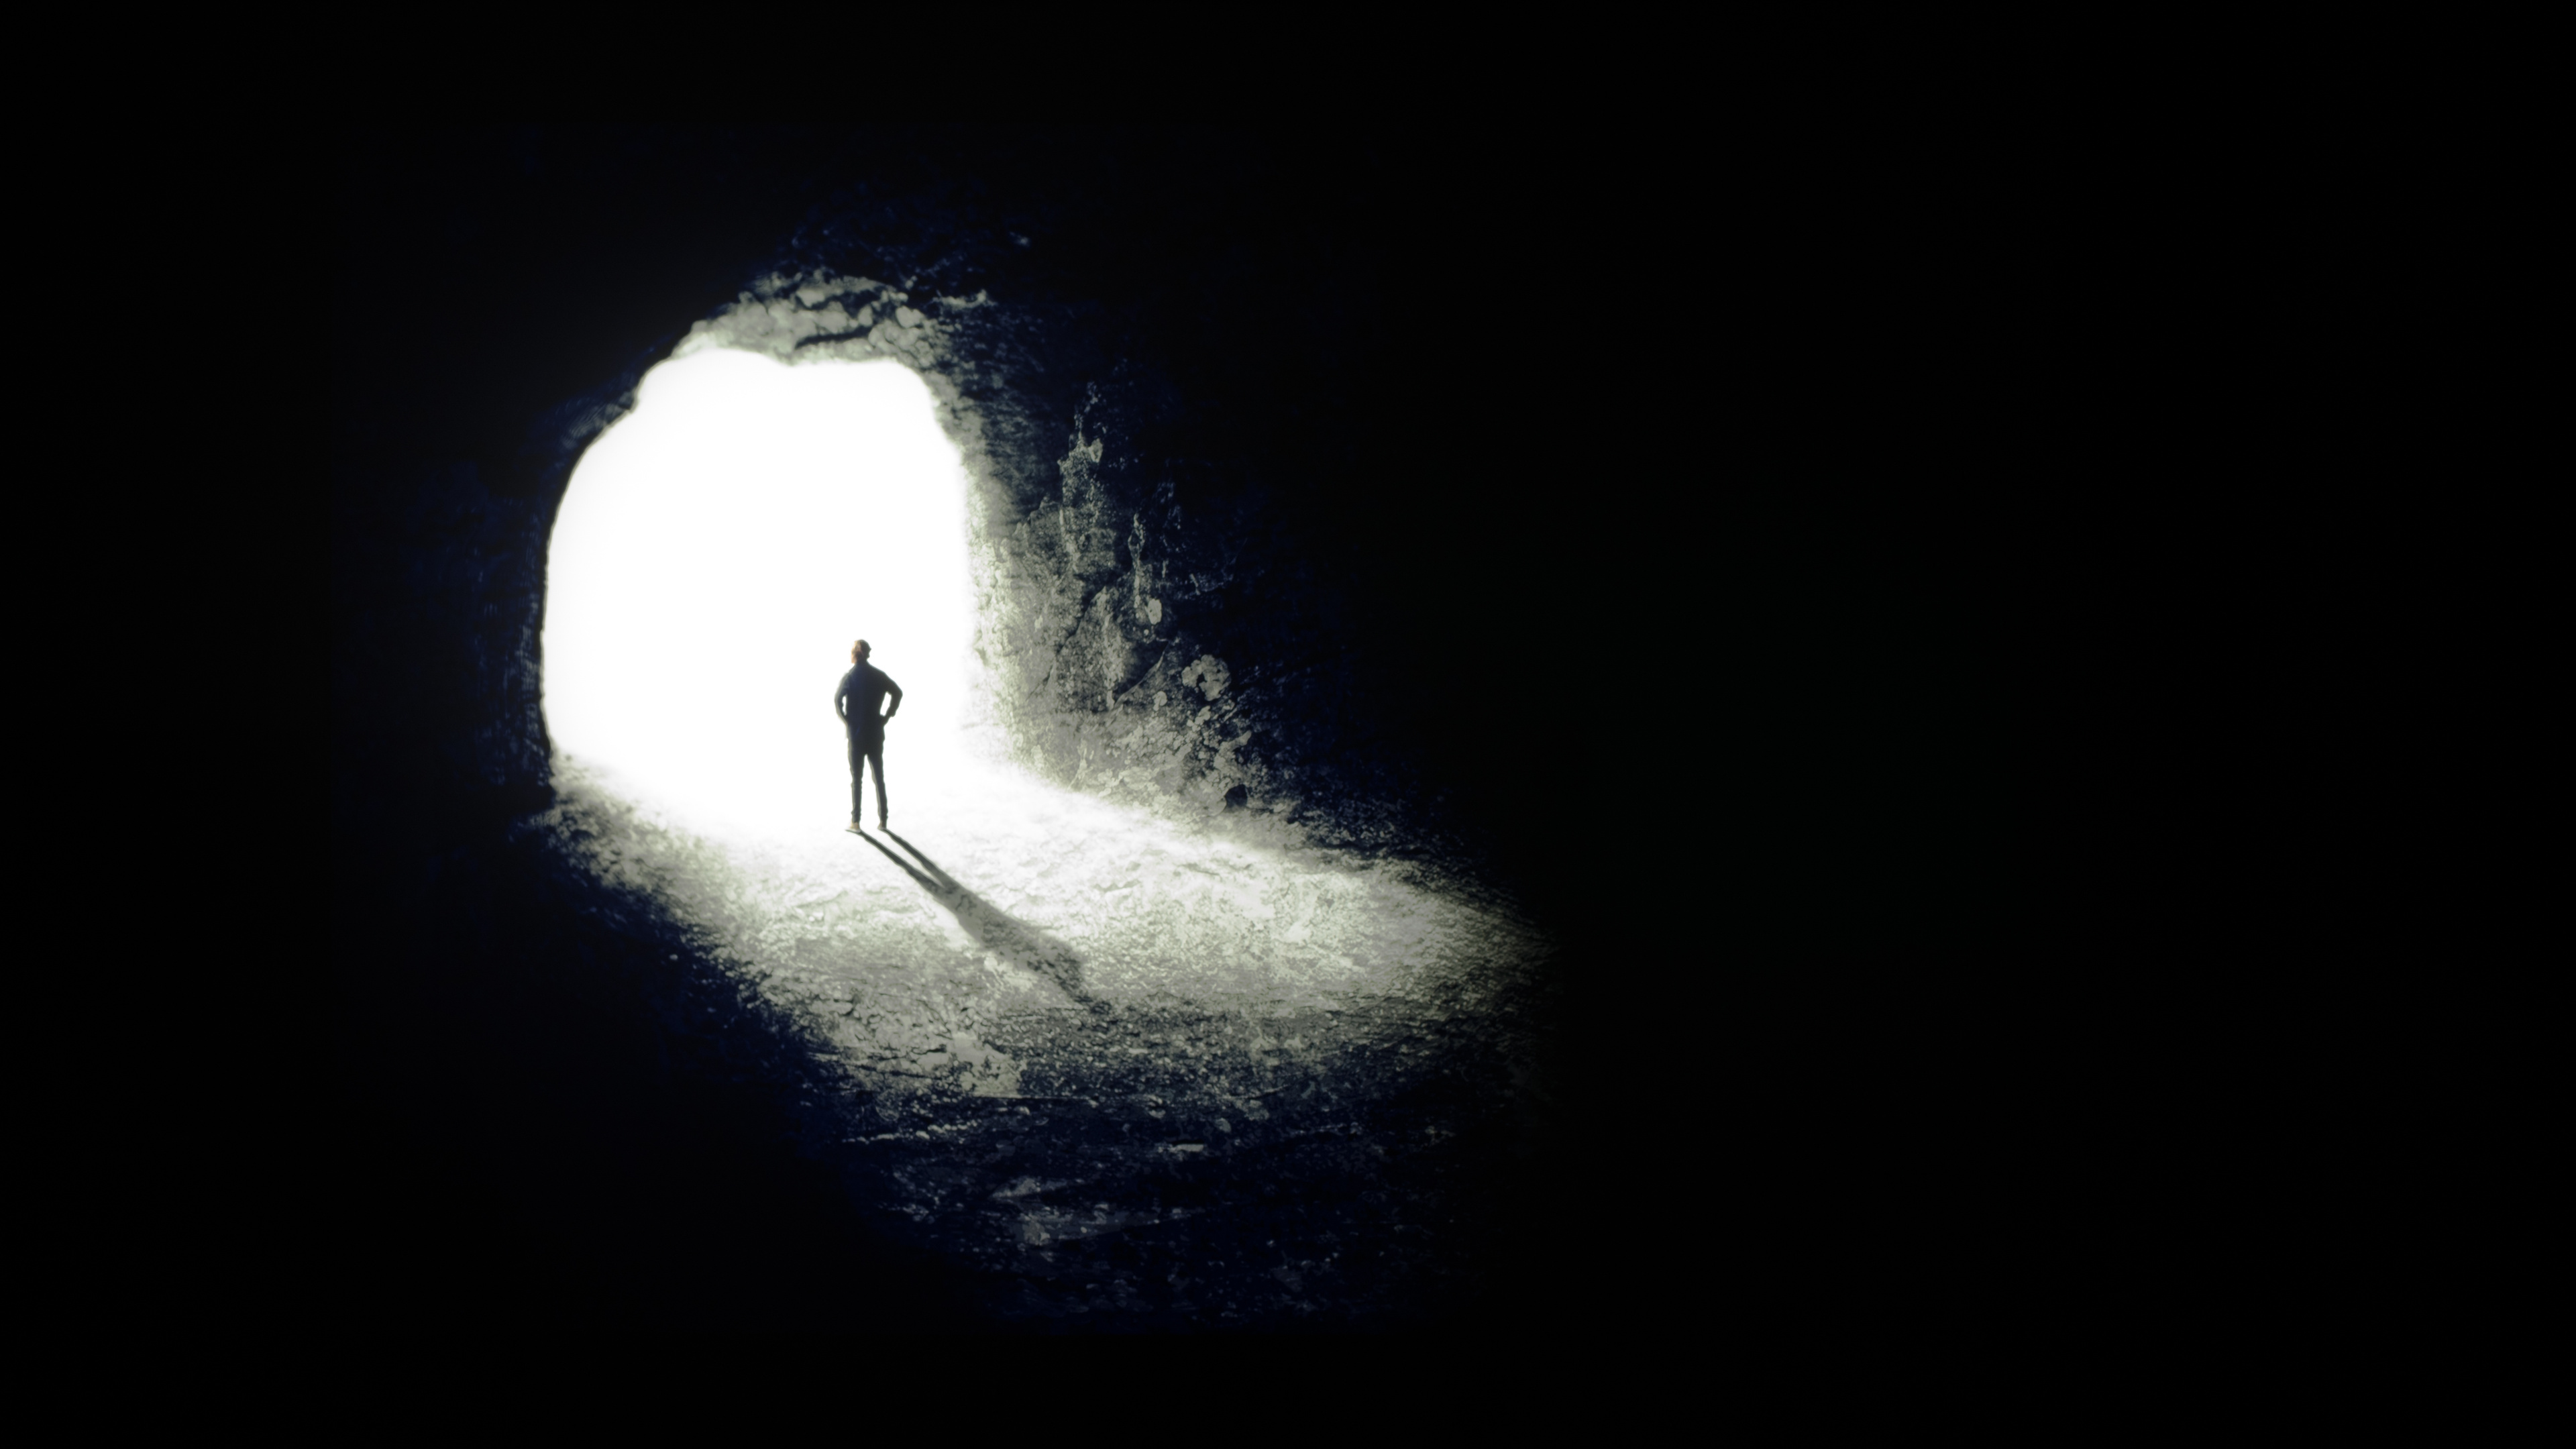
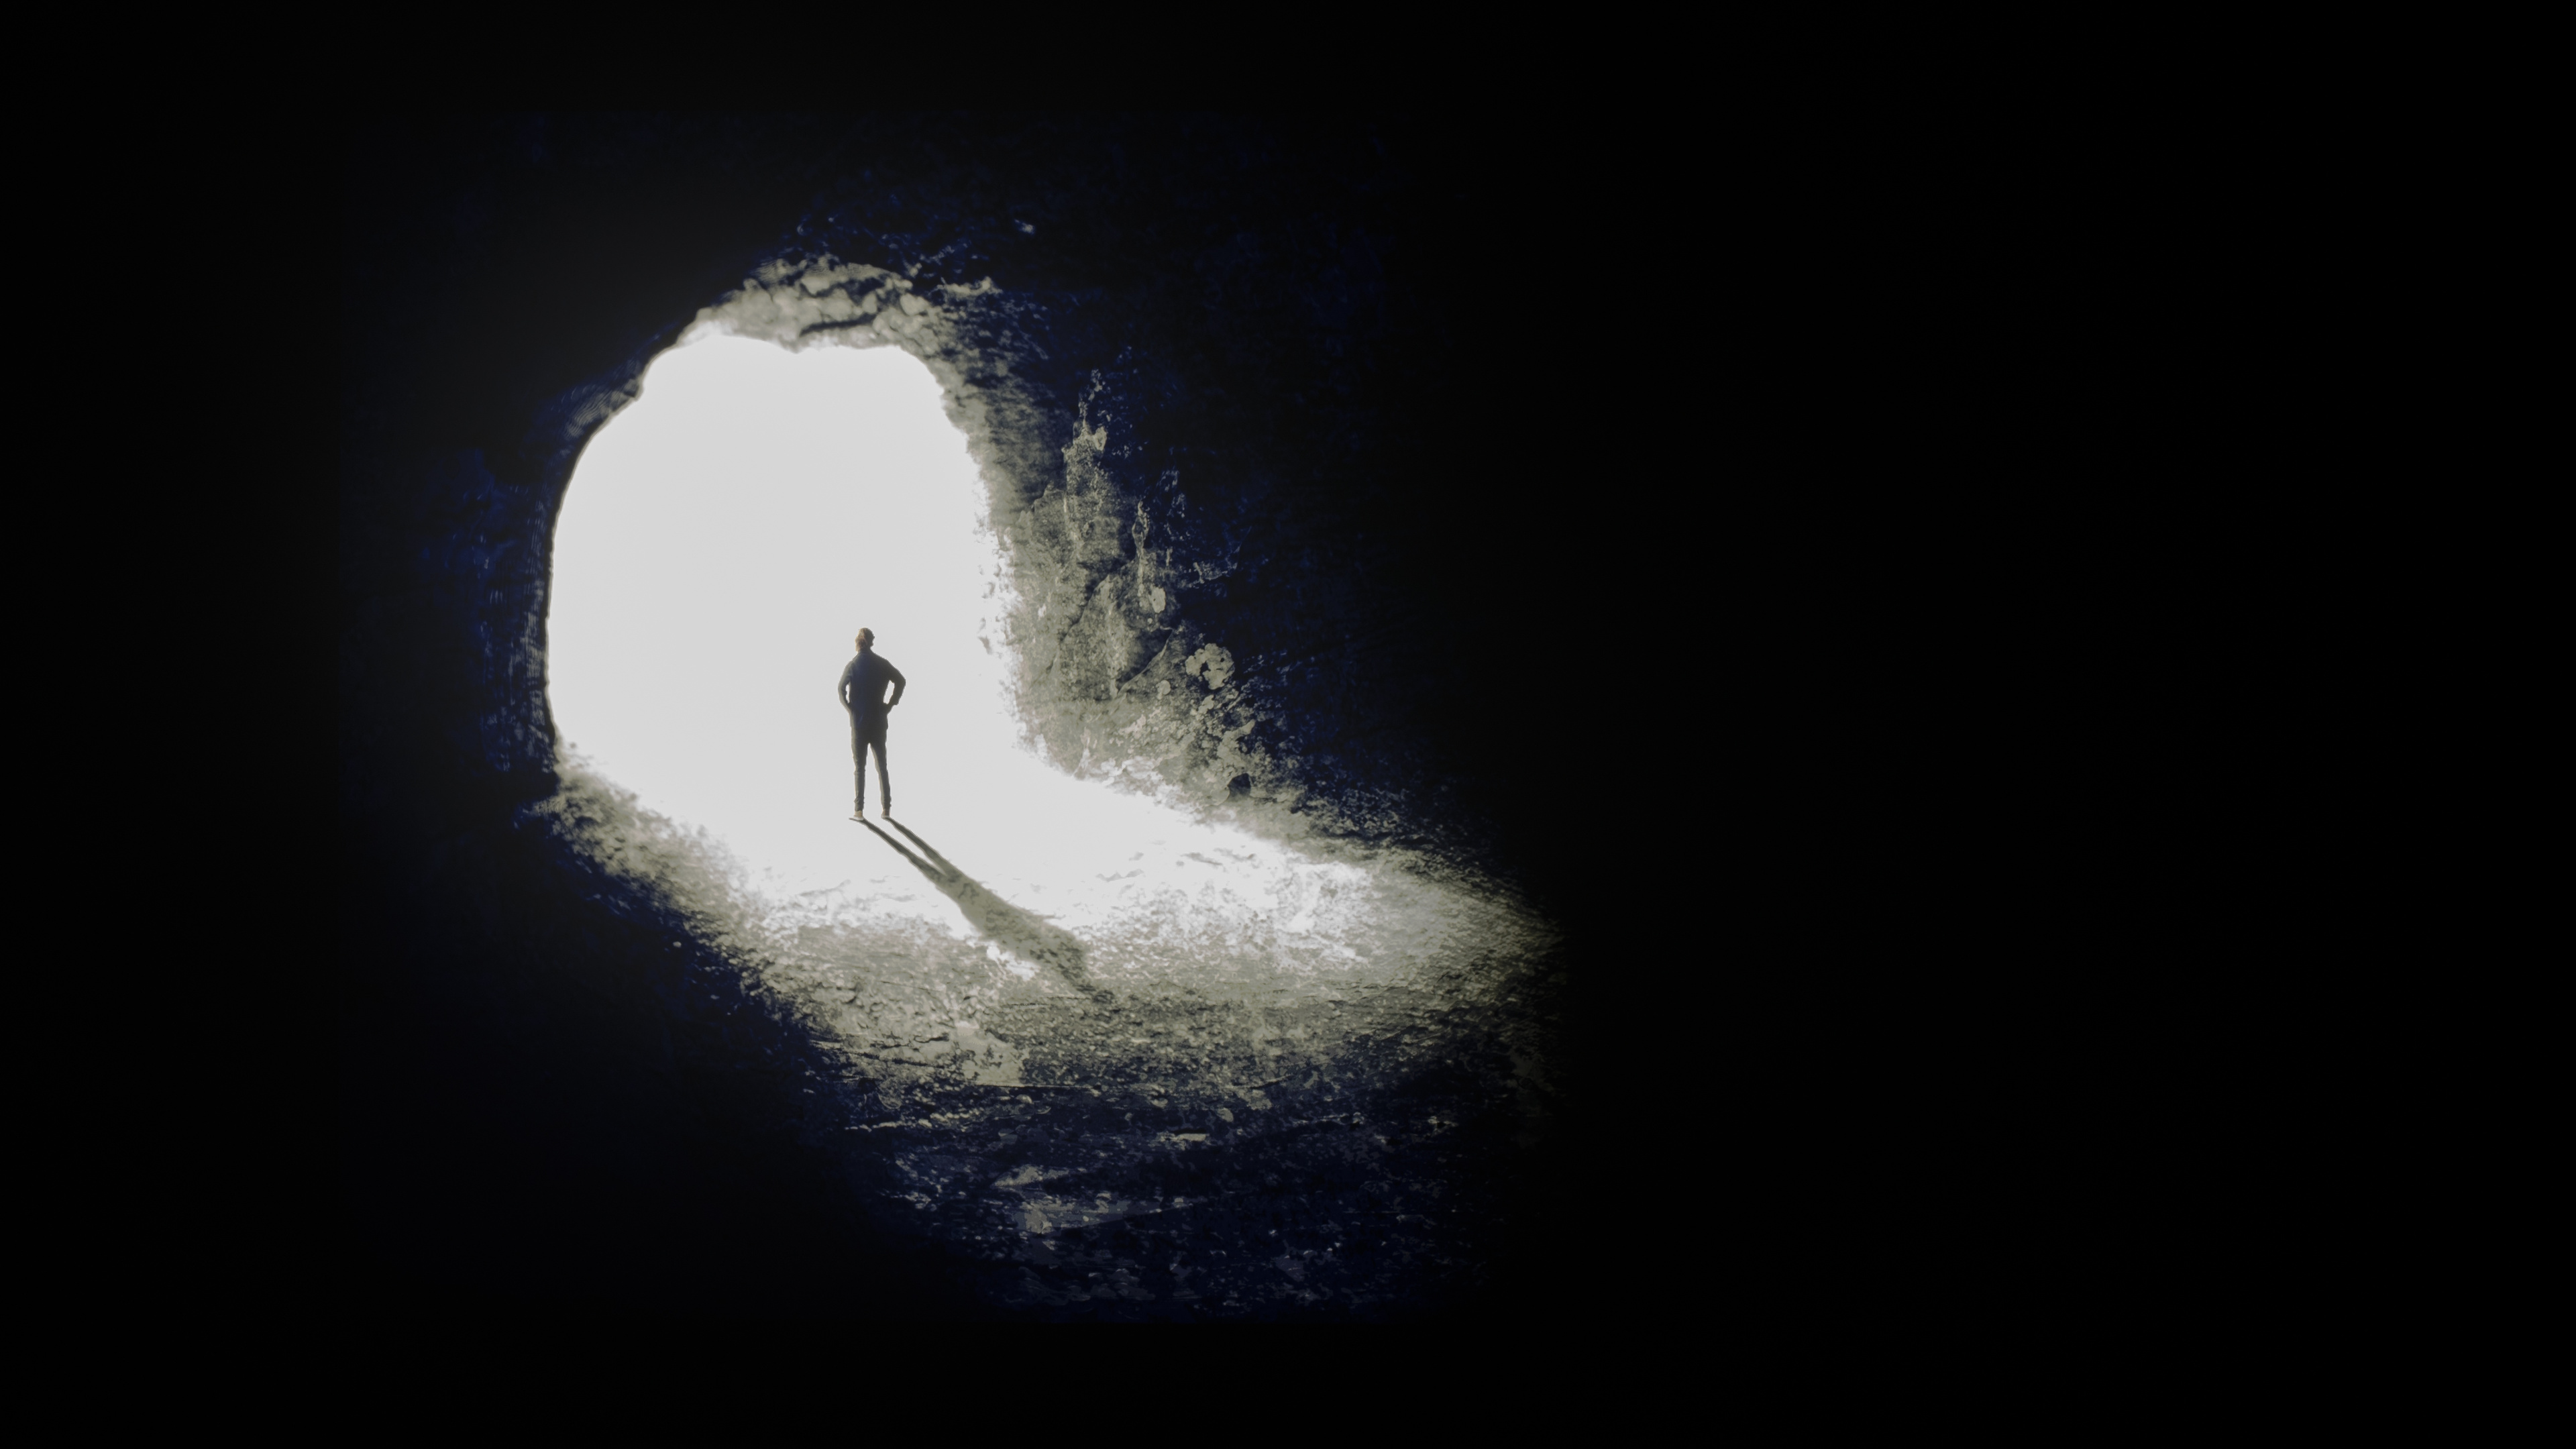
A display's contrast ratio shows the ratio between the darkest black a display can produce and the luminance of the brightest white. The higher the contrast ratio, the deeper the blacks appear while simultaneously highlighting bright elements. Our contrast test is conducted with the center of the cave set as close to 200 nits as possible, which gives us the white luminance measurement for our calculation. The lowest black reading we obtain is based on an average of four measurements. If you want to learn more about the specific way we measure contrast, check out our in-depth Contrast Ratio article. Let's examine the numbers we measured for each size.
| TV Size | White Level (nits) | Lowest Average Black Level (nits) | Contrast Ratio |
|---|---|---|---|
| 65" | 344.3 | 0.00075 | 459,067 : 1 |
| 100" | 297.5 | 0.001 | 297,450 : 1 |
Looking at these results, you might think that the 65-inch model has significantly better contrast, but that's not really the case. The lowest average black level on each TV is nearly identical, so the difference in contrast largely comes down to the white floor. Normally, this test is conducted with the cave set as close as possible to 200 nits; however, this wasn't possible on either TV, even with the best settings. In most real content, the darker parts of the scene won't be purely black, and these two TVs perform roughly the same.
Dimming Zone Precision
| Hisense 100U8QG | Hisense 65U8QG |
|---|---|
 |
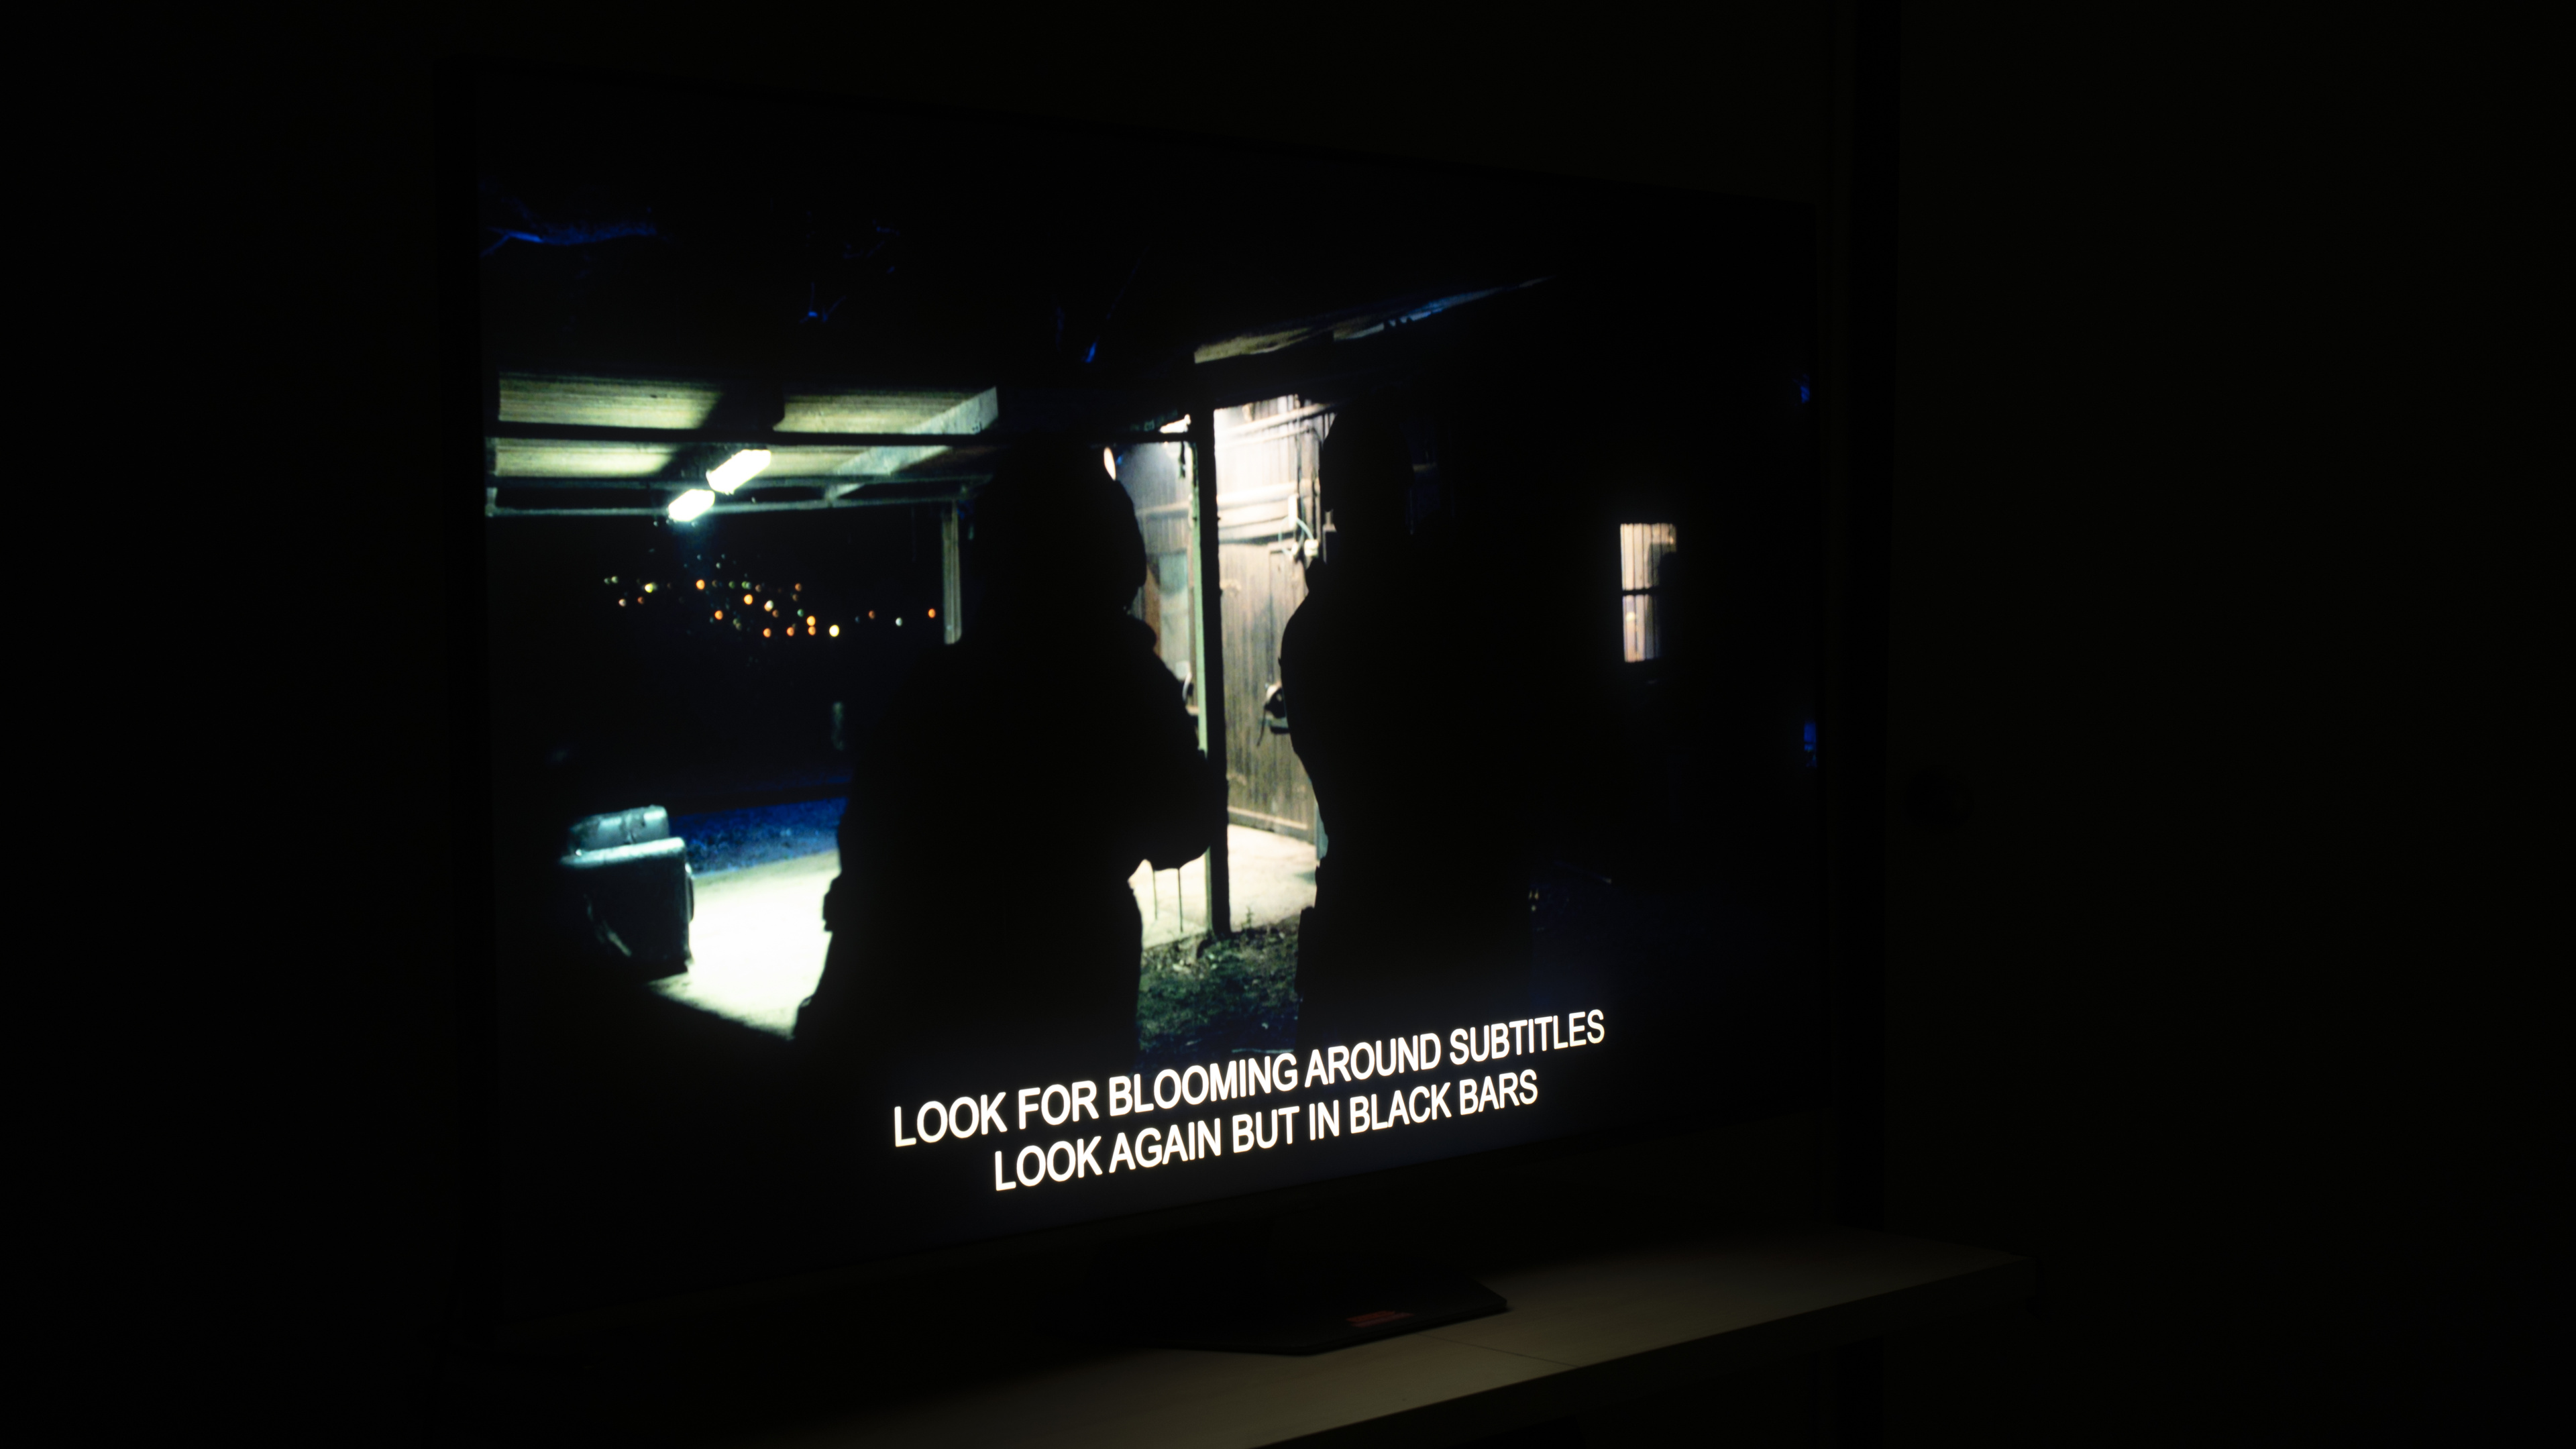 |
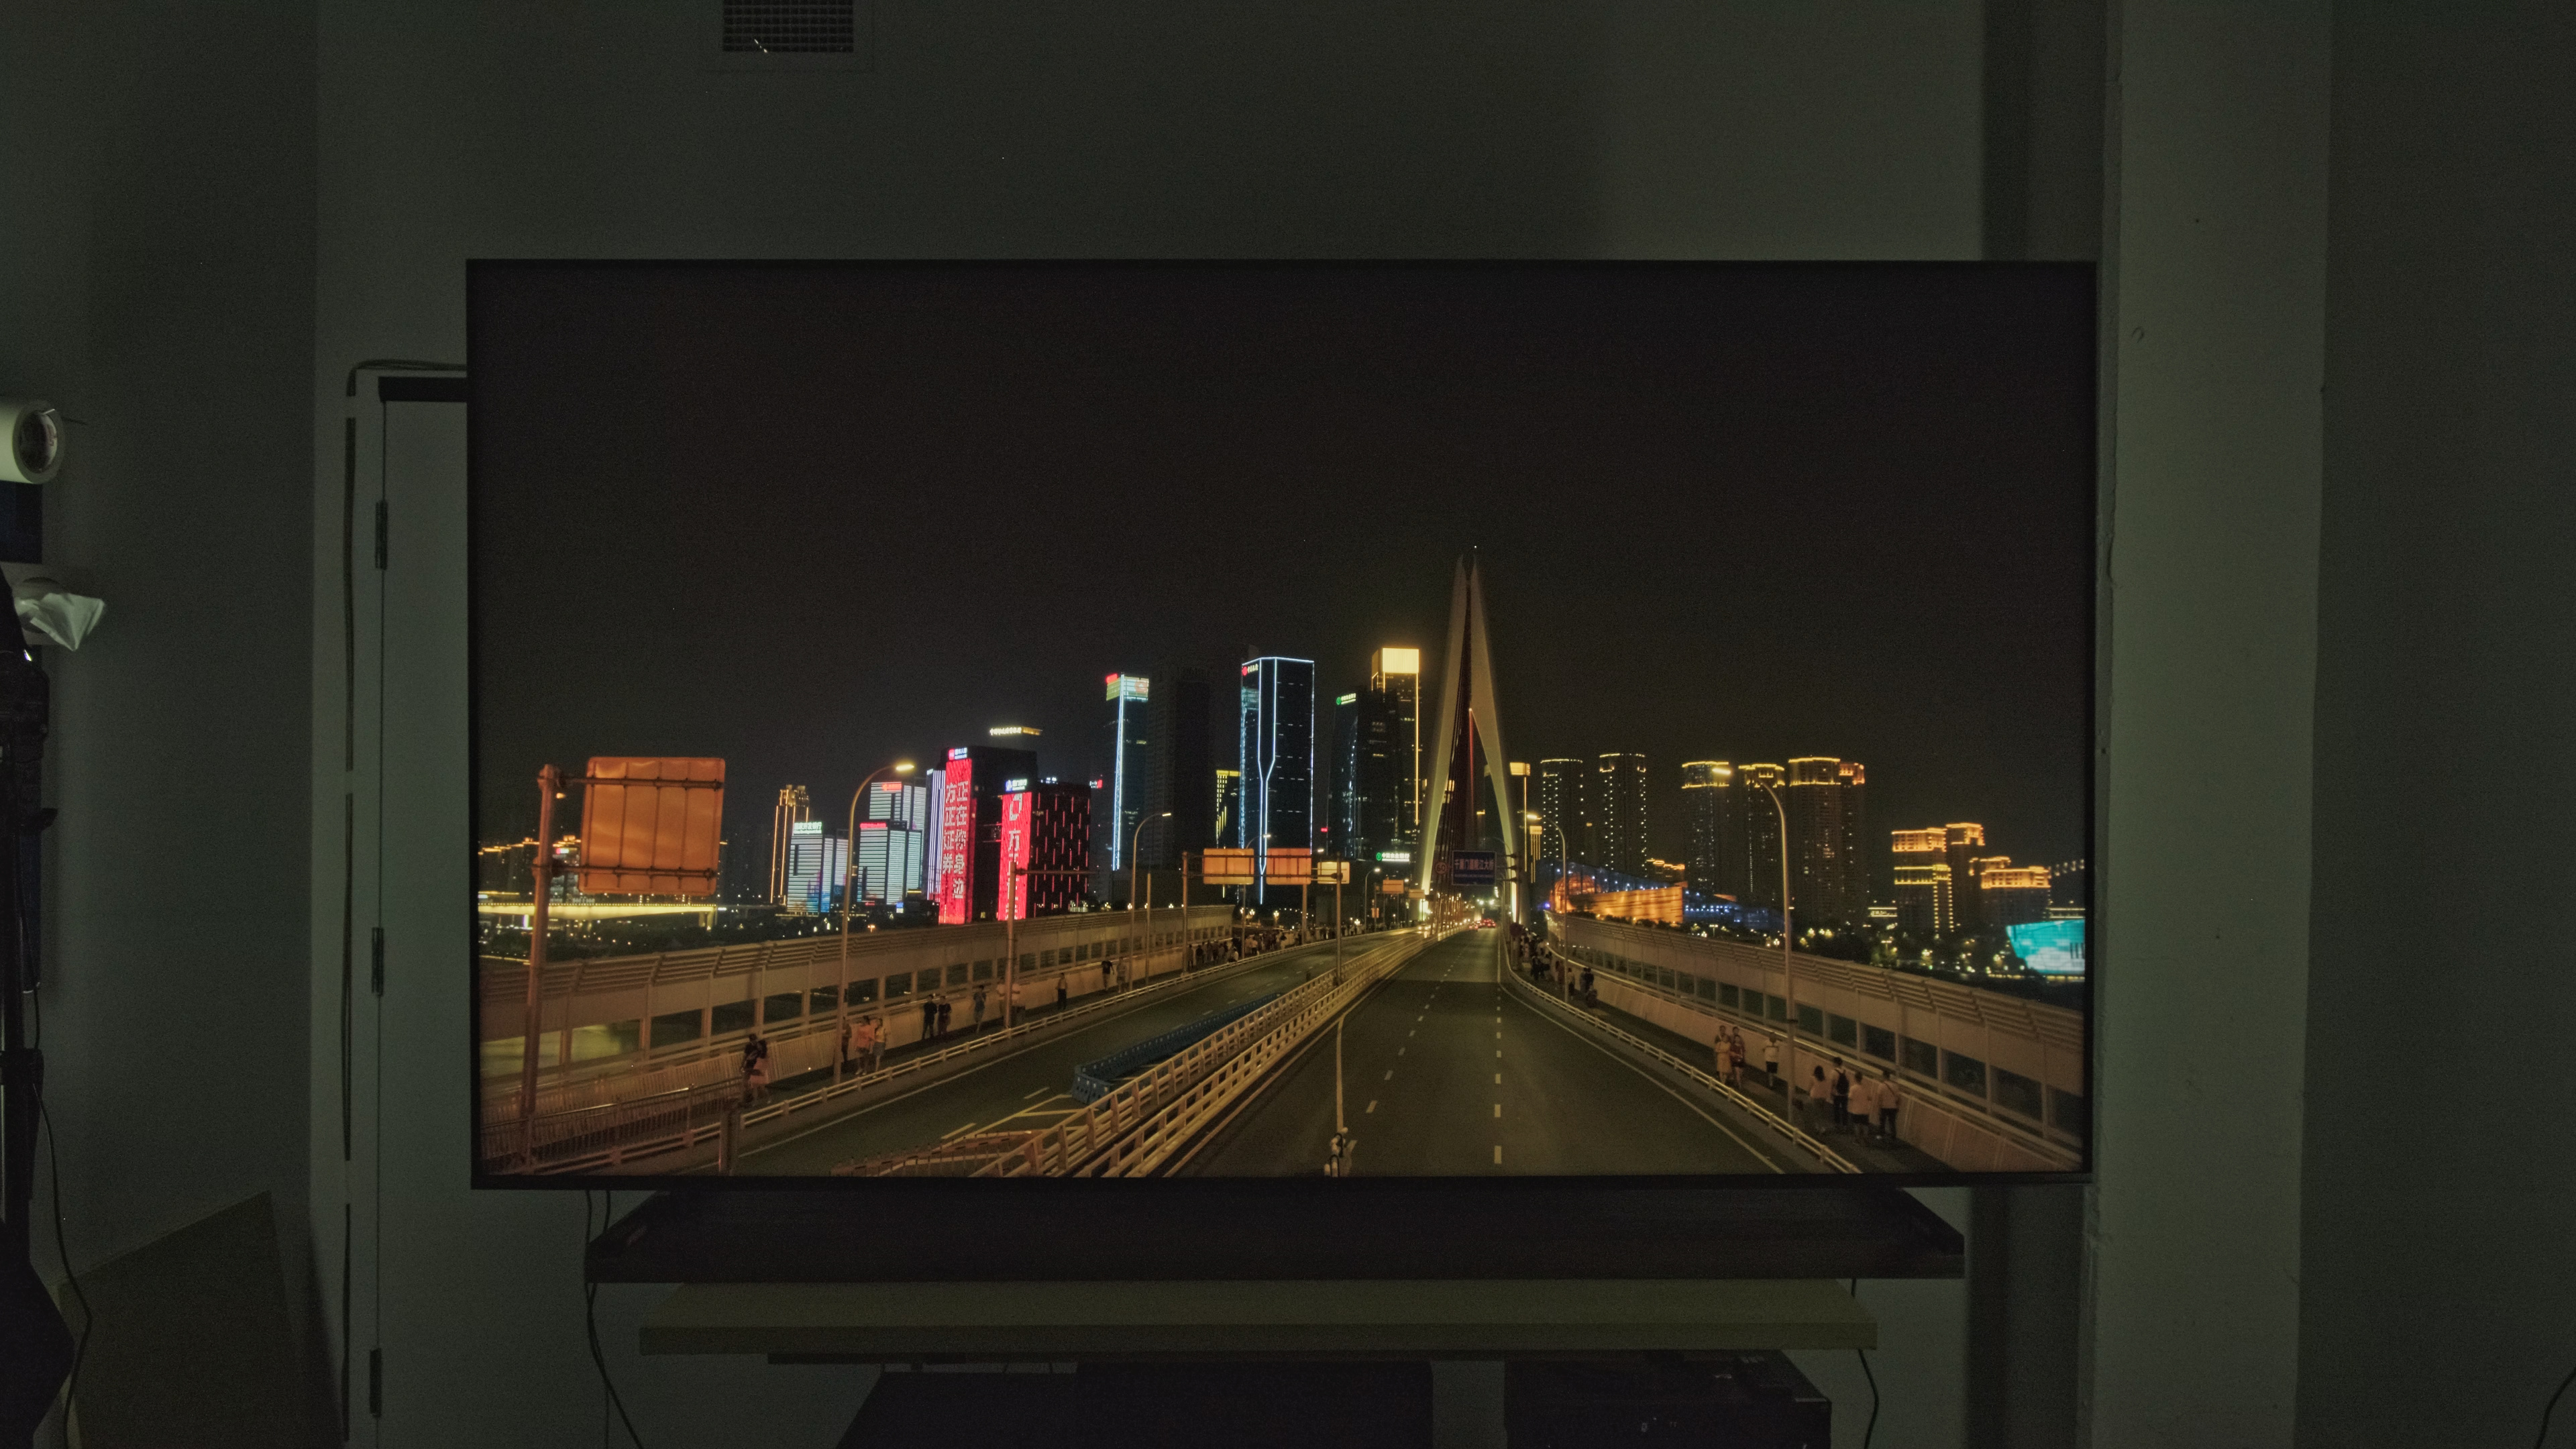
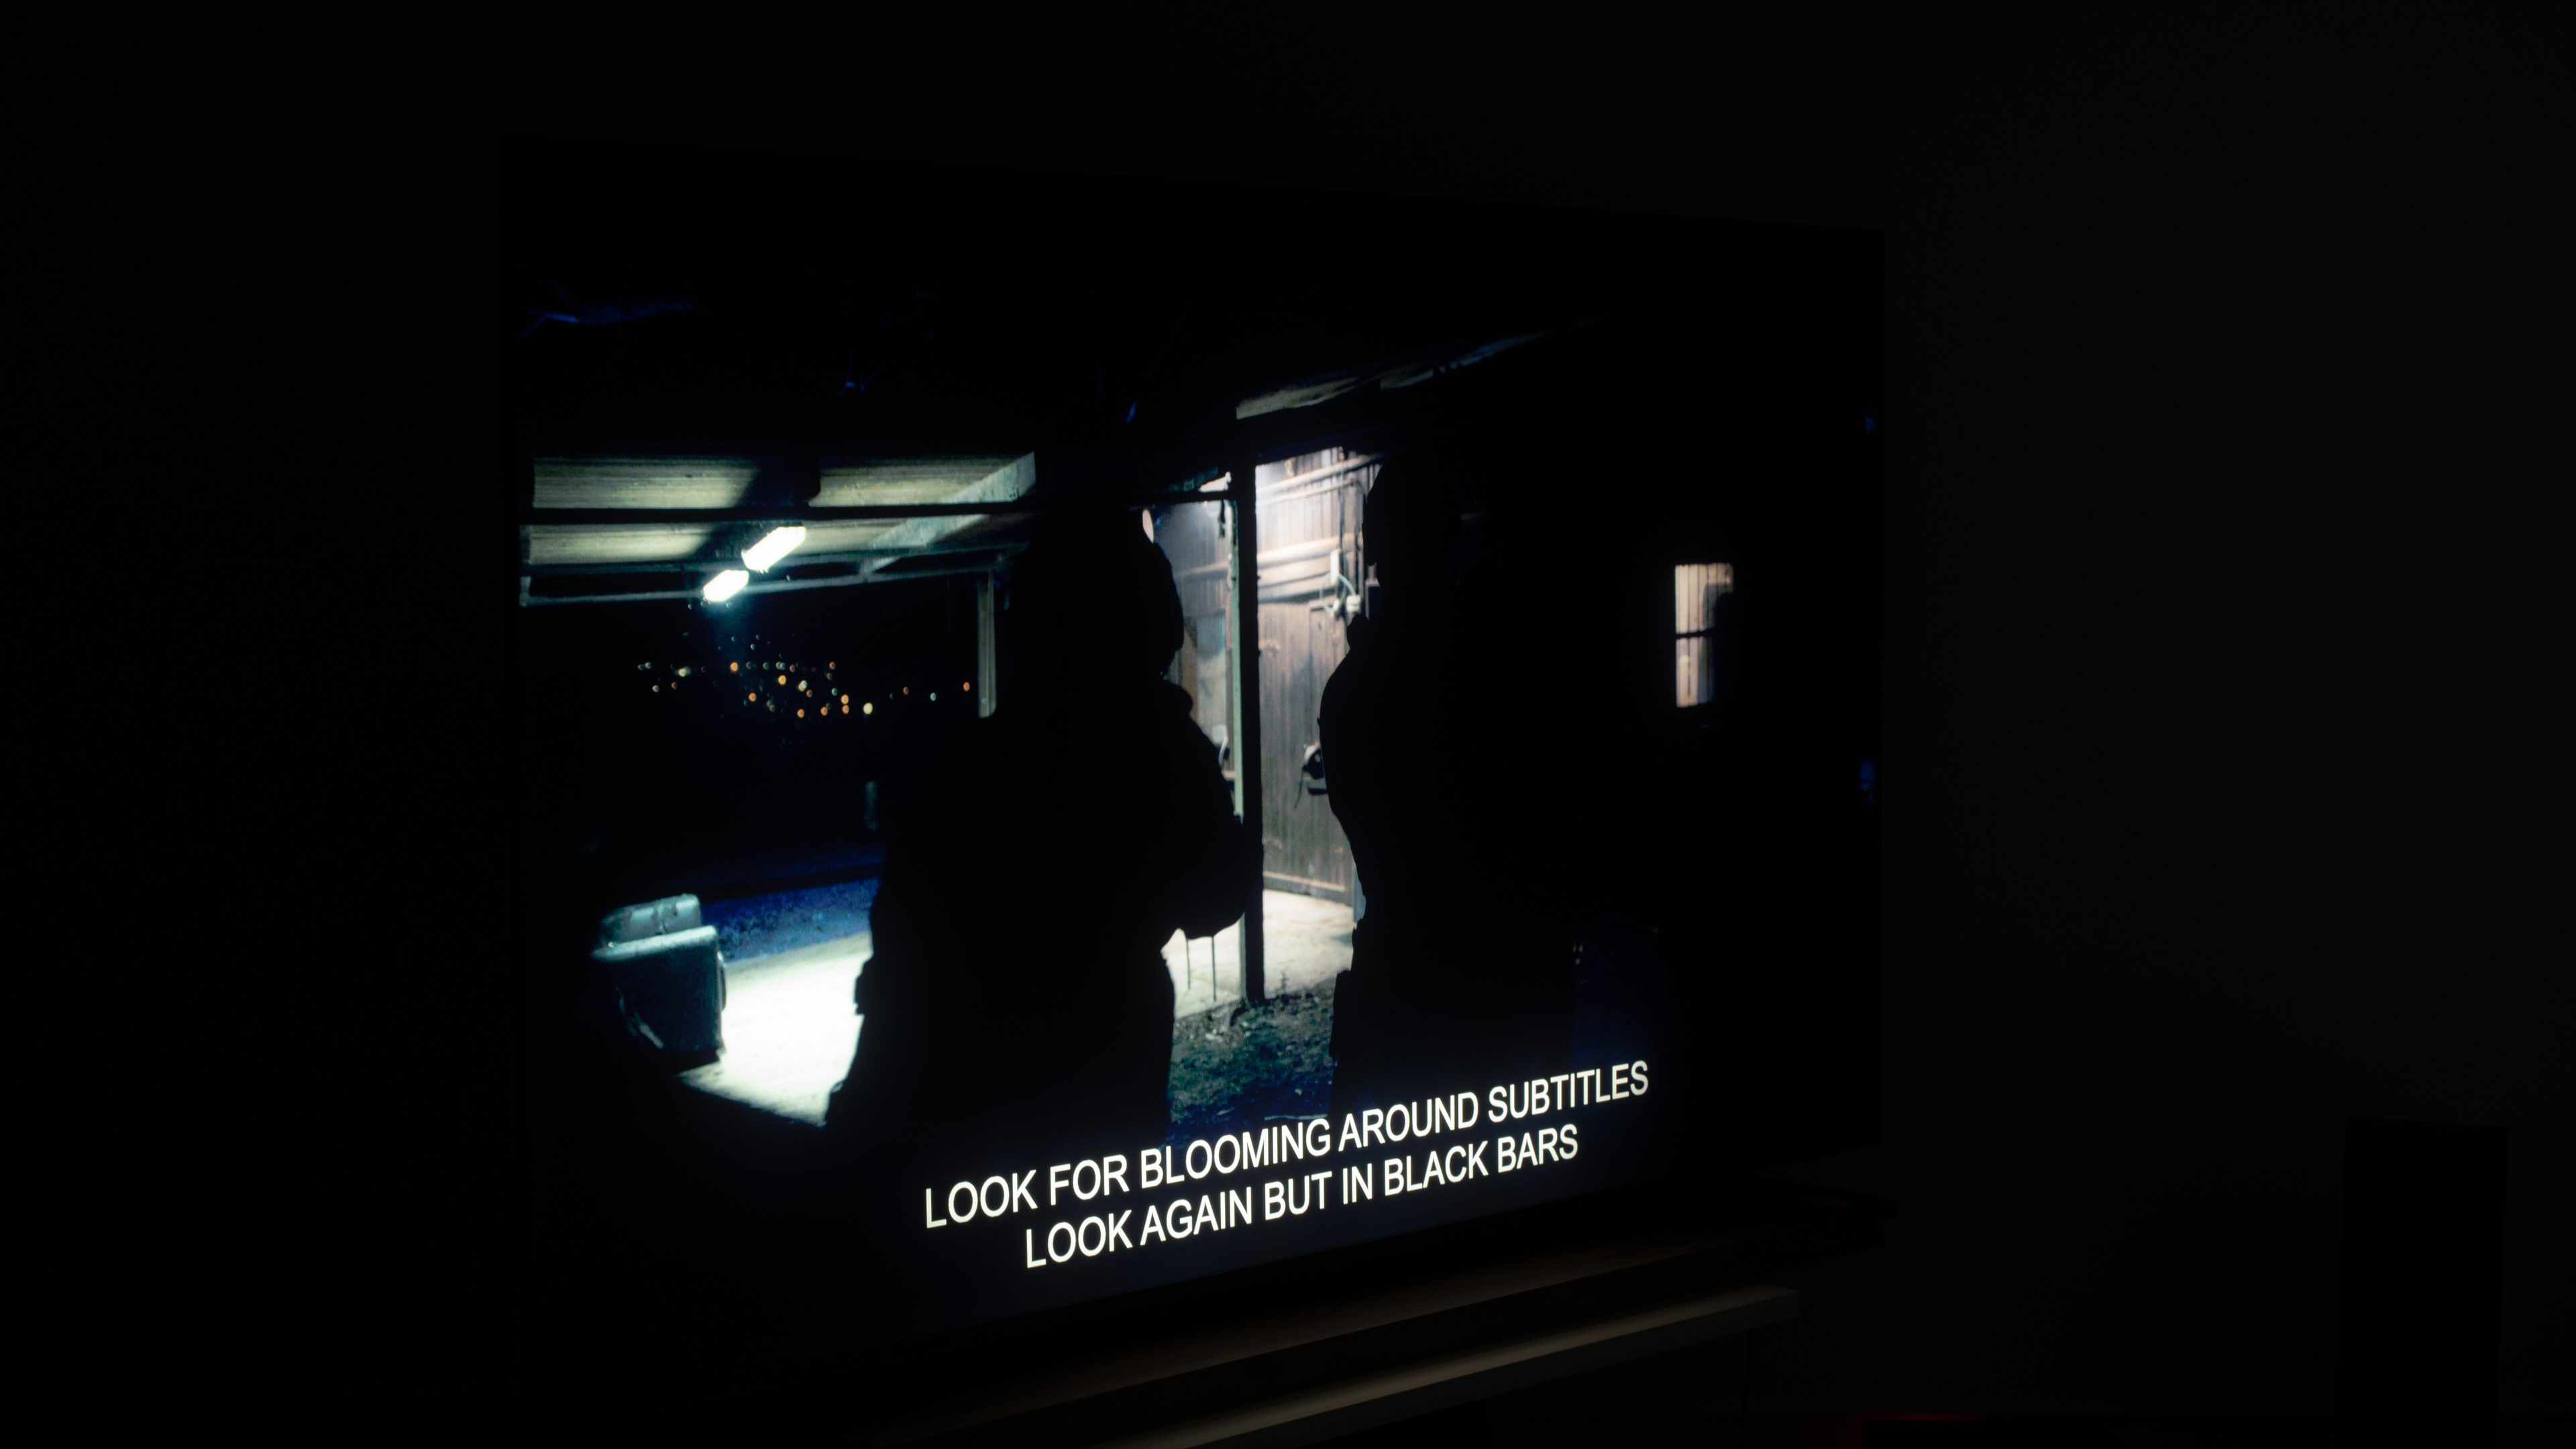
Contrast isn't the only thing that impacts a TV's overall black levels. Our lighting zone precision test examines how precisely a TV can dim the dark areas of an image surrounding highlights. If a TV performs poorly in this regard, the highlights will bleed into the dark areas, which can be distracting and affect the depth of blacks surrounding the highlights. The precision of zones is mostly determined by two things: the local dimming algorithm and the number of dimming zones a TV has. Let's break down the number of dimming zones and other key measurements for each TV size.
| TV Size | Zones | Pixels per Zone | Zone Size (in²) | Pixels per in² per Zone |
| 65" | 2,048 | 4,050 | 0.9" | 4,500 |
| 100" | 5,376 | 1,542 | 0.8" | 1,927 |
As you can see, Hisense has packed an impressive number of local dimming zones into this TV, and they've kept each zone roughly the same physical size on the two sizes. The pixels on the 100-inch model are significantly larger, however, so this translates to far fewer pixels in each zone on the larger size. In theory, this should result in significantly better local dimming performance; however, it turns out that the algorithms controlling these zones are more important than the raw number of zones. The 100U8QG is averaging bright highlights across more zones than it needs to, and the end result is roughly similar dimming zone performance between the two sizes.
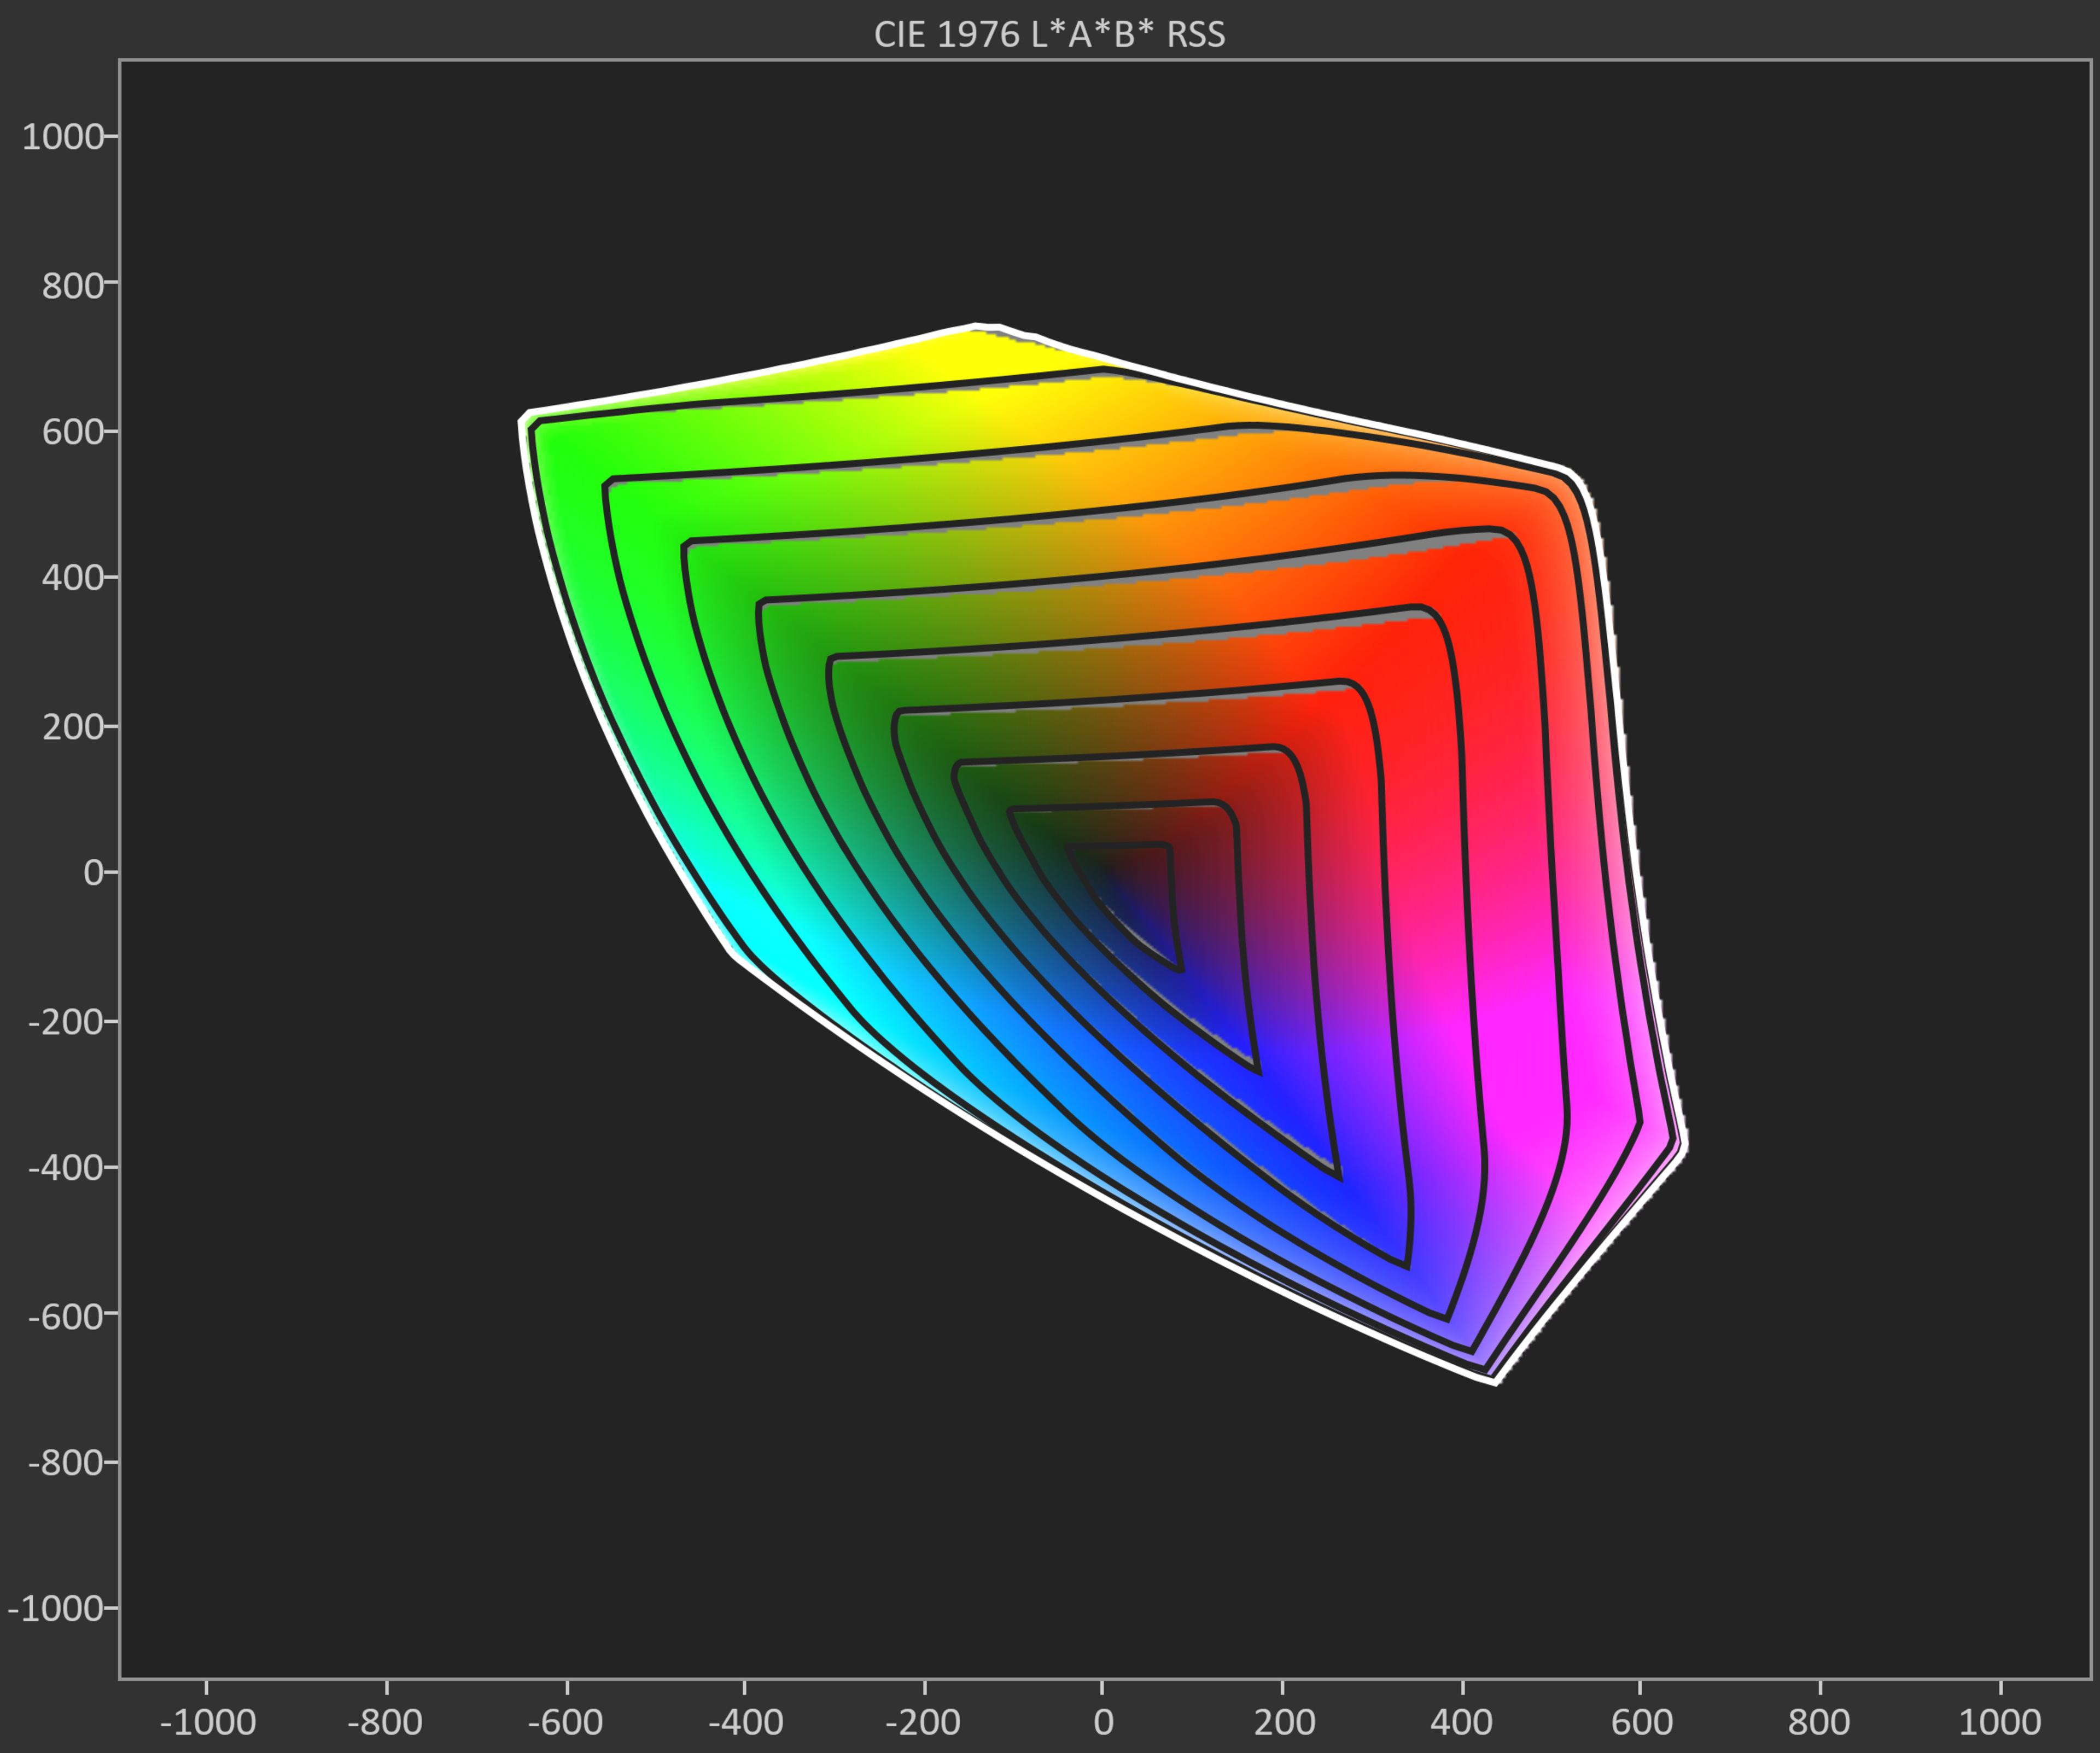
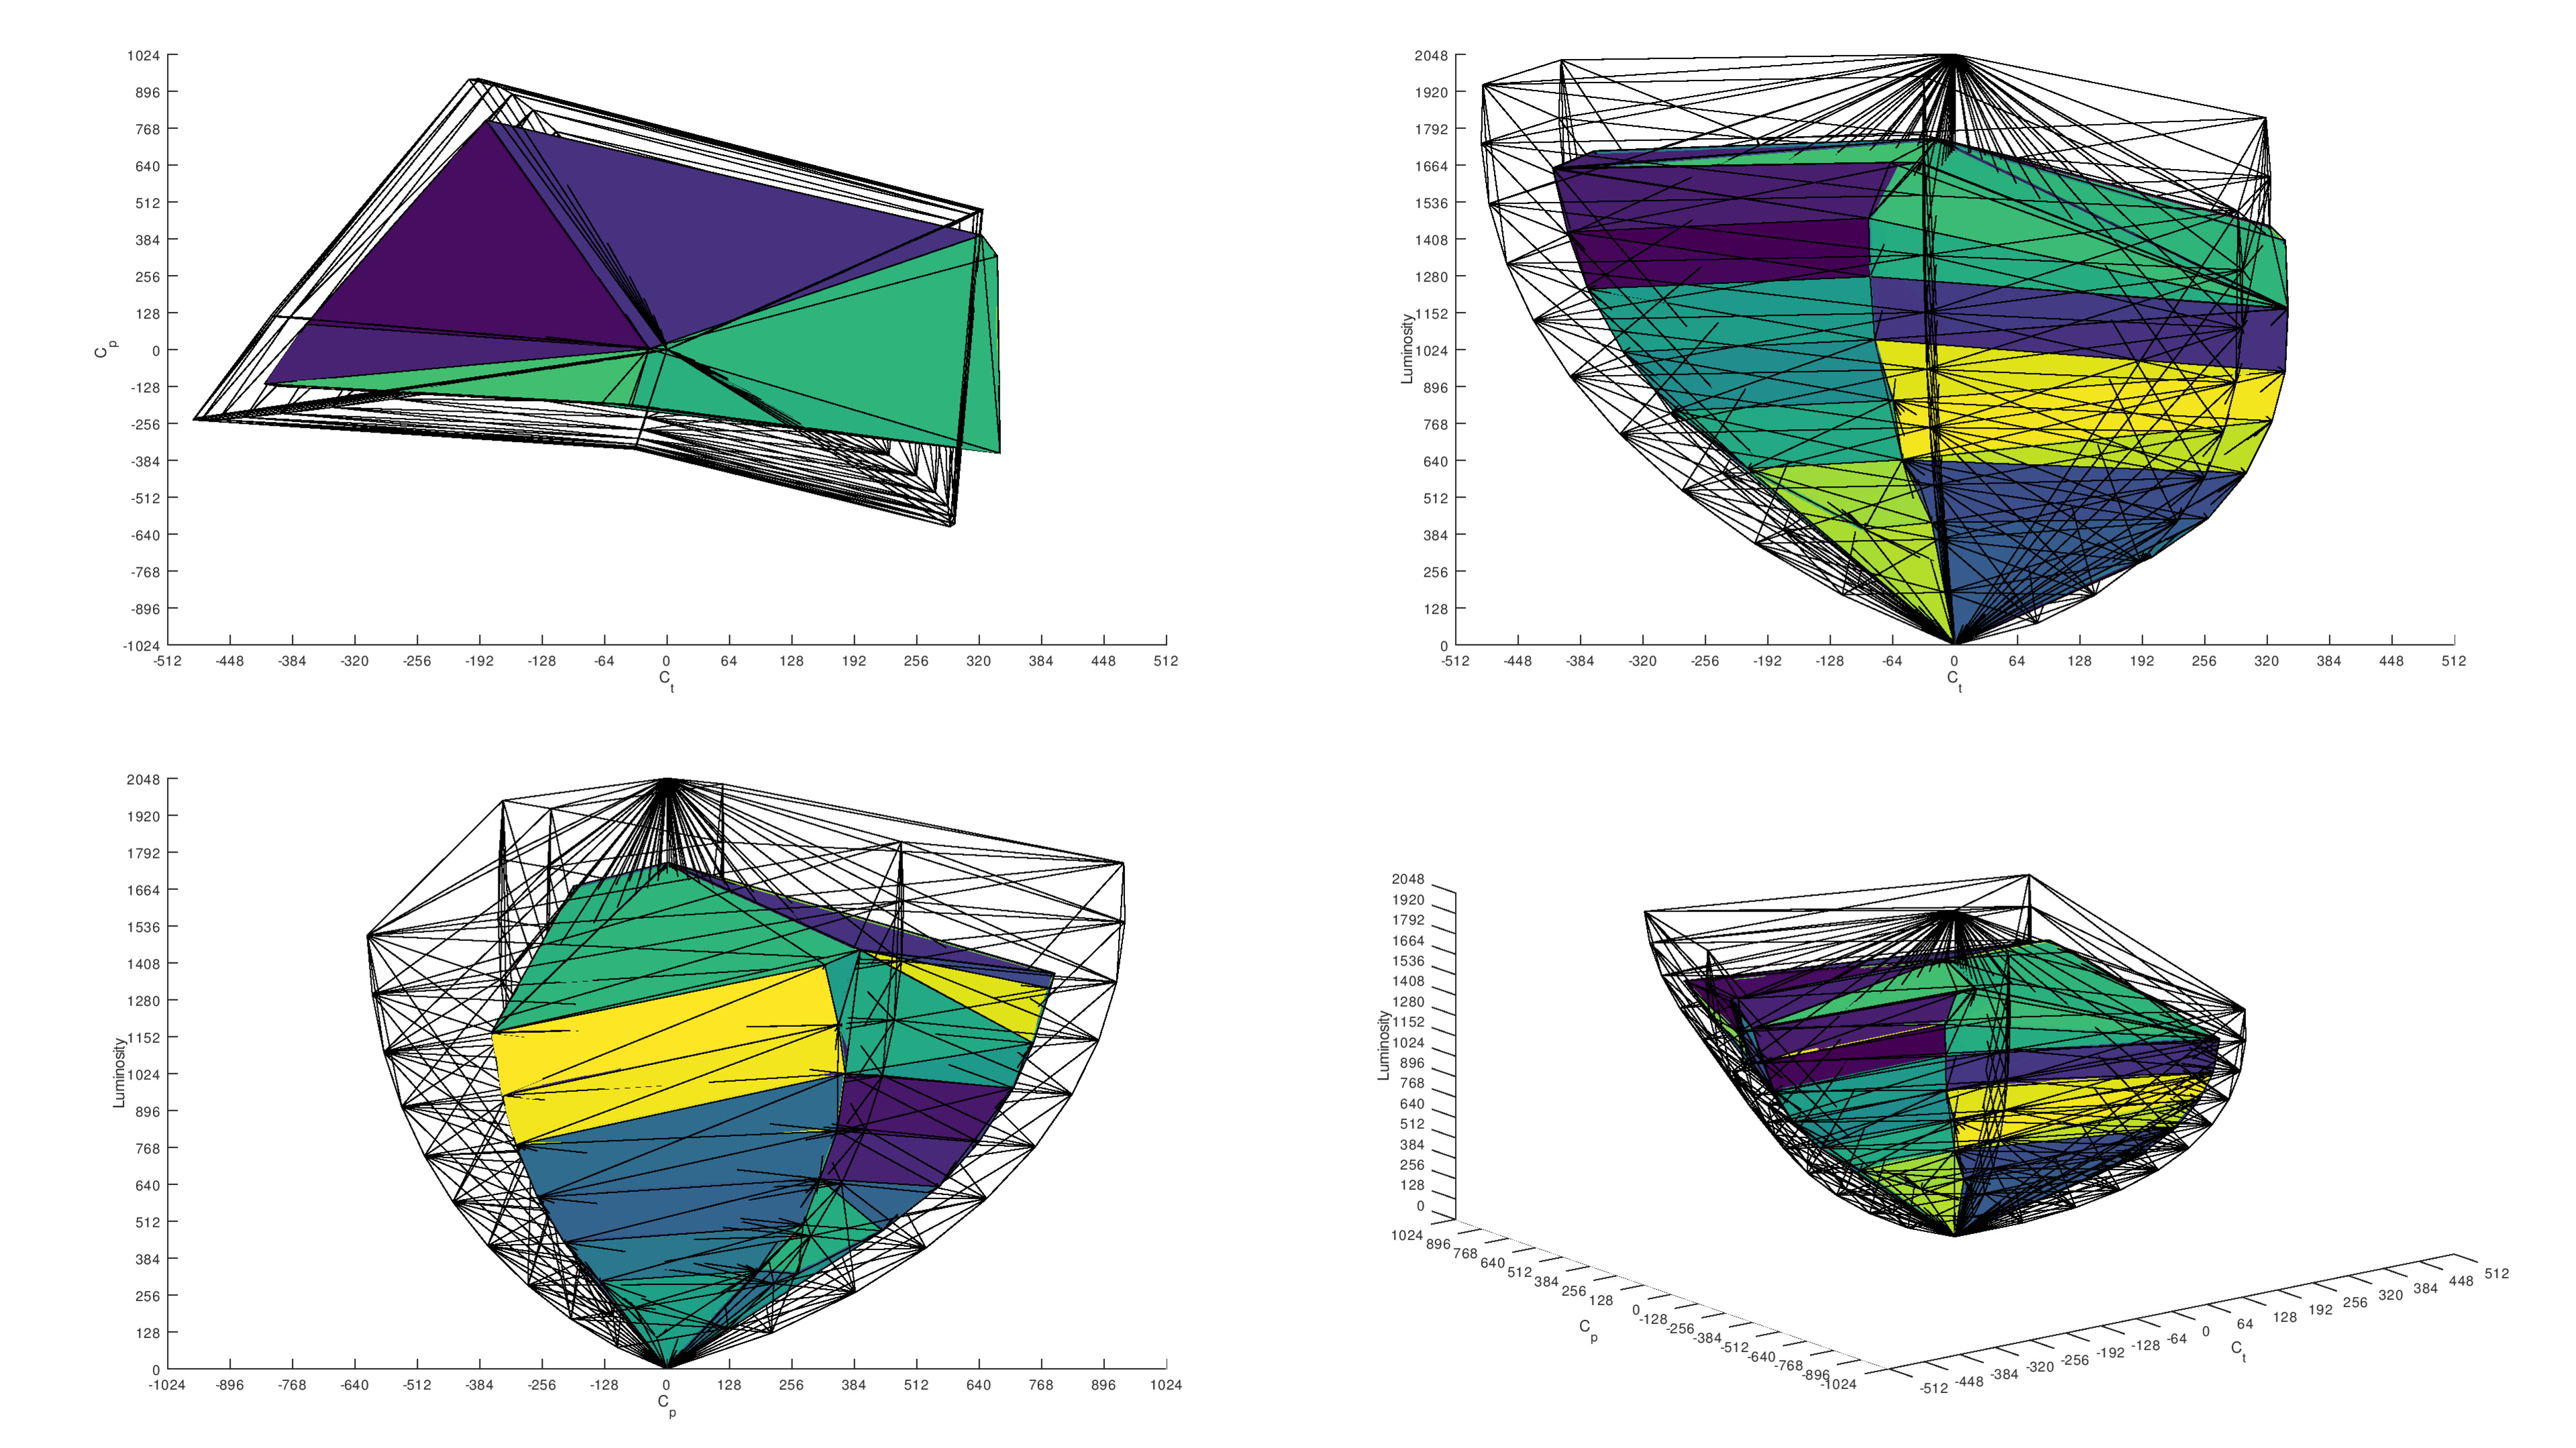
Color Volume
| Hisense 100U8QG | Hisense 65U8QG |
|---|---|
 |
 |
 |
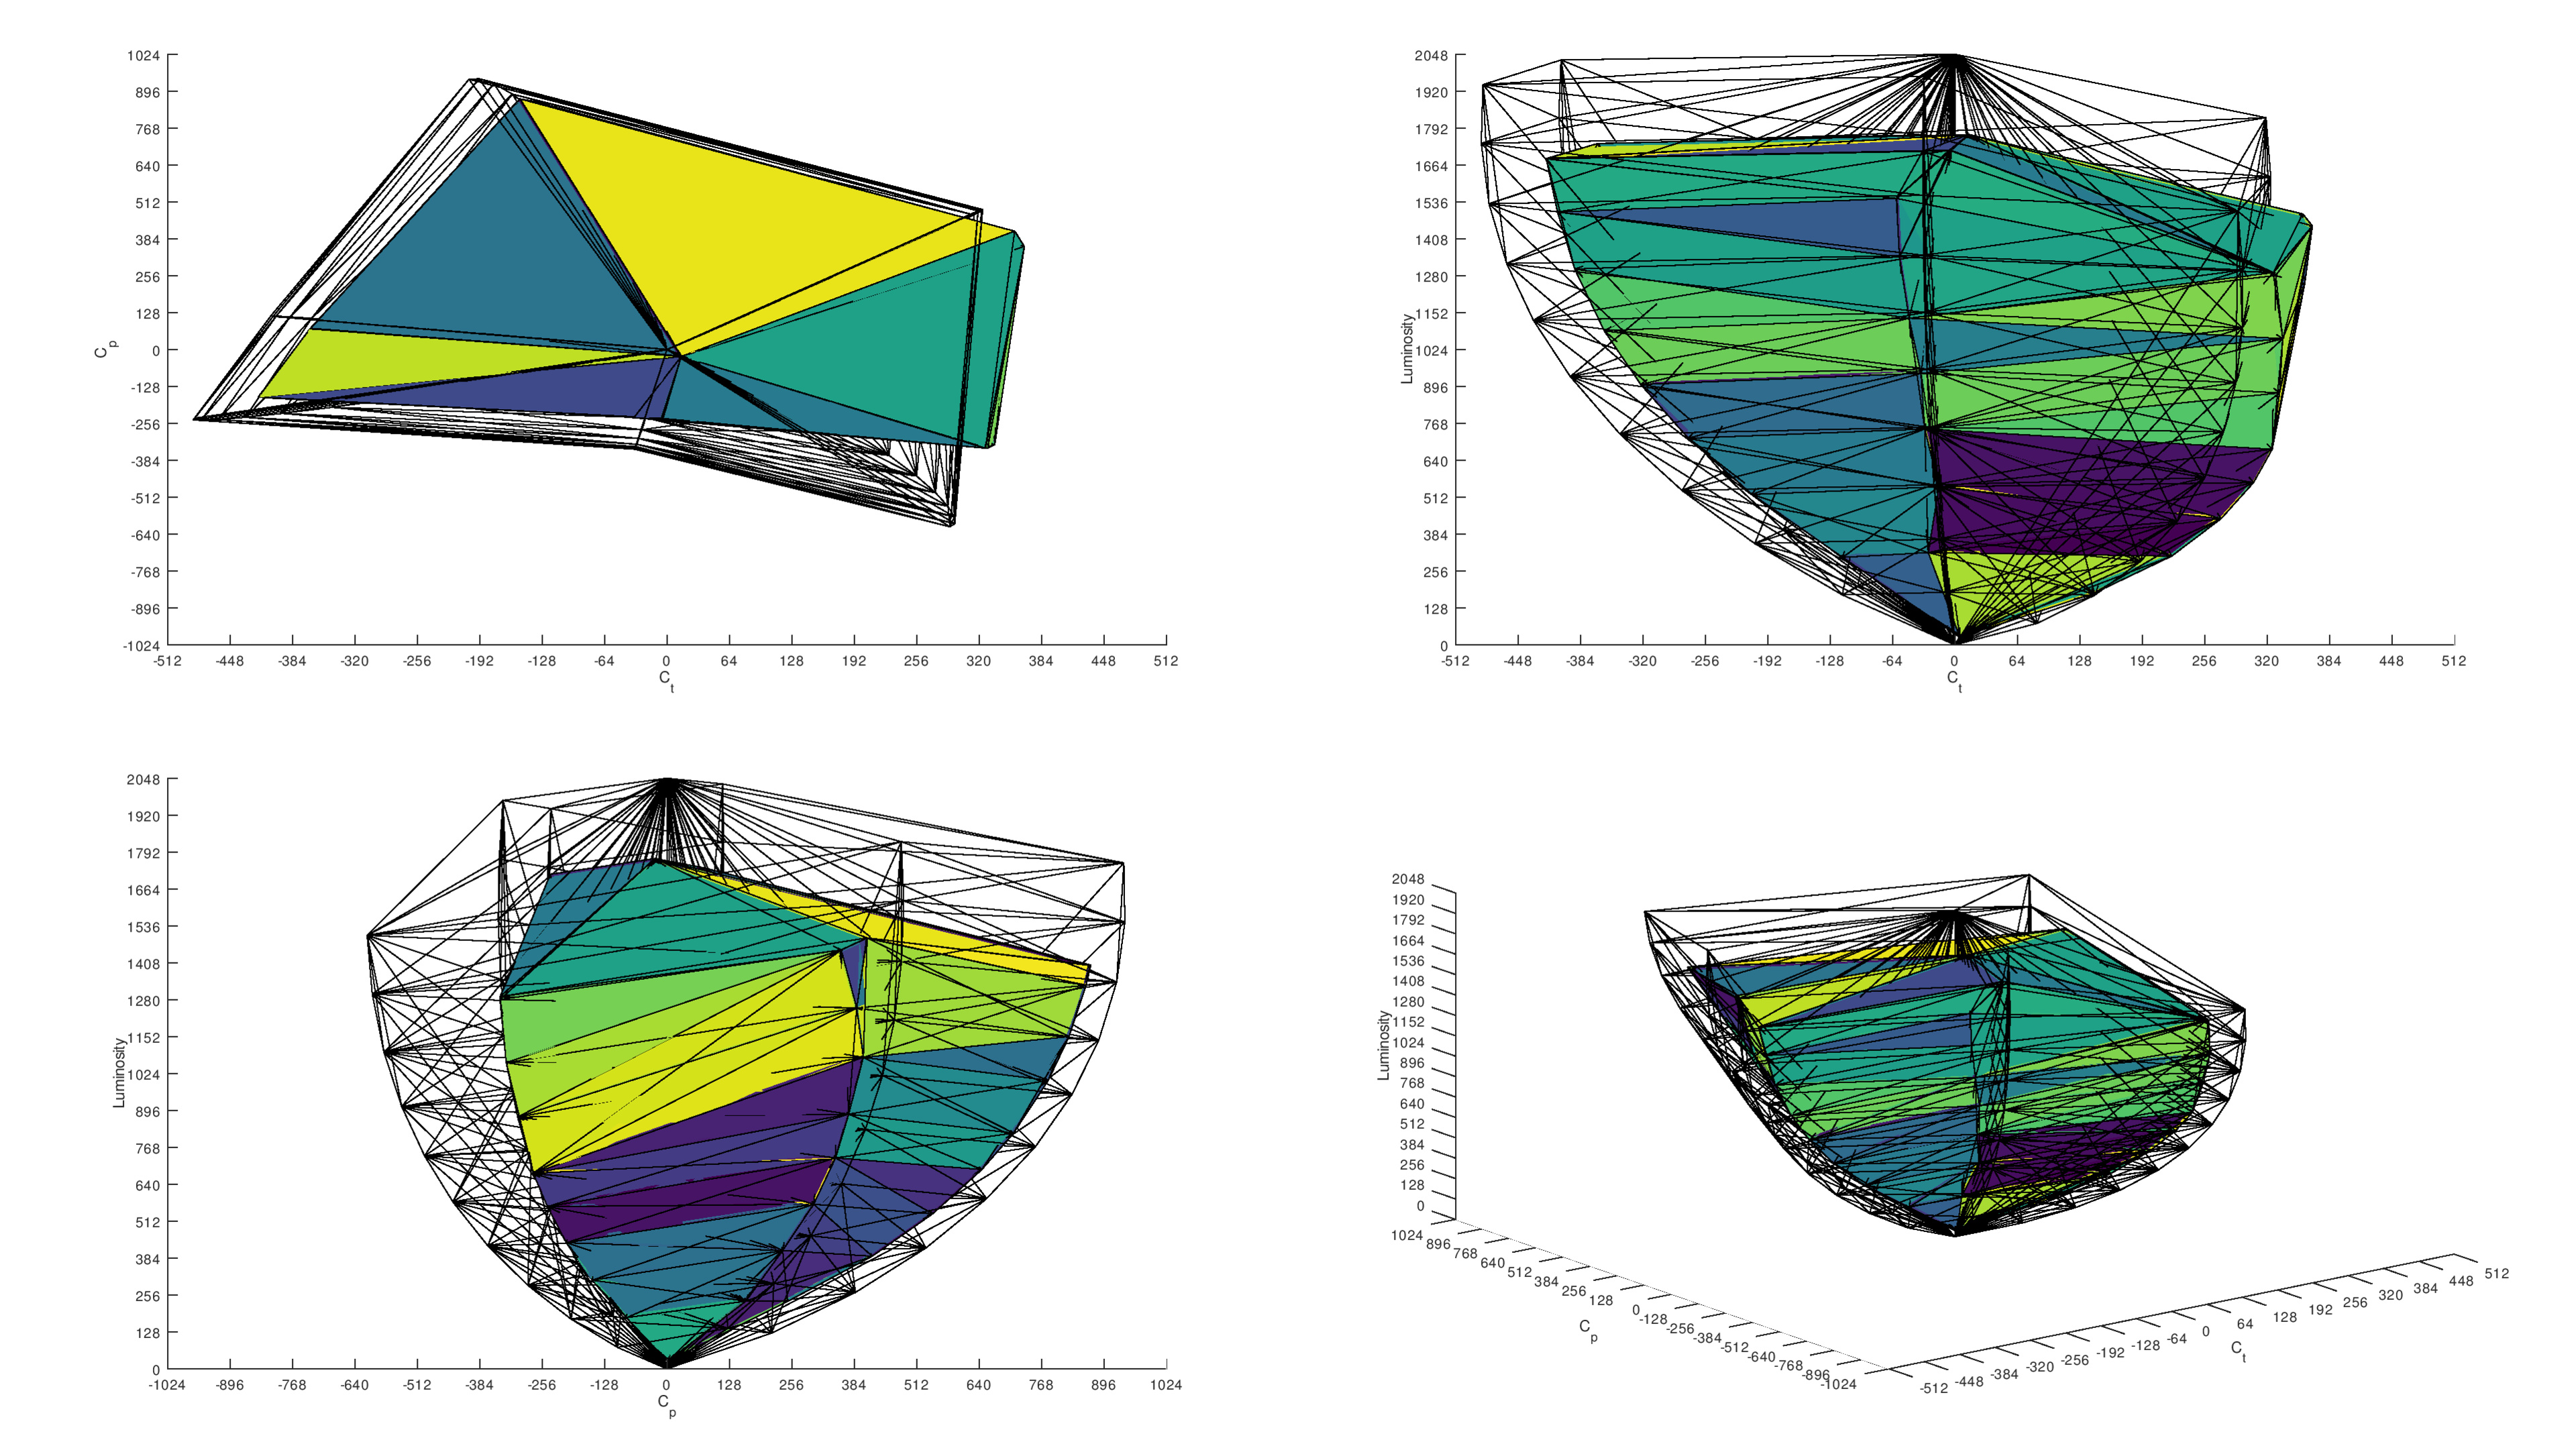 |
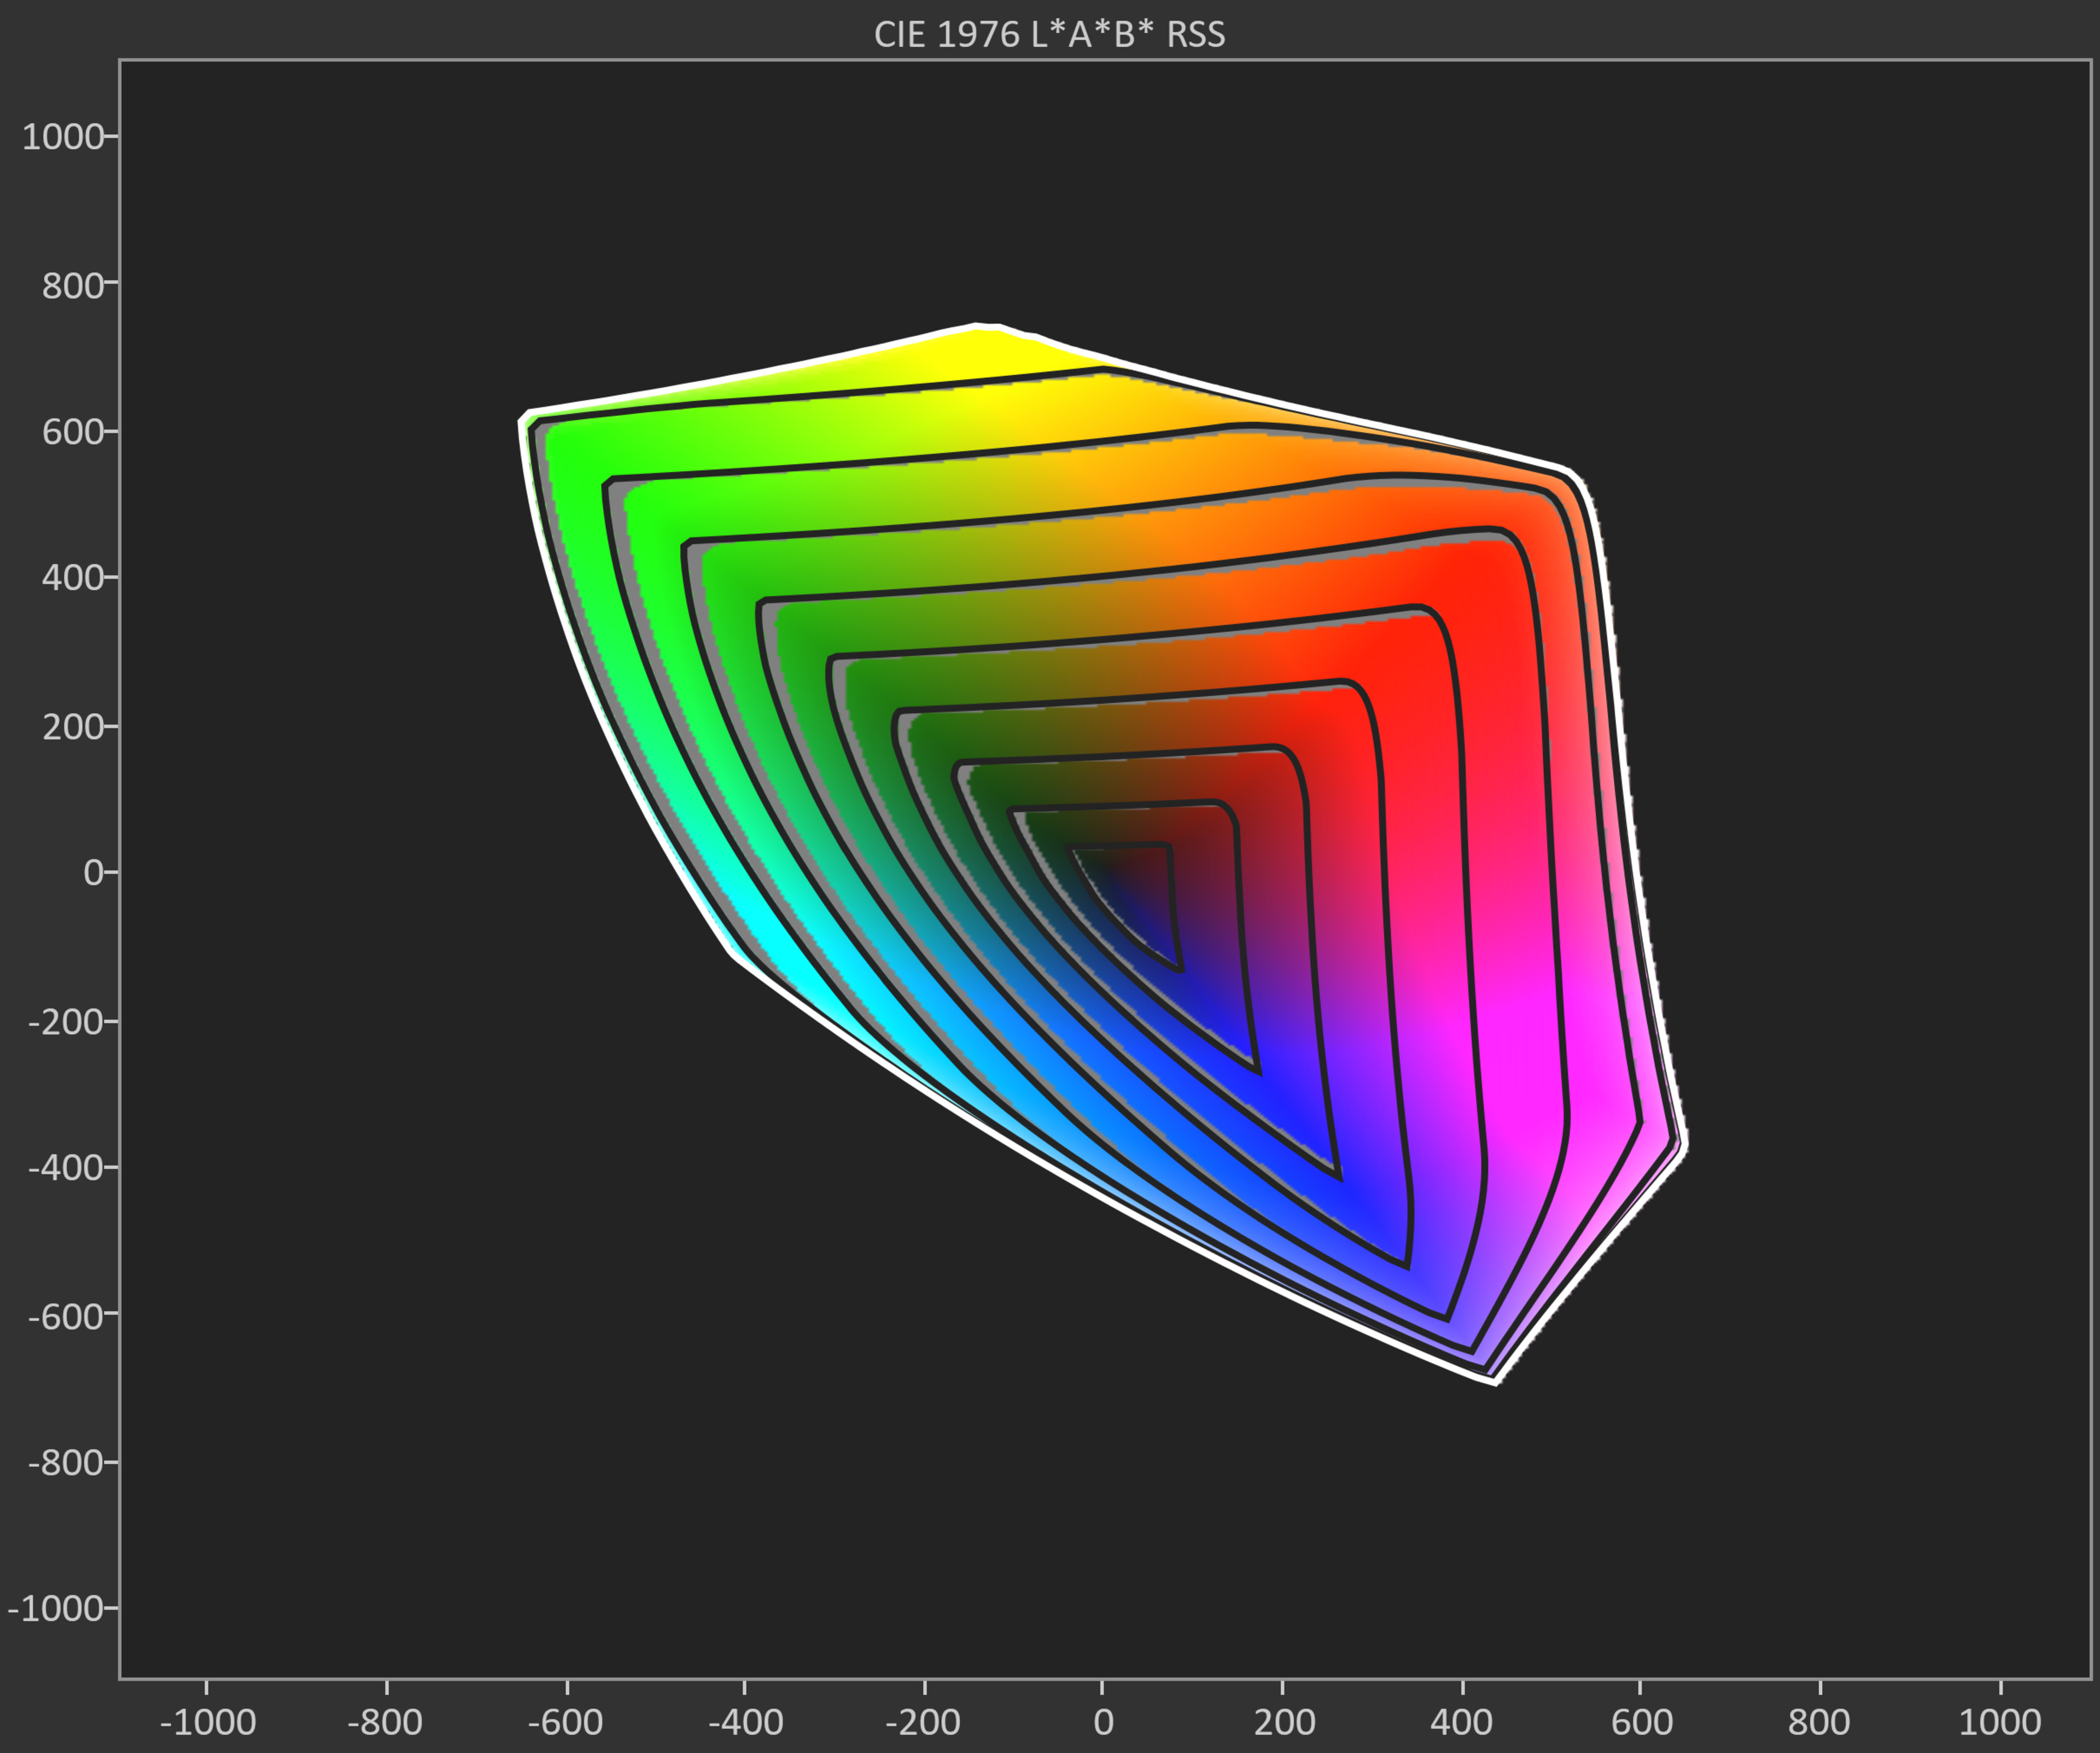
Those panel differences mentioned above have a direct impact on color performance. Looking at the SDR color volume graphs, we can see that the 100-inch variant suffers roughly a 6% drop in coverage, mostly in reds and greens. HDR color volume relative to 10,000 nits shows a similar drop in coverage, but in this case, it's not just color gamut; the decrease in peak brightness also has a slight impact on these results.
The good news is that both variants are so exceptionally over the top anyway that it will be very hard to notice these differences unless you're doing a side-by-side comparison with extremely specific content. Most HDR content doesn't take full advantage of the BT.2020 color space anyway, so limited coverage here doesn't usually matter.
Size-To-Distance
| Hisense 100U8QG | Hisense 65U8QG | |
|---|---|---|
| Width | 87.2" (221.5cm) | 56.7" (144cm) |
| Height | 49" (124.5cm) | 31.9" (81 cm) |
| Area | 4,273 in² (2.758 m²) | 1,809 in² (1.166 m²) |
| Recommended Mixed Usage Distance (30°) |
13'3" (4.05m) | 8'10" (2.69m) |
| Recommended Cinema Distance (40°) |
9'9" (2.98m) | 6'6" (1.98m) |
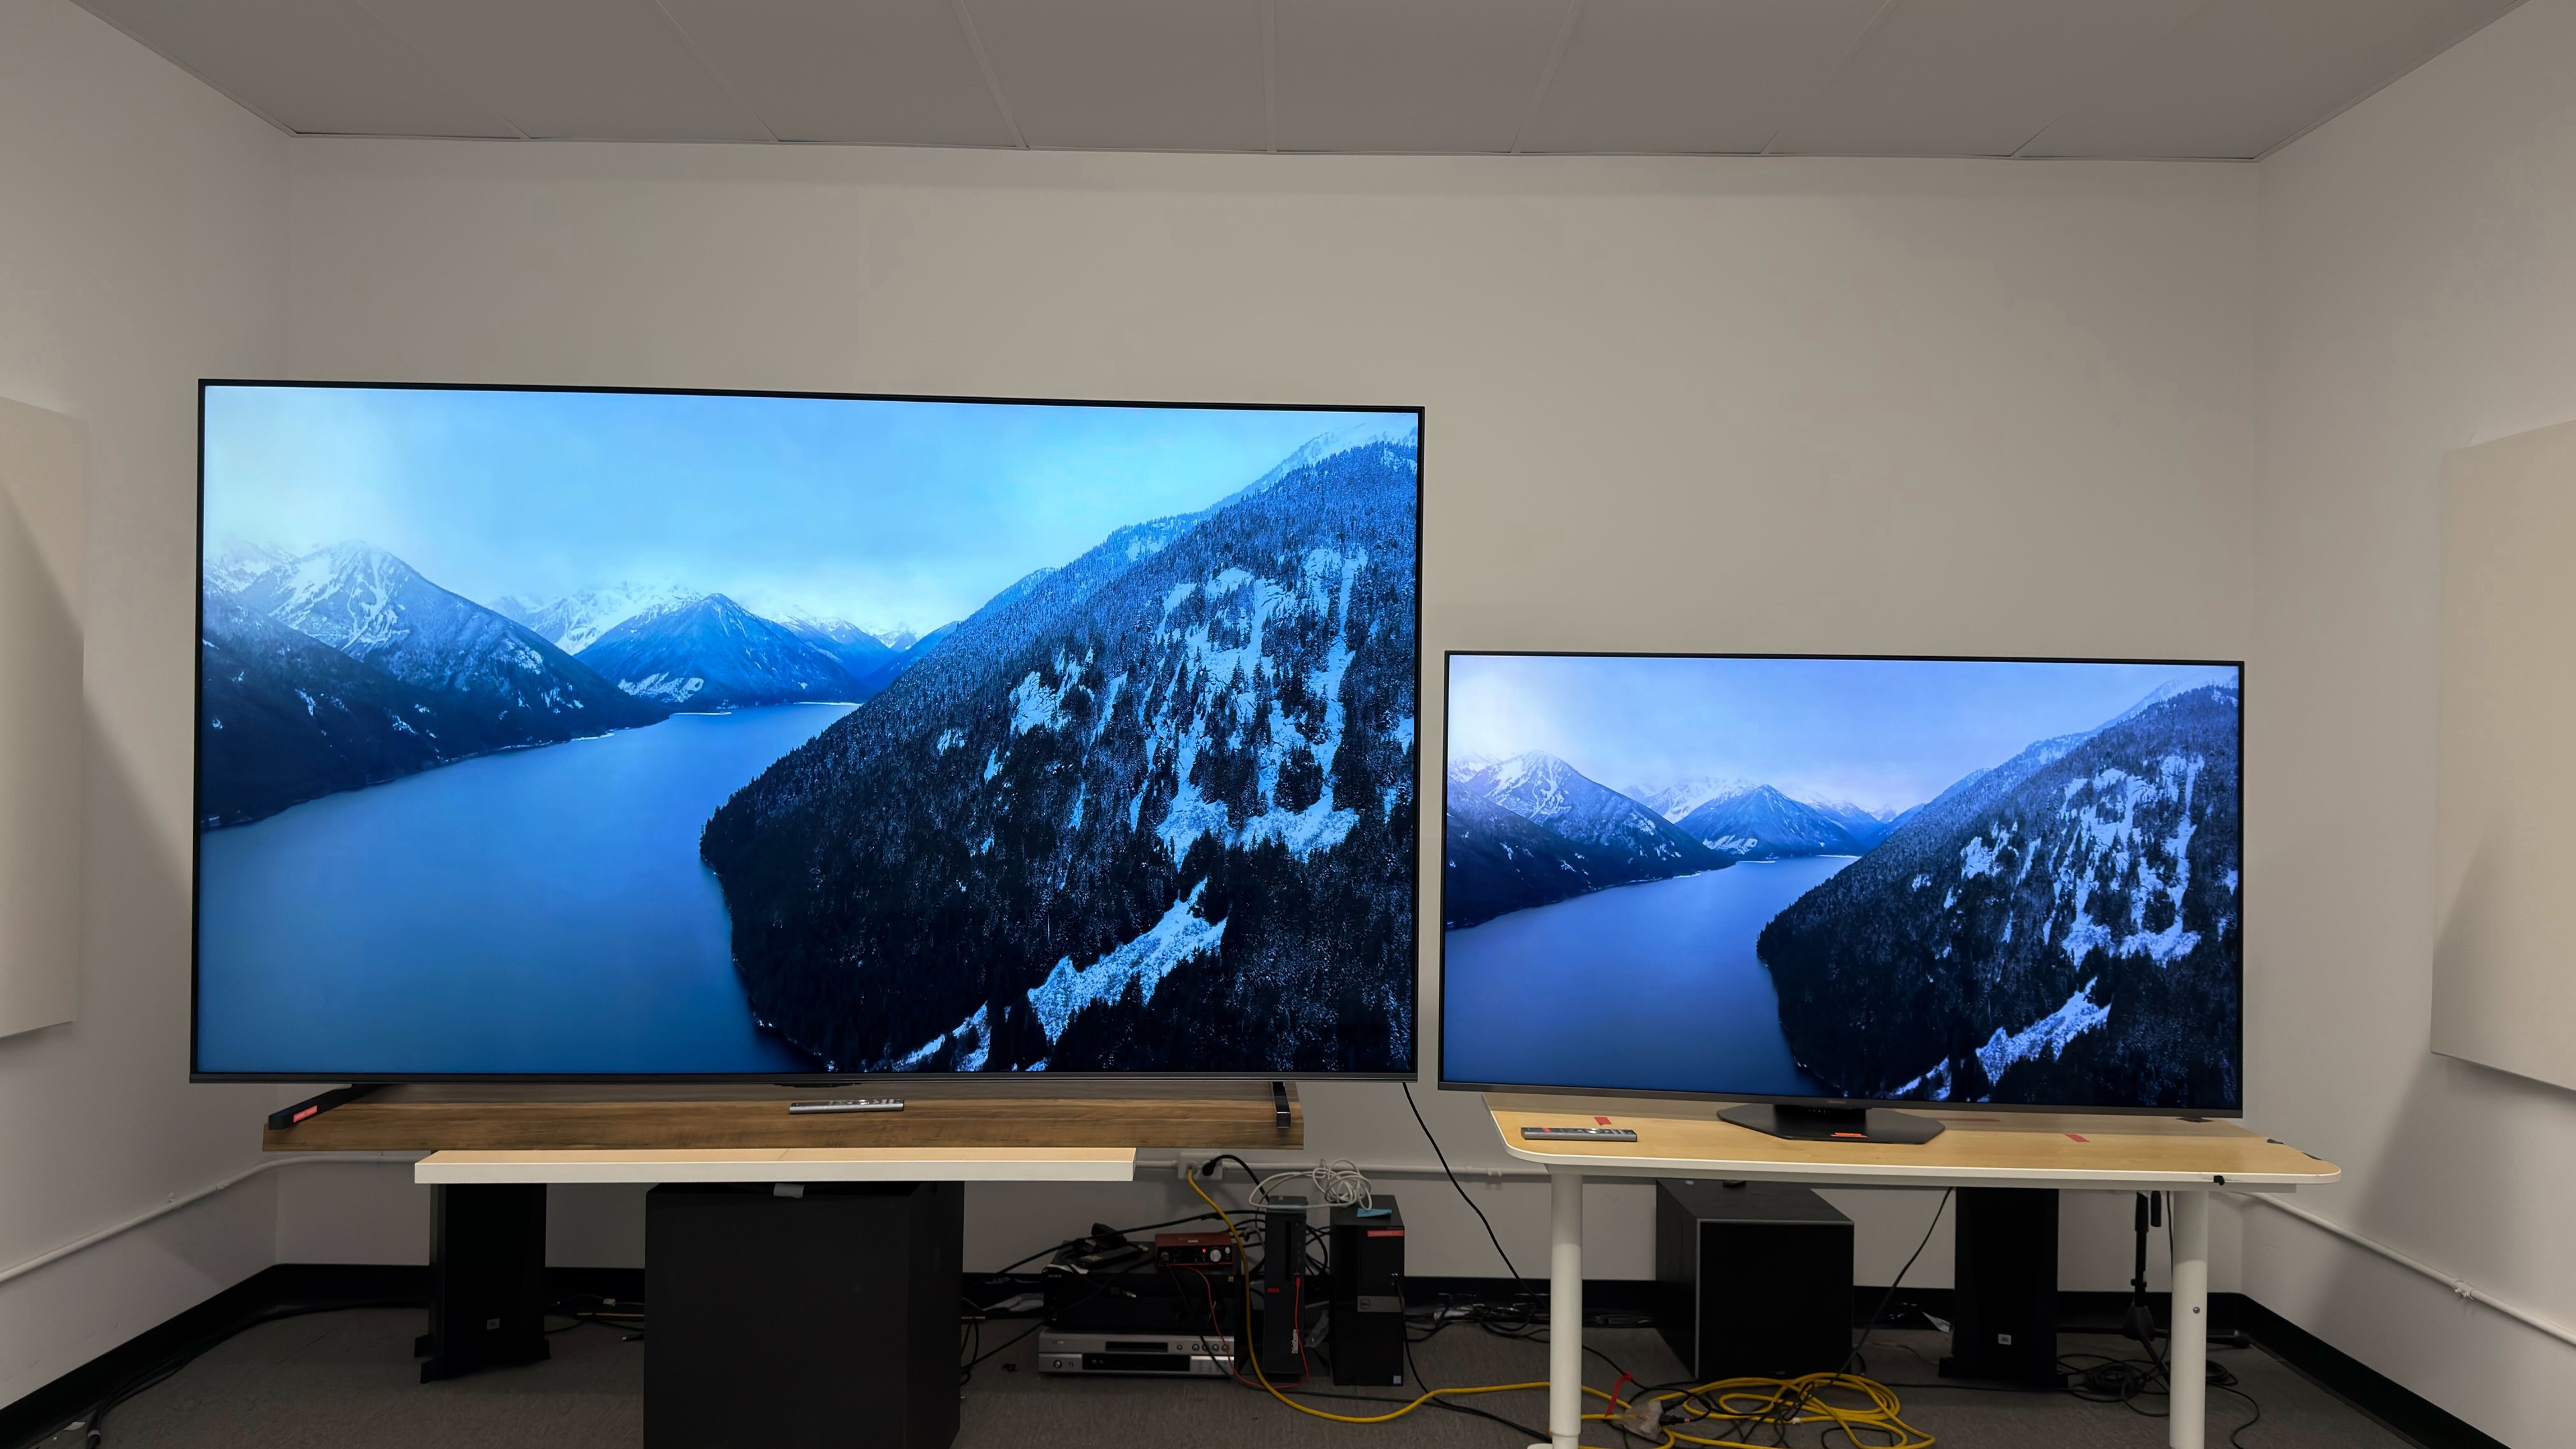
Going from 65-inch to 100-inch is a fairly significant increase in size. The 100-inch TV has roughly 136% more screen area. Using our size-to-distance calculator, we can see that this results in a fairly significant increase in the recommended viewing distance for the 100-inch model, so it's not well-suited for smaller rooms.
Conclusion
These are both great TVs, regardless of how you plan to use them. While there are noticeable performance differences between them, neither should be eliminated from your consideration. Ultimately, your budget and room size should be the deciding factors when choosing between them.