TVs marketed as "QLED" have been around for a few years now, and if you're shopping for a new TV, chances are you'll see this term slapped on the side of the box like a badge of honor. But what is a QLED TV, and should you care? In this article, we'll explain what QLED is and its impact on picture quality to help you make a better-informed buying decision. If you're ready to start shopping, check out our picks for the best QLED TVs.
What Is QLED?
QLED, or Quantum Dot Light-Emitting Diode, is primarily a marketing term used to describe various panel technologies that utilize an LED backlight, supplemented with the addition of quantum dots. Quantum dots are a better way to produce color in TVs that use LEDs as a backlight. Before QLED came along, most LED TVs used white LEDs to produce light. This light then passes through three color filters to produce the separate red, green, and blue subpixels. This process is, however, very inefficient, as it works by simply blocking the unwanted portions of light coming from the backlight.
Quantum dots, on the other hand, are extremely efficient at converting light. Instead of stripping away every unwanted color from a white light source, quantum dots work by taking the energy from light that hits them and emitting new light at a different wavelength. This process is far more efficient at producing light, as it captures most of the energy from the incoming light and directly converts it to the desired wavelength. That's not all, though. The wavelength of the light emitted by a quantum dot depends only on the size of the dot. Since manufacturers can precisely and consistently control the exact size of the dot, they can produce a much purer color spectrum. This enables a wider color gamut, resulting in brighter, more vibrant colors.
What is Neo QLED?
Different brands have come up with their own names for QLED, but they all refer to the technology that utilizes a wide color gamut. Here are just a few examples from some of the other brands out there and how they refer to this technology:
- Samsung: QLED, Neo QLED
- LG: QNED
- Sony: Triluminos/Triluminos Pro
- Hisense: ULED
- TCL: QLED, QD-Mini LED
All of these marketing terms refer to some form of wide color gamut, but they don't all use the same quantum dot technology. Some might not even use quantum dots at all.
QLED Performance
As mentioned above, QLED is an additional layer that's added to the existing layers typically found on an LED TV. This additional layer affects only one thing: how the TV produces color. To understand how QLED technology affects the range of colors you see on your TV, we'll primarily examine how QLED impacts color reproduction. If you want to learn more about LED TVs in general, check out our What is LED guide or our QLED vs LED guide for a more in-depth comparison between the two technologies. There are other performance metrics that are important when choosing a TV, but most of the other metrics have more to do with the TV's electronics and processing than the panel, so we won't cover them here.
SDR Color Volume
 |
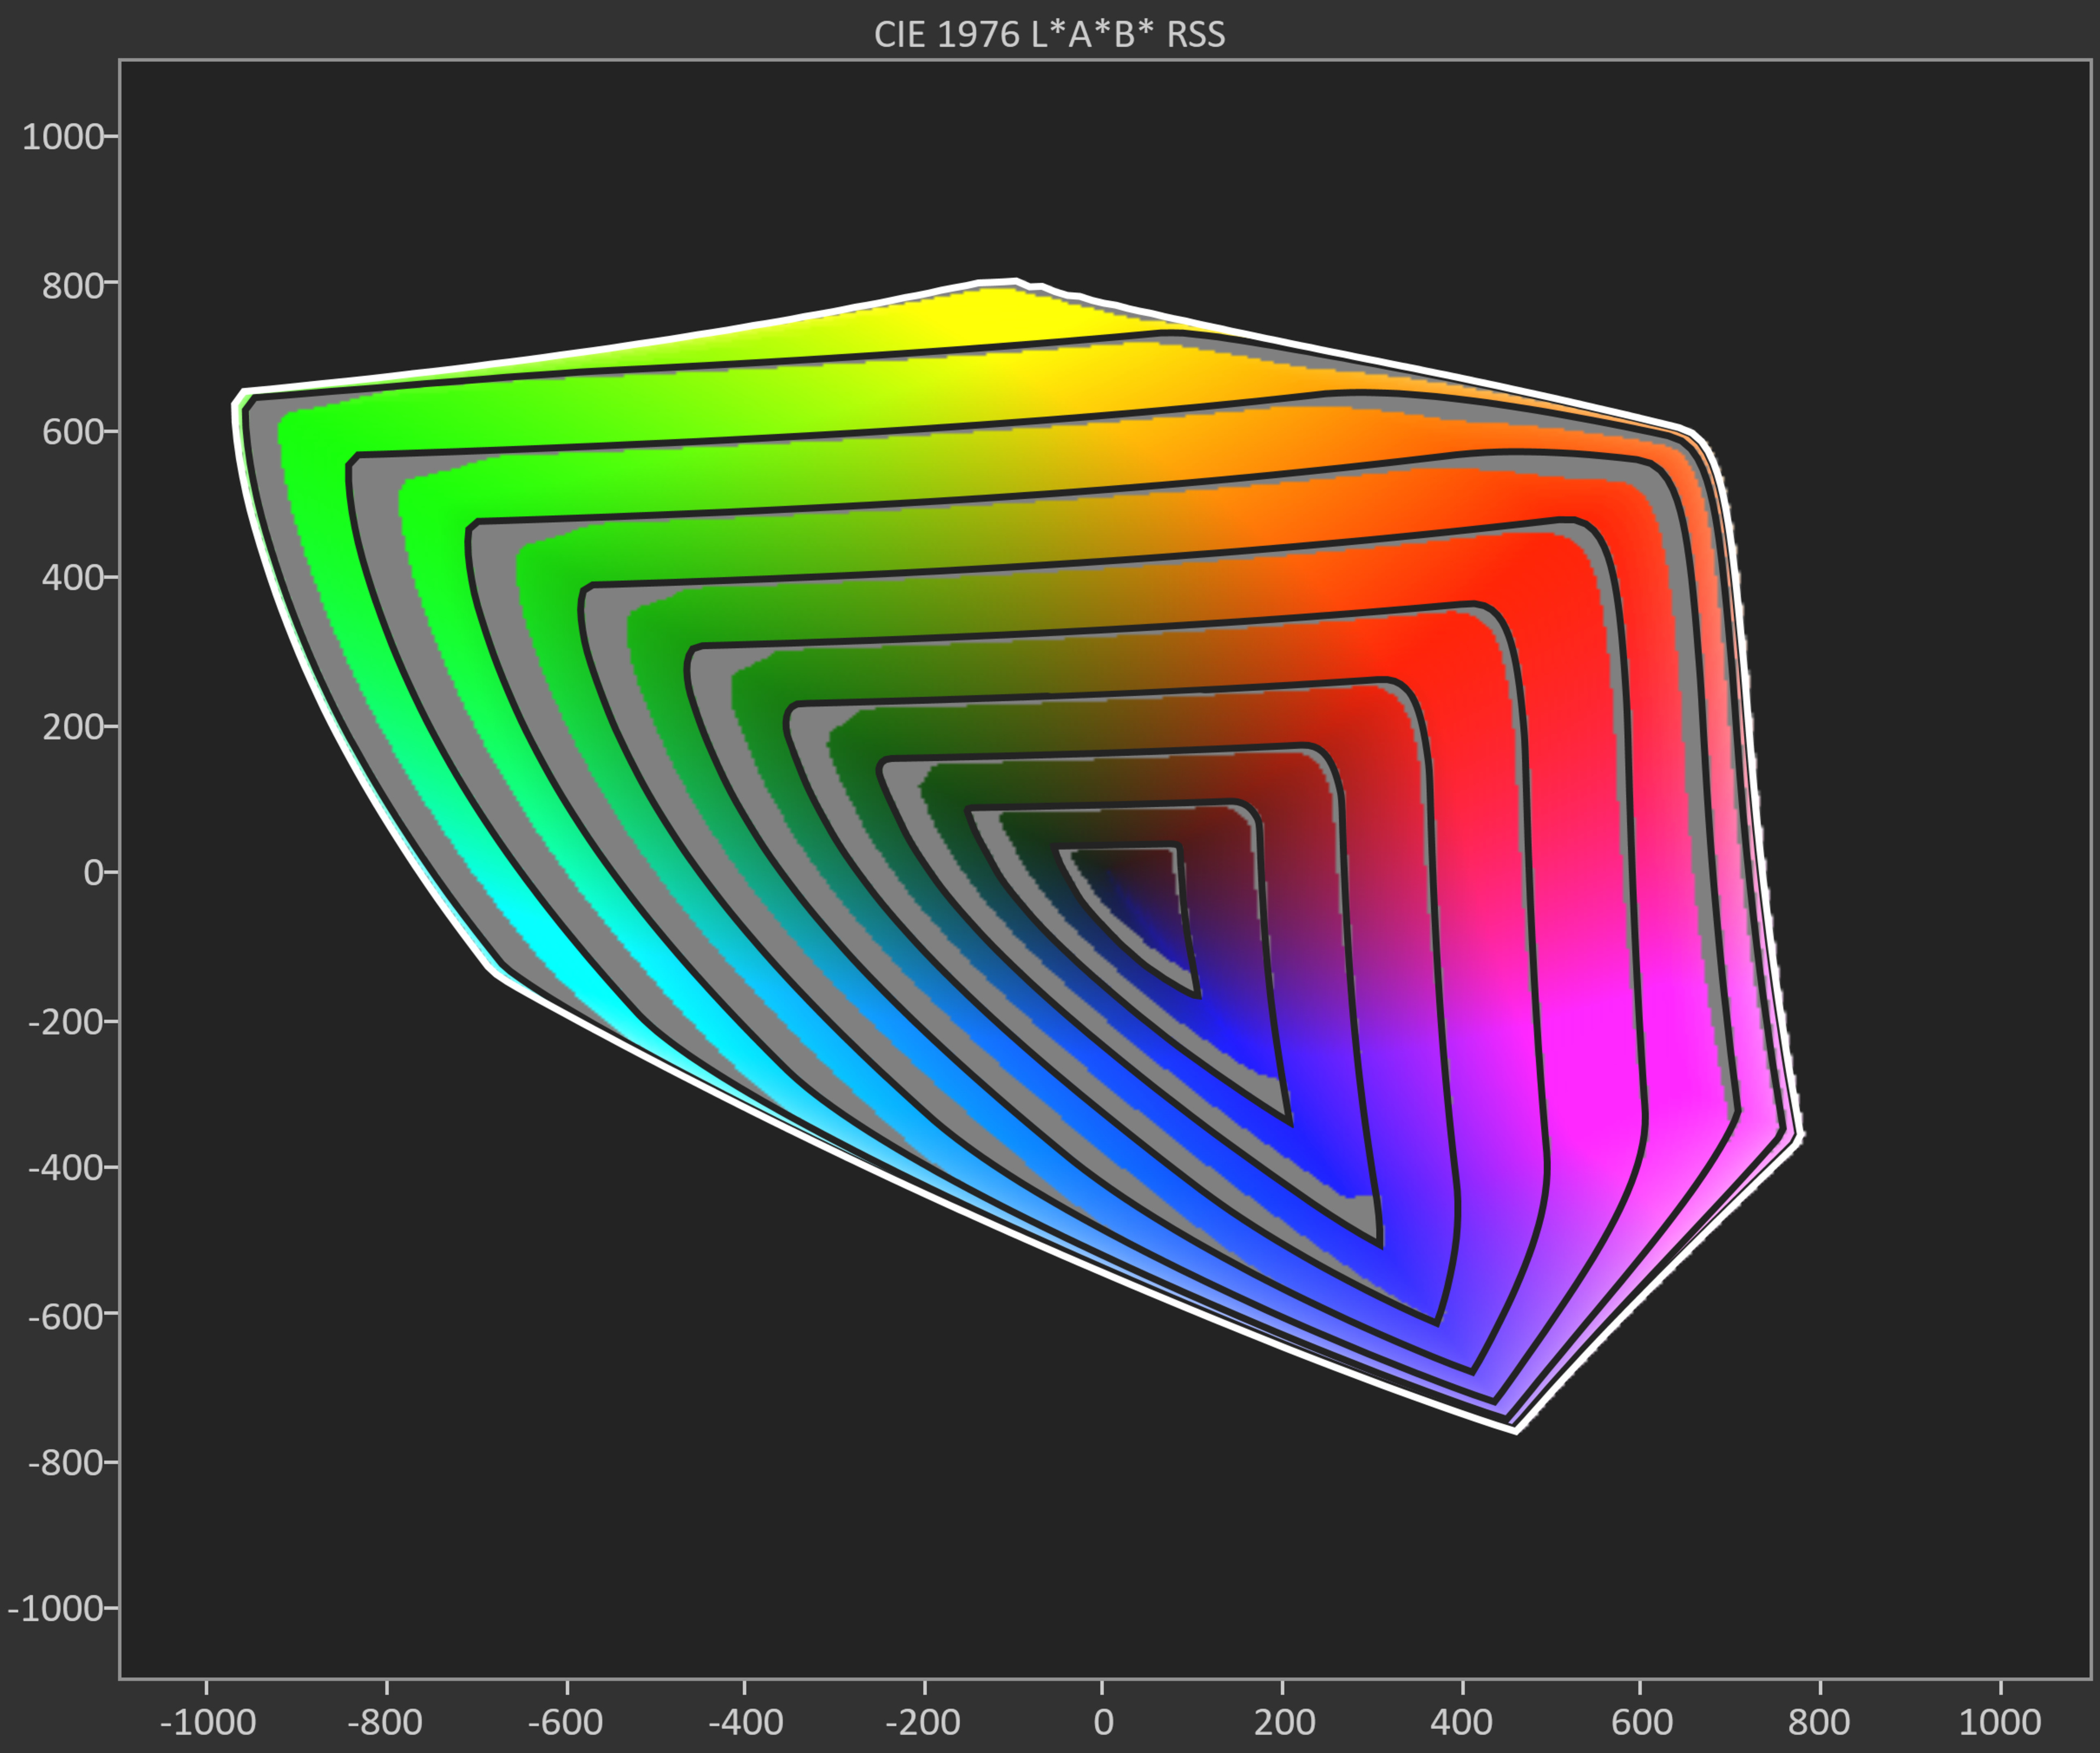 |
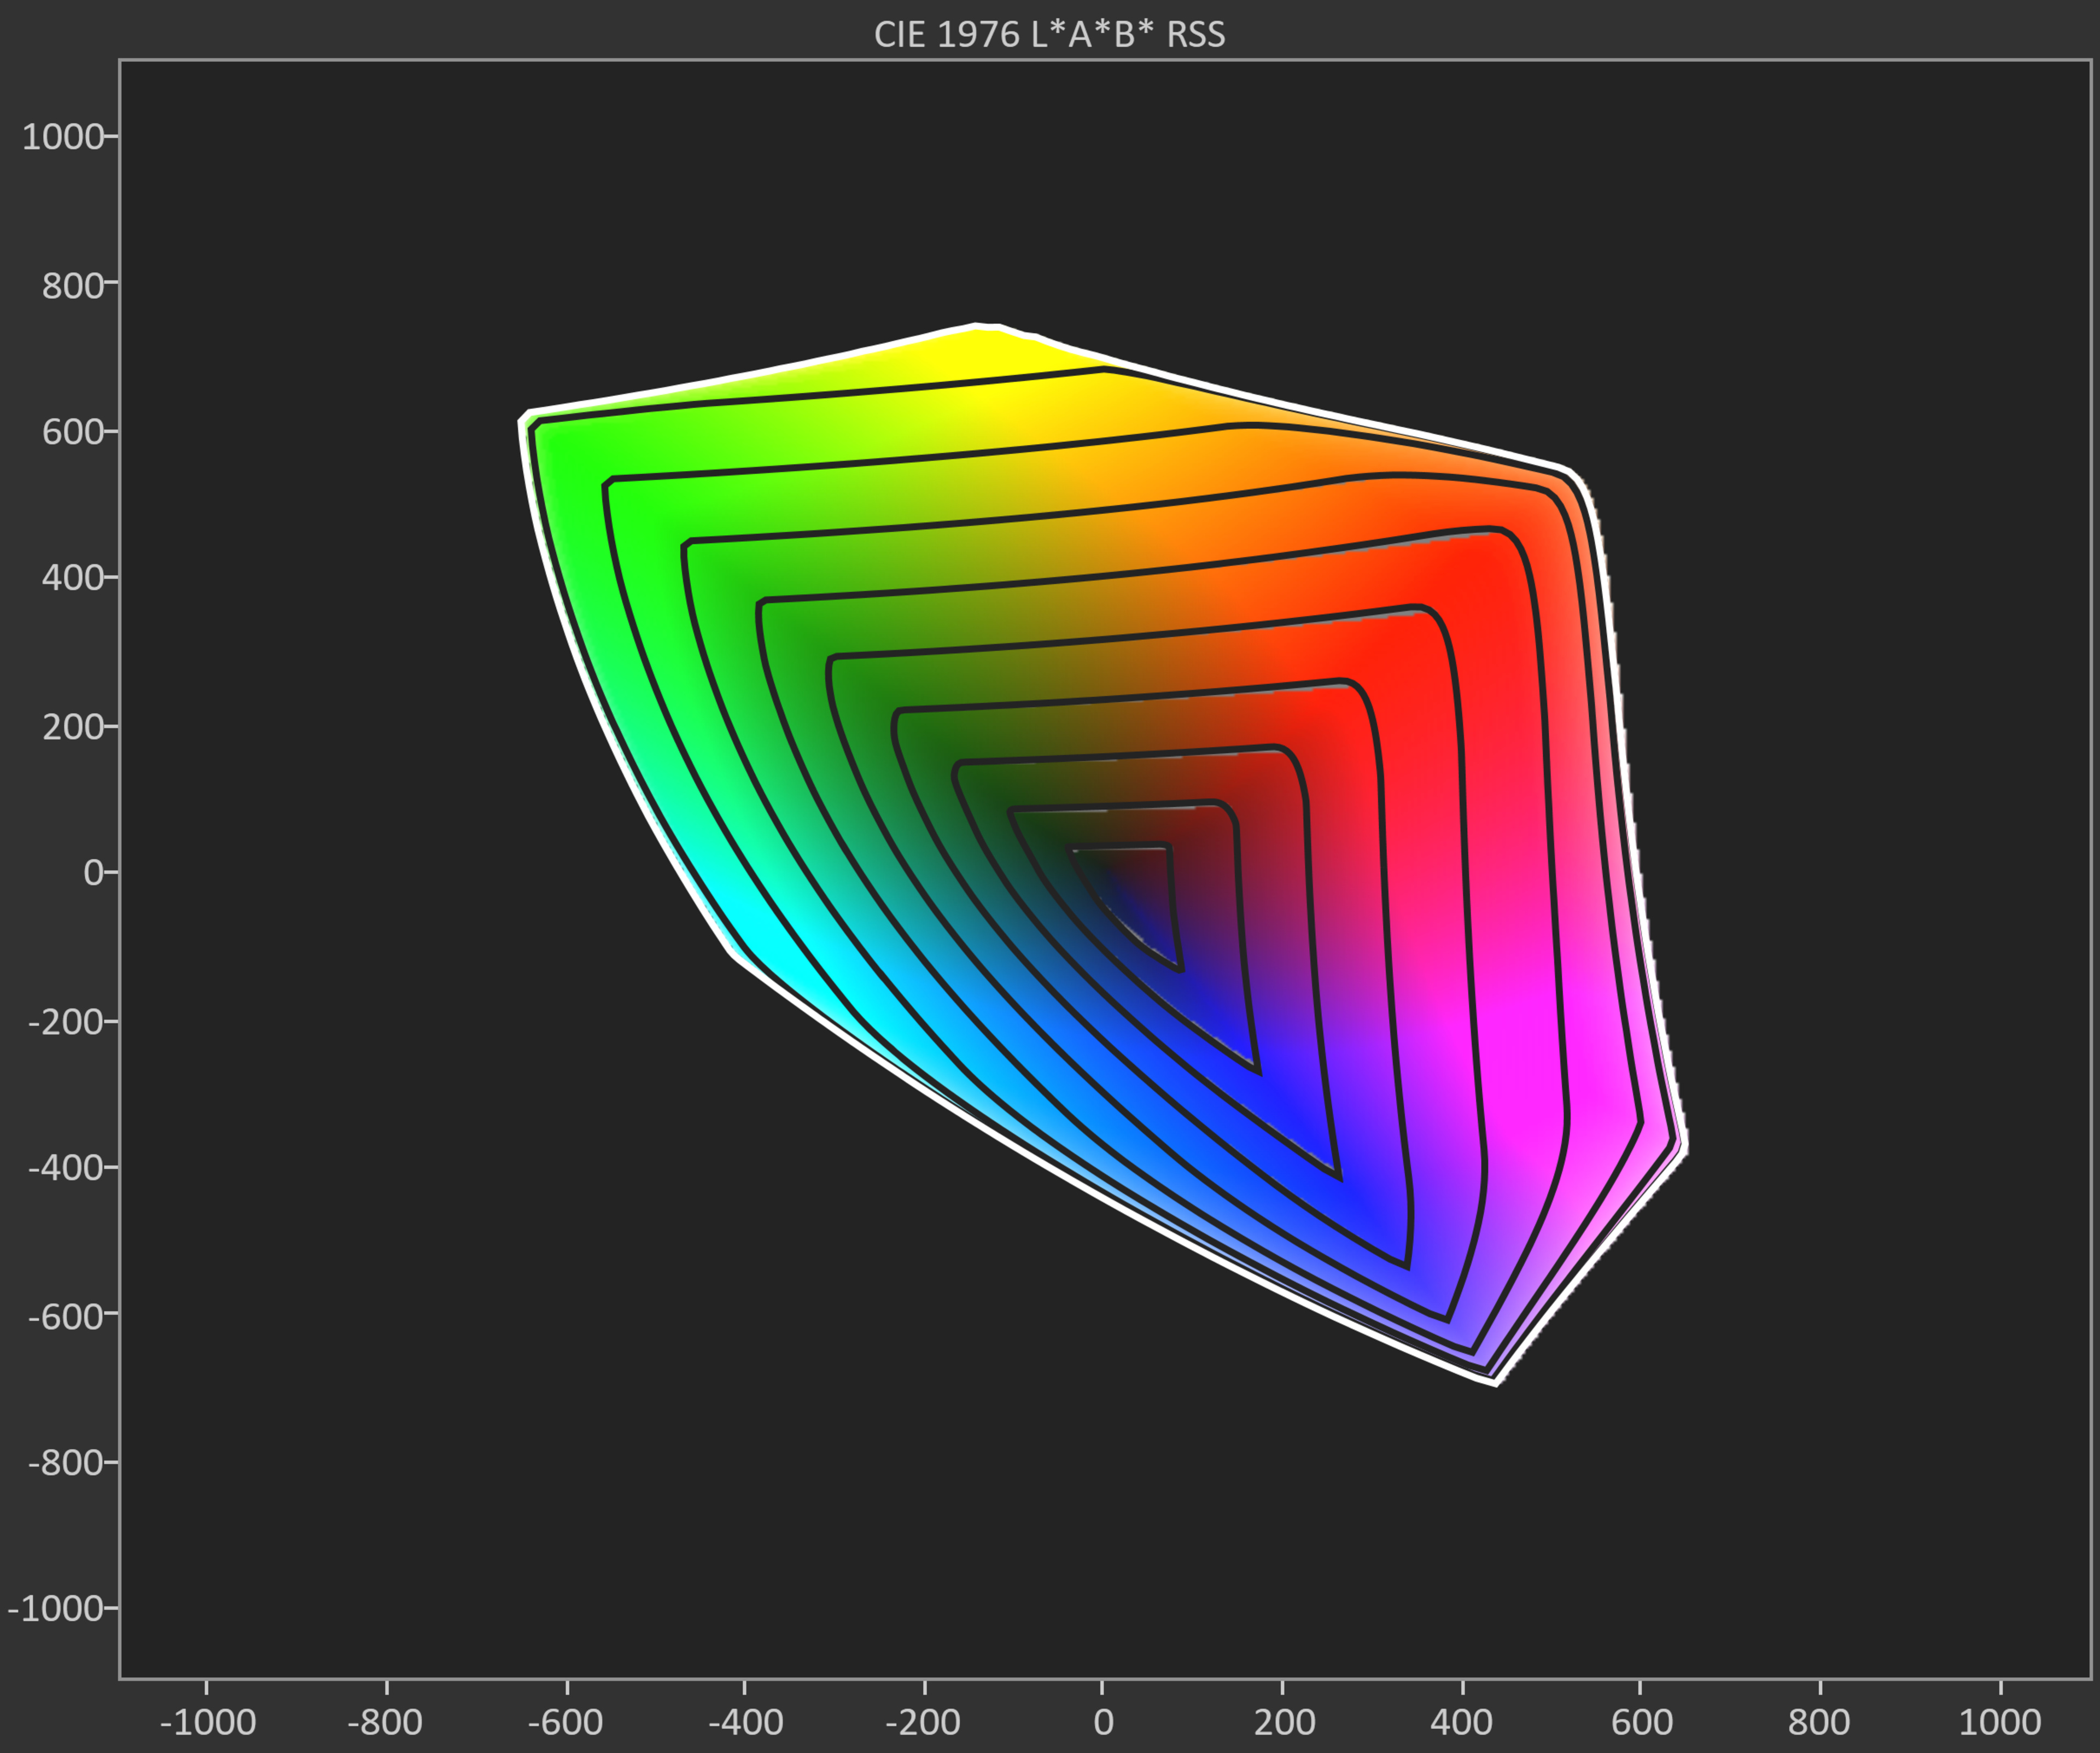
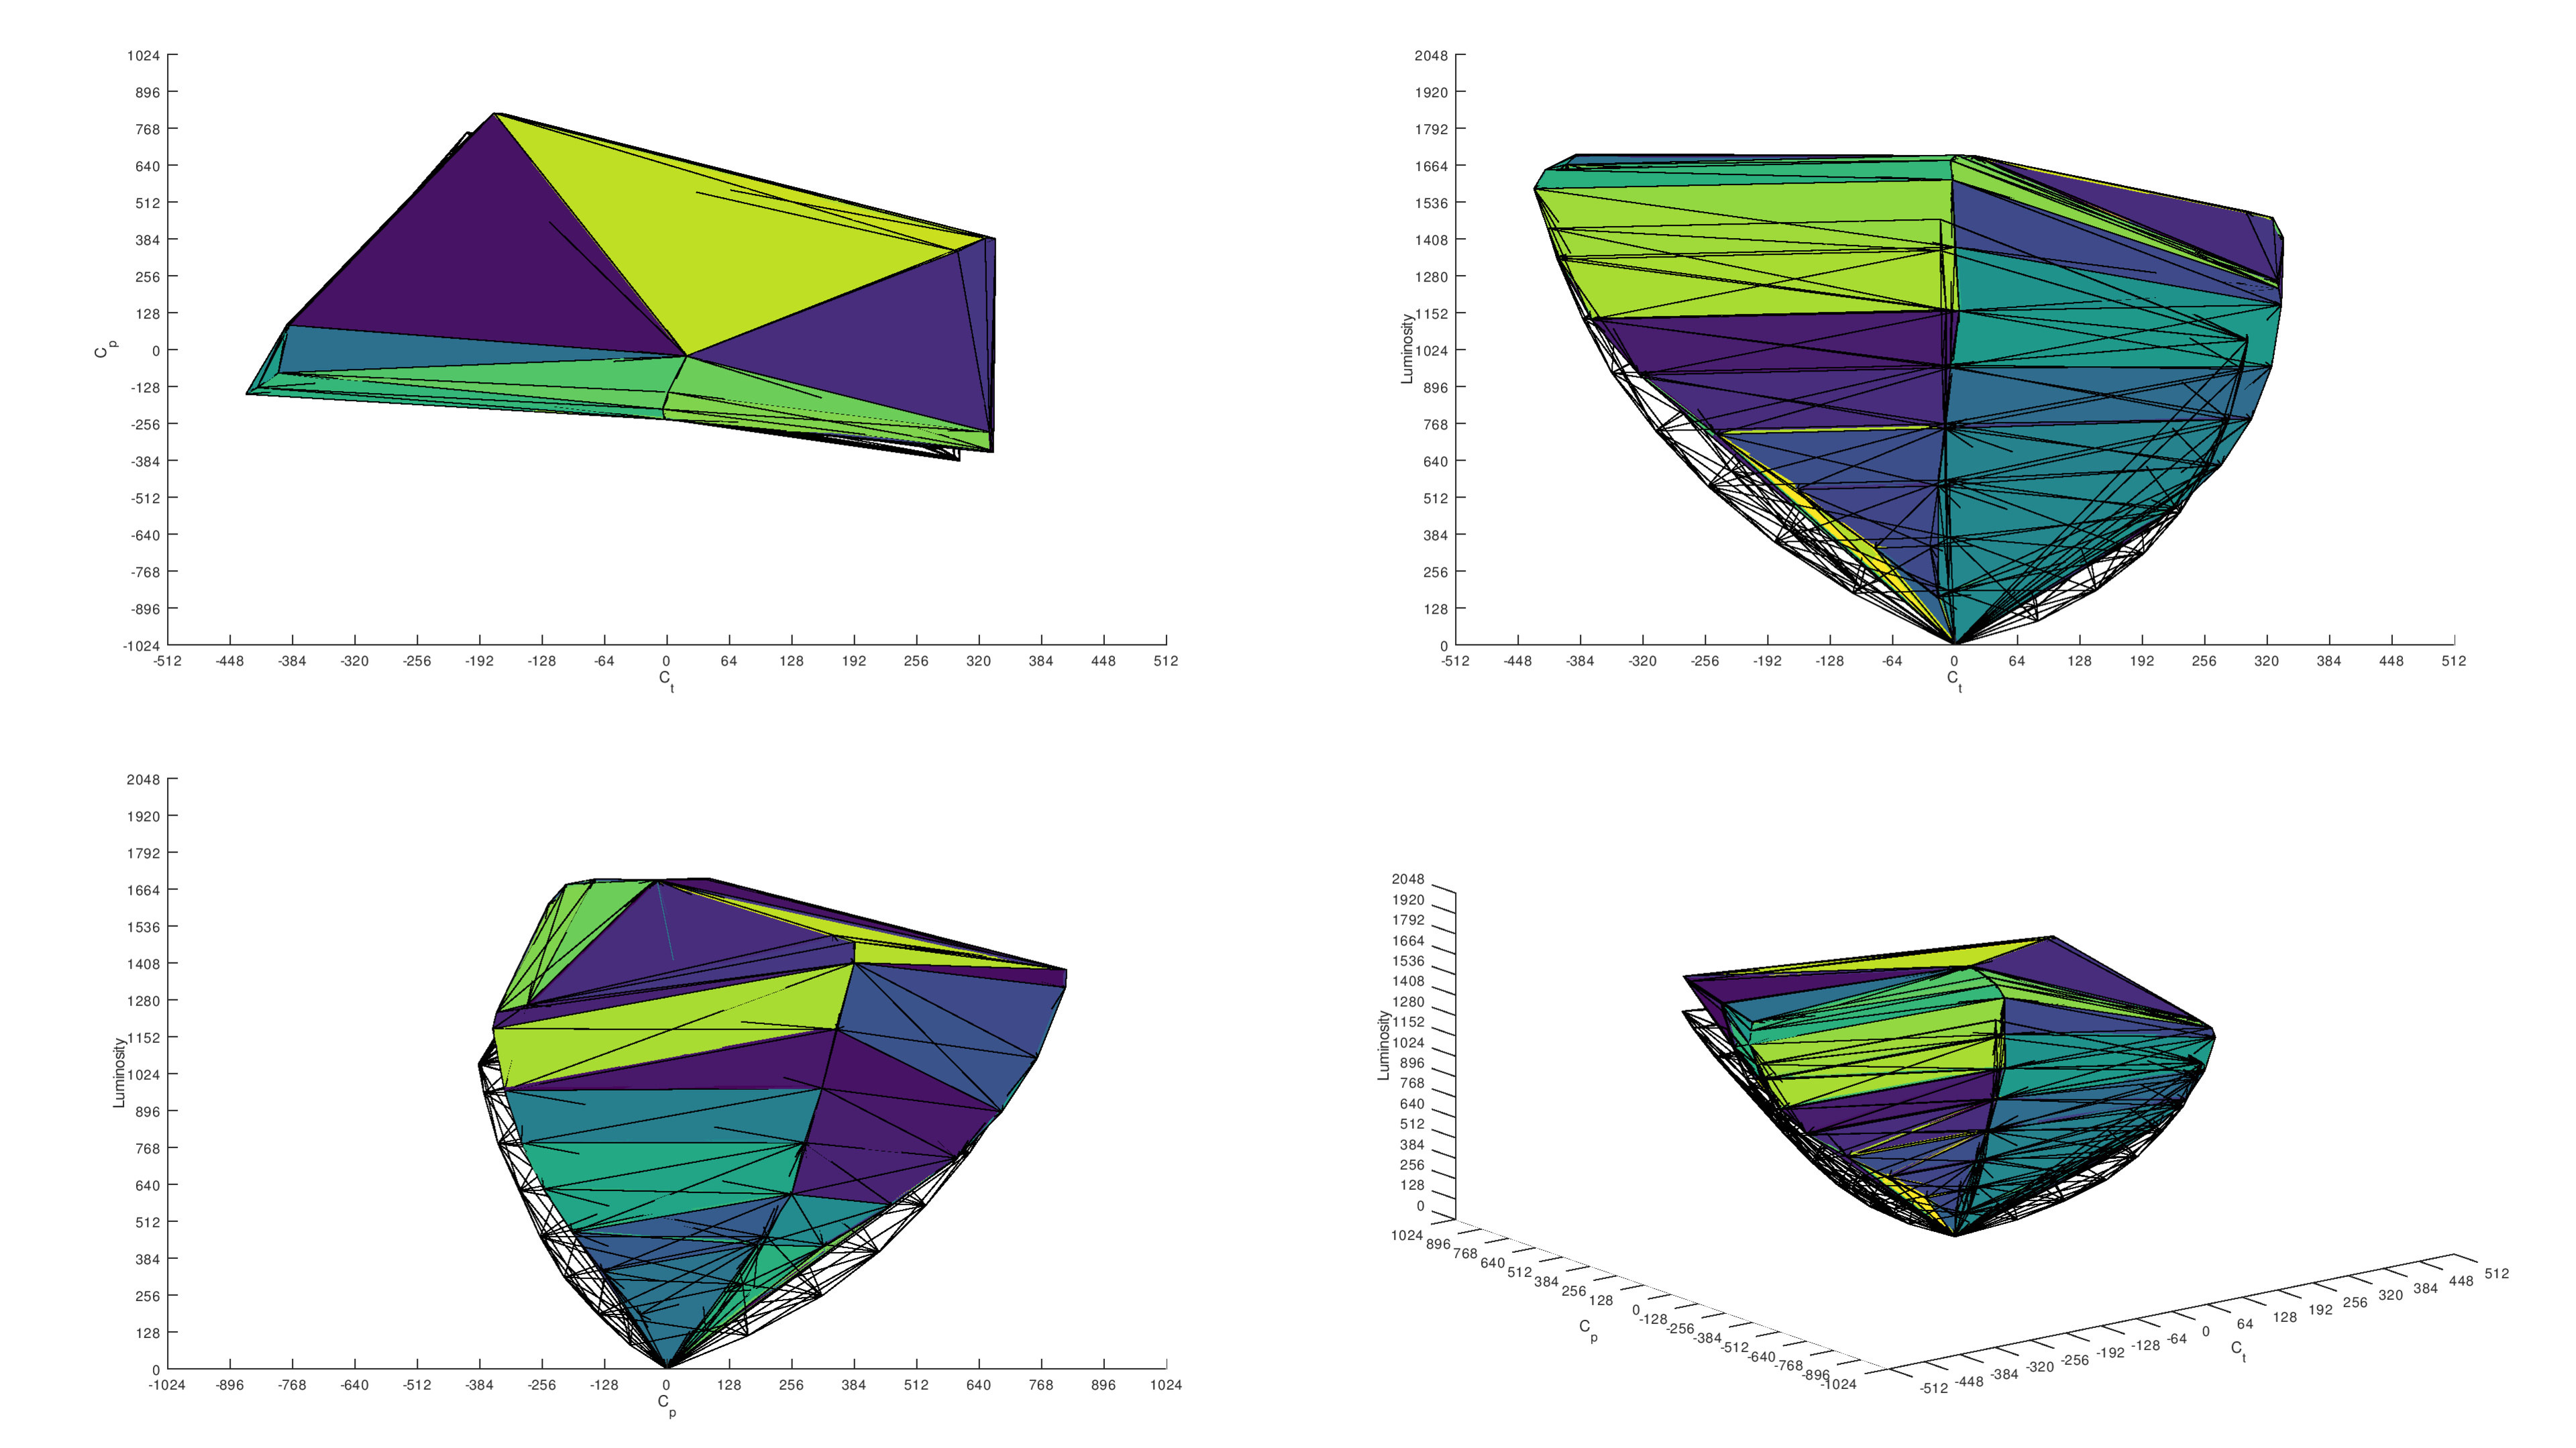
One of the best ways we can evaluate a TV's ability to produce color is the SDR color volume chart. This test examines the range of colors a TV can produce in SDR across 10 slices of varying lightness, from L*0 to L*100. The gray areas in the charts show areas where the TV can't produce colors that are as saturated as the reference standard. Taking a look at the Hisense U9N's SDR Color Volume results above, you can see that this QLED TV displays nearly all of the DCI-P3 color space, and a good chunk of the much wider BT.2020 space. These are excellent results overall, indicating a TV with exceptional color reproduction.
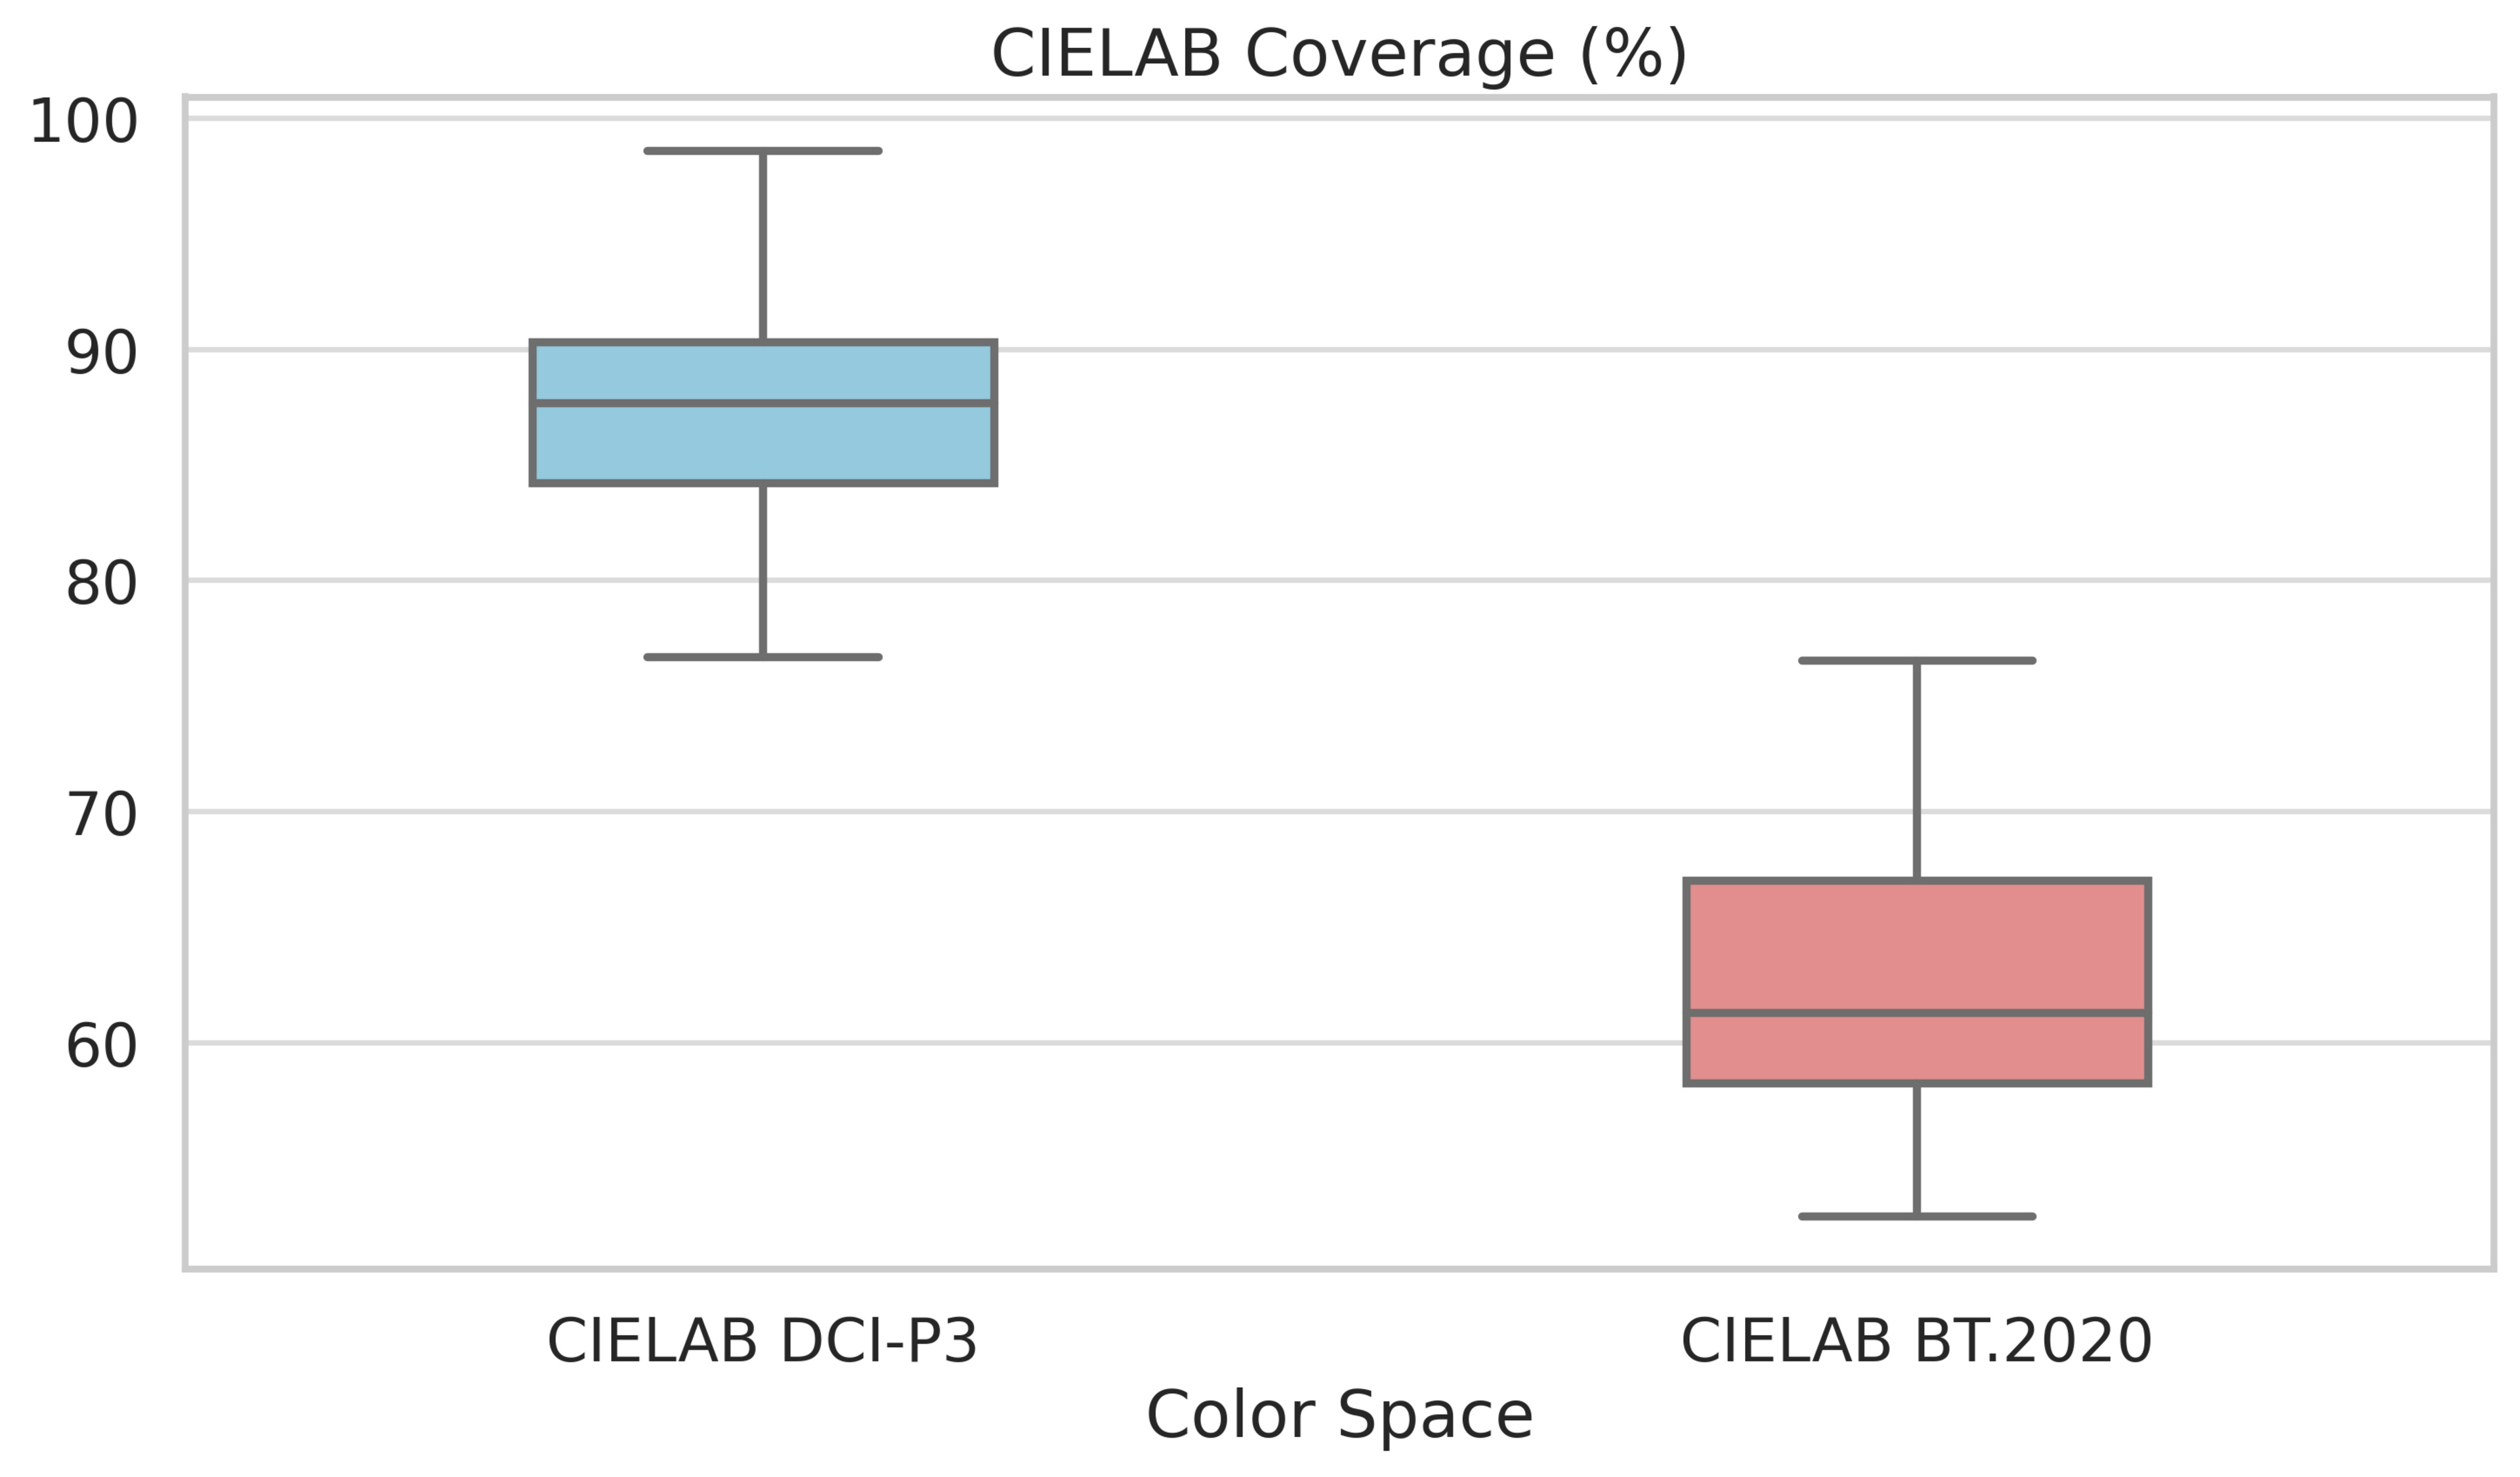
That's fine for the U9N, but what about the QLED market in general? If we take a look at the results for the ~50 QLED TVs we've tested on our 2.0.1 or 2.1 test methodologies, we can see that most QLEDs perform very well in the DCI-P3 color space, with an average coverage of close to 90%. This results in vivid, saturated colors in the vast majority of SDR content. Coverage of the widest BT.2020 color space is slightly lower, averaging around 60%, although some TVs achieve coverage as high as 75%. Very little content actually utilizes that color space, so this doesn't matter much. Overall, these results indicate that QLEDs are generally a safe choice if you prioritize saturated colors.
HDR Color Volume
 |
 |
 |
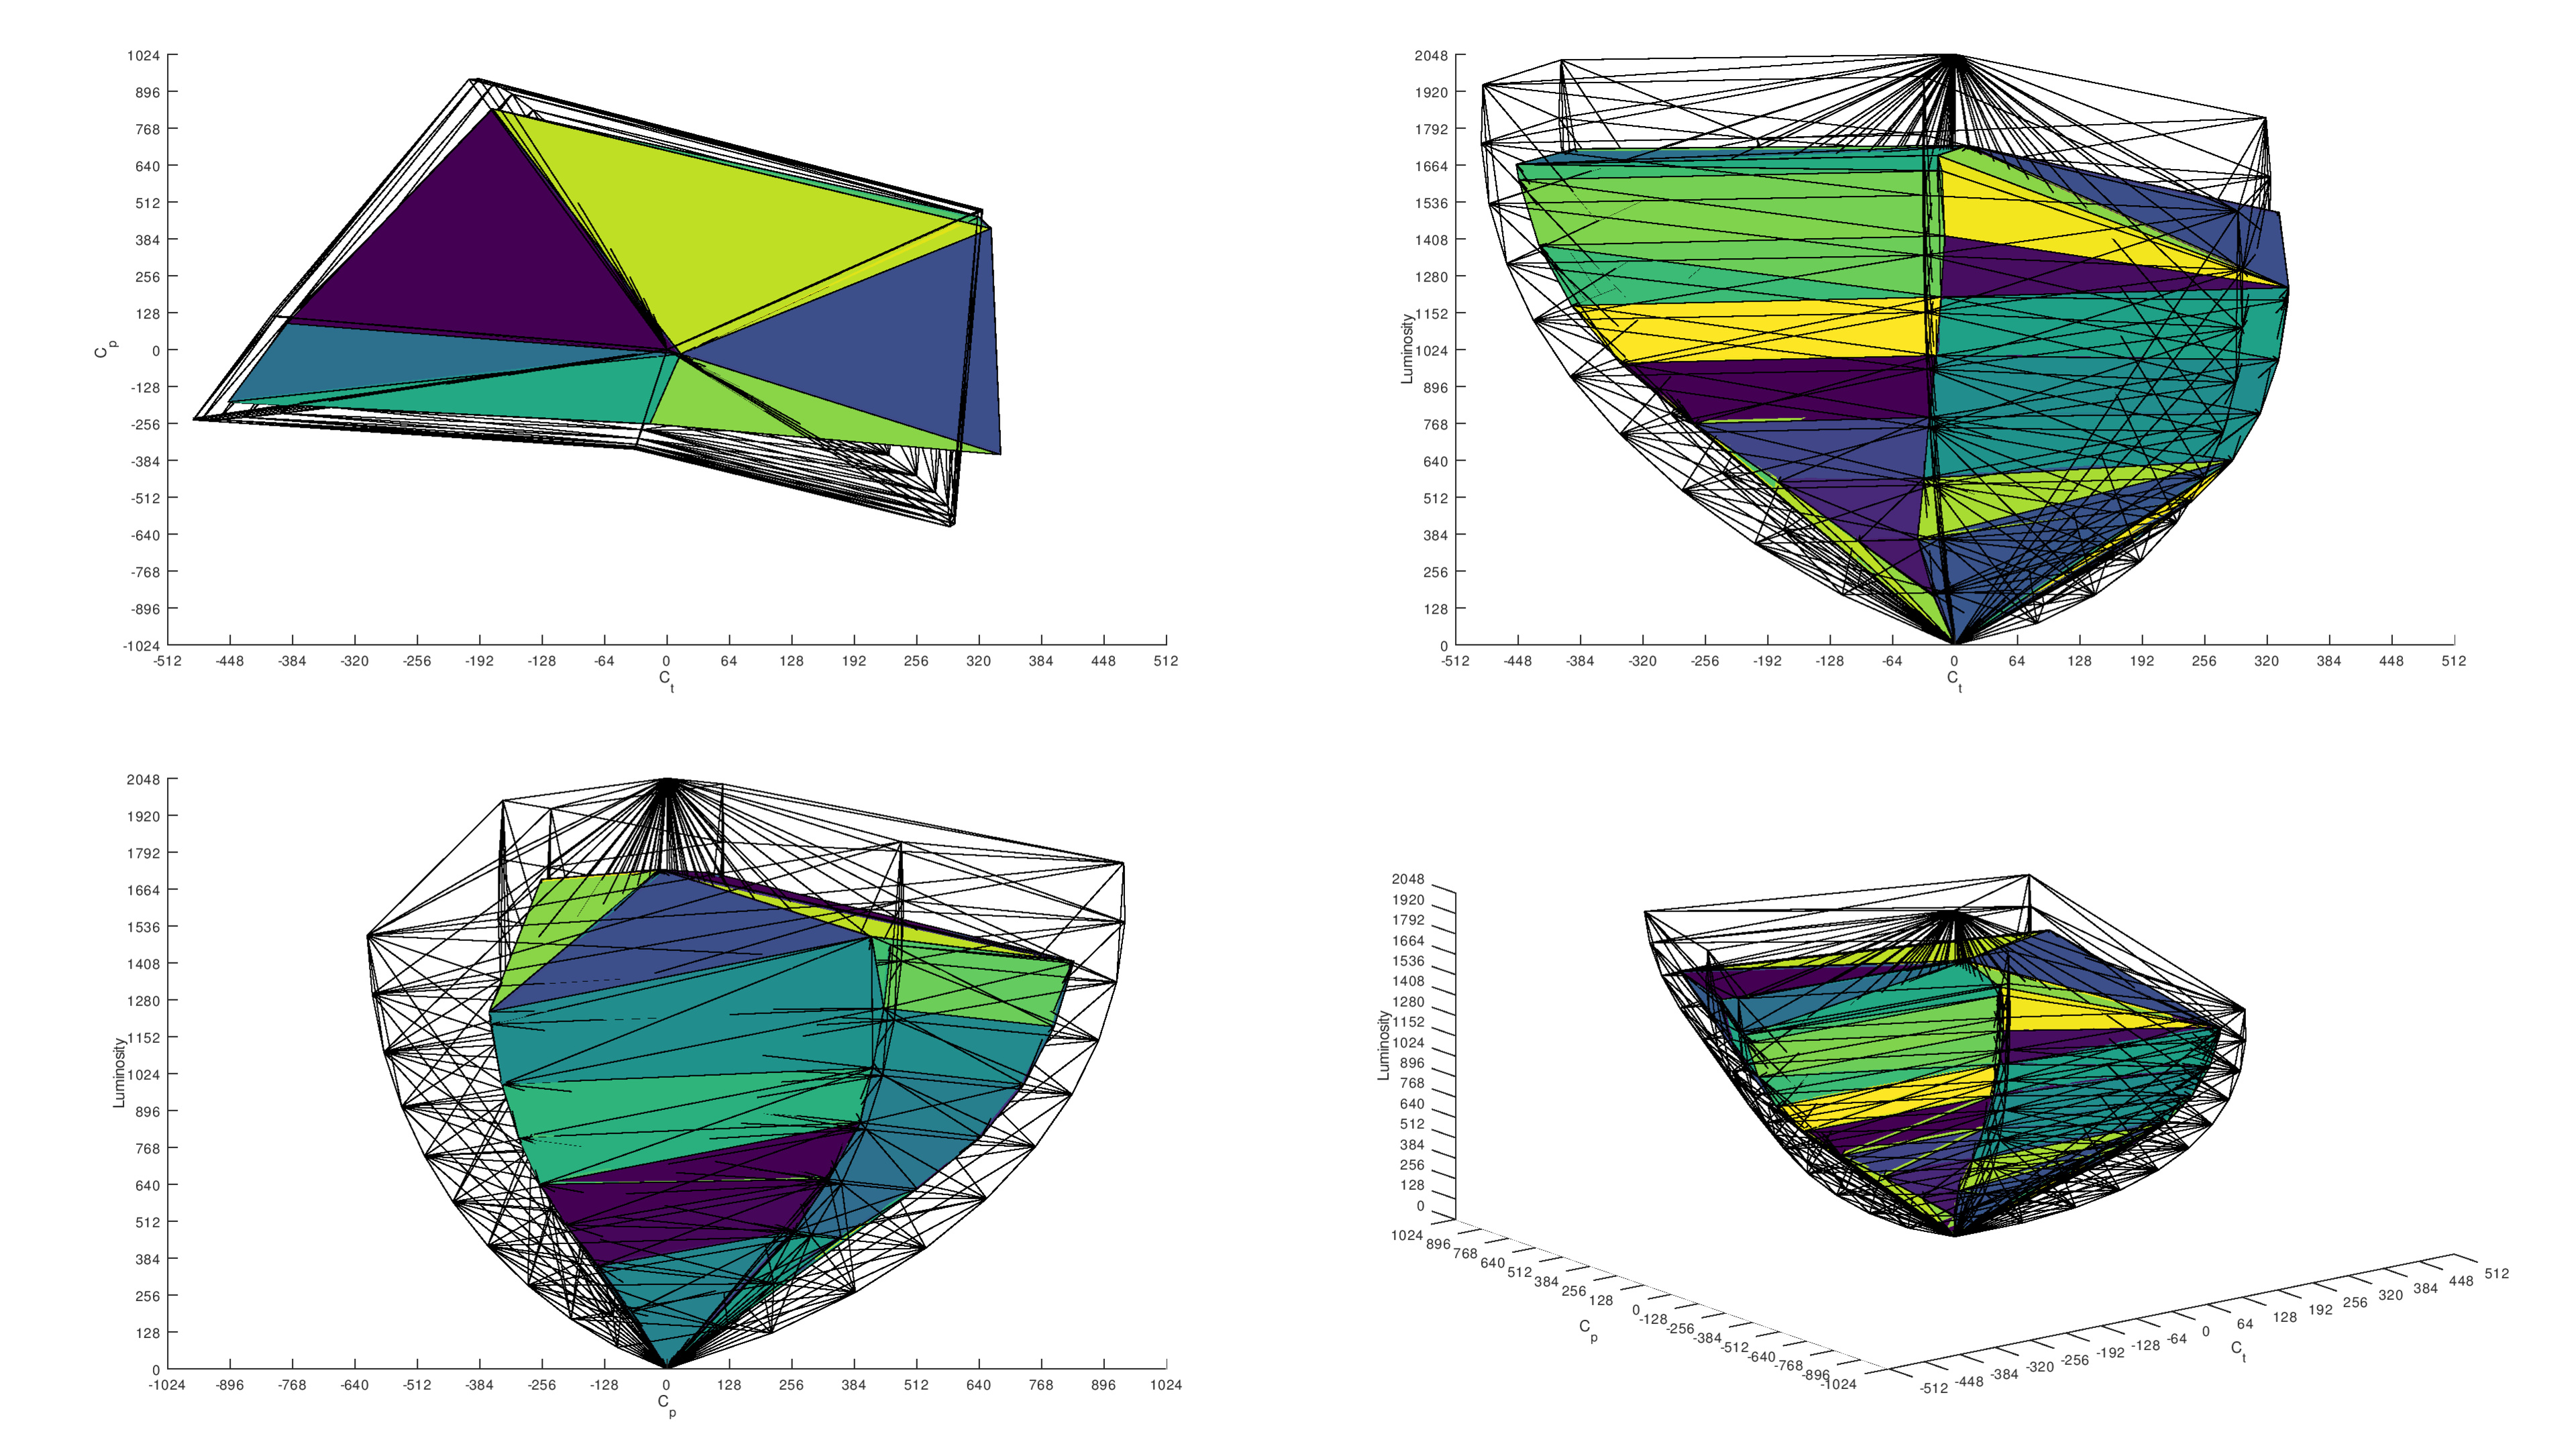
The gamut ring tests above look at SDR performance, but what about HDR? Our HDR color volume test takes hundreds of measurements across various brightness levels to show how bright and vivid colors get. These measurements are then recorded in two main tests. The first test takes those measurements relative to a theoretical TV at 1,000 nits. The second test evaluates the color volume in relation to a perfect TV at 10,000 nits.
The problem with this test is that, unlike the SDR tests above, it's done at various brightness levels, so the peak brightness and contrast of the display are just as important as the color technology used. As shown in the example above of the Hisense U9N, it performs extremely well at 1,000 nits; however, it struggles to display saturated colors in dim scenes. The 10,000 nit test shows more space that the TV can't reach, but this is mainly a limitation of the TV's peak brightness, and no TV on the market comes close to 100% on this test. As you can see, overall, the TV's contrast and brightness have a great impact on the overall range of colors that a TV can display in HDR, so while the color technology used is important, you really need to look at other metrics like contrast and brightness to get a full understanding of how well a TV performs in HDR.
Conclusion
They say you shouldn't judge a book by its cover, and you shouldn't judge a TV by the "QLED" label on the box, either. While most QLEDs deliver much better colors than regular LED TVs, a QLED label alone doesn't necessarily mean that you'll get those vivid colors you'd expect. There's also a lot more to a TV than just color reproduction, like contrast, peak brightness, processing, and motion handling, and none of these are affected by the color-enhancing layers found on a QLED. It's essential to consider the entire picture when selecting a TV.
Identifying QLED TVs
Marketing is one thing, but how can you actually tell if a TV you're looking at uses quantum dots? The bad news is that it's not really possible for the average consumer to determine this; the marketing can be misleading, and it can be difficult to know what's actually going on under the hood. There are even ongoing class-action lawsuits against TCL and Hisense over their QLED marketing claims, but both brands stand behind their marketing.
Quantum dots are typically composed of specific metallic and metalloid compounds, such as cadmium selenide (CdSe) and indium phosphide (InP). One way to determine the number of quantum dots in a particular TV is to use chemical analysis tools, such as X-ray Fluorescence (XRF), to identify the specific elemental composition of the TV's panel. That's a bit intense for a TV review, though, so it's not really an option.
 |
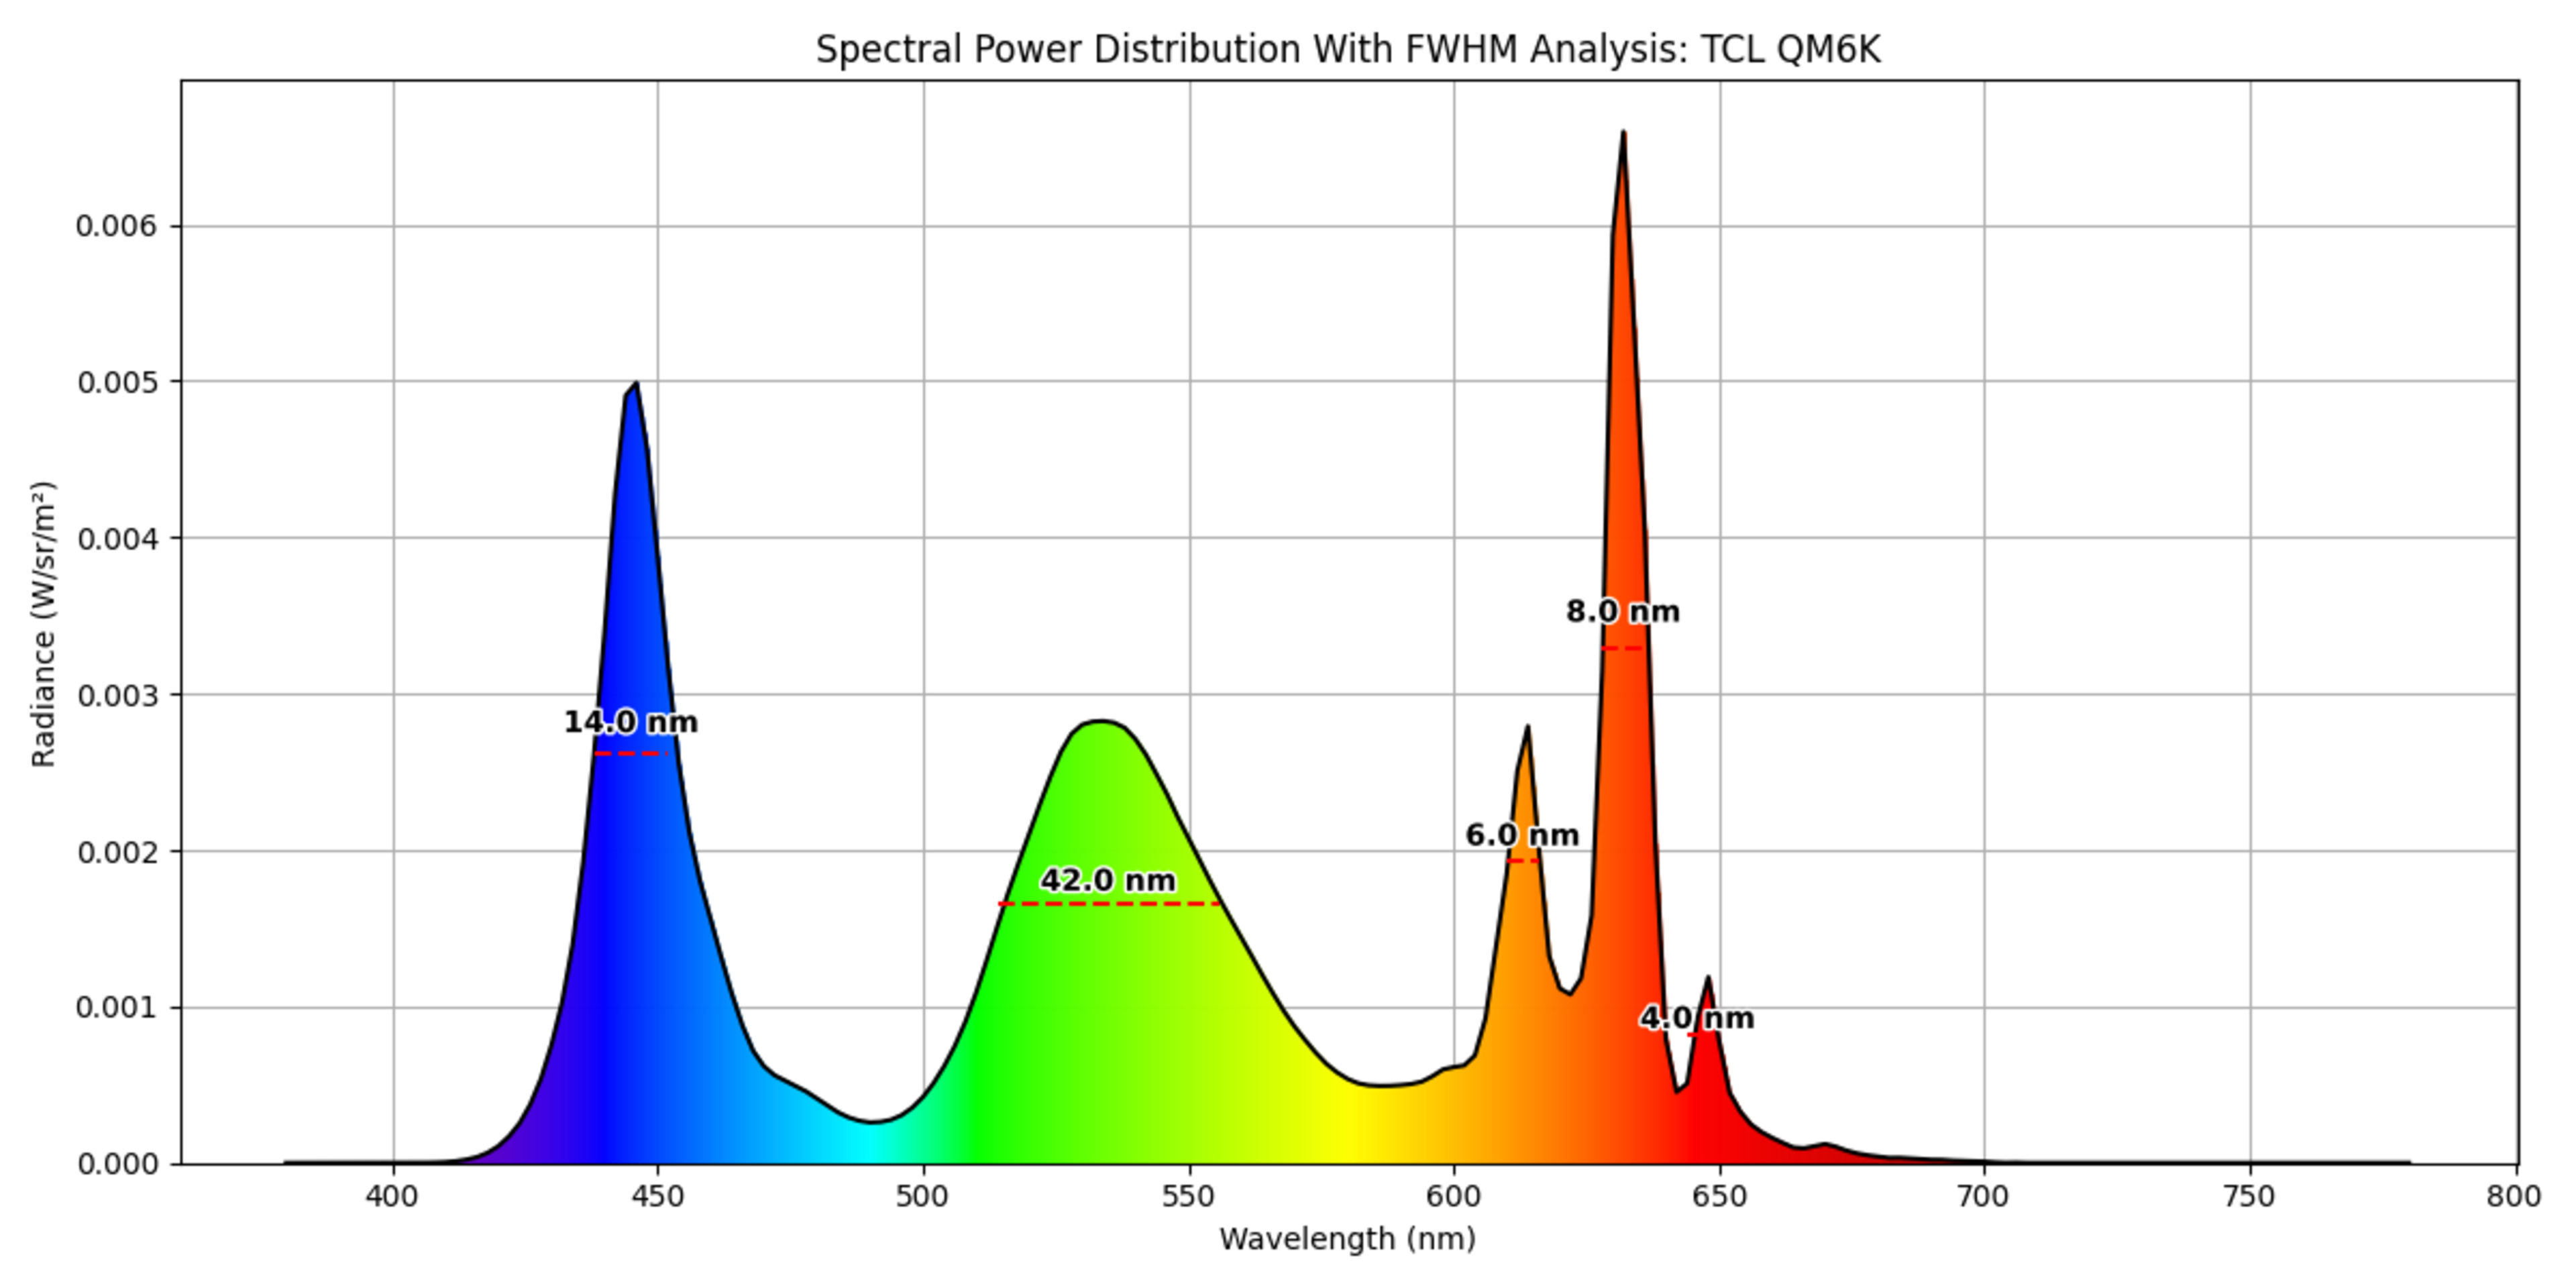 |
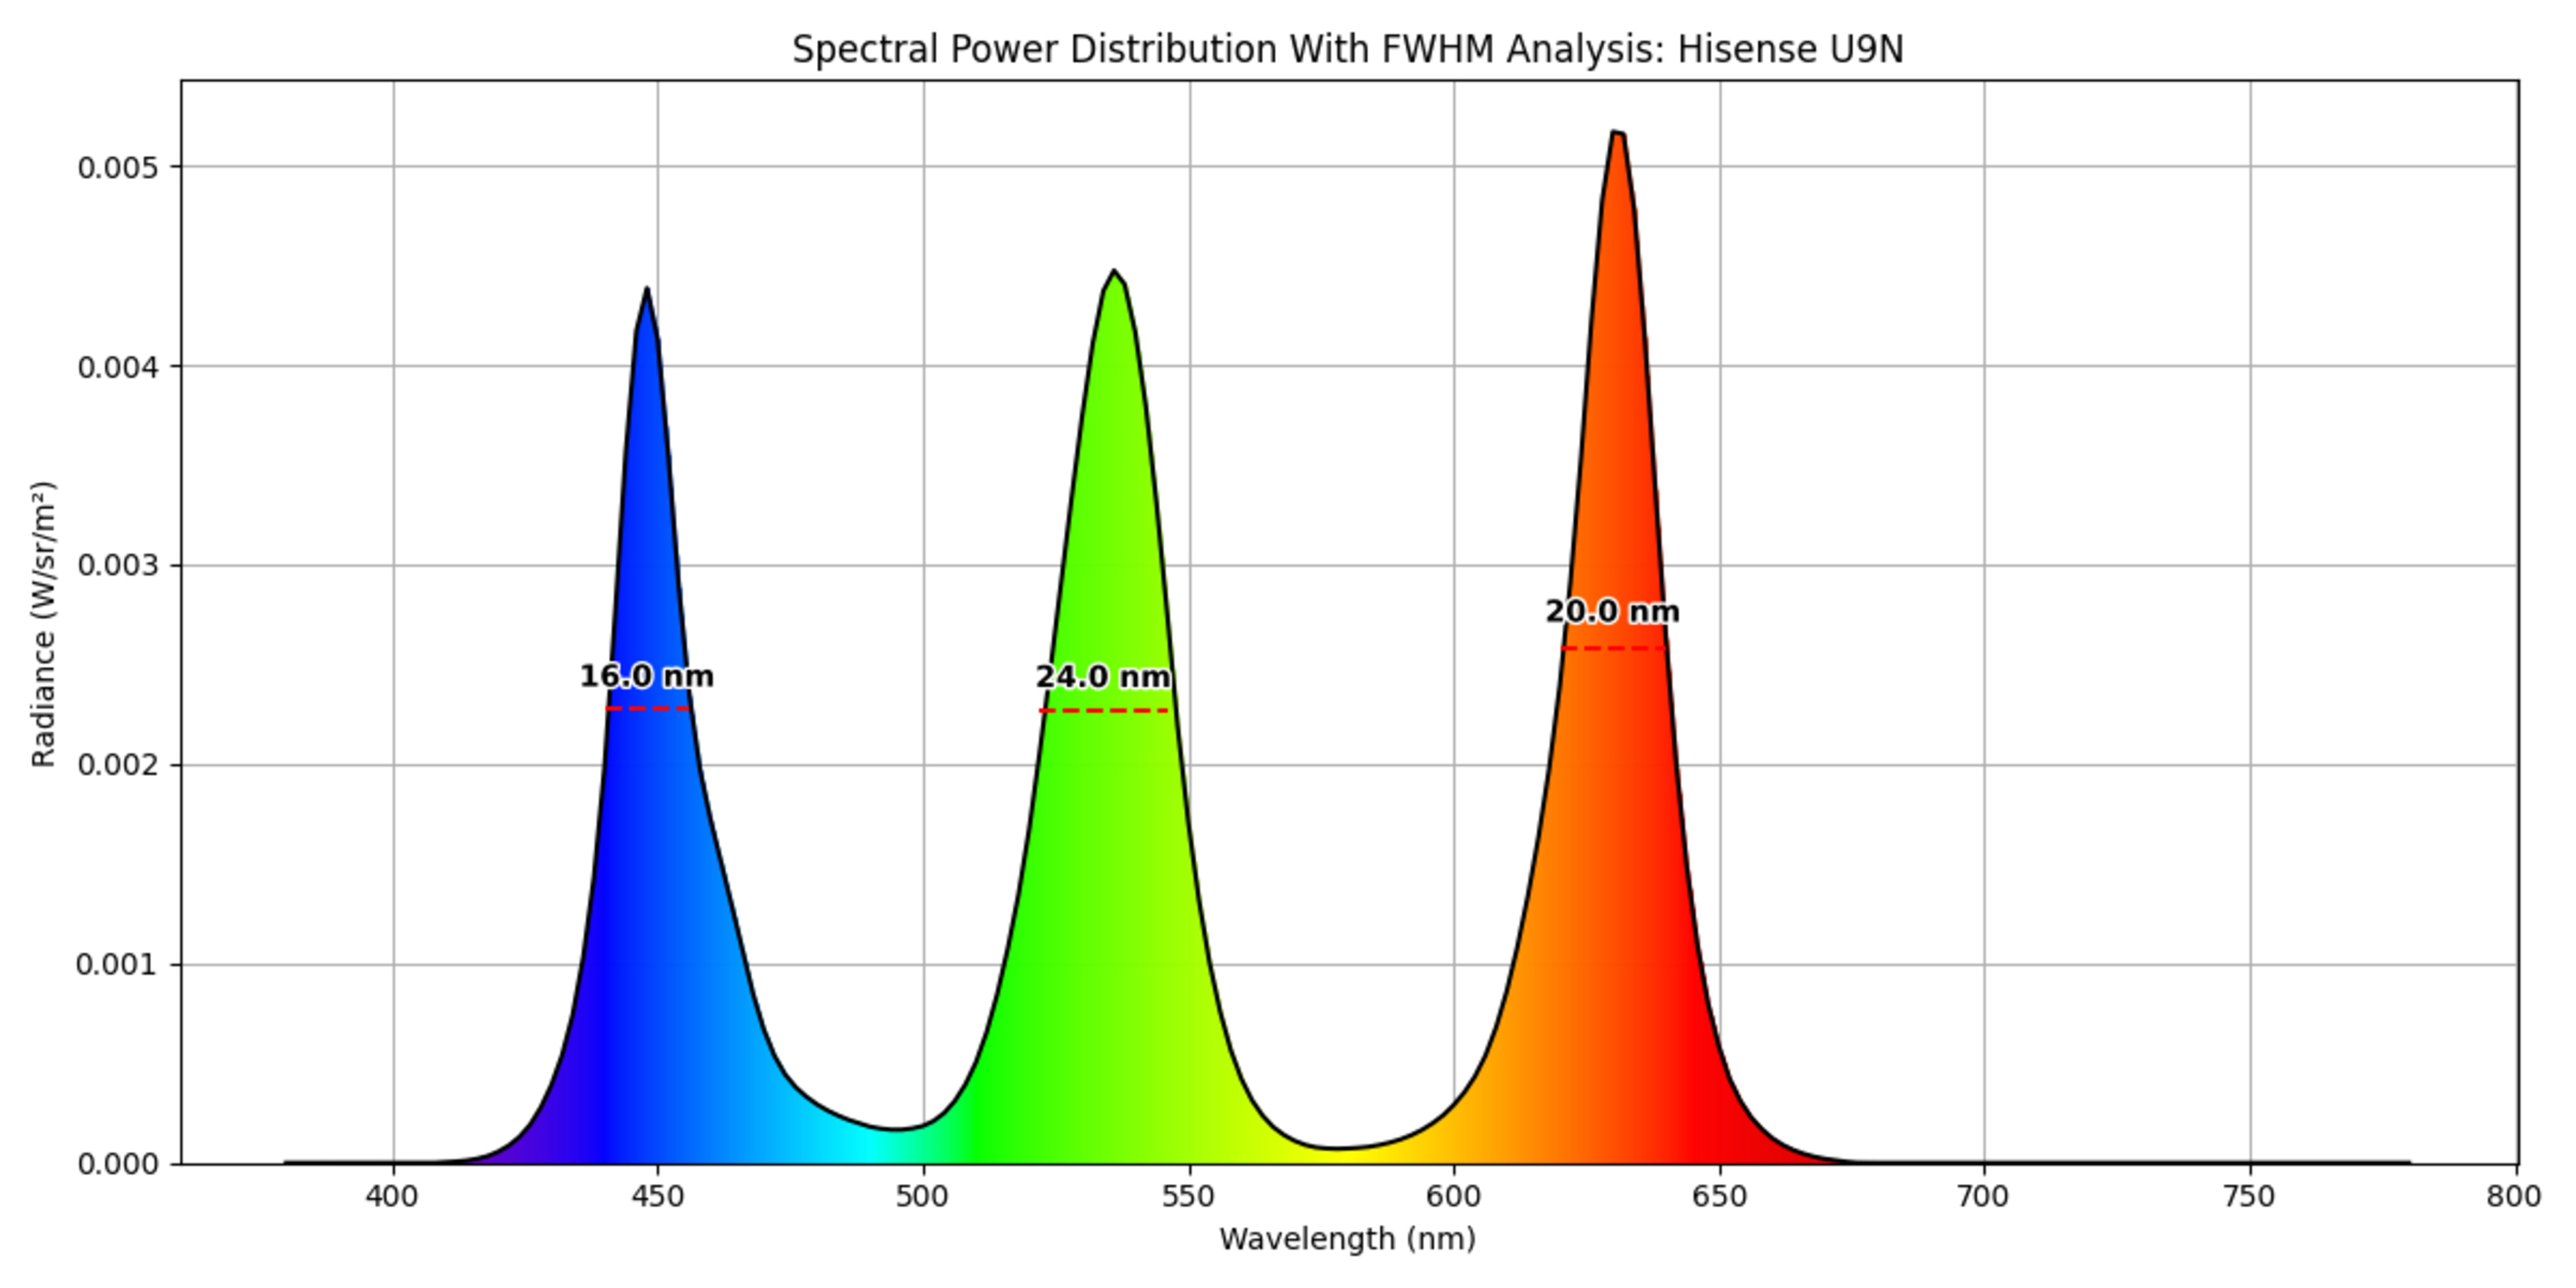
A more accessible way to determine the type of materials a panel uses is through the spectral power distribution (SPD) chart. The SPD chart is created by measuring the power of light emitted by the TV at each wavelength across the visible spectrum when it's displaying a pure white slide. Different materials produce distinct spectral signatures, and the narrowness of each peak and the amount of noise between primary colors are strong indicators of the technology used. One tool we can use to measure these differences is to calculate the full width at half maximum (FWHM) of each peak. The FWHM is a valuable tool for estimating the class of materials used, but unlike XRF, mentioned earlier, it cannot determine the exact chemical composition of the quantum dots.
Taking the examples above of the Hisense U9N and TCL QM6K, we can see a few clear differences. First, the blue peaks are nearly identical, with a very similar FWHM. This is normal, as most LED TVs use blue diodes in the backlight, so this light isn't actually passing through any color filter or quantum dot materials. Next up, there's a considerable difference in the green emission bands, with the Hisense delivering a very narrow peak with a 24 nm FWHM and the TCL coming in at a much wider 42 nm FWHM. This suggests that while both TVs utilize quantum dot technology, the Hisense model uses a cadmium-based QD, such as CdSe, whereas the TCL probably employs InP-based quantum dots. Given the environmental impact of heavy metals like cadmium, an increasing number of panel manufacturers are switching to InP quantum dots; however, they're not as effective as the cadmium-based options.
Finally, the reds are completely different. The U9N again has a very precise peak, with almost no noise between the green and red spikes and a very small FWHM. The QM6K, on the other hand, has multiple red peaks. This odd-looking SPD indicates that the TV is using a potassium fluorosilicate:Mn4+ phosphor, also called KSF or PSF. This technology offers a cheaper alternative to quantum dots, so you'll often find it on mid-range models that combine KSF and QD technology. These TVs typically offer better color reproduction than standard LED TVs, but generally perform worse than full QD models.
|
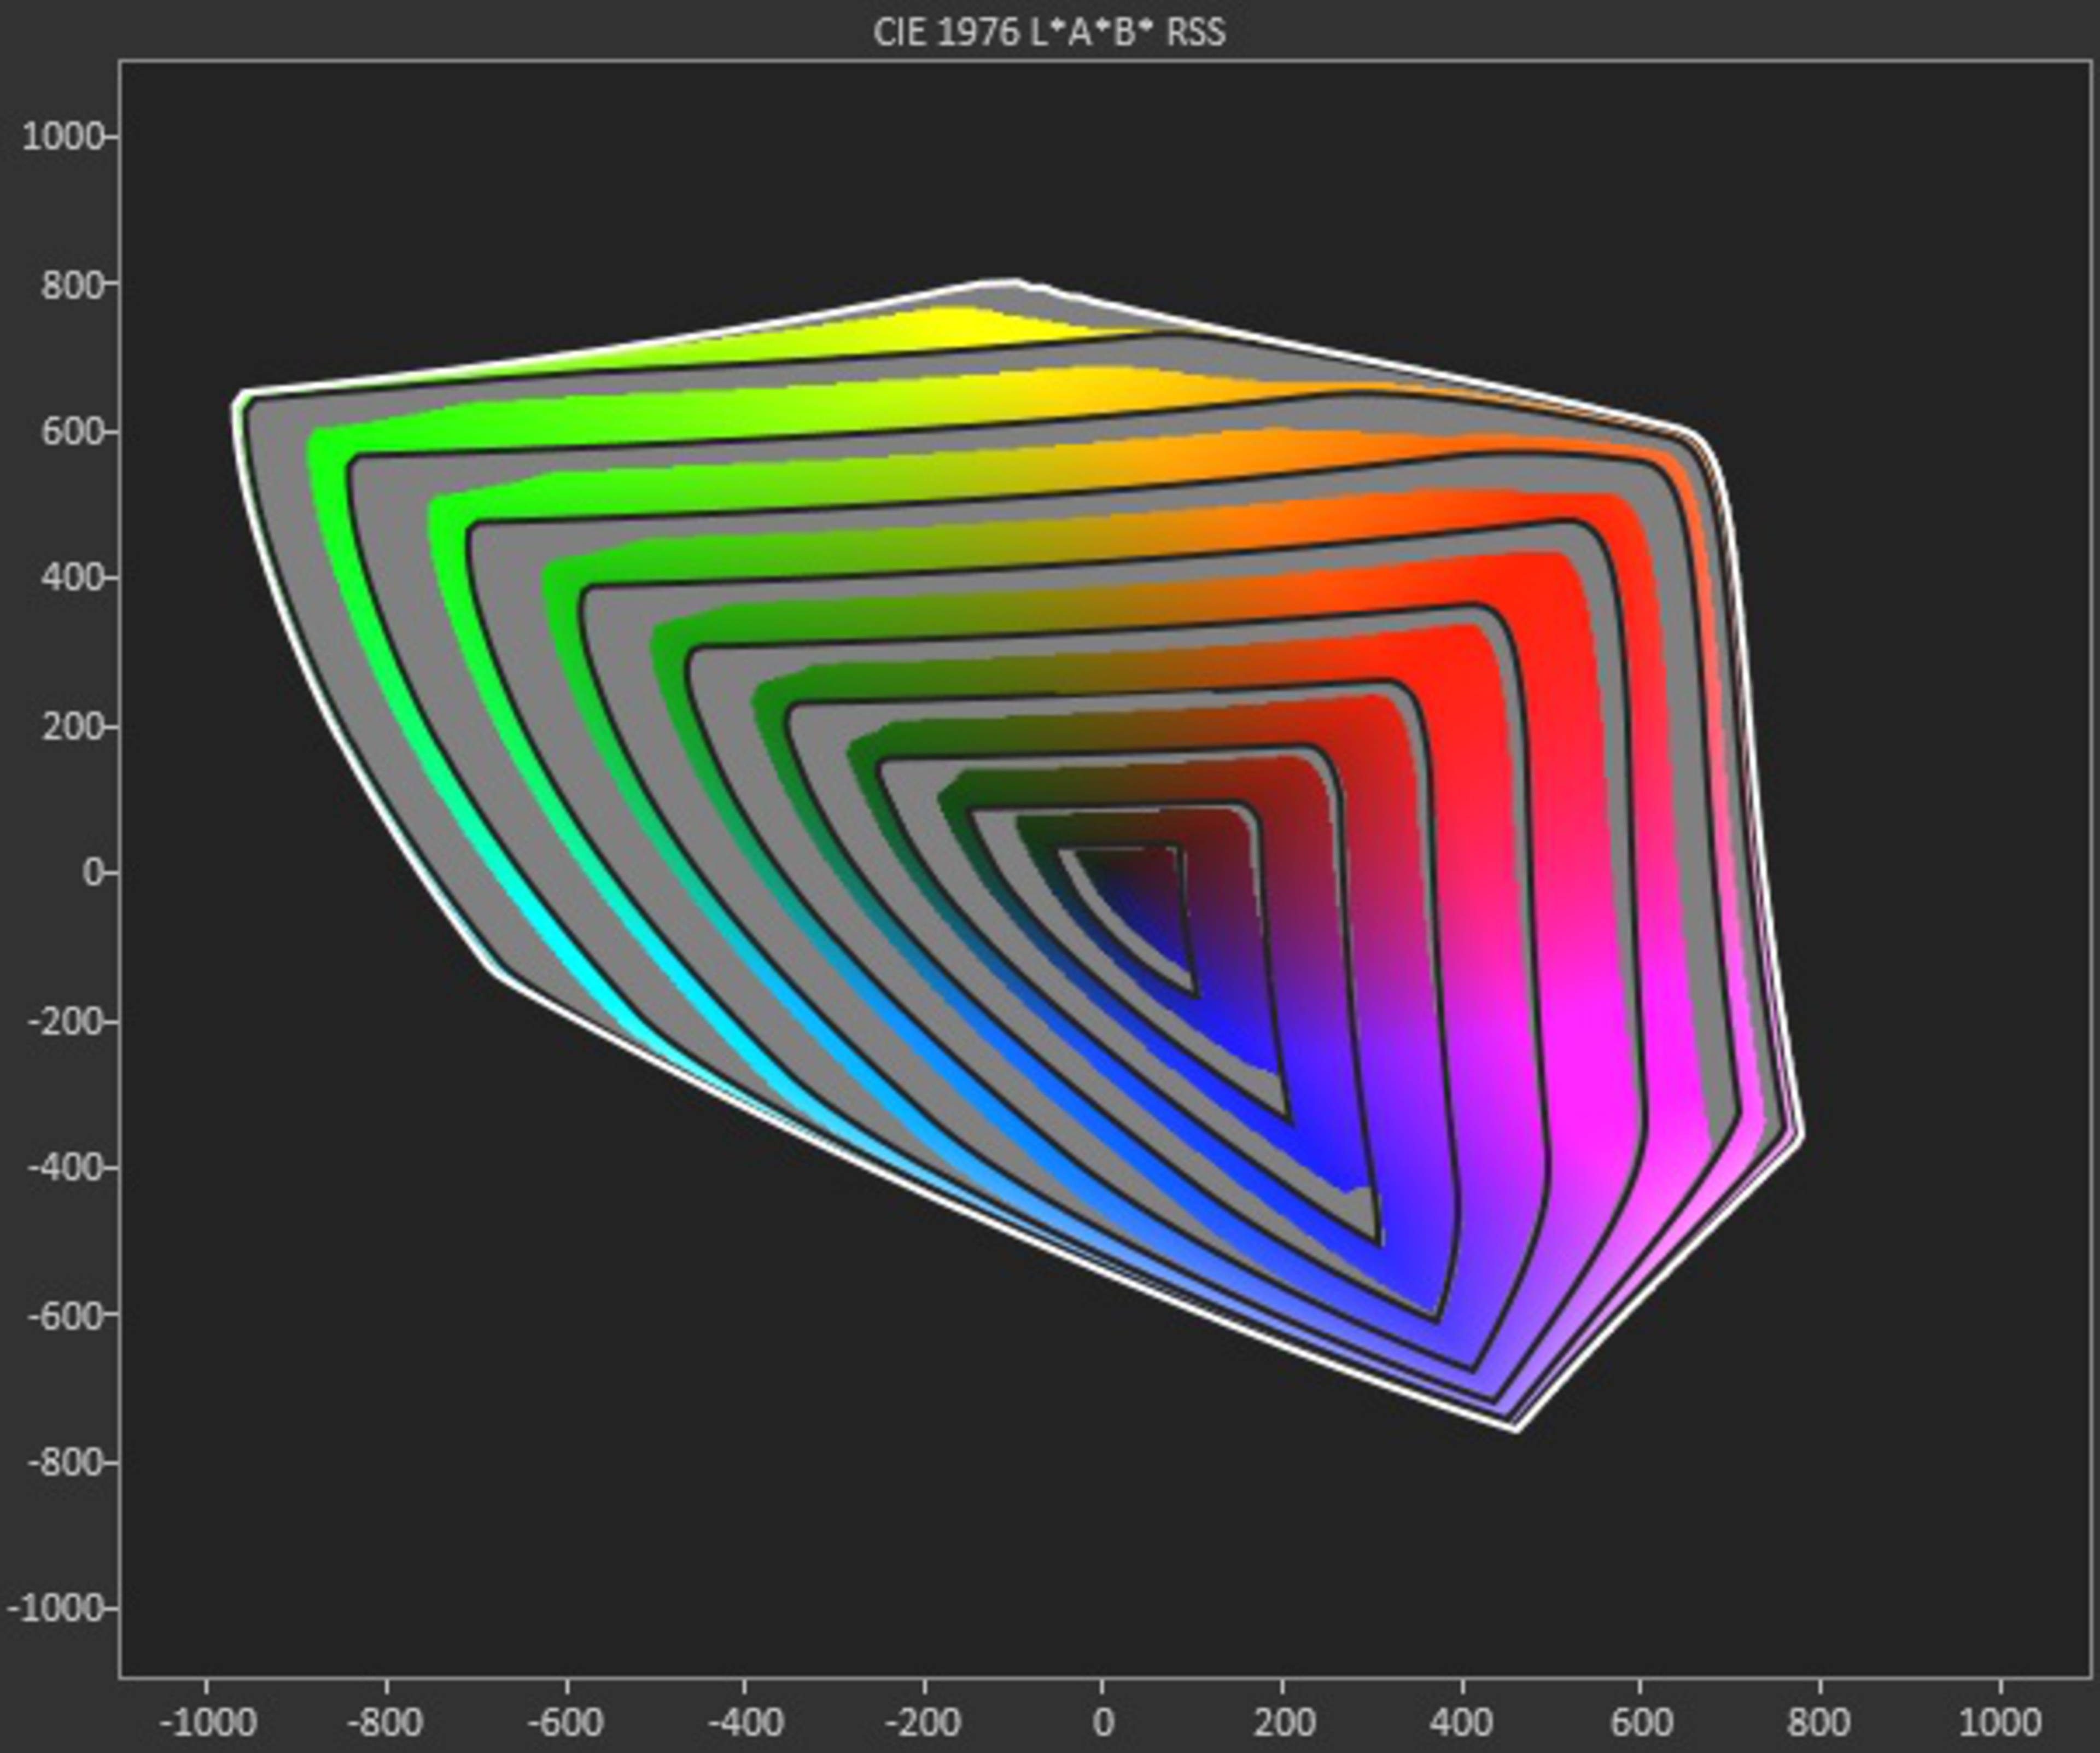 |
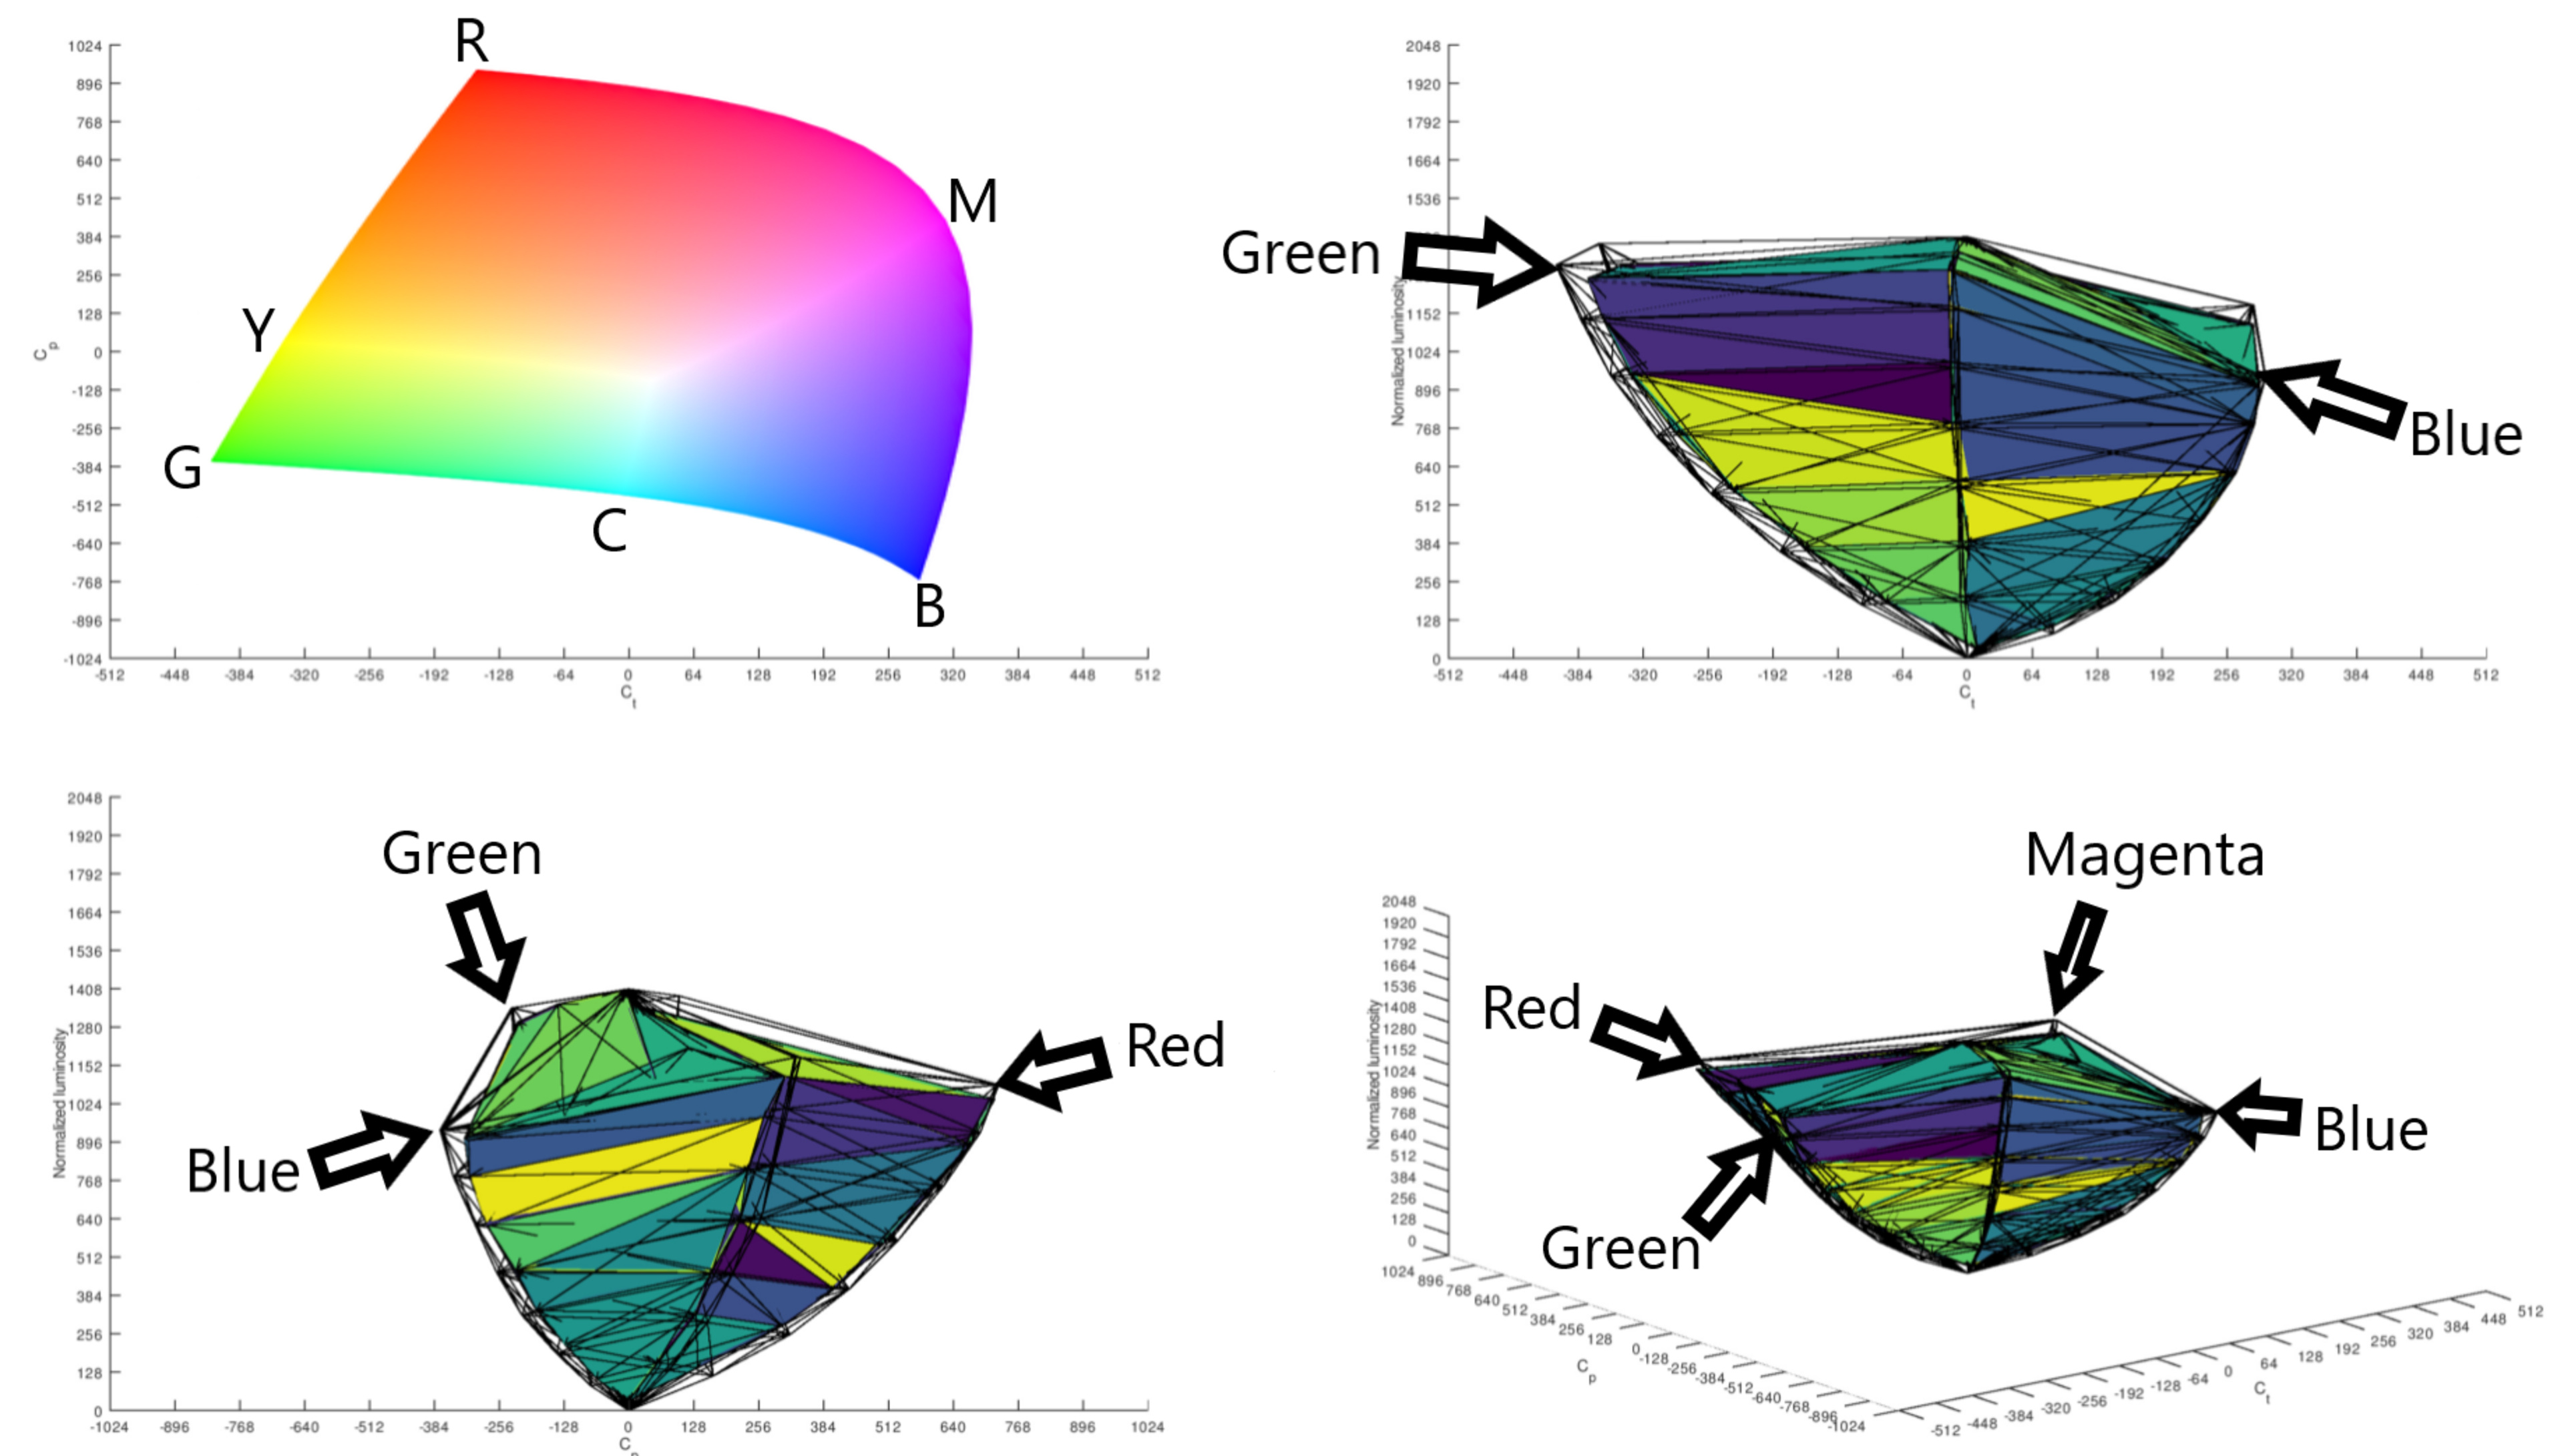
So how does this difference impact the end user experience? Looking at the color coverage, we can see some similarities between the two displays, but also some noticeable differences. Blue coverage of the two displays is nearly identical. They both do well with very saturated blues across all lightness levels. There's a bit more of a difference between them with reds, though, and you can see that the QM6K struggles a bit more with very saturated reds. The difference in green is very noticeable as well, and while the U9N still struggles a bit to display the full range, it's a lot better than the QM6K.
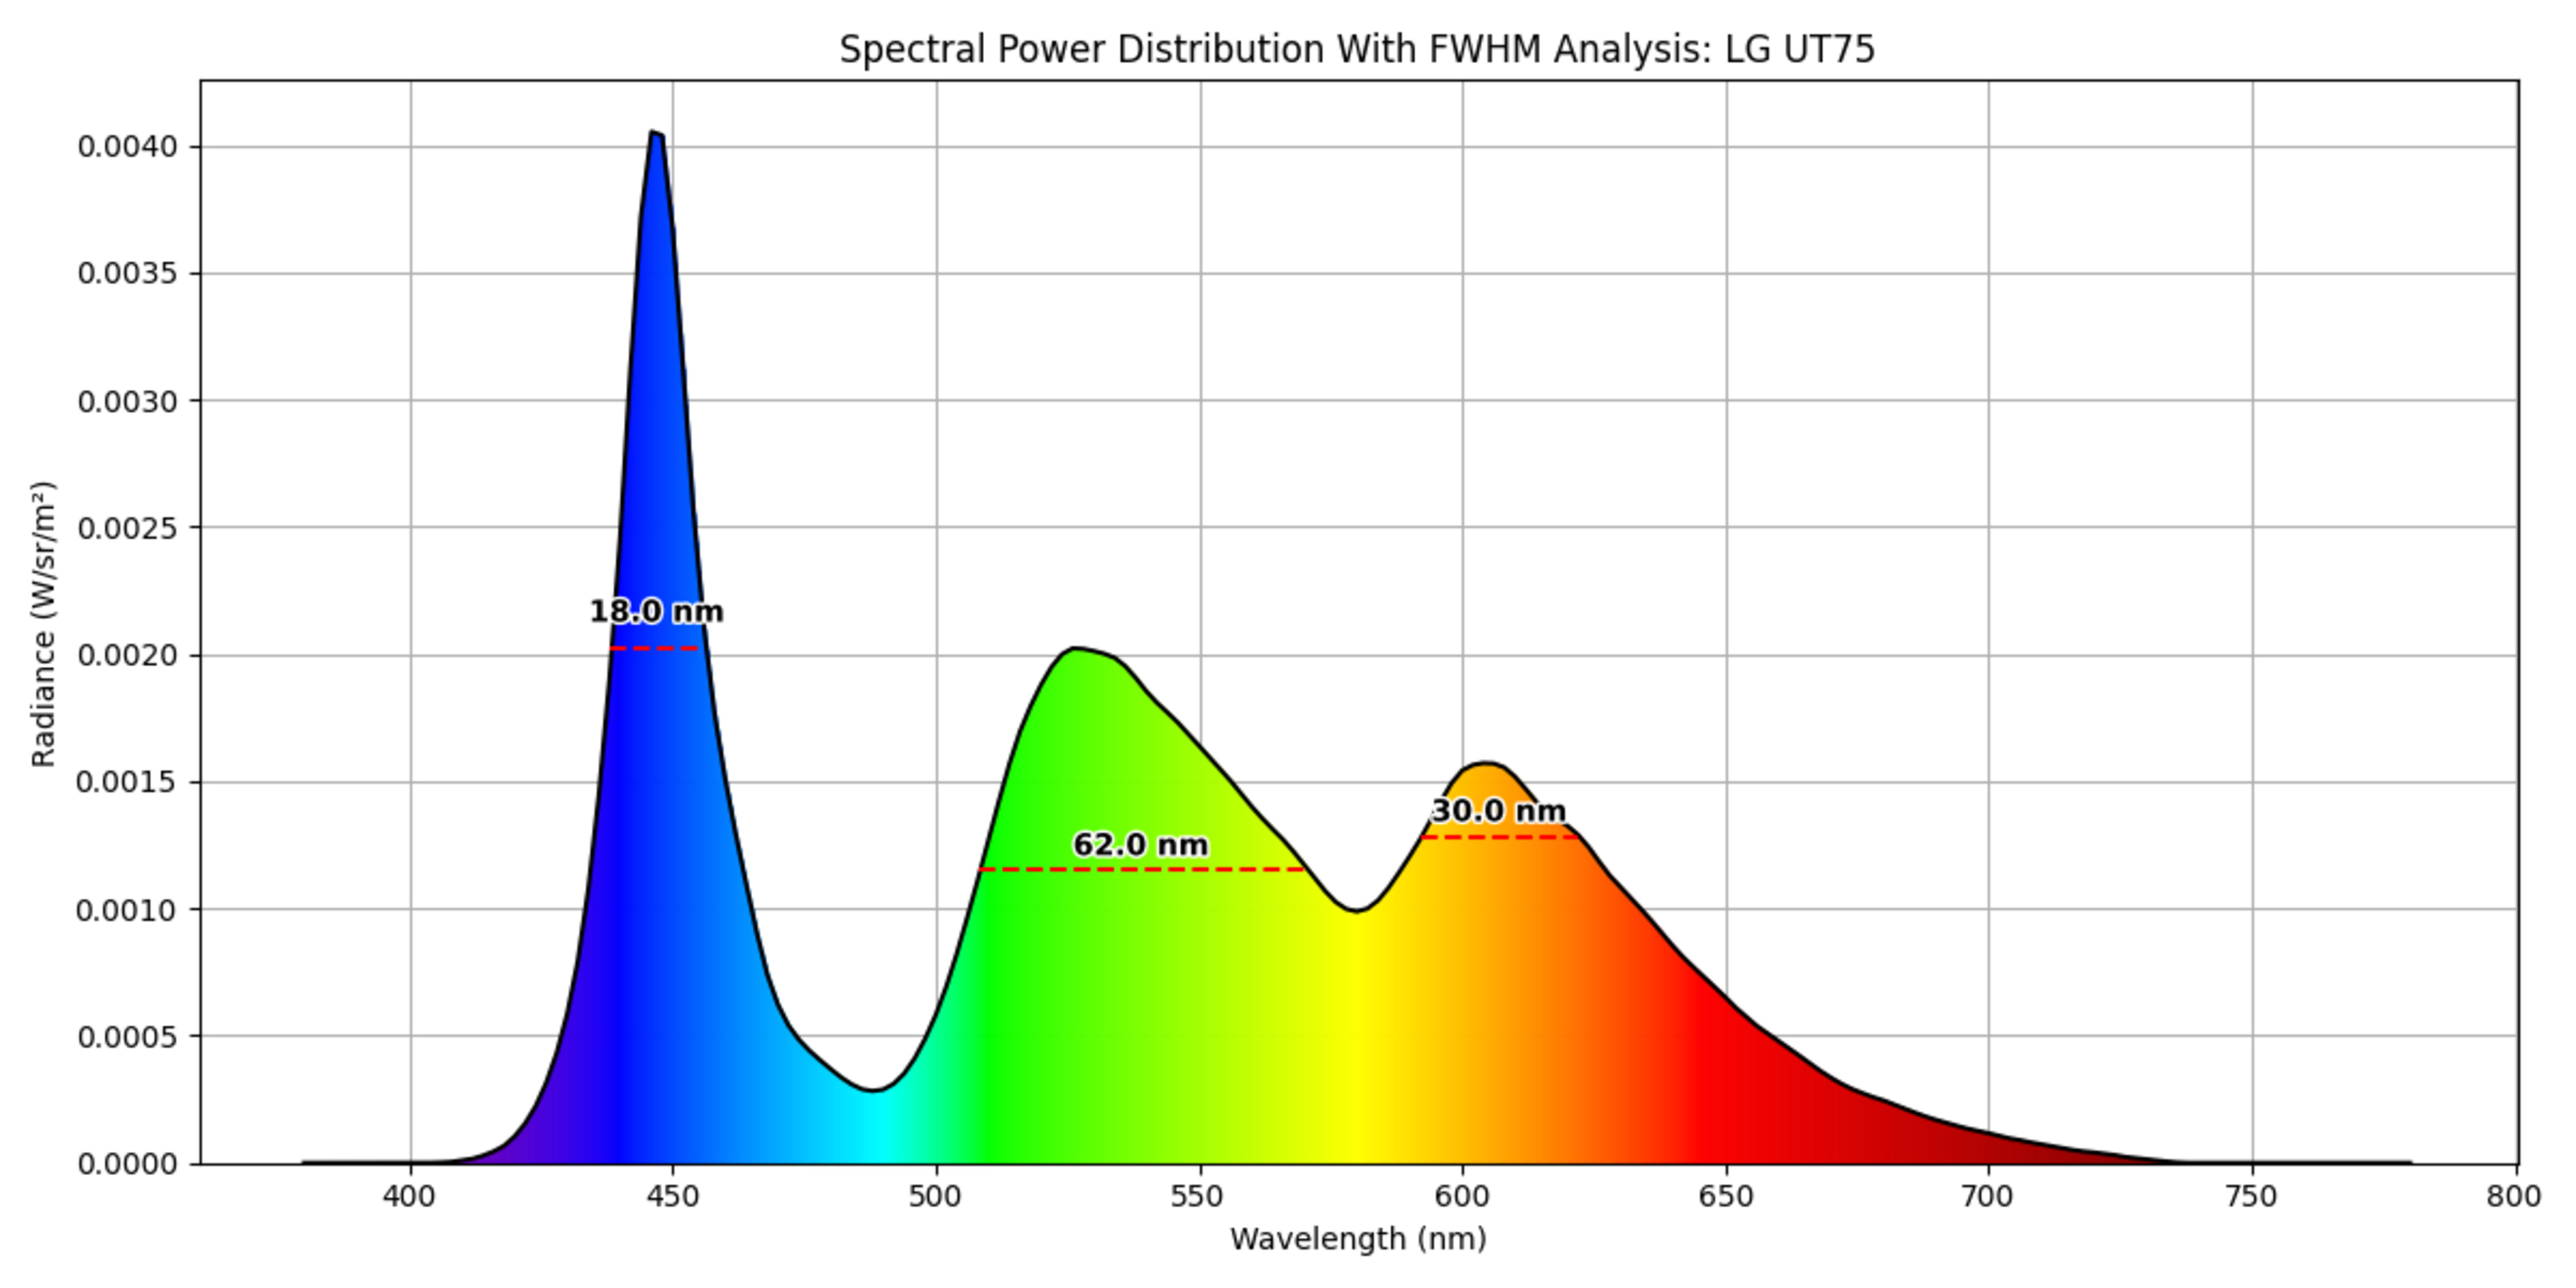
Despite the differences between the Hisense U9N and TCL QM6K, it's important to note that both clearly utilize quantum dot technology, at least in part. Their performance differences simply prove that QD technology comes in many different types that perform differently. Compare their SPDs to the LG UT75 above, which doesn't use any color-enhancing technologies, and you can clearly see the difference. There's almost no separation of color between green and red, resulting in significantly lower CIELAB BT.2020 coverage (46.60%).
All of this demonstrates that the separation of colors and the narrowness of the emission bands for each color can have a significant impact on the range of colors a TV can display. It's not the only factor in color reproduction, but it is very important. Not all QLEDs are created equally, and it's easy to get lost in the marketing. Therefore, it's essential to consider how a TV performs overall. Don't just buy it because it says "QLED" on the box.