Products
Tested using Methodology v1.11
Updated Nov 12, 2025 07:55 PM
Tested using Methodology v2.2
Updated May 28, 2026 01:18 PM

Our Verdict
TCL Q750G
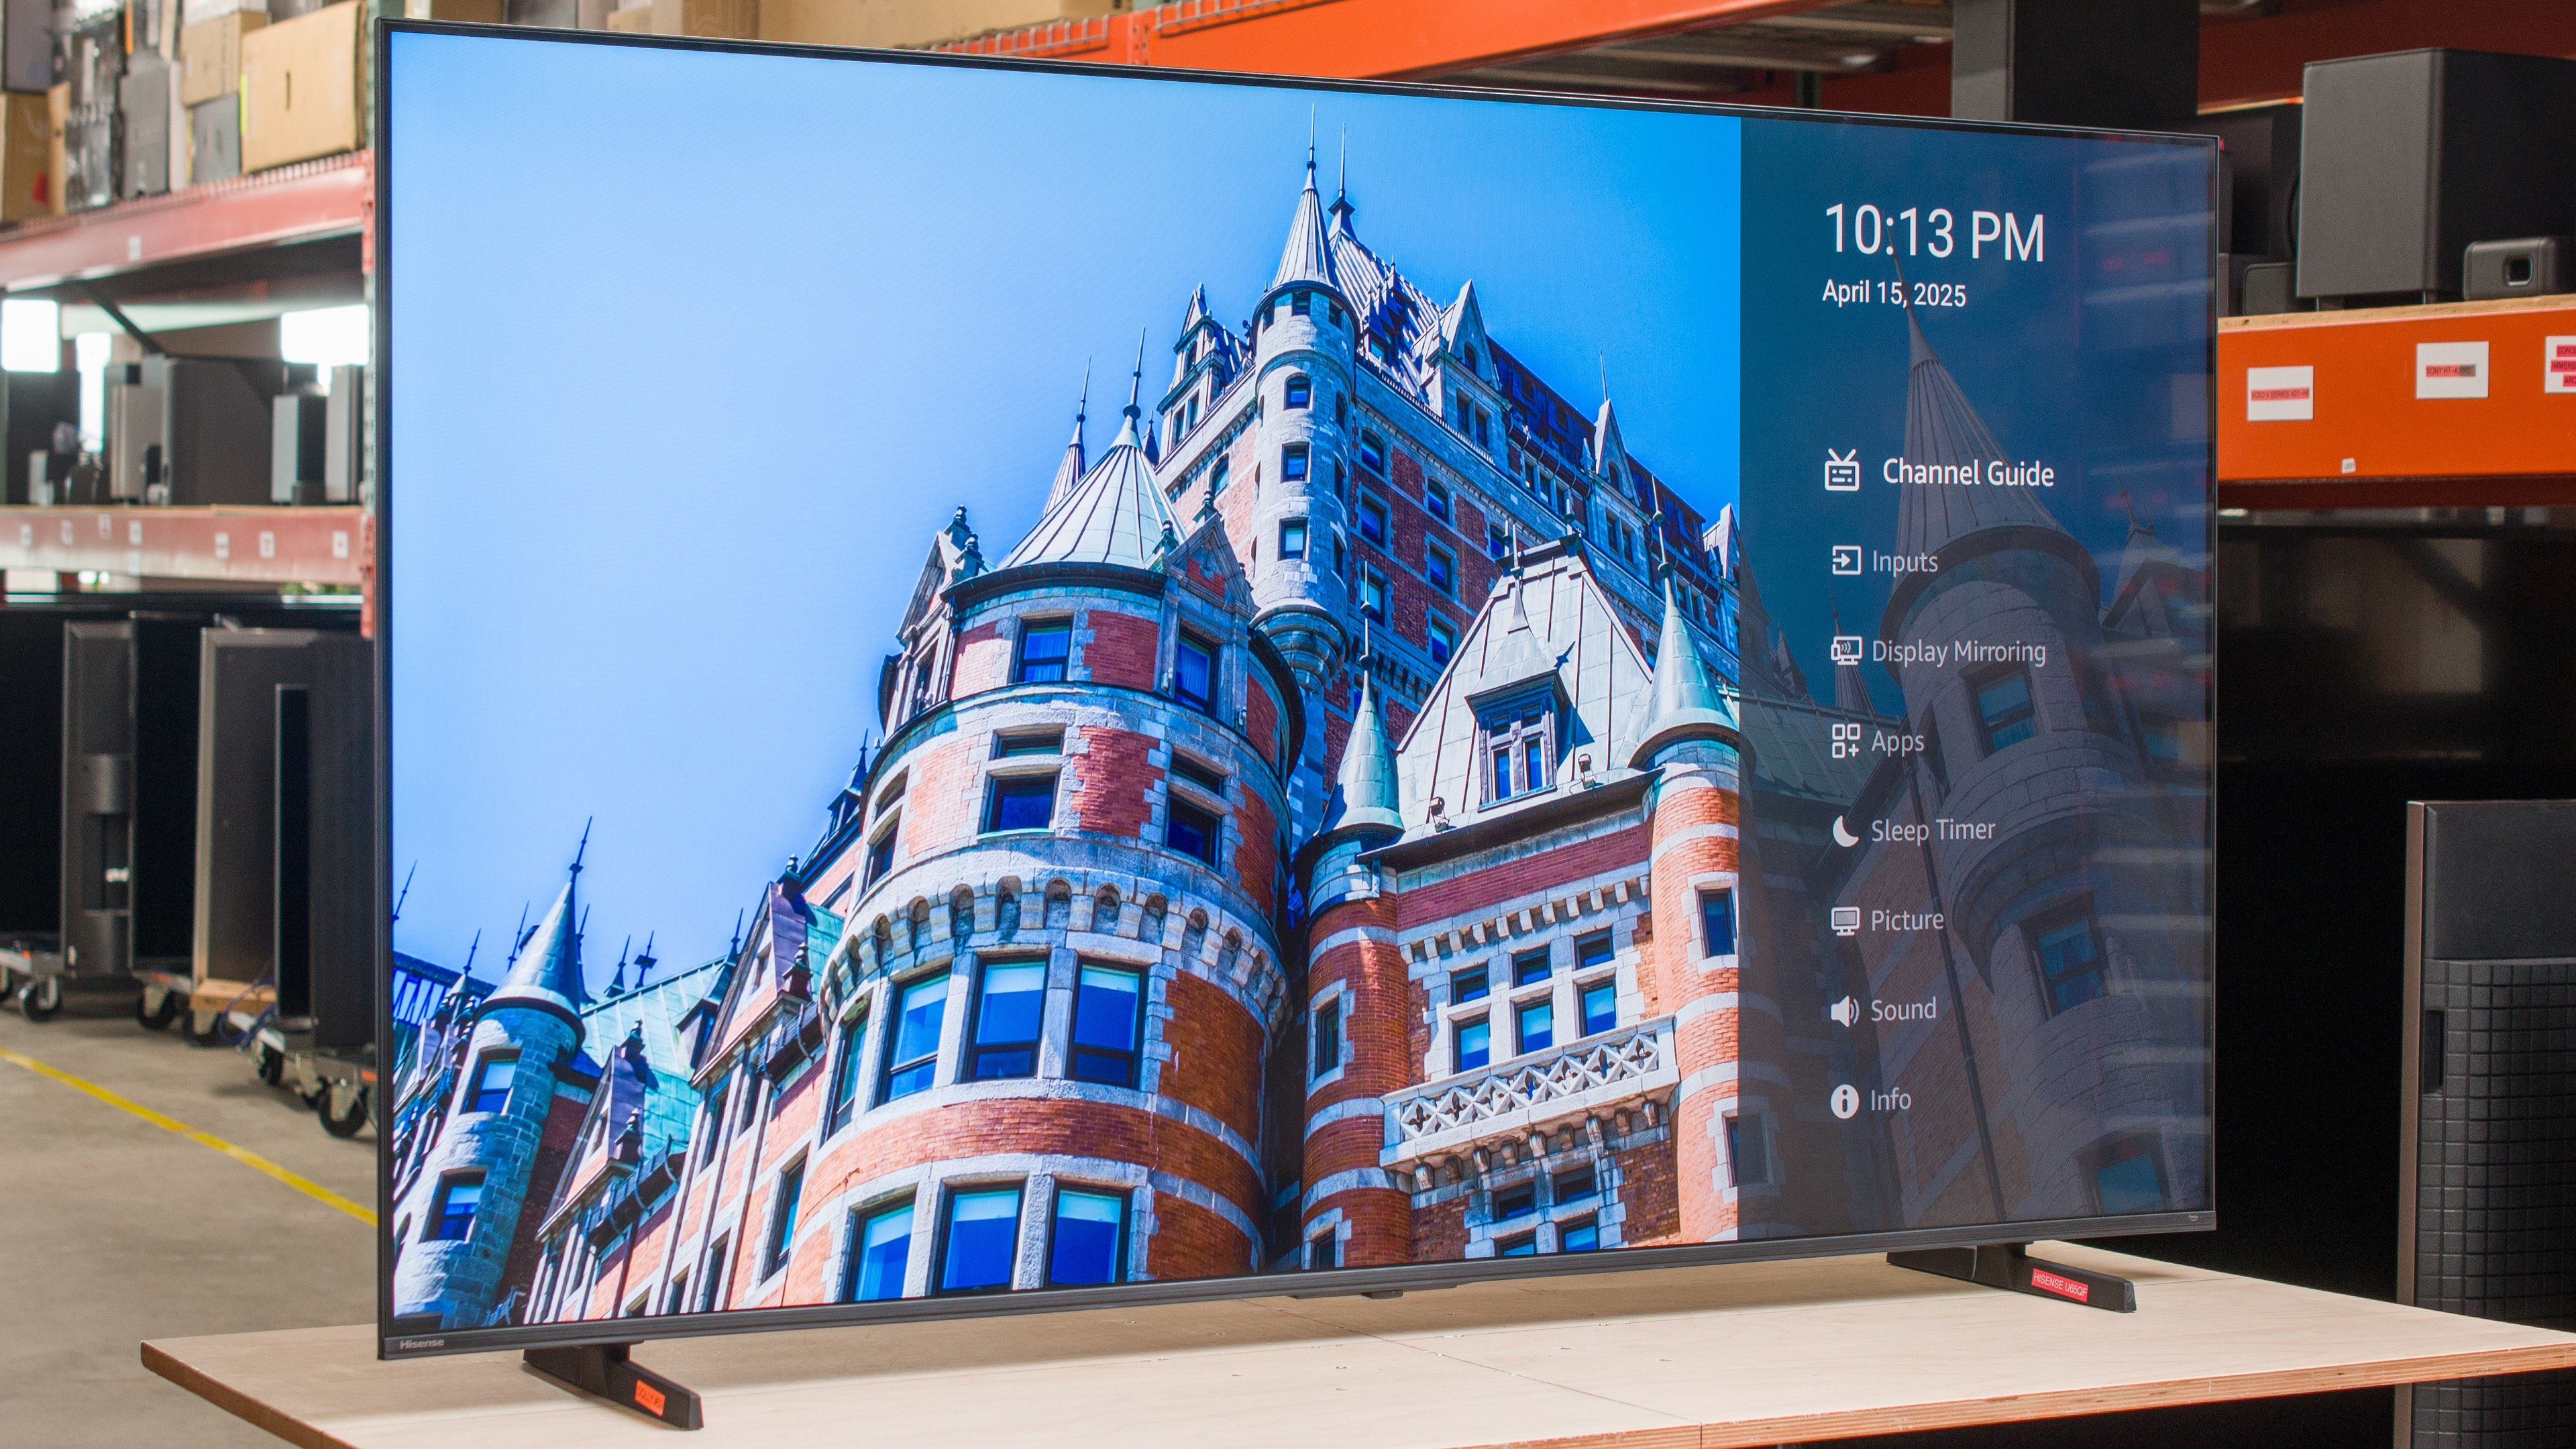
Hisense U65QF
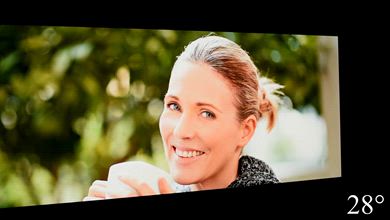
The TCL Q750G and the Hisense U65QF are similar overall, but the TCL is better. The Hisense has the slight edge in contrast, but the TCL has less blooming and better black uniformity, giving the TCL more well-rounded black levels. The TCL has much better PQ EOTF tracking, so it stays truer to the filmmaker's intent in HDR. Additionally, the TCL has better overall image processing. That said, the Hisense does have a wider viewing angle, making it the better option if you're watching the TV from a slight angle.
Variants
- 55Q750G (55")
- 65Q750G (65")
- 55U65QF (55")
- 65U65QF (65")
Check Price
Main Differences for
Mixed Usage
Threshold
Major Test Bench Update: Two or more of the products being compared have been tested with different TV test methodologies after a major update. Some of the test results aren't directly comparable, and are hidden. Learn more
Mixed Usage
Full Comparison
HDR Brightness
HDR Hallway Photo

HDR Cityscape Photo

HDR Landscape Photo

Hallway Lights (~1950 cd/m²)
Yellow Skyscraper (~700 cd/m²)
Landscape Pool (~300 cd/m²)
Peak 2% Window
Peak 10% Window
Peak 25% Window
Peak 50% Window
Peak 100% Window
Sustained 2% Window
Sustained 10% Window
Sustained 25% Window
Sustained 50% Window
Sustained 100% Window
Automatic Brightness Limiting (ABL)
HDR Brightness In Game Mode
HDR Hallway Photo

HDR Cityscape Photo

HDR Landscape Photo

Hallway Lights (~1950 cd/m²)
Yellow Skyscraper (~700 cd/m²)
Landscape Pool (~300 cd/m²)
Peak 2% Window
Peak 10% Window
Peak 25% Window
Peak 50% Window
Peak 100% Window
Sustained 2% Window
Sustained 10% Window
Sustained 25% Window
Sustained 50% Window
Sustained 100% Window
Automatic Brightness Limiting (ABL)
SDR Brightness
Real Scene Peak Brightness
Peak 2% Window
Peak 10% Window
Peak 25% Window
Peak 50% Window
Peak 100% Window
Sustained 2% Window
Sustained 10% Window
Sustained 25% Window
Sustained 50% Window
Sustained 100% Window
Automatic Brightness Limiting (ABL)
Contrast
Contrast Picture

Contrast
Native Contrast
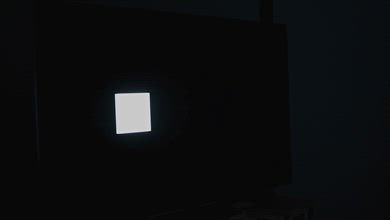
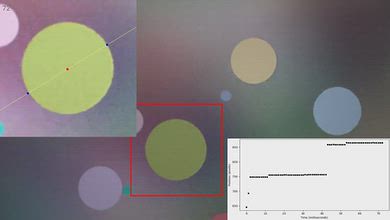
Blooming
Blooming Photo

Lighting Zone Transitions
Preferred LD Video, Moving Object

Local Dimming
Backlight
Dimming Zones Count Of Tested TV
Contrast And Dark Details In Game Mode
Blooming Photo In Game Mode

Preferred LD Video, Moving Object In Game Mode
Game Transitions With VRR And Preferred LD

HDR Brightness
HDR Hallway Photo
HDR Cityscape Photo
HDR Landscape Photo
Hallway Lights (~1950 cd/m²)
Yellow Skyscraper (~700 cd/m²)
Landscape Pool (~300 cd/m²)
Peak 2% Window
Peak 10% Window
Peak 25% Window
Peak 50% Window
Peak 100% Window
Sustained 2% Window
Sustained 10% Window
Sustained 25% Window
Sustained 50% Window
Sustained 100% Window
Automatic Brightness Limiting (ABL)
HDR Brightness In Game Mode
HDR Hallway Photo
HDR Cityscape Photo
HDR Landscape Photo
Hallway Lights (~1950 cd/m²)
Yellow Skyscraper (~700 cd/m²)
Landscape Pool (~300 cd/m²)
Peak 2% Window
Peak 10% Window
Peak 25% Window
Peak 50% Window
Peak 100% Window
Sustained 2% Window
Sustained 10% Window
Sustained 25% Window
Sustained 50% Window
Sustained 100% Window
Automatic Brightness Limiting (ABL)
PQ EOTF Tracking
PQ EOTF Graph

600 Nit Tracking Delta
1000 Nit Tracking Delta
4000 Nit Tracking Delta
SDR Brightness
Real Scene Peak Brightness
Peak 2% Window
Peak 10% Window
Peak 25% Window
Peak 50% Window
Peak 100% Window
Sustained 2% Window
Sustained 10% Window
Sustained 25% Window
Sustained 50% Window
Sustained 100% Window
Automatic Brightness Limiting (ABL)
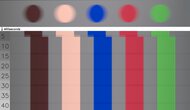
Color Gamut
Wide Color Gamut
Color Gamut DCI-P3 Picture

DCI P3 xy
DCI P3 uv
Color Gamut Rec.2020 Picture

Rec 2020 xy
Rec 2020 uv
Color Volume
P3 Color Volume ITP Picture

1,000 cd/m² DCI P3 Coverage ITP
2020 Color Volume ITP Picture

10,000 cd/m² Rec 2020 Coverage ITP
White Luminance
Red Luminance
Green Luminance
Blue Luminance
Cyan Luminance
Magenta Luminance
Yellow Luminance
Pre Calibration
Pre White Balance Picture

Pre Gamma Curve Picture

Pre Color Picture

White Balance dE
Color dE
Gamma
Color Temperature
Picture Mode
Color Temp Setting
Gamma Setting
Post Calibration
Post White Balance Picture

Post Gamma Curve Picture

Post Color Picture

White Balance dE
Color dE
Gamma
Color Temperature
White Balance Calibration
Color Calibration
Gray Uniformity
50% Uniformity Picture

50% Std. Dev.
50% DSE
5% Uniformity Picture

5% Std. Dev.
5% DSE
Black Uniformity
Black Uniformity Picture With Preferred Local Dimming

Std. Dev.
Native Black Uniformity Picture

Native Std. Dev.
Viewing Angle
Viewing Angle Video
Chroma Graph

Color Washout
Hue Graph

Color Shift
Lightness Graph

Brightness Loss
Black Level Raise
Gamma Shift
Reflections
Reflections Picture

Average Room Off Picture

Bright Room Off Picture

Screen Finish
Total Reflections
Indirect Reflections
Calculated Direct Reflections
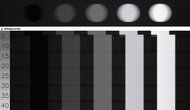
HDR Native Gradient
HDR Gradient Picture

100% Black to 50% Gray
50% Gray to 100% White
100% Black to 50% Red
50% Red to 100% Red
100% Black to 50% Green
50% Green to 100% Green
100% Black to 50% Blue
50% Blue to 100% Blue
Low-Quality Content Smoothing
Low-Quality Content Smoothing Picture

Smoothing
Detail Preservation
Upscaling: Sharpness Processing
Sharpness Picture - 480p

Pixels
Pixels Picture
Subpixel Layout
Type
Sub-Type
Contrast
Contrast Picture
Contrast
Native Contrast
Lighting Zone Precision
Lighting Zone Precision Picture
Lighting Zone Transitions
Preferred LD Video, Moving Object
Local Dimming
Backlight
Dimming Zone Count Of The Tested TV
Contrast And Dark Details In Game Mode
Lighting Zone Precision Photo In Game Mode
Preferred LD Video, Moving Object In Game Mode
Game Transitions With VRR And Preferred LD
Black Uniformity
Black Uniformity Picture With Preferred Local Dimming
Std. Dev.
Native Black Uniformity Picture
Native Std. Dev.
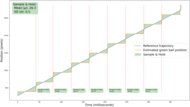
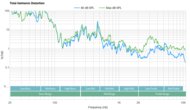
Response Time
Motion Blur Picture


Response Time Chart

80% Response Time
100% Response Time
Flicker-Free
Backlight chart

Flicker-Free
PWM Dimming Frequency
Black Frame Insertion (BFI)
BFI Picture


BFI Frequency Picture

Optional BFI
Min Flicker For 60 fps
60Hz For 60 fps
120Hz For 120 fps
Min Flicker for 60 fps in Game Mode
Motion Interpolation
Motion Interpolation (30 fps) Picture

Motion Interpolation (30 fps)
Motion Interpolation (60 fps) Picture

Motion Interpolation (60 fps)
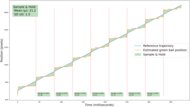
Stutter
Frame Hold Time @ 24 fps
Frame Hold Time @ 60 fps
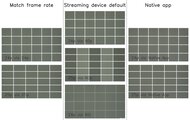
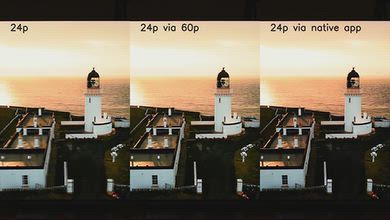
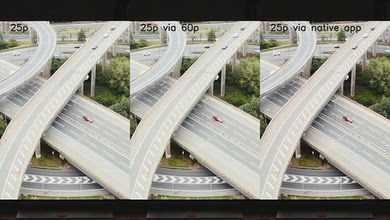
24p Judder
Judder-Free 24p
Judder-Free 24p via 60p
Judder-Free 24p via 60i
Judder-Free 24p via Native Apps
Variable Refresh Rate
Native Refresh Rate
Variable Refresh Rate
HDMI Forum VRR
FreeSync
G-SYNC Compatible
4k VRR Maximum
4k VRR Minimum
1080p VRR Maximum
1080p VRR Minimum
1440p VRR Maximum
1440p VRR Minimum
VRR + Local Dimming
SDR Color Volume
DCI-P3 Gamut Rings

CIELAB DCI-P3 Coverage
BT.2020 Gamut Rings

CIELAB BT.2020 Coverage
HDR Color Volume
P3 Color Volume ITP Picture
1,000 cd/m² DCI P3 Coverage ITP
2020 Color Volume ITP Picture
10,000 cd/m² BT.2020 Coverage ITP
White Luminance
Red Luminance
Green Luminance
Blue Luminance
Cyan Luminance
Magenta Luminance
Yellow Luminance
SDR Pre-Calibration Color Accuracy
Pre White Balance Picture
Pre Gamma Curve Picture
Pre Color Picture
White Balance dE 2000
Color dE 2000
Gamma
Color Temperature
Picture Mode
Color Temp Setting
Gamma Setting
SDR Post-Calibration Color Accuracy
Post White Balance Picture
Post Gamma Curve Picture
Post Color Picture
White Balance dE 2000
Color dE 2000
Gamma
Color Temperature
White Balance Calibration
Color Calibration
HDR Pre-Calibration Color Accuracy
HDR Pre White Balance Picture

HDR Pre Color Picture

White Balance dE ITP
Color dE ITP
Color Temperature
Picture Mode
HDR Post-Calibration Color Accuracy
HDR Post White Balance Picture

HDR Post Color Picture

White Balance dE ITP
Color dE ITP
Color Temperature
PQ EOTF Tracking
PQ EOTF Graph
600 Nit Tracking Delta
1000 Nit Tracking Delta
4000 Nit Tracking Delta
Low-Quality Content Smoothing
Low-Quality Content Smoothing Picture
Smoothing
Detail Preservation
Upscaling: Sharpness Processing
Sharpness Picture - 480p
HDR Native Gradient
HDR Gradient Picture
100% Black To 50% Gray
50% Gray To 100% White
100% Black To 50% Red
50% Red To 100% Red
100% Black To 50% Green
50% Green To 100% Green
100% Black To 50% Blue
50% Blue To 100% Blue
Input Lag
1080p @ 60Hz
1080p @ 60Hz Outside Game Mode
1080p @ 120Hz
1080p @ Max Refresh Rate
4k @ 60Hz
4k @ 60Hz @ 4:4:4
4k @ 60Hz Outside Game Mode
4k @ 60Hz With Interpolation
4k @ 120Hz
4k @ Max Refresh Rate
8k @ 60Hz
Supported Resolutions
Resolution
480p @ 59.94Hz (Widescreen)
720p @ 59.94Hz
1080p @ 60Hz @ 4:4:4
1080p @ 120Hz
1080p Maximum Refresh Rate
4k @ 60Hz
4k @ 60Hz @ 4:4:4
4k @ 120Hz
4k @ 120Hz @ 4:4:4
4k Maximum Refresh Rate
8k @ 30Hz Or 24Hz
8k @ 60Hz
Variable Refresh Rate
Native Refresh Rate
Variable Refresh Rate
HDMI Forum VRR
FreeSync
G-SYNC Compatible
4k VRR Maximum
4k VRR Minimum
1080p VRR Maximum
1080p VRR Minimum
VRR + Local Dimming
CAD In Game Mode @ Max Refresh Rate
Pursuit Photo Max Refresh

CAD Heatmap Max Refresh

Transition At Max Refresh
Avg. CAD
Best 10% CAD
Worst 10% CAD
CAD In Game Mode @ 120Hz
Pursuit Photo 120Hz

CAD Heatmap 120Hz

Transition At 120Hz
Avg. CAD
Best 10% CAD
Worst 10% CAD
CAD In Game Mode @ 60Hz
Pursuit Photo 60Hz

CAD Heatmap 60Hz

Transition 60Hz
Avg. CAD
Best 10% CAD
Worst 10% CAD
PS5 Compatibility
PS5 Screenshot

Auto Low Latency Mode (ALLM)
4k @ 120Hz
1440p @ 120Hz
1080p @ 120Hz
HDR
VRR
Xbox Series X|S Compatibility
Xbox Series X Screenshot

Auto Low Latency Mode (ALLM)
4k @ 120Hz
1440p @ 120Hz
1080p @ 120Hz
HDR
VRR
Stutter
Stutter Video

Stutter Image

Stutter Graph
Sample And Hold
Frame Hold Time @ 24 fps
Stutter Reduction Via Interpolation
Stutter Reduction Via Interpolation Video
Stutter Reduction Via Interpolation Image

Stutter Reduction Via Interpolation Graph
Sample And Hold (Interpolation)
Interpolation Consistency
Judder
Judder Video Picture
Judder 24p
Judder 25p
Judder 24p via 60p
Judder 25p via 60p
Judder 24p via 60i
Judder 24p via Native Apps
Judder 25p via Native Apps
Micro Judder
24p Clip
25p Clip
Micro Judder-Free 24p
Micro Judder-Free 25p
Micro Judder-Free 24p via 60p
Micro Judder-Free 25p via 60p
Micro Judder-Free 24p via Native Apps
Micro Judder-Free 25p via Native Apps
Response Time
Pursuit Photo 60Hz
Response Time Heatmap 60Hz

Transition At 60Hz
First Response Time
Total Response Time
Worst 10% Response Time
Transition Artifacts
Color Transition Image
Edge Transition Image
Color Artifacts
Edge Artifacts
Flicker
Backlight chart
Flicker-Free
PWM Dimming Frequency
Black Frame Insertion (BFI)
BFI Picture
BFI Frequency Picture
Optional BFI
Min Flicker For 60 fps
60Hz For 60 fps
120Hz For 120 fps
Min Flicker For 60 fps In Game Mode
Direct Reflections
Ring Light Picture

Direct Reflections Graph

Peak Direct Reflection Intensity
Screen Finish
Ambient Black Level Raise
Black Level Raise Picture

Bright Room Black Level Raise Graph

Black Luminance @ 0 lx
Black Luminance @ 1000 lx
Total Reflected Light
Bright Room Off Picture
Ring Picture Total Reflection

Total Reflected Light Intensity
Diffraction Artifacts
Ambient Color Saturation
Bright Room Color Volume Graph

Low-Luminance Colors @ 1000 lx
Mid-Luminance Colors @ 1000 lx
High-Luminance Colors @ 1000 lx
Viewing Angle
Viewing Angle Video
Chroma Graph
Color Washout
Hue Graph
Color Shift
Lightness Graph
Brightness Loss
Black Level Raise
Gamma Shift
Gray Uniformity
50% Uniformity Picture
50% Std. Dev.
50% DSE
5% Uniformity Picture
5% Std. Dev.
5% DSE
Panel Technology
Spectral Power Distribution

Pixels Picture
Panel Type
Sub-Type
Subpixel Layout
Input Lag
1080p @ 60Hz
1080p @ 60Hz Outside Game Mode
1080p @ 120Hz
1080p @ 144Hz
1440p @ 60Hz
1440p @ 120Hz
1440p @ 144Hz
4k @ 60Hz
4k @ 60Hz + 10-Bit HDR
4k @ 60Hz @ 4:4:4
4k @ 60Hz Outside Game Mode
4k @ 60Hz With Interpolation
4k @ 120Hz
4k @ 144Hz
8k @ 60Hz
Supported Resolutions
Resolution
480p @ 59.94Hz (Widescreen)
720p @ 59.94Hz
1080p @ 60Hz @ 4:4:4
1080p @ 120Hz
1080p @ 144Hz
1440p @ 60Hz
1440p @ 120Hz
1440p @ 144Hz
4k @ 60Hz
4k @ 60Hz @ 4:4:4
4k @ 120Hz
4k @ 120Hz @ 4:4:4
4k @ 144Hz
8k @ 30Hz or 24Hz
8k @ 60Hz
PS5 Compatibility
PS5 Screenshot
Auto Low Latency Mode (ALLM)
4k @ 120Hz
1440p @ 120Hz
1080p @ 120Hz
HDR
VRR
Xbox Series X|S Compatibility
Xbox Series X Screenshot
Auto Low Latency Mode (ALLM)
4k @ 120Hz
1440p @ 120Hz
1080p @ 120Hz
HDR
VRR
Input Specifications
Side Inputs Picture

Rear Inputs Picture

HDR10
HDMI
HDR10+
Dolby Vision
HDMI 2.1 Rated Speed
HLG
ATSC Tuner
USB Ports
HDMI 2.0 Full Bandwidth
USB 3.0
Audio Out 3.5mm
Wi-Fi
Ethernet Speed
CEC
Composite In
HDCP 2.2
Digital Optical Audio Out
Variable Analog Audio Out
Input Photos
Side Inputs Picture
Rear Inputs Picture
Audio Passthrough
ARC/eARC Port
eARC: Dolby Atmos Over Dolby Digital Plus
eARC: Dolby Digital Plus 7.1
eARC: LPCM 7.1 Over Dolby MAT
eARC: Dolby TrueHD 7.1
eARC: DTS:X Over DTS-HD MA
eARC: DTS-HD Master Audio 7.1
eARC: LPCM Channels (Bitstream)
ARC: Dolby Digital 5.1
ARC: DTS 5.1
Optical: Dolby Digital 5.1
Optical: DTS 5.1
Total Inputs
HDMI
USB
Digital Optical Audio Out
Analog Audio Out 3.5mm
Analog Audio Out RCA
Component In
Composite In
Tuner (Cable/Ant)
Ethernet
DisplayPort
IR In
HDR Format Support
HDR10
HDR10+
Dolby Vision
HLG
Style
Design Picture

Curved
Accelerated Longevity Test
Uniformity Pictures
Longevity Graph
Stand
Stand Picture

Back
Back Picture

Wall Mount
Borders
Borders Picture

Borders
Thickness
Thickness Picture

Max Thickness
Build Quality
Build quality picture

Interface
Smart TV Picture

Smart OS
Version
Ease of Use
Smoothness
Time Taken to Select YouTube
Time Taken to Change Backlight
Advanced Options
Ad-Free
Ads Picture

Ads
Opt-out
Suggested Content in Home
Opt-out of Suggested Content
Apps and Features
Apps Picture

App Selection
App Smoothness
Cast Capable
USB Drive Playback
USB Drive HDR Playback
HDR in Netflix
HDR in YouTube
Remote
Remote Picture

Size
Voice Control
CEC Menu Control
Other Smart Features
Remote App
TV Controls
Controls Picture

Mute Switch
In The Box
In The Box Picture

Misc
Power Consumption
Power Consumption (Max)
Firmware
Frequency Response
Frequency Response

Low-Frequency Extension
Std. Dev. @ 70
Std. Dev. @ 80
Std. Dev. @ Max
Max
Dynamic Range Compression
Digital Room Correction
Distortion
Total Harmonic Distortion
TCL Q750G
Hisense U65QF
Comments
TCL Q750G vs Hisense U65QF: Main Discussion
What do you think of these products? Let us know below.
Looking for a personalized buying advice from the RTINGS.com experts? Members have direct access to buying advice on our member forum.