Products
Tested using Methodology v0.9.1
Updated Apr 01, 2026 02:00 PM
Tested using Methodology v0.9.1
Updated Apr 10, 2026 03:55 PM

Our Verdict
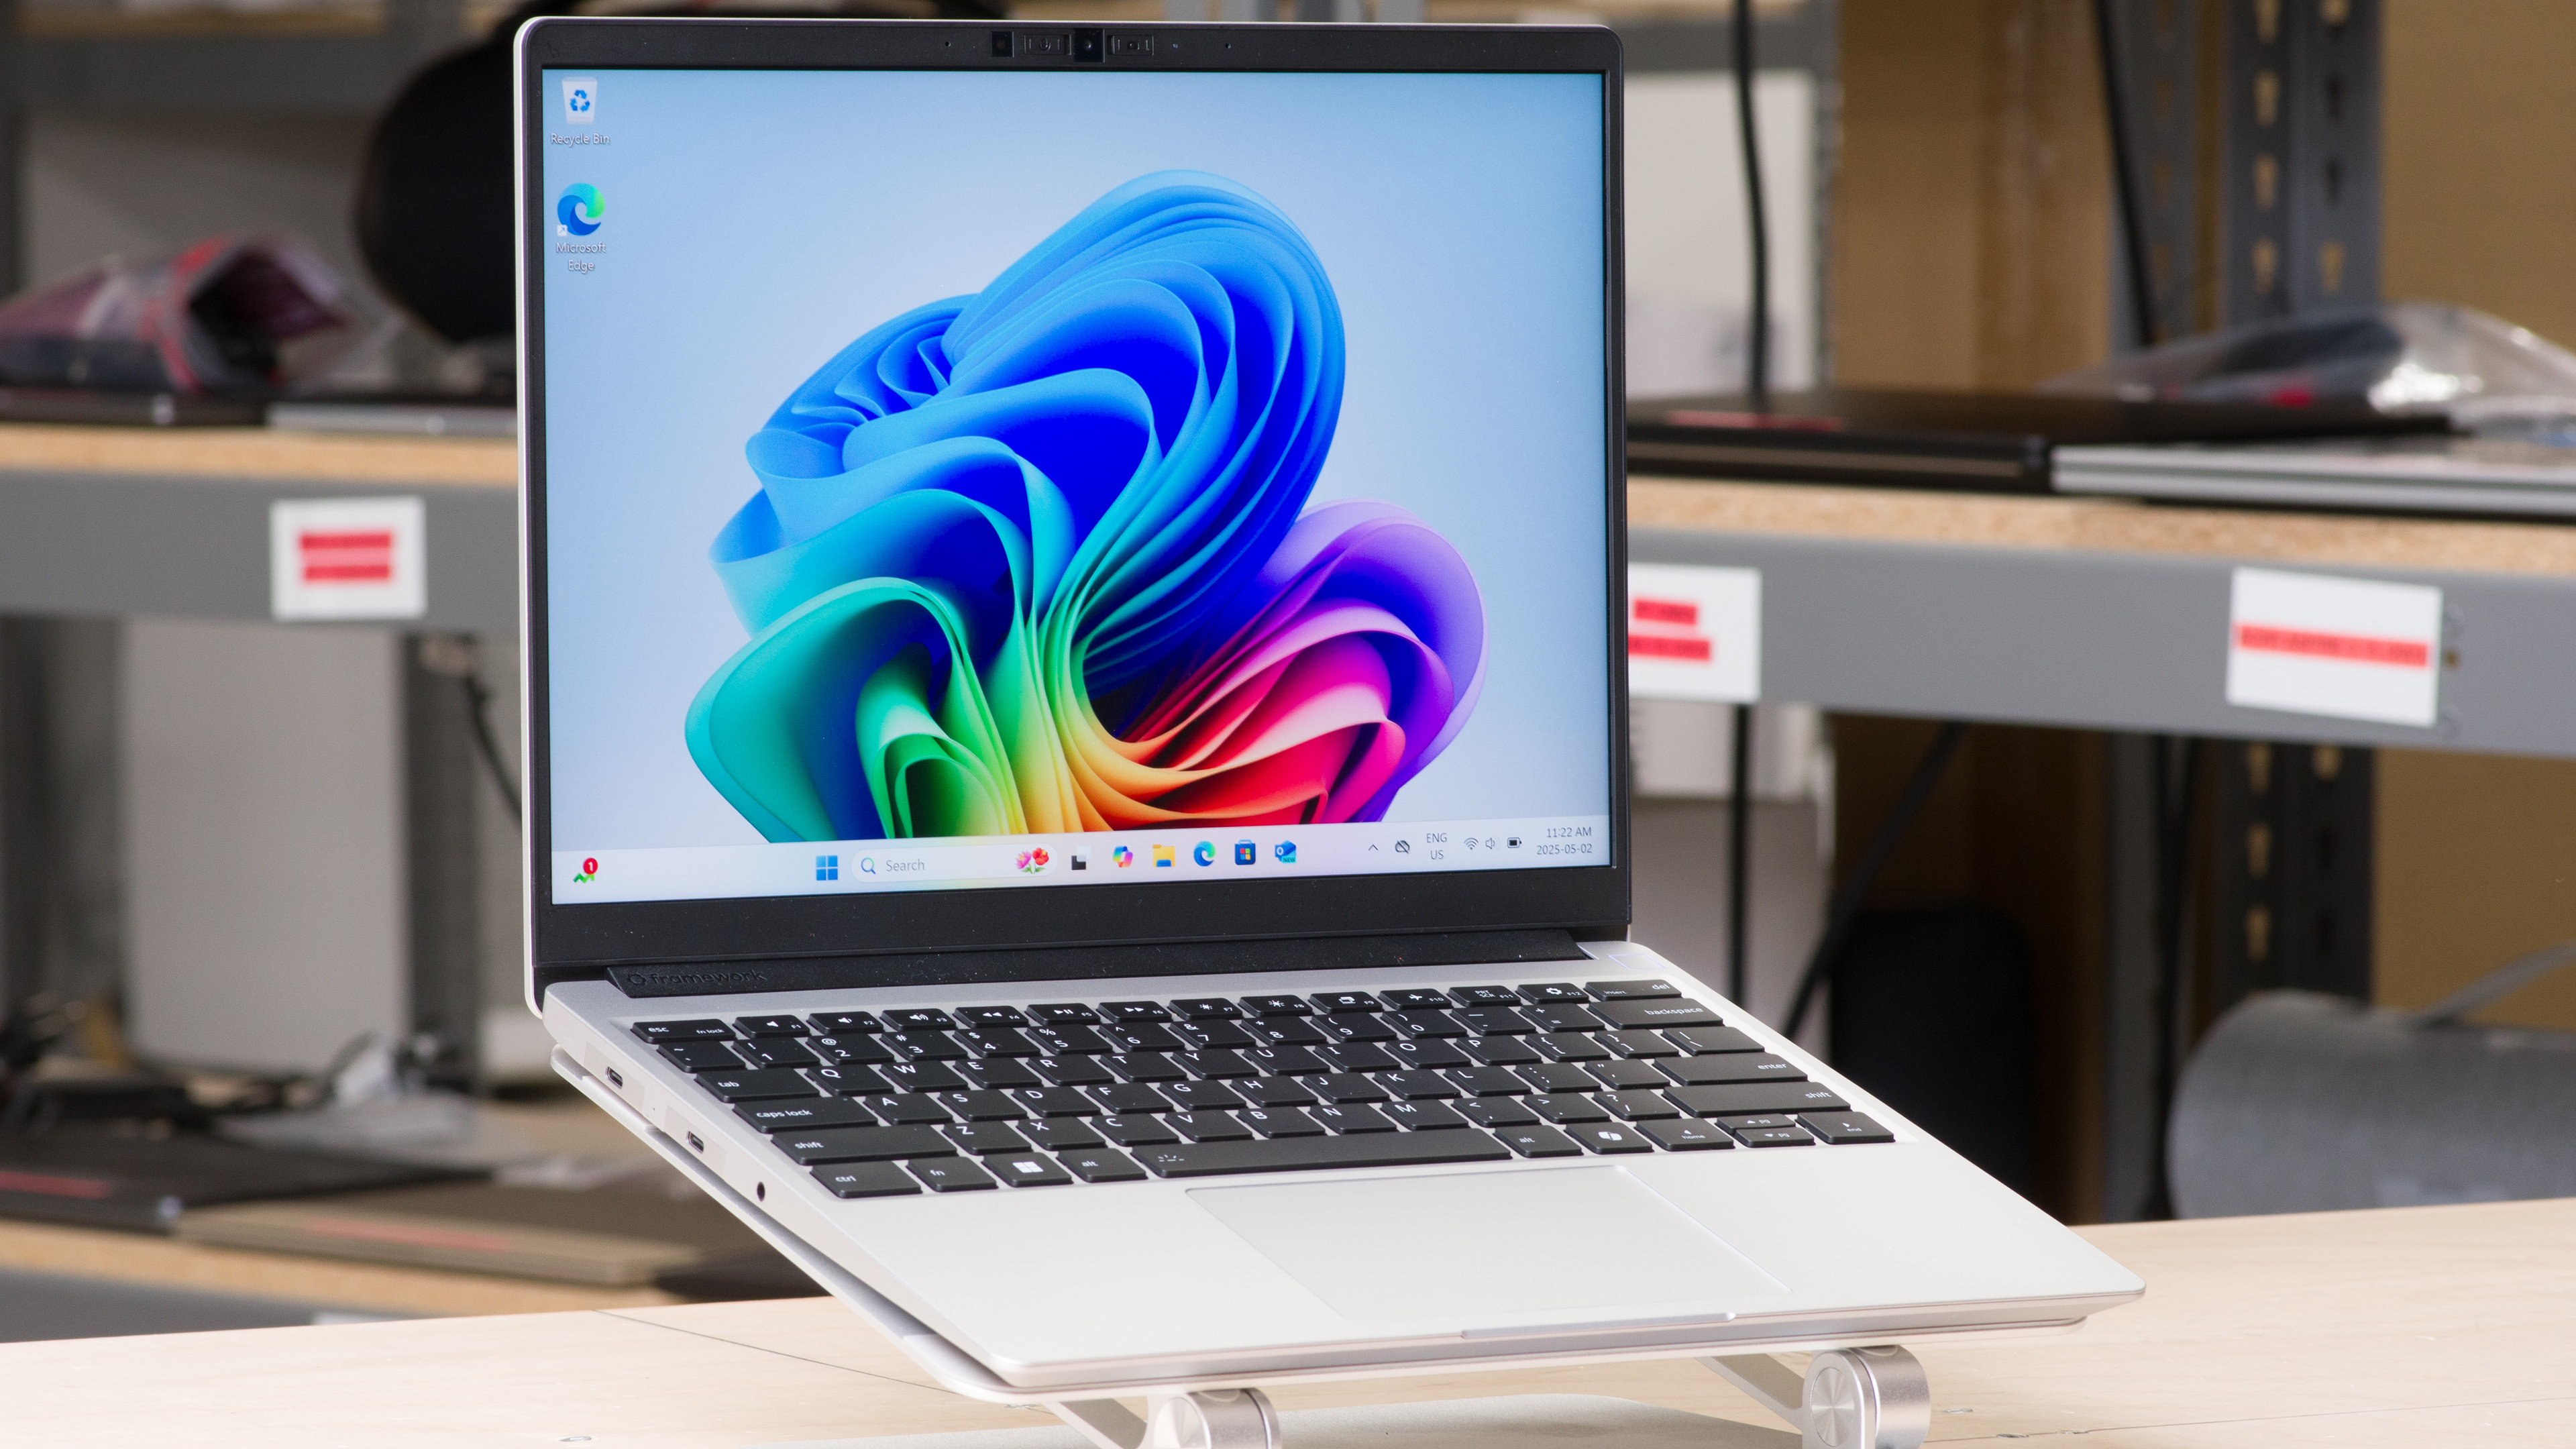
Framework Laptop 13 (2025)
Apple MacBook Air 13 (M4, 2025)
The Apple MacBook Air 13 (M4, 2025) and the Framework Laptop 13 (2025) are ultraportable laptops with completely different approaches. The Framework is a modular Windows laptop where every part is replaceable and upgradeable, while the MacBook runs macOS and has all its components soldered down. The MacBook has a fanless design, so it's silent at all times, but it thermal throttles during long sessions. While the MacBook is a better machine to use, the Framework's modularity and repairability make it more flexible, and it's a great option if you support the right-to-repair movement.
Variants
- Laptop 13 (Base) (Ryzen AI 5 340/16GB/256GB)
- Laptop 13 (Extended Productivity) (Ryzen AI 5 340/16GB/512GB)
- MacBook Air 13 (MW133LL/A) (Midnight - M4 (10-core CPU/10-core GPU)/16GB/512GB)
- MacBook Air 13 (MC6C4LL/A) (Midnight - M4 (10-core CPU/10-core GPU)/24GB/512GB)
Main Differences for
General Productivity
Threshold
General Productivity
Full Comparison
Style
Style Photo

Form Factor
Build Quality
Build Quality Photo

Hinge
Hinge Photo

Range
Stability
One Finger Lift
Portability
Dimensions Photo

Size
Thickness
Width
Depth
Volume
Weight
Charger Size
Charger Weight
Serviceability
Internals Photo

Ease Of Access
RAM Slots
Storage Slots
Replaceable Battery
Replaceable Wireless Adapter
In The Box
In The Box Photo

Screen Specs
Display Photo

Resolution
Aspect Ratio
Pixel Density
Panel Type
Touch Screen
Screen-To-Body Ratio
Refresh Rate
Motion Blur

Refresh Rate
Variable Refresh Rate
Contrast
Contrast Photo

Native Contrast
Brightness
Maximum Brightness
Minimum Brightness
Reflections
Reflections Photo Off

Reflections Photo Max

Screen Finish
Total Reflections
Indirect Reflections
Calculated Direct Reflections
Black Uniformity
Black Uniformity Photo

Uniformity (Std. Dev.)
Out-Of-The-Box Color Accuracy
White Balance Screencap

Gamma Curve Screencap

Color Screencap

Avg. White Balance dE
Avg. Gamma
Avg. Color dE
Avg. Color Temperature
Color Gamut
Gamut SDR

sRGB xy
sRGB uv
Adobe RGB xy
Adobe RGB uv
Gamut HDR

DCI-P3 xy
DCI-P3 uv
Rec. 2020 xy
Rec. 2020 uv
Flicker
Flicker Graph

Flicker-Free
Flicker Frequency
Flicker Active Below
Keyboard
Keyboard Photo

Typing Quality
Numpad
Backlighting
Key Switch Actuation Graph

Operating Force
Actuation Force
Pre-Travel
Total Travel
Touchpad
Touchpad Photo

Tracking Quality
Size
Material
Dedicated Buttons
Speakers
Frequency Response Plot

Max Volume
Standard Error @ Normal Vol. (65 dB)
Slope @ Normal Vol. (65 dB)
Bass Extension (Low-Frequency Ext.)
Treble Extension (High-Frequency Ext.)
Dynamic Range Compression @ Max Vol.
Webcam & Microphone
Webcam Video Sample

Video Quality
Resolution
Position
Privacy Cover
Face Unlock
Ports
Ports Photo

USB-A Ports
USB-C Ports
Thunderbolt
USB-C Charging
USB-C Display Out
HDMI
DisplayPort
3.5mm Jack
Card Reader
Ethernet
Proprietary Port
Security Lock
Wireless Communication
Wi-Fi
Bluetooth
CPU
Brand
Model
Core Count
Thread Count
GPU
Brand
Model
Dedicated/Integrated
VRAM Size
GPU Total Graphics Power (TGP)
RAM
Capacity
Modules
Type
Speed
Storage
Advertised Capacity
Usable Capacity
Drive 1
Drive 1 Type
Drive 2
Drive 2 Type
CPU/RAM Performance
Cinebench 2024 - Single Core
Cinebench 2024 - Multi Core
Geekbench 6 - Single Core
Geekbench 6 - Multi Core
Blender - CPU (Avg)
PassMark PT - CPU Mark
PassMark PT - Memory Mark
PassMark PT - Memory Mark (Android)
Mozilla Kraken
Low Tier Graphics
Geekbench 6 - GPU Compute
Basemark Web 3.0
PassMark PT - 2D Mark
PassMark PT - 2D Mark (Android)
PassMark PT - 3D Mark
PassMark PT - 3D Mark (Android)
Novabench 5 - GPU
mprep - Stress My GPU
High Tier Graphics
3DMark - Steel Nomad (DX12)
3DMark - Steel Nomad (Vulkan/Metal)
Basemark GPU (DX12)
Basemark GPU (Vulkan/Metal)
GFXBench - High Level Test (Vulkan/Metal)
Professional 3D (GPU Accelerated)
Blender - GPU (Avg)
Cinebench 2024 - GPU
CPU-Intensive Game Performance
Civilization VII - AI
Civilization VII - Graphics (Avg)
Civilization VII - Graphics (1% Low)
Total War: Warhammer III (Avg)
Baldur's Gate 3 (Avg)
Baldur's Gate 3 (1% Low)
Previous Methodology Score
Previous Methodology Score Converted
GPU-Intensive Game Performance
Cyberpunk 2077 (Avg)
Cyberpunk 2077 (Min)
Assassin's Creed Shadows (Avg)
Assassin's Creed Shadows (1% Low)
GTA V (Avg)
GTA V (1% Low)
Black Myth: Wukong (Avg)
Black Myth: Wukong (5% Low)
Resident Evil 4 (Avg)
Resident Evil 4 (1% Low)
Previous Methodology Score
Previous Methodology Score Converted
Ray Tracing Performance
Cyberpunk 2077 (Avg)
Cyberpunk 2077 (Min)
Assassin's Creed Shadows (Avg)
Assassin's Creed Shadows (1% Low)
Black Myth: Wukong (Avg)
Black Myth: Wukong (5% Low)
Storage Drive Performance
Sequential Write Speed
Sequential Read Speed
Random Write Speed
Random Read Speed
Battery
Capacity
Battery Life (Web Browsing)
Battery Life (Video Playback)
Battery Life (Gaming)
Charge Time
Thermals And Noise
Keyboard Temps Picture

Keyboard Temp While Idle
Keyboard Temp Under Load
Fan Noise While Idle
Fan Noise Under Load
Power & Fan Control App
Performance Over Time
Performance Over Time Graph

Framework Laptop 13 (2025)
Apple MacBook Air 13 (M4, 2025)
Comments
Framework Laptop 13 (2025) vs Apple MacBook Air 13 (M4, 2025): Main Discussion
What do you think of these products? Let us know below.
Looking for a personalized buying advice from the RTINGS.com experts? Members have direct access to buying advice on our member forum.