Products
Tested using Methodology v1.1
Updated Aug 28, 2025 05:05 PM
SEE PRICE
Amazon
Tested using Methodology v2.1.2
Updated Mar 30, 2026 08:07 PM
SEE PRICE
Amazon


Size
32"
Panel Type
VA
Native Resolution
3840 x 2160
Max Refresh Rate
60 Hz
Variable Refresh Rate
FreeSync
Size
27"
Panel Type
LCD
Native Resolution
3840 x 2160
Max Refresh Rate
60 Hz
Sub-Type
IPS
Variable Refresh Rate
Our Verdict
BenQ EW3270U
Dell S2722QC
The Dell S2722QC is a better overall 4k monitor than the BenQ EW3270U. The S2722QC has much better ergonomics, and its IPS panel has wider viewing angles, making it a better choice for sharing your screen with someone else. It's also better for well-lit environments because it gets brighter. The S2722QC has a different selection of inputs including a USB-C input and two USB 3.0 ports, but the EW3270U has a DisplayPort input. As for the EW3270U, it's better for dark room use because its VA panel has a higher contrast ratio.
Variants
- EW3270U (32")
- S2722QC (27")
Check Price
32"
EW3270U
SEE PRICE
Amazon
27"
S2722QC
SEE PRICE
Amazon
32"
EW3270U
SEE PRICE
BestBuy.com
27"
S2722QC
SEE PRICE
Walmart.com
32"
EW3270U
SEE PRICE
Walmart.com
27"
S2722QC
SEARCH
B&H
32"
EW3270U
SEARCH
B&H
27"
S2722QC
SEARCH
BestBuy.com
32"
EW3270U
SEARCH
BenQ
27"
S2722QC
SEARCH
Dell
Main Differences for
Mixed Usage
Mixed Usage
Threshold
Mixed Usage
Full Comparison
Design
Style
Design Picture

Curved
Curve Radius
Size
Weight (without stand)
Weight (with stand)
Build Quality
Build Quality Picture

Ergonomics
Ergonomics Picture

Back Picture

Height Adjustment
Min Height To Top Of Panel
Tilt Range
Rotate Portrait/Landscape
Swivel Range
Wall Mount
Stand
Stand Picture

Thickness Picture

Base Width
Base Depth
Thickness (With Display)
Weight (With Display)
Display
Display Picture

Size
Housing Width
Housing Height
Thickness (Without Stand)
Weight (Without Stand)
Borders Size (Bezels)
Controls
Controls Picture

In The Box
In The Box Picture

Power Supply
Back
Back Picture
Wall Mount
Borders
Borders Picture

Borders
Thickness
Thickness Picture
Thickness (with stand)
Thickness (without stand)
Picture Quality
Contrast
Checkerboard Picture

Native Contrast
Contrast With Local Dimming
Local Dimming
Local Dimming Video

Local Dimming
Backlight
SDR Brightness
Real Scene
Peak 2% Window
Peak 10% Window
Peak 25% Window
Peak 50% Window
Peak 100% Window
Sustained 2% Window
Sustained 10% Window
Sustained 25% Window
Sustained 50% Window
Sustained 100% Window
Automatic Brightness Limiting (ABL)
Minimum Brightness
HDR Brightness
EOTF

VESA DisplayHDR Certification
Real Scene
Peak 2% Window
Peak 10% Window
Peak 25% Window
Peak 50% Window
Peak 100% Window
Sustained 2% Window
Sustained 10% Window
Sustained 25% Window
Sustained 50% Window
Sustained 100% Window
Automatic Brightness Limiting (ABL)
Gray Uniformity
50% Uniformity Picture

50% Std. Dev.
50% DSE
5% Uniformity Picture

5% Std. Dev.
5% DSE
Black Uniformity
Native Black Uniformity Picture

Native Std. Dev.
Black Uniformity Picture With Local Dimming

Std. Dev. w/ L.D.
Color Accuracy (Pre-Calibration)
Pre Calibration Picture

Pre Gamma Curve Picture

Pre Color Picture

Picture Mode
sRGB Gamut Area xy
White Balance dE (Avg.)
Color Temperature (Avg.)
Gamma (Avg.)
Color dE (Avg.)
Contrast Setting
RGB Settings
Gamma Setting
Brightness Setting
Measured Brightness
Brightness Locked
Color Accuracy (Post-Calibration)
Post Calibration Picture

Post Gamma Curve Picture

Post Color Picture

Picture Mode
sRGB Gamut Area xy
White Balance dE (Avg.)
Color Temperature (Avg.)
Gamma (Avg.)
Color dE (Avg.)
Contrast Setting
RGB Settings
Gamma Setting
Brightness Setting
Measured Brightness
ICC Profile
SDR Color Gamut
sRGB Color Gamut Picture
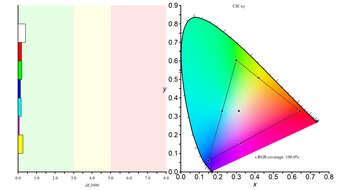

sRGB Coverage xy
sRGB Picture Mode
Adobe RGB Color Gamut Picture
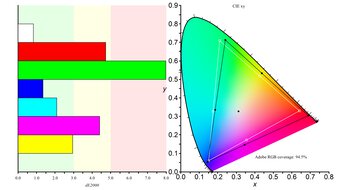

Adobe RGB Coverage xy
Adobe RGB Picture Mode
HDR Color Gamut
Wide Color Gamut
DCI-P3 Color Gamut Picture
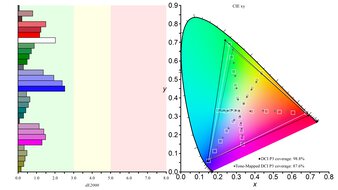

DCI-P3 Coverage xy
DCI-P3 Picture Mode
Rec. 2020 Color Gamut Picture
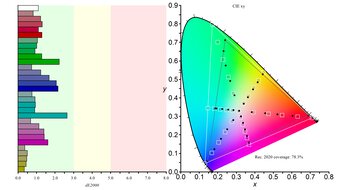

Rec. 2020 Coverage xy
Rec. 2020 Picture Mode
DCI P3 xy
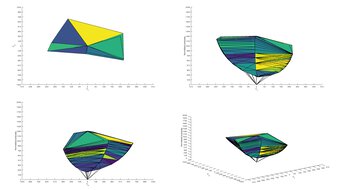
HDR Color Volume
DCI-P3 Color Volume ITP Picture

1,000 cd/m² DCI-P3 Coverage ICtCp
DCI-P3 Picture Mode
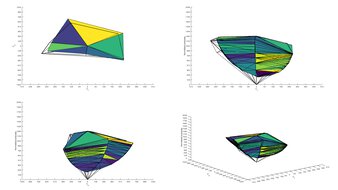
Rec. 2020 Color Volume ITP Picture

10,000 cd/m² Rec. 2020 Coverage ICtCp
Rec. 2020 Picture Mode
Viewing Angle
Viewing Angle Video

Chroma Graph

Color Washout From Left
Color Washout From Right
Hue Graph

Color Shift From Left
Color Shift From Right
Lightness Graph

Brightness Loss From Left
Brightness Loss From Right
Black Level Raise From Left
Black Level Raise From Right
Gamma Shift From Left
Gamma Shift From Right
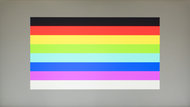
Text Clarity
ClearType On

ClearType Off

Pixel Type
Pixels
Sub-Pixel Layout
Panel Technology
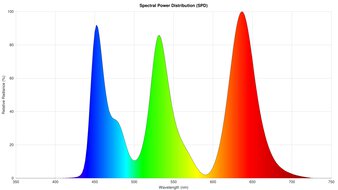
Spectral Power Distribution
Pixels
Panel Type
Sub-Type
Subpixel Layout
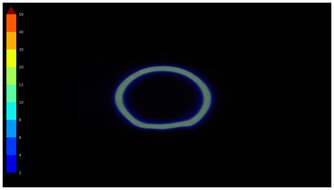
Direct Reflections
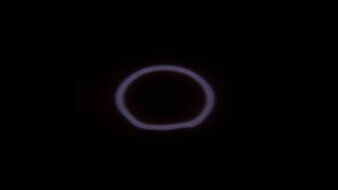
Ring Light Picture
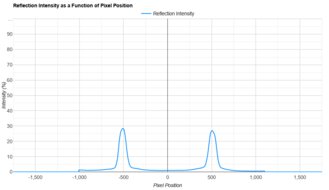
Direct Reflections Graph
Peak Direct Reflection Intensity
Screen Finish
Ambient Black Level Raise
Black Level Raise Picture

Ambient Black Level Raise Graph
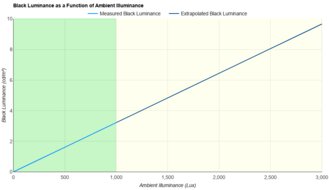
Black Luminance @ 0 lx
Black Luminance @ 1000 lx
Total Reflected Light
Bright Room Off Picture

Total Reflection Ring Light Picture
Total Reflected Light Intensity
Diffraction Artifacts
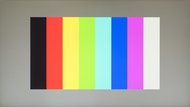
Gradient
Gradient Picture

Color Depth
Vertical Viewing Angle
Vertical Viewing Angle Video

Vertical Chroma Graph

Color Washout From Below
Color Washout From Above
Vertical Hue Graph

Color Shift From Below
Color Shift From Above
Vertical Lightness Graph

Brightness Loss From Below
Brightness Loss From Above
Black Level Raise From Below
Black Level Raise From Above
Gamma Shift From Below
Gamma Shift From Above
SDR Color Volume
sRGB Color Volume ITP Picture
sRGB In ICtCp
Adobe RGB Color Volume ITP Picture
Adobe RGB In ICtCp
sRGB Picture Mode
Adobe RGB Picture Mode
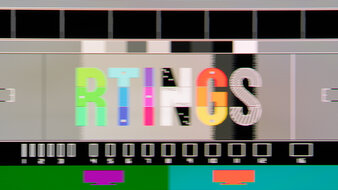
Image Retention
Image Retention Picture

IR After 0 Min Recovery
IR After 2 Min Recovery
IR After 4 Min Recovery
IR After 6 Min Recovery
IR After 8 Min Recovery
IR After 10 Min Recovery
Color Bleed
Color Bleed Horizontal
Pixel Row Error
Color Bleed Vertical
Pixel Column Error
Reflections
Average Room

Average Room Off Picture

Bright Room Off Picture
Screen Finish
Total Reflections
Indirect Reflections
Calculated Direct Reflections
Motion
Refresh Rate
Dual Mode Setting
Native Refresh Rate
Max Refresh Rate
Max Refresh Rate Over DP
Max Refresh Rate Over HDMI
Max Refresh Rate Over DP @ 10-bit
Max Refresh Rate Over HDMI @ 10-Bit
DSC Toggle
DSC Off Max Refresh Rate Over DP
DSC Off Max Refresh Rate Over HDMI
Variable Refresh Rate (VRR)
Variable Refresh Rate
FreeSync
G-SYNC
VRR Maximum
VRR Minimum
VRR Supported Connectors
Native
Max Refresh Rate
Variable Refresh Rate
VRR Motion Performance
Pursuit Photo VRR

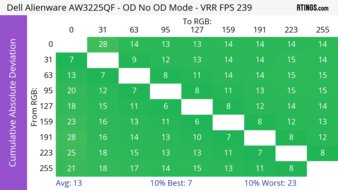
OD Mode CAD Comparison

Recommended VRR OD Setting
Variable Overdrive Advertised
Avg. CAD
Best CAD
Worst CAD
Refresh Rate Compliance
Fast GTG Sequence

VRR Compliance

Compliance @ Max Hz
Compliance @ 120 FPS
Compliance @ 60 FPS
CAD @ Max Refresh Rate
Pursuit Photo At Max Refresh

CAD Heatmap At Max Refresh

OD Transition Max Refresh Rate
Recommended Overdrive Setting
Avg. CAD
Best 10% CAD
Worst 10% CAD
Response Time @ Max Refresh Rate
First Response Time
Total Response Time
Recommended Overdrive Setting
RGB Overshoot
Worst 10% RGB Overshoot
Worst 10% First Response Time
Worst 10% Total Response Time
Heatmap First Response

Heatmap Total Response

Heatmap RGB Overshoot

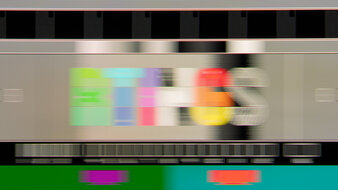
Motion Blur Picture
Response Time Table
CAD @ 120Hz
Pursuit Photo 120Hz
CAD Heatmap 120Hz
OD Transition 120Hz
Recommended Overdrive Setting
Avg. CAD
Best 10% CAD
Worst 10% CAD
Response Time @ 120Hz
Worst 10% First Response Time
RGB Overshoot
Total Response Time
First Response Time
Recommended Overdrive Setting
Worst 10% Total Response Time
Worst 10% RGB Overshoot
120Hz First Response Heatmap
120Hz Total Response Heatmap
120Hz Heatmap RGB Overshoot
CAD @ 60Hz
Pursuit Photo 60Hz

CAD Heatmap 60Hz

OD Transition 60Hz
Recommended Overdrive Setting
Avg. CAD
Best 10% CAD
Worst 10% CAD
Response Time @ 60Hz
Recommended Overdrive Setting
First Response Time
Total Response Time
RGB Overshoot
Worst 10% Total Response Time
Worst 10% First Response Time
Worst 10% RGB Overshoot
60Hz First Response Heatmap

60Hz Total Response Heatmap

60Hz RGB Overshoot Heatmap

Backlight Strobing (BFI)
Backlight Strobing Picture
Backlight Strobing Frequency Picture
Backlight Strobing (BFI)
Maximum Frequency
Minimum Frequency
Longest Pulse Width Brightness
Shortest Pulse Width Brightness
Pulse Width Control
Pulse Phase Control
Pulse Amplitude Control
VRR At The Same Time
VRR Flicker
VRR Flicker Video

VRR Flicker Graph

Dark Gray Flicker
Middle Gray Flicker
Light Gray Flicker
VRR Flicker Control Setting
Image Flicker
Backlight Picture

Flicker-Free
PWM Dimming Frequency
Response Time @ 60Hz
Motion Blur Picture

Response Time Table
Best Overdrive Setting
Rise / Fall Time
Total Response Time
Overshoot Error
Dark Rise / Fall Time
Dark Total Response Time
Dark Overshoot Error
Inputs
Input Lag
Native Resolution @ Max Hz
Native Resolution @ 120Hz
Native Resolution @ 60Hz
Variable Refresh Rate
Variable Refresh Rate @ 60Hz
10 Bit HDR
Backlight Strobing (BFI)
Resolution
Native Resolution
Aspect Ratio
Megapixels
Pixel Density
Screen Diagonal
Screen Area
PS5 Compatibility
PS5 Compatibility Photo

PS5 Compatibility Table

4k @ 120Hz
4k @ 60Hz
1440p @ 120Hz
1440p @ 60Hz
1080p @ 120Hz
1080p @ 60Hz
Xbox Series X|S Compatibility
XSX Compatibility Photo

XSX Compatibility Table

4k @ 120Hz
4k @ 60Hz
1440p @ 120Hz
1440p @ 60Hz
1080p @ 120Hz
1080p @ 60Hz
Inputs
Inputs 1

Inputs 2

Inputs
Inputs 1
Inputs 2
DisplayPort
DisplayPort Transmission Bandwidth
Mini DisplayPort
HDMI
HDMI 2.1 Bandwidth
Daisy Chaining
3.5mm Audio Out
Ethernet
HDR10
Dolby Vision
DVI
VGA
DisplayPort Out
USB
USB C
Microphone In 3.5mm
Digital Optical Audio Out
Analog Audio Out RCA
Power Supply
USB
USB-A Ports
USB-A Rated Speed
USB-B Upstream Port
USB-C Ports
USB-C Upstream
USB-C Rated Speed
USB-C Power Delivery
USB-C DisplayPort Alt Mode
Thunderbolt
macOS Compatibility
macOS Screenshot

Features
Additional Features
Speakers
RGB Illumination
Multiple Input Display
KVM Switch
Smart OS
HDR10
On-Screen Display (OSD)
OSD Picture

Controls
Controls Picture
In The Box
In The Box Picture
Check Price
32"
EW3270U
SEE PRICE
Amazon
27"
S2722QC
SEE PRICE
Amazon
32"
EW3270U
SEE PRICE
BestBuy.com
27"
S2722QC
SEE PRICE
Walmart.com
32"
EW3270U
SEE PRICE
Walmart.com
27"
S2722QC
SEARCH
B&H
32"
EW3270U
SEARCH
B&H
27"
S2722QC
SEARCH
BestBuy.com
32"
EW3270U
SEARCH
BenQ
27"
S2722QC
SEARCH
Dell
BenQ EW3270U
Dell S2722QC
Comments
BenQ EW3270U vs Dell S2722QC: Main Discussion
What do you think of these products? Let us know below.
Looking for a personalized buying advice from the RTINGS.com experts? Members have direct access to buying advice on our member forum.