Products
Tested using Methodology v0.12
Updated Jun 16, 2026 05:35 PM
SEE PRICE
Amazon
Tested using Methodology v0.12
Updated Jun 18, 2026 06:39 PM
SEE PRICE
ANTA
Weight
212.9 g (7.51 oz)
Heel-To-Toe Drop
7.5 mm
Plate
Carbon Fiber
Weight
202.2 g (7.13 oz)
Heel-To-Toe Drop
8.4 mm
Plate
Plastic Shank
Our Verdict
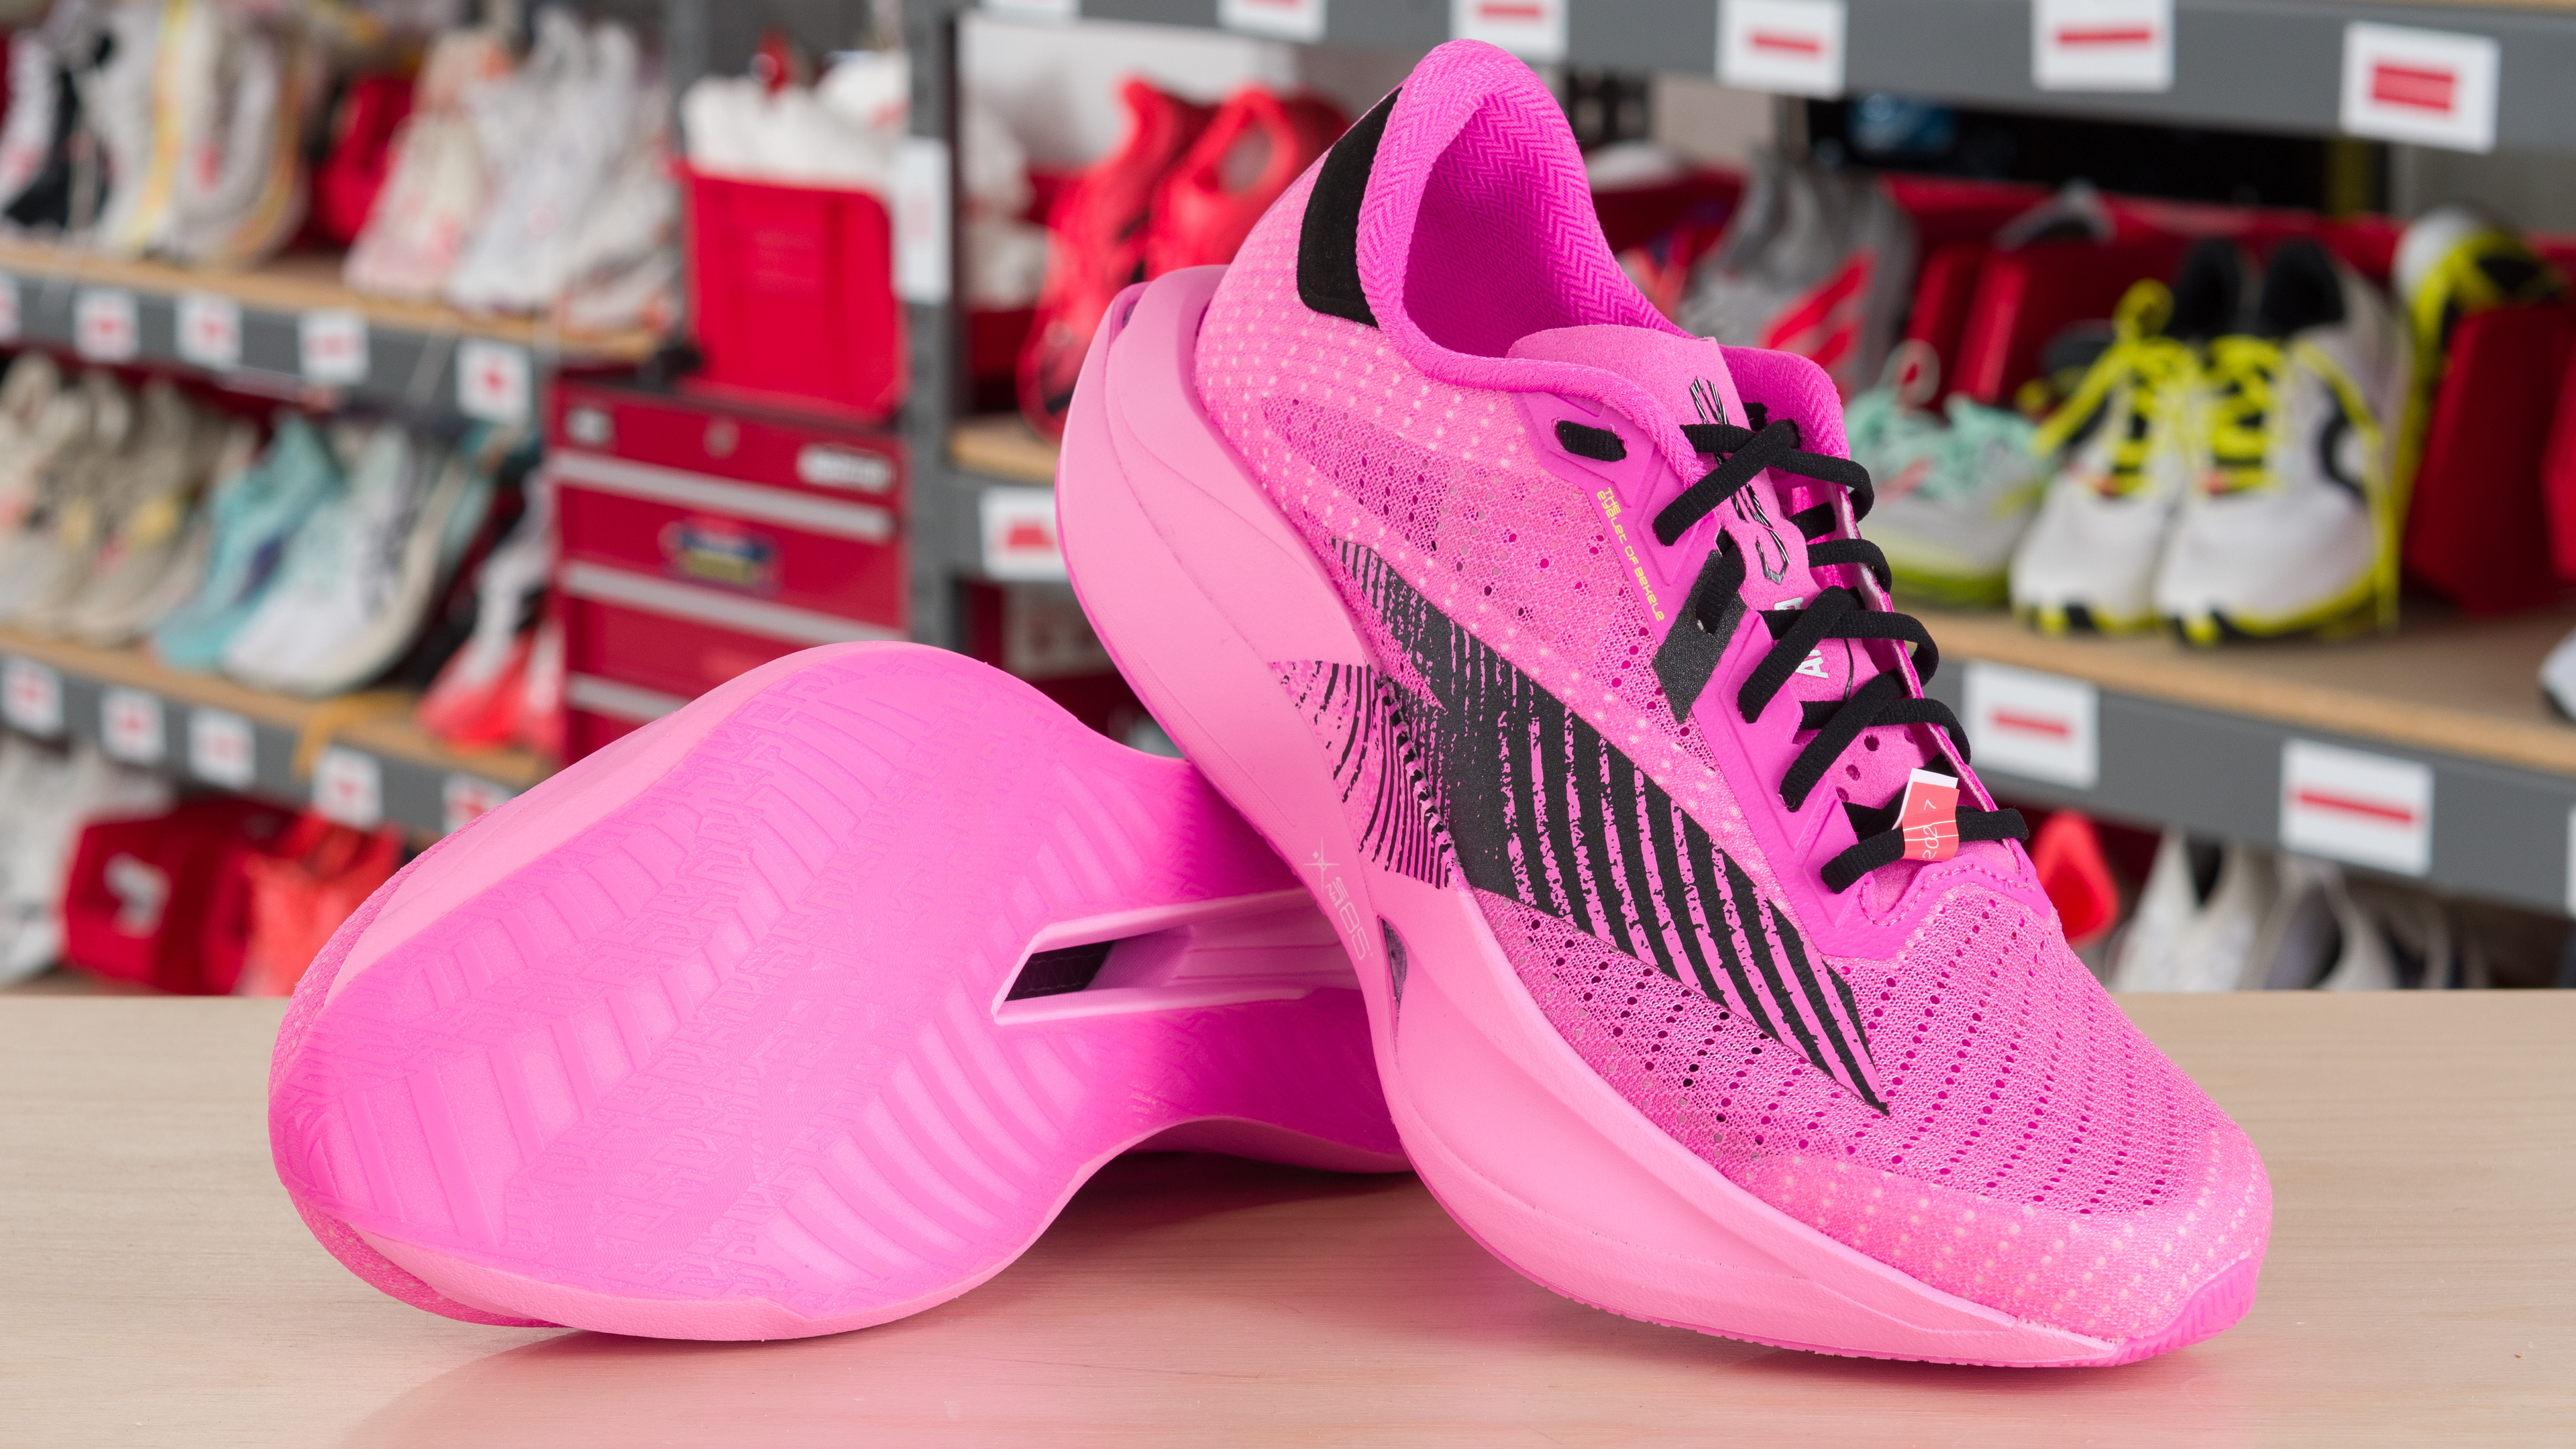
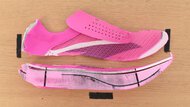
ANTA C202 7
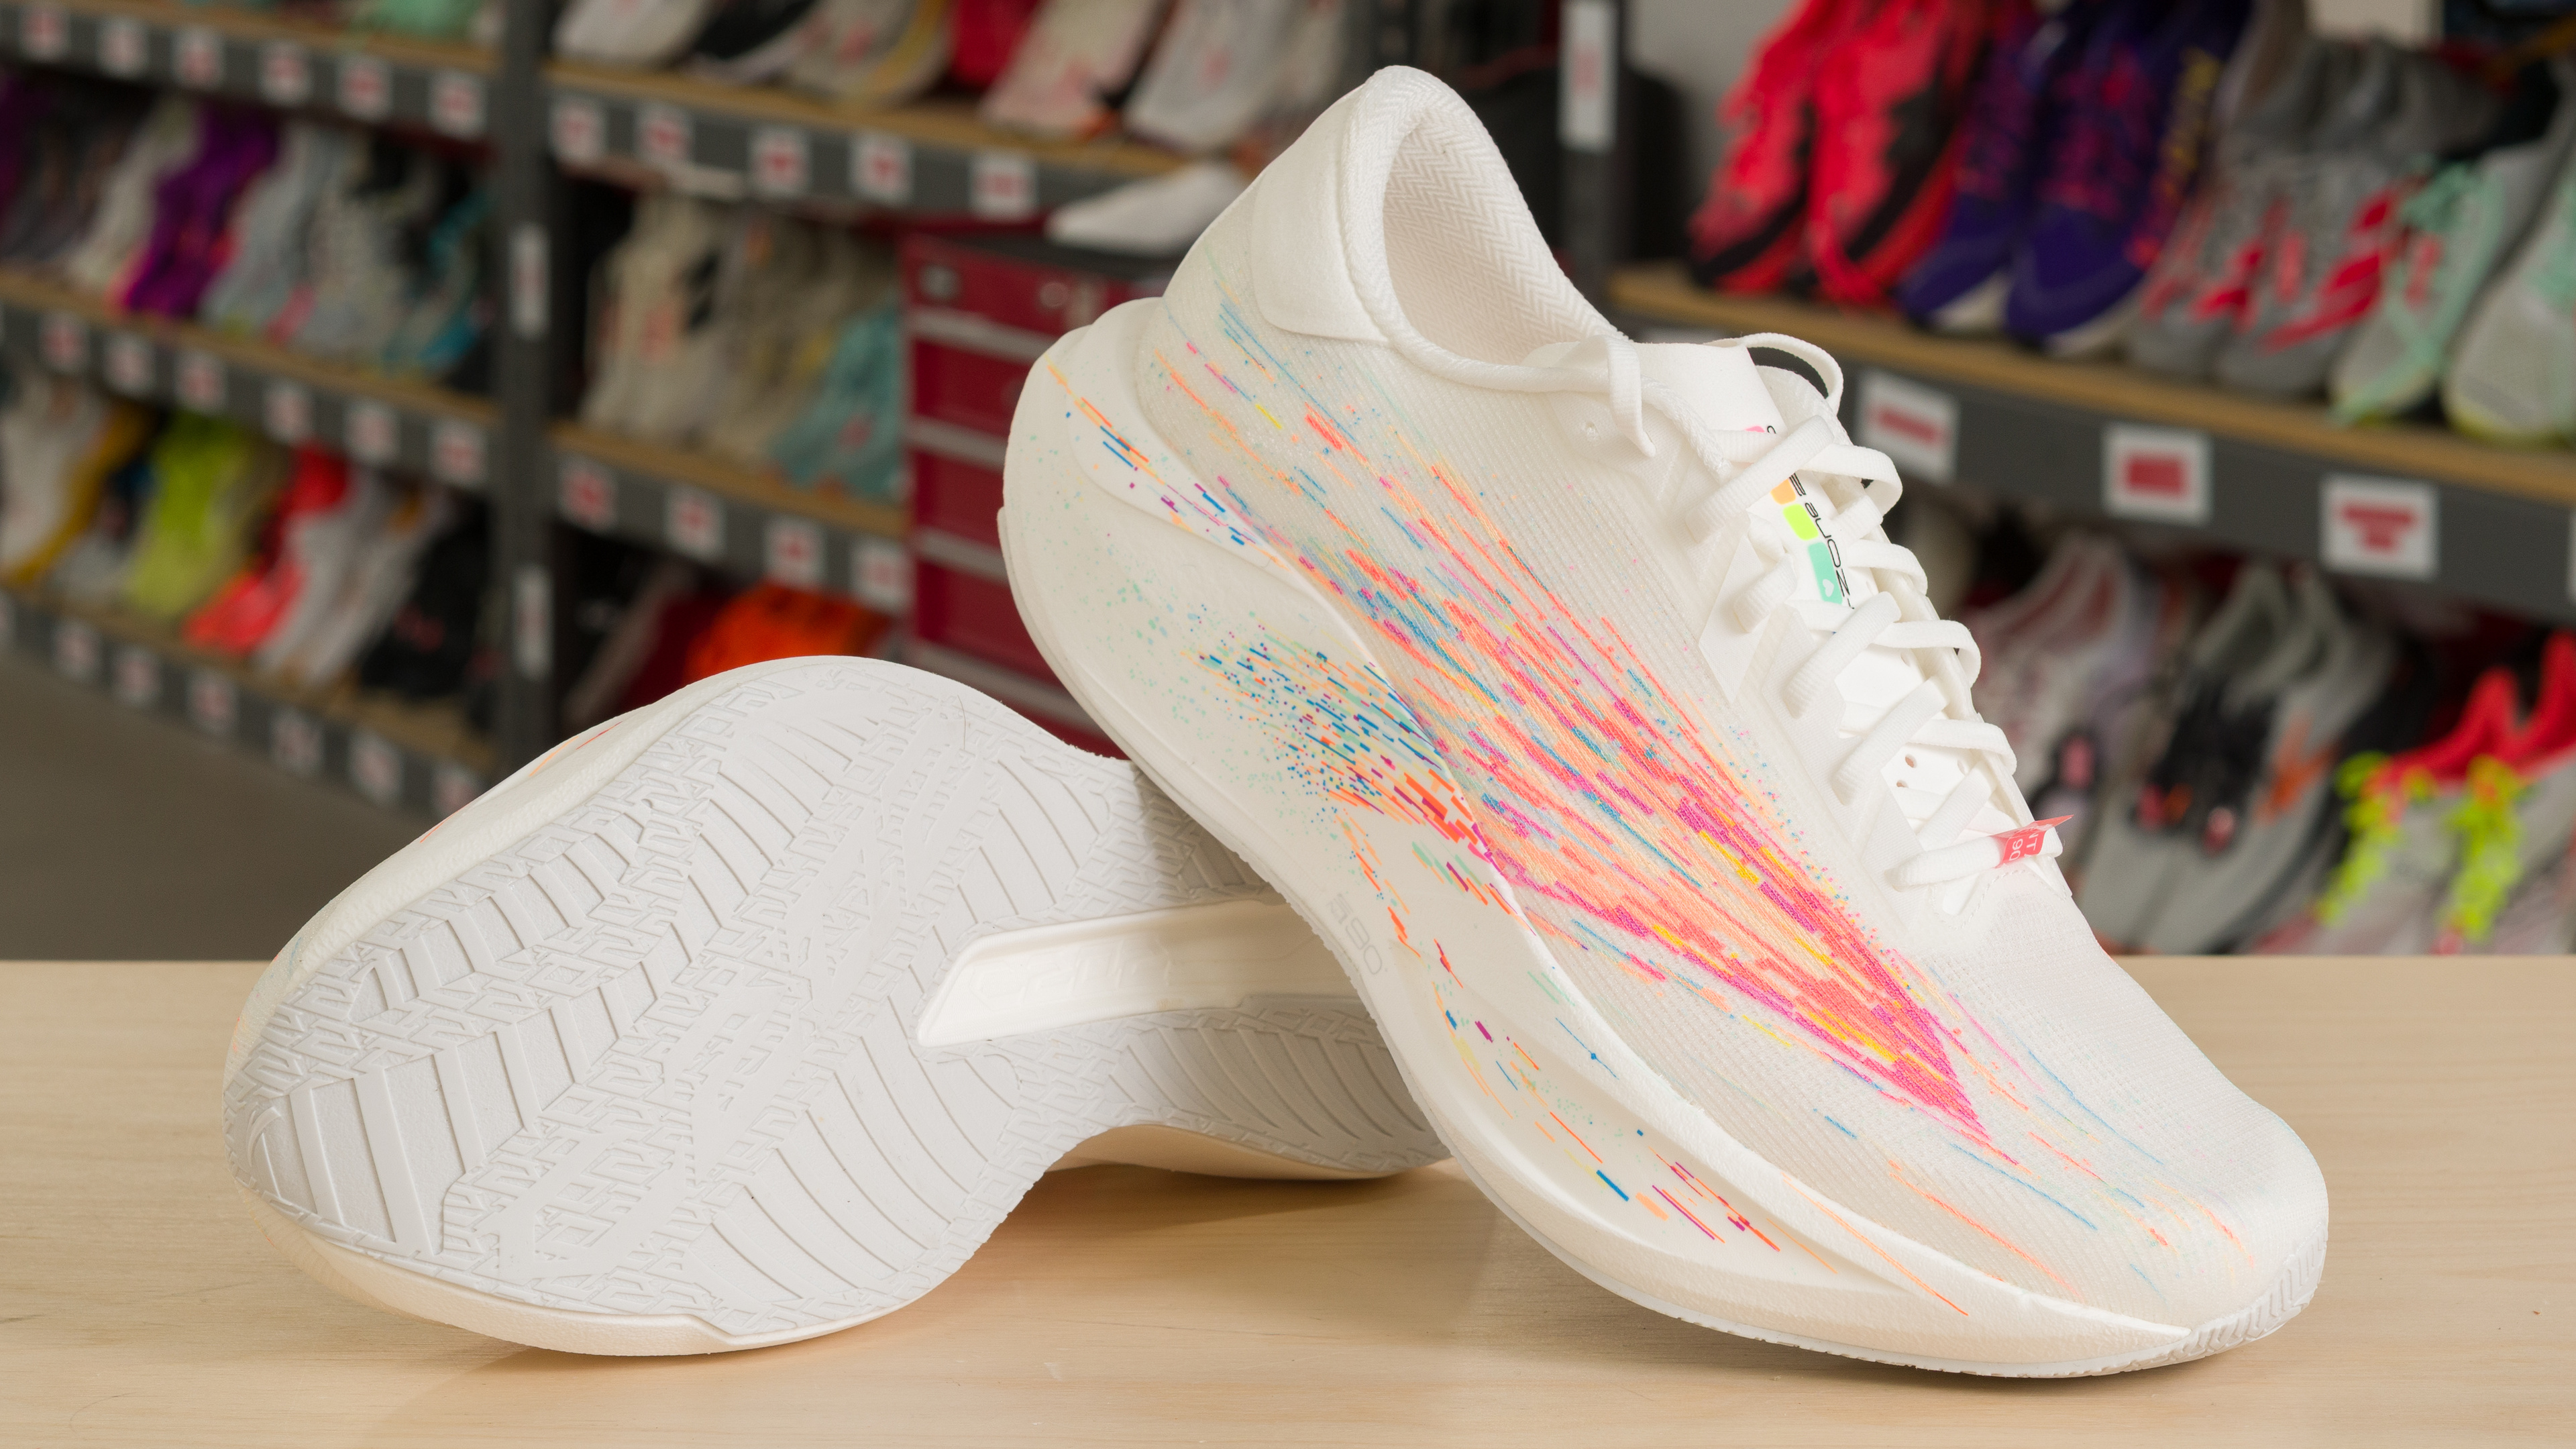
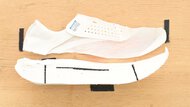
ANTA Zone 2 90
The ANTA Zone 2 90 and ANTA C202 7 are both lightweight performance shoes, but they fill very different roles in ANTA’s lineup. The Zone 2 90 is the unplated all-rounder, pairing excellent energy return with deep cushioning and a soft, bouncy ride that can handle everything from easy miles to progressive long runs. The C202 7, meanwhile, is a carbon-plated super trainer designed for faster training and race-day efforts. Its stiffer platform and aggressive rocker make it smoother and more efficient when the pace picks up,.
Variants
- C202 7 (Black/Silver - (Men - US 9))
- C202 7 (Black/Silver - (Women - US 7))
- Zone 2 90 (Galsang Flower - (Men - US 9))
- Zone 2 90 (White/Red/Silver - (Women - US 7))
Main Differences for
Half/Full Marathon Racing
Half/Full Marathon Racing
Threshold
Half/Full Marathon Racing
7.9
8.0
Forefoot Bending Stiffness
8.8
6.5
Weight
7.7
8.1
Full Comparison
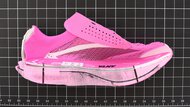
Design
Weight
7.7
8.1
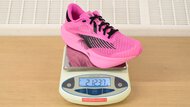
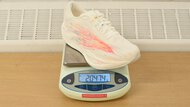
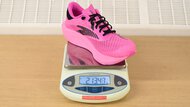
Right Shoe Weight Photo
Compare High-Res
Compare High-Res
Left Shoe Weight Photo
Compare High-Res
Compare High-Res

Weight
212.9 g (7.51 oz)
202.2 g (7.13 oz)
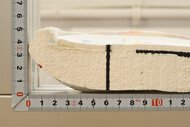
Stack Heights
Stack Height Photo
Compare High-Res
Compare High-Res

Heel Stack Height
37.8 mm
38.1 mm
Forefoot Stack Height
30.3 mm
29.7 mm
Heel-To-Toe Drop
7.5 mm
8.4 mm
Advertised Heel-To-Toe Drop
8.0 mm
6.0 mm
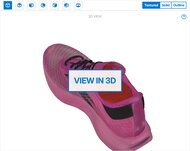
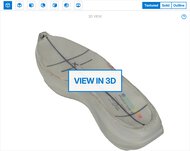
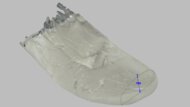
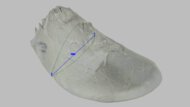
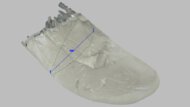
External Shape
3D Model Full Shoe
Preview 3D
Preview 3D

Outsole Heel Width
84 mm (3.3")
84 mm (3.3")
Outsole Arch Width
64 mm (2.5")
66 mm (2.6")
Outsole Forefoot Width
108 mm (4.3")
115 mm (4.5")
Heel Width-To-Stack Ratio
2.22
2.20
Forefoot Width-To-Stack Ratio
3.56
3.87
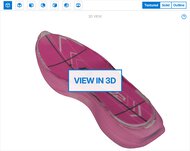
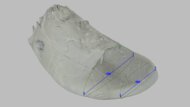
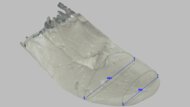
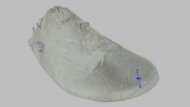
Internal Shape
3D Model Internal
Preview 3D
Preview 3D
Internal Length
272 mm (10.7")
270 mm (10.6")
Internal Heel Width
64 mm (2.5")
58 mm (2.3")
Internal Forefoot Width
91 mm (3.6")
92 mm (3.6")
Wide Sizing Available
No
No
Forefoot Fit: Width
9.1
9.3
Forefoot Width Photo
Compare High-Res
Compare High-Res
Ball-Of-Foot TTS Deviation
4.1 mm (0.163")
3.6 mm (0.141")
Toe TTS Deviation
1.3 mm (0.049")
-0.2 mm (-0.009")
Forefoot Fit: Height
7.9
7.2
Forefoot Height Photo
Compare High-Res
Compare High-Res
Toe TTS Deviation
-2.6 mm (-0.100")
-3.4 mm (-0.132")
Arch Fit: Width
4.7
5.4
Arch Fit Photo
Compare High-Res
Compare High-Res
Arch Width TTS Deviation
-7.3 mm (-0.285")
-6.5 mm (-0.254")
Length Fit
7.0
10
Toe Clearance Photo
Compare High-Res

Compare High-Res

Heel Rocker Geometry
8.1
7.7
Heel Rocker Photo
Compare High-Res

Compare High-Res
Heel Spring
27 mm (1.1")
24 mm (0.9")
Heel Apex Position
17.4%
15.4%
Heel Rocker Angle
28.4°
28.6°
Forefoot Rocker Geometry
7.9
7.6
Forefoot Rocker Photo
Compare High-Res

Compare High-Res
Toe Spring
56 mm (2.2")
52 mm (2.0")
Toe Apex Position
63.4%
65.0%
Forefoot Rocker Angle
28.1°
27.5°
Other Features
Other Features Photo
Compare High-Res
Compare High-Res
Tongue Gusset Type
Non-gusseted
Non-gusseted
Plate
Carbon Fiber
Plastic Shank
Performance
Heel Compression Energy Return
7.2
8.4
Heel Compression Video
Heel Energy Return
Preview Graph
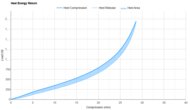
Heel Energy Return
76.7%
83.5%
Forefoot Compression Energy Return
7.6
8.6
Forefoot Compression Video
Forefoot Energy Return
Preview Graph
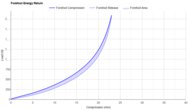
Forefoot Energy Return
78.6%
85.0%
Heel Cushioning
8.2
8.8
Heel Cushioning Picture
Compare High-Res

Compare High-Res

Heel Cushioning
Preview Graph
Energy Absorbed At 550N
4.21 J
4.20 J
Energy Absorbed At 1100N
9.90 J
10.83 J
Energy Absorbed At 1900N
15.90 J
17.45 J
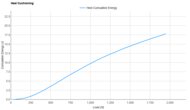
Forefoot Cushioning
7.9
8.4
Forefoot Cushioning Picture
Compare High-Res

Compare High-Res

Forefoot Cushioning
Preview Graph
Preview Graph
Energy Absorbed At 800N
4.94 J
5.38 J
Energy Absorbed At 1300N
8.46 J
9.27 J
Energy Absorbed At 2050N
12.50 J
13.38 J
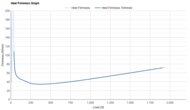
Heel Firmness
6.7
6.0
Heel Firmness Graph
Preview Graph
Preview Graph
Firmness At 550N
36.3 N/mm
35.8 N/mm
Firmness At 1100N
49.0 N/mm
46.2 N/mm
Firmness At 1900N
71.4 N/mm
66.8 N/mm
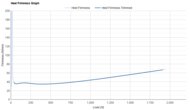
Forefoot Firmness
7.6
5.8
Forefoot Firmness Graph
Preview Graph
Preview Graph
Firmness At 800N
54.0 N/mm
48.3 N/mm
Firmness At 1300N
71.2 N/mm
63.8 N/mm
Firmness At 2050N
99 N/mm
89 N/mm
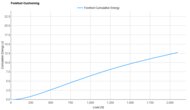
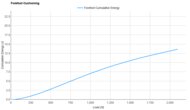
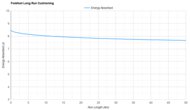
Forefoot Long Run Cushioning
7.4
8.2
Forefoot Long Run Cushioning
Preview Graph
Preview Graph
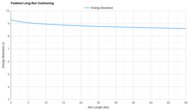
Energy Absorbed At 10km
8.03 J
8.95 J
Energy Absorbed At 20km
7.89 J
8.82 J
Energy Absorbed At 30km
7.79 J
8.74 J
Energy Absorbed At 40km
7.71 J
8.67 J
Rocker Stiffness
8.7
6.3
Forefoot Rocker Stiffness Video
Forefoot Rocker Stiffness Graph
Preview Graph
Preview Graph
Force To Flatten The Rocker
151 N
67 N
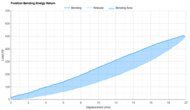
Forefoot Bending Energy Return
7.3
8.2
Forefoot Bending Video
Forefoot Bending Energy Return
Preview Graph
Preview Graph
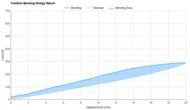
Forefoot Bending Energy Return
66.6%
73.3%
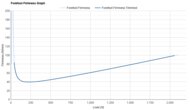
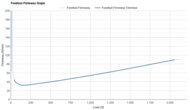
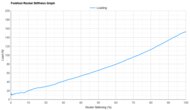
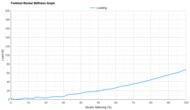
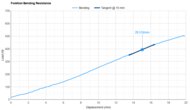
Forefoot Bending Stiffness
8.8
6.5
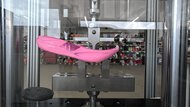
Forefoot Bending Resistance Picture
Compare High-Res
Compare High-Res

Forefoot Bending Resistance
Preview Graph
Preview Graph
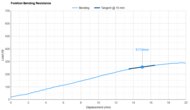
Forefoot Bending Stiffness
29.3 N/mm
9.7 N/mm
Forefoot Bending Force
392 N
256 N
To access
Become a member
unlimited full product reviews,
product prices, and
other exclusive site features
ANTA C202 7
ANTA Zone 2 90
Comments
ANTA C202 7 vs ANTA Zone 2 90: Main Discussion
What do you think of these products? Let us know below.
Looking for a personalized buying advice from the RTINGS.com experts? Members have direct access to buying advice on our member forum.