Our Verdict
8.5
Half/Full Marathon Racing
8.4
5K/10K Racing
8.5
Long Run
7.2
Daily Training
8.9
Energy Return
8.5
Responsiveness
8.4
Cushioning
8.8
Stability
8.1
True To Size
8.5
Half/Full Marathon Racing
8.4
5K/10K Racing
8.5
Long Run
7.2
Daily Training
Performance Usages
8.9
Energy Return
8.5
Responsiveness
8.4
Cushioning
8.8
Stability
8.1
True To Size
Changelog
- Updated Jun 19, 2026: Review published.
- Updated Jun 08, 2026: Our testers have started testing this product.
- Updated Jun 03, 2026: The product has arrived in our lab, and our testers will start evaluating it soon.
- Updated Jun 03, 2026: We've purchased the product and are waiting for it to arrive in our lab.
How We Test Running Shoes

We buy and test running shoes with a very data-oriented approach. While we're just getting started, our methodology already has dozens of tests to help you make the right purchasing decision for your needs. Not only do we use high-end equipment to gather objective data, but we also order multiple sizes of the same shoes so team members can log in miles. This real-world testing is conducted at various paces and conditions, across different types of workouts, to cover all the bases. This allows us to verify our results and ensure they align with what you might feel with a specific pair.
Test Results
Sort:
RATINGS
Category:
All
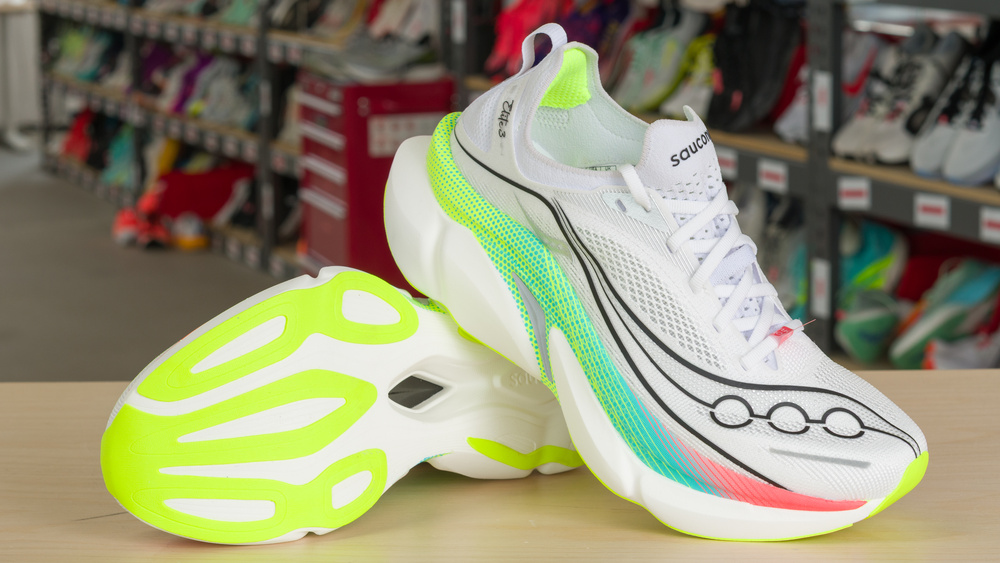
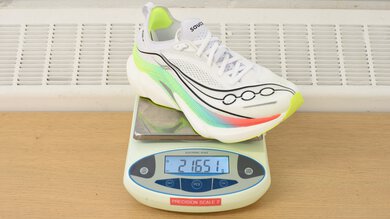
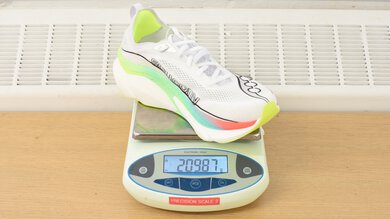
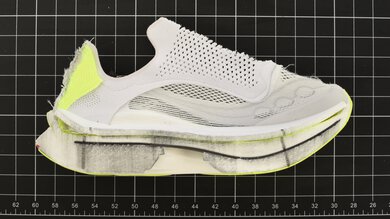
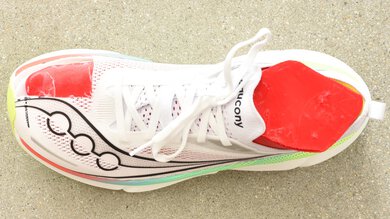
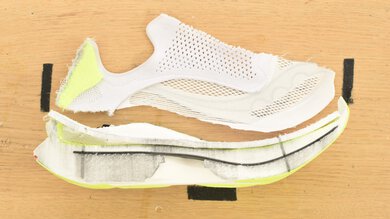
Design
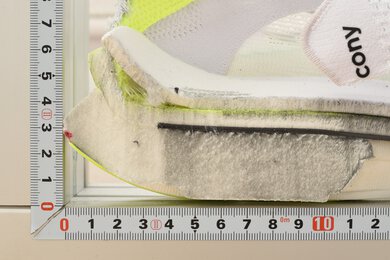
Stack Heights
Heel Stack Height
40.2 mm
Forefoot Stack Height
32.2 mm
Heel-To-Toe Drop
8.0 mm
Advertised Heel-To-Toe Drop
8.0 mm
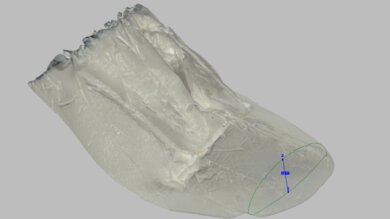
External Shape
Preview 3D
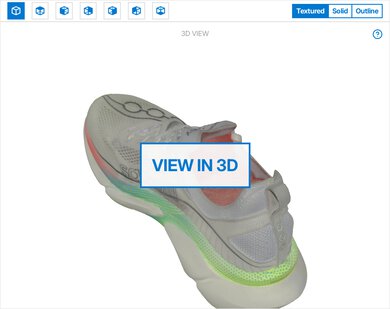
Outsole Heel Width
95 mm (3.8")
Outsole Arch Width
74 mm (2.9")
Outsole Forefoot Width
116 mm (4.6")
Heel Width-To-Stack Ratio
2.36
Forefoot Width-To-Stack Ratio
3.60
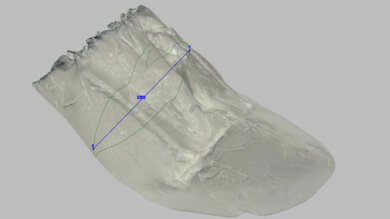
Internal Shape
Preview 3D
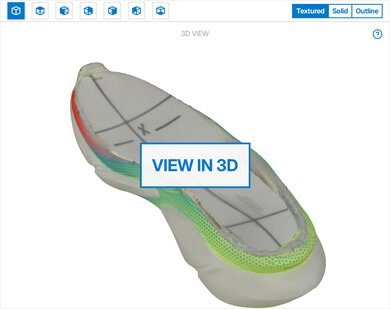
Internal Length
278 mm (10.9")
Internal Heel Width
57 mm (2.2")
Internal Forefoot Width
89 mm (3.5")
Wide Sizing Available
No
9.7
Forefoot Fit: Width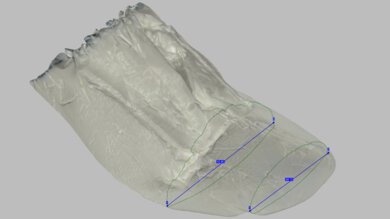
Ball-Of-Foot TTS Deviation
1.8 mm (0.071")
Toe TTS Deviation
1.9 mm (0.074")
8.2
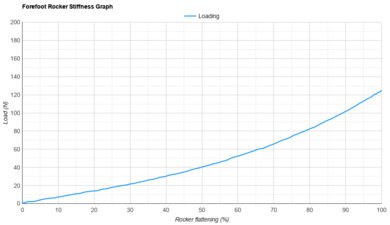
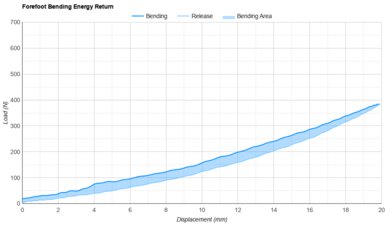
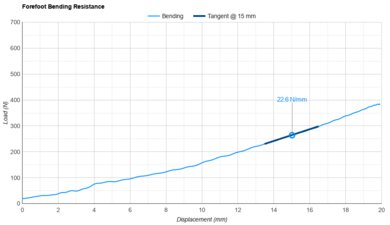
Forefoot Rocker Geometry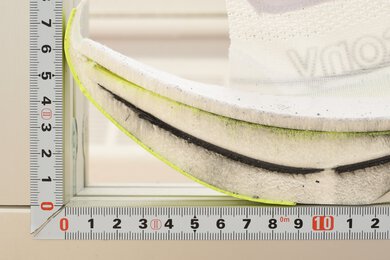
Toe Spring
60 mm (2.4")
Toe Apex Position
66.7%
Forefoot Rocker Angle
32.3°
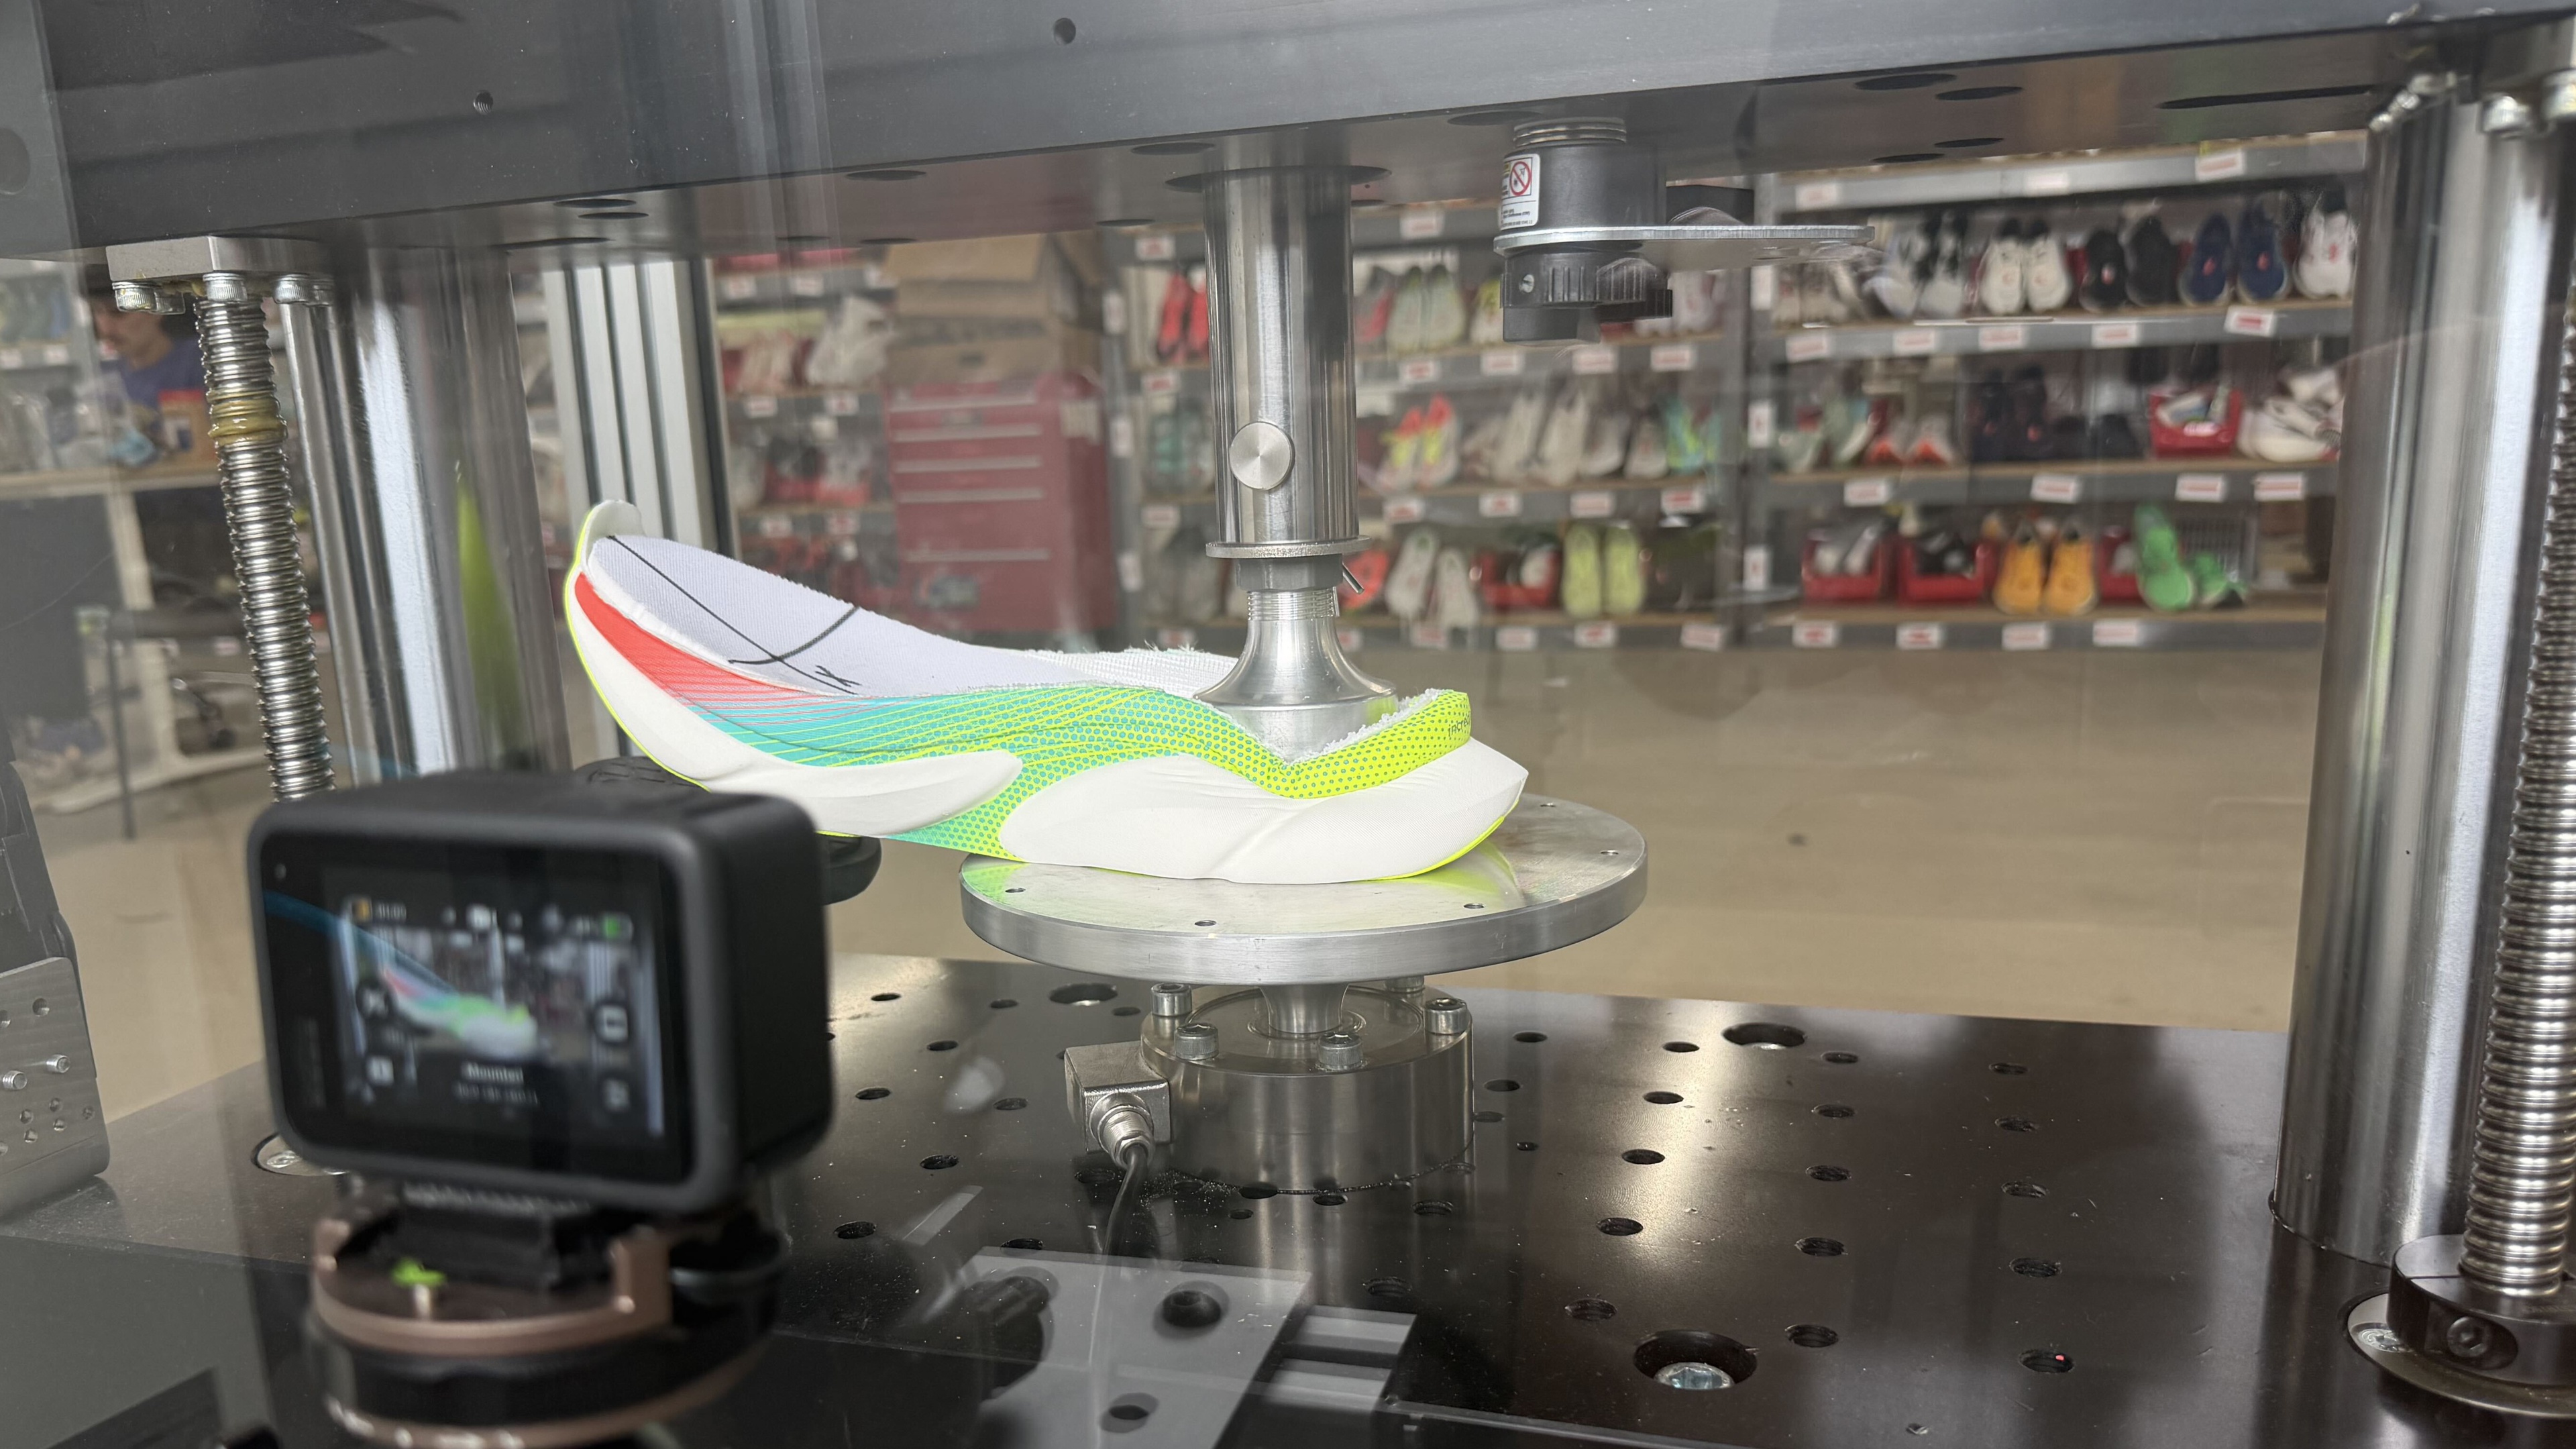
Performance
8.5
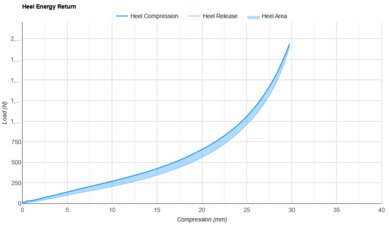
Heel Cushioning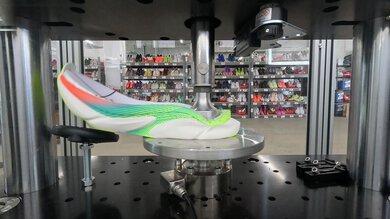
Preview Graph
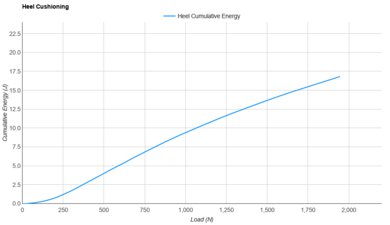
Energy Absorbed At 550N
4.57 J
Energy Absorbed At 1100N
10.32 J
Energy Absorbed At 1900N
16.50 J
8.2
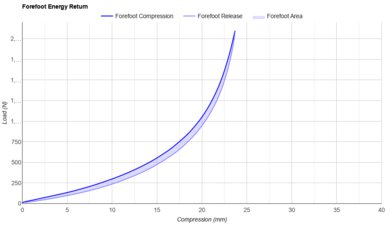
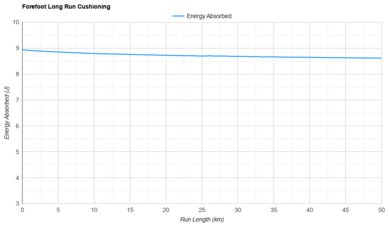
Forefoot Cushioning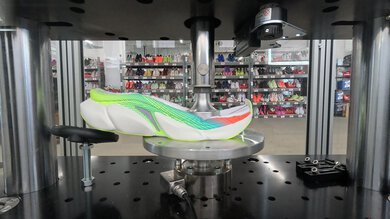
Preview Graph
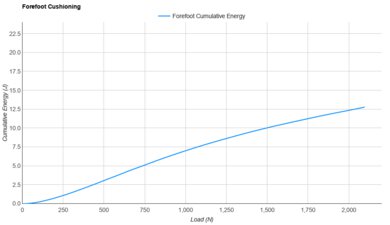
Energy Absorbed At 800N
5.50 J
Energy Absorbed At 1300N
8.92 J
Energy Absorbed At 2050N
12.56 J
9.5
Heel Firmness
Firmness At 550N
48.8 N/mm
Firmness At 1100N
121.4 N/mm
Firmness At 1900N
279.9 N/mm
10
Forefoot Firmness
Firmness At 800N
98.0 N/mm
Firmness At 1300N
217.2 N/mm
Firmness At 2050N
472 N/mm
Missing something for your decision? Tell us!