The Samsung QN80F is a new entry-level model in Samsung's Neo QLED lineup, which combines QLED colors and Mini LED local dimming. It's available in a wide range of sizes, from 55 inches up to a massive 100-inch TV, but there are some differences between each model, so it's difficult to know exactly what you're buying with that model. So, we decided to buy and review the 100-inch version (Samsung QN100QN80F) of this TV to complement our existing review of the 65-inch model (Samsung QN65QN80F).
We were surprised to find some noticeable differences between them, and while the 100-inch model is significantly brighter, Samsung hasn't done a good job scaling their local dimming to this size, and it looks worse in a dark room. Below, we'll break down those differences and more, and show you how they impact the overall viewing experience. If you want to skip the analysis and go straight to the data, check out our compare tool instead.
Panel Technology
Before we get into the actual performance differences, let's start by taking a look at the underlying panel technology used on each model. Feel free to skip ahead to the Performance Differences section if you just want to see how they stack up against each other.
Panel Technology And SPD
| Samsung 100QN80F | Samsung 65QN80F |
|---|---|
 |
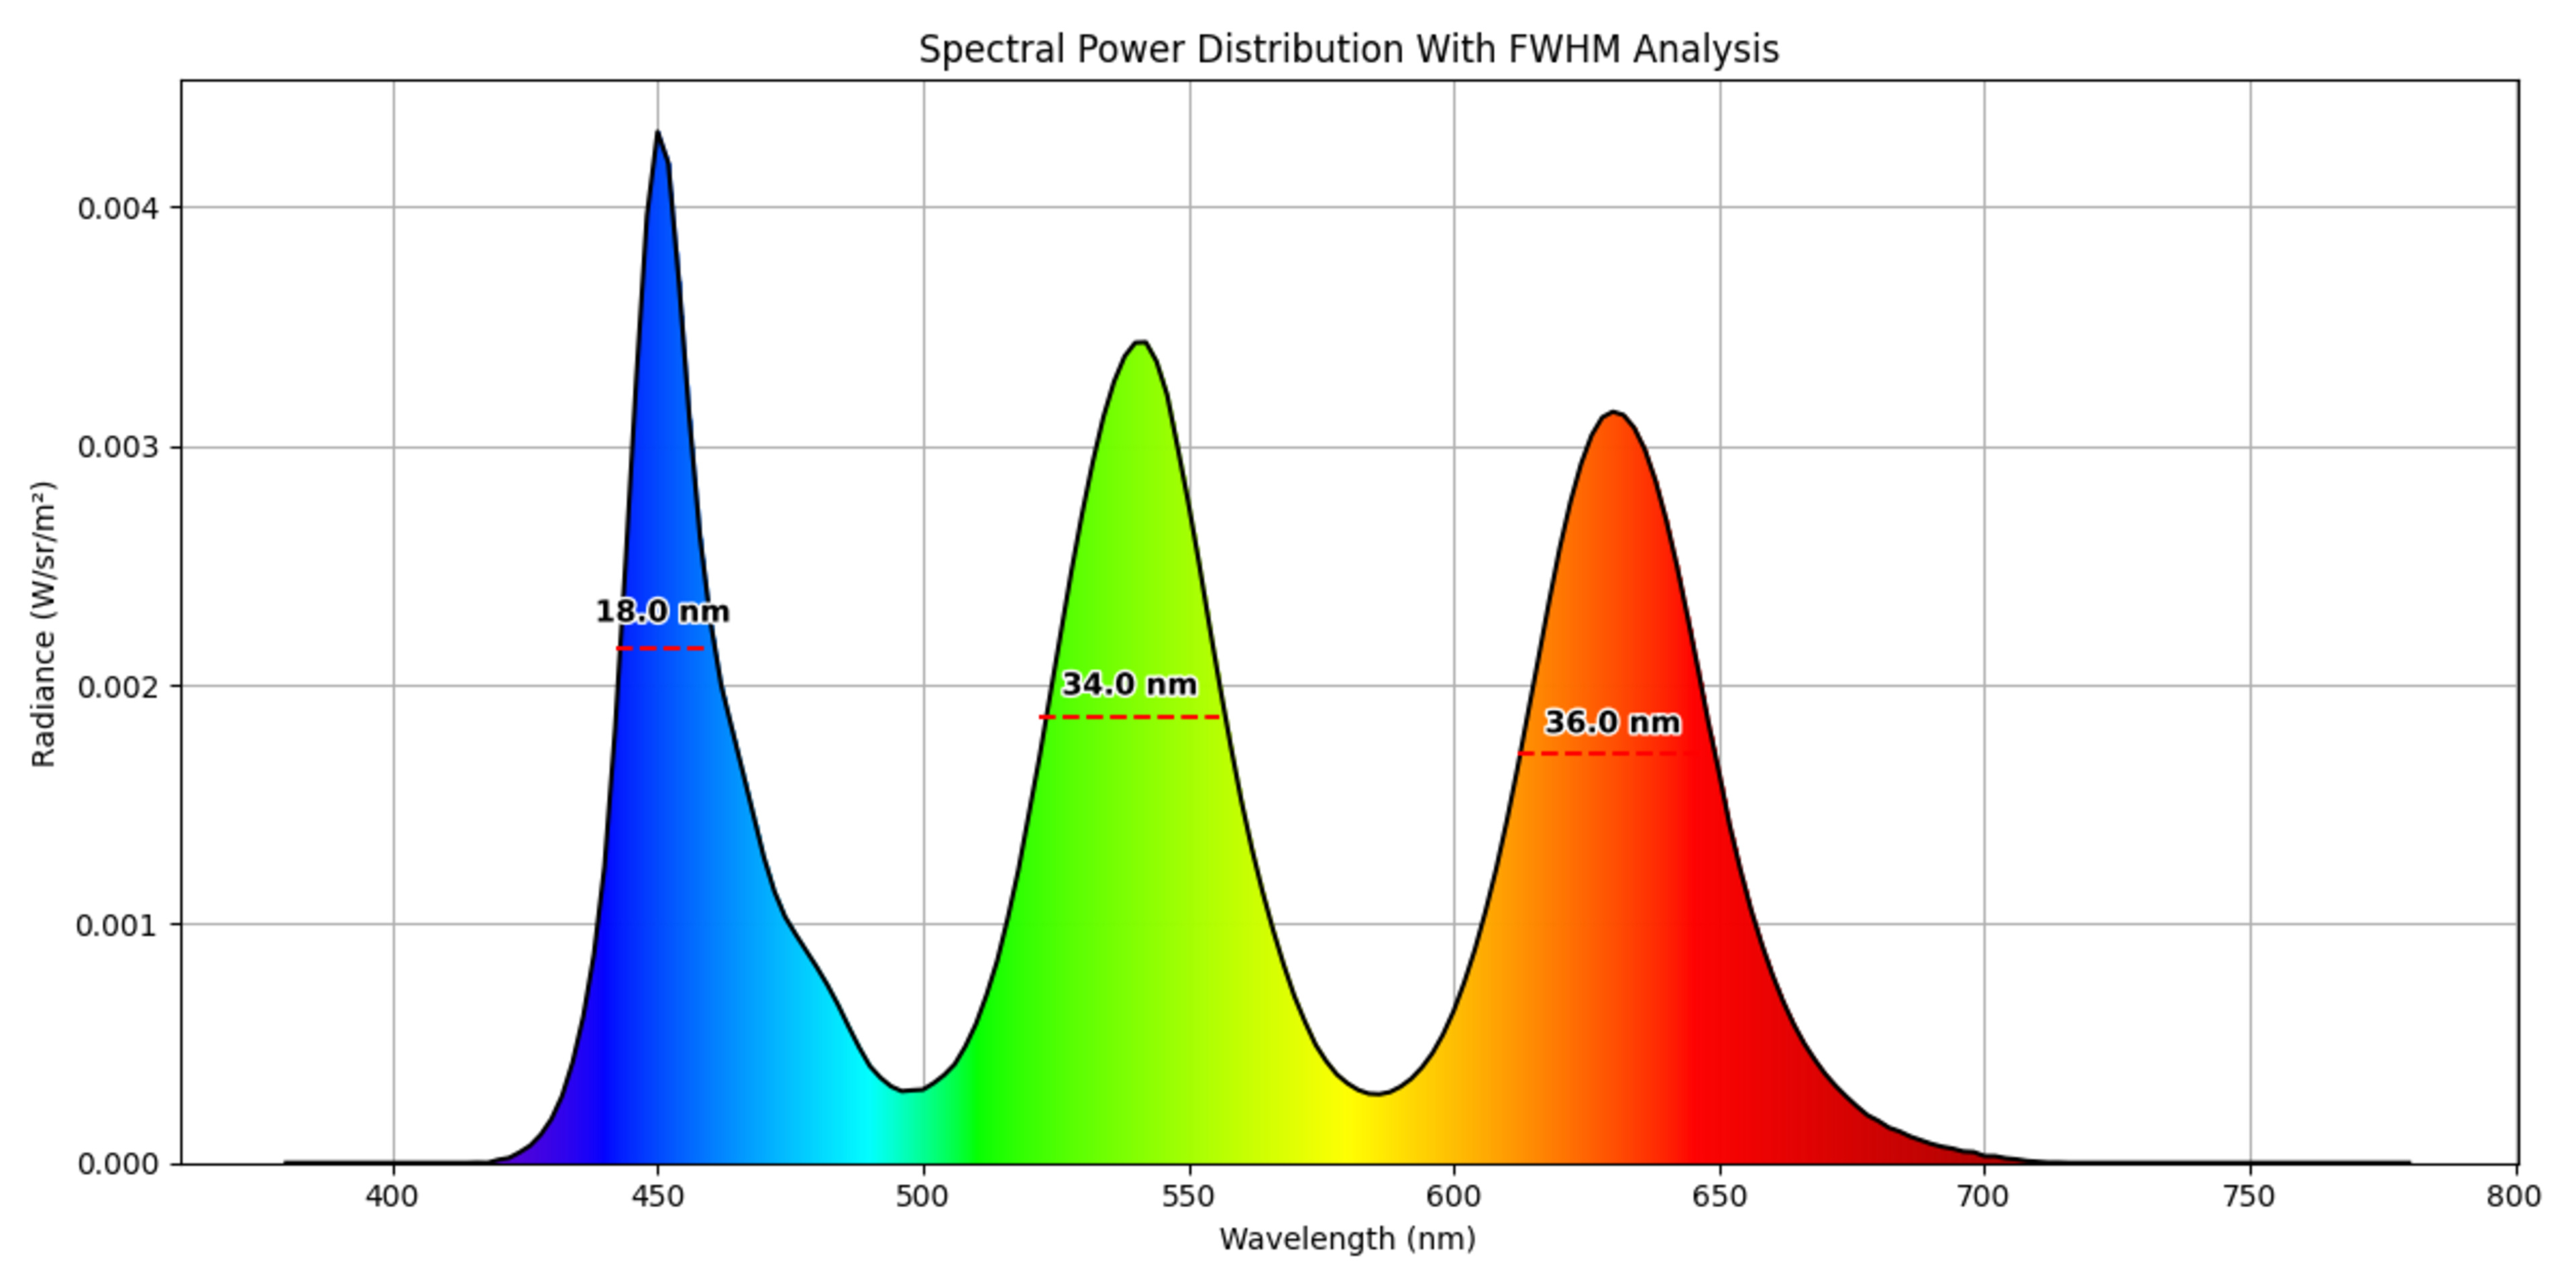 |
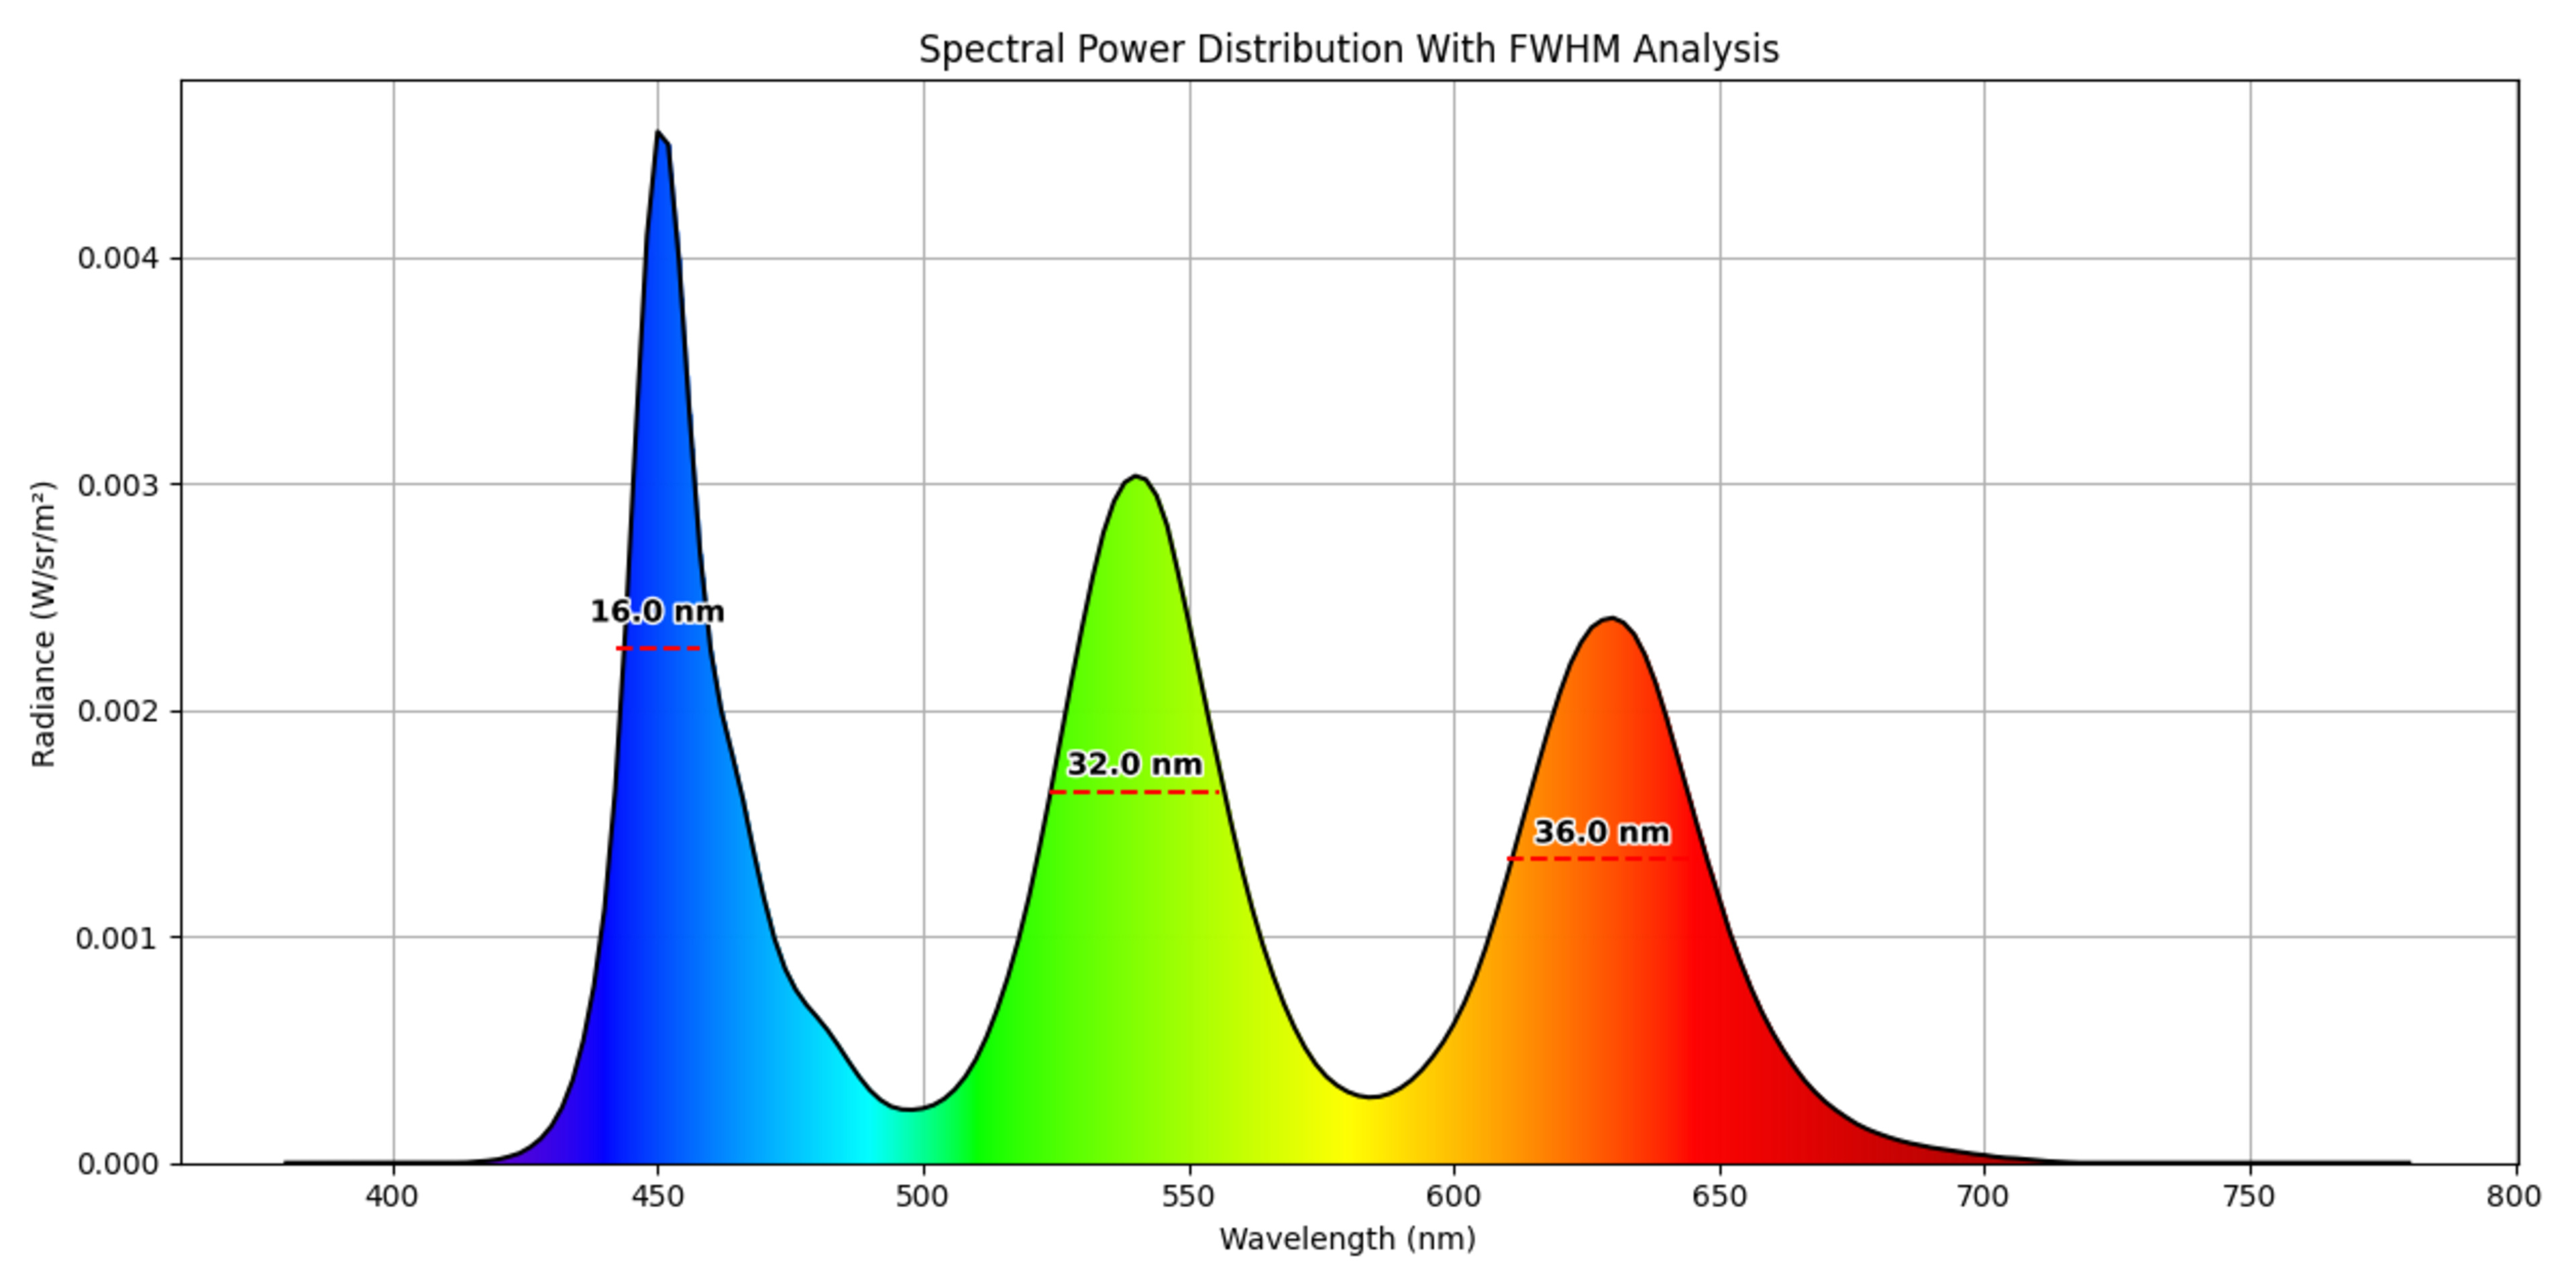
The spectral power distribution shows that these two TVs use very similar technology. The red and green peaks on the 100-inch panel aren't as powerful relative to blue as they are on the 65-inch model, but this doesn't impact the overall performance much. The full-width at half-maximum (FWHM) analysis shows that both TVs use cadmium-free quantum dots.
Performance Differences
Now that we've explored the technical differences between the panels, let's examine how these two TVs perform. It's normal for some metrics to change slightly even between individual units of the same size, so we'll only examine the real differences between them that aren't likely caused by panel variance.
HDR Brightness
| Samsung 100QN80F | Samsung 65QN80F |
|---|---|
 |
 |
 |
 |
 |
 |
| Test | 100" (cd/m²) | 65" (cd/m²) | Difference in cd/m² | % Difference |
|---|---|---|---|---|
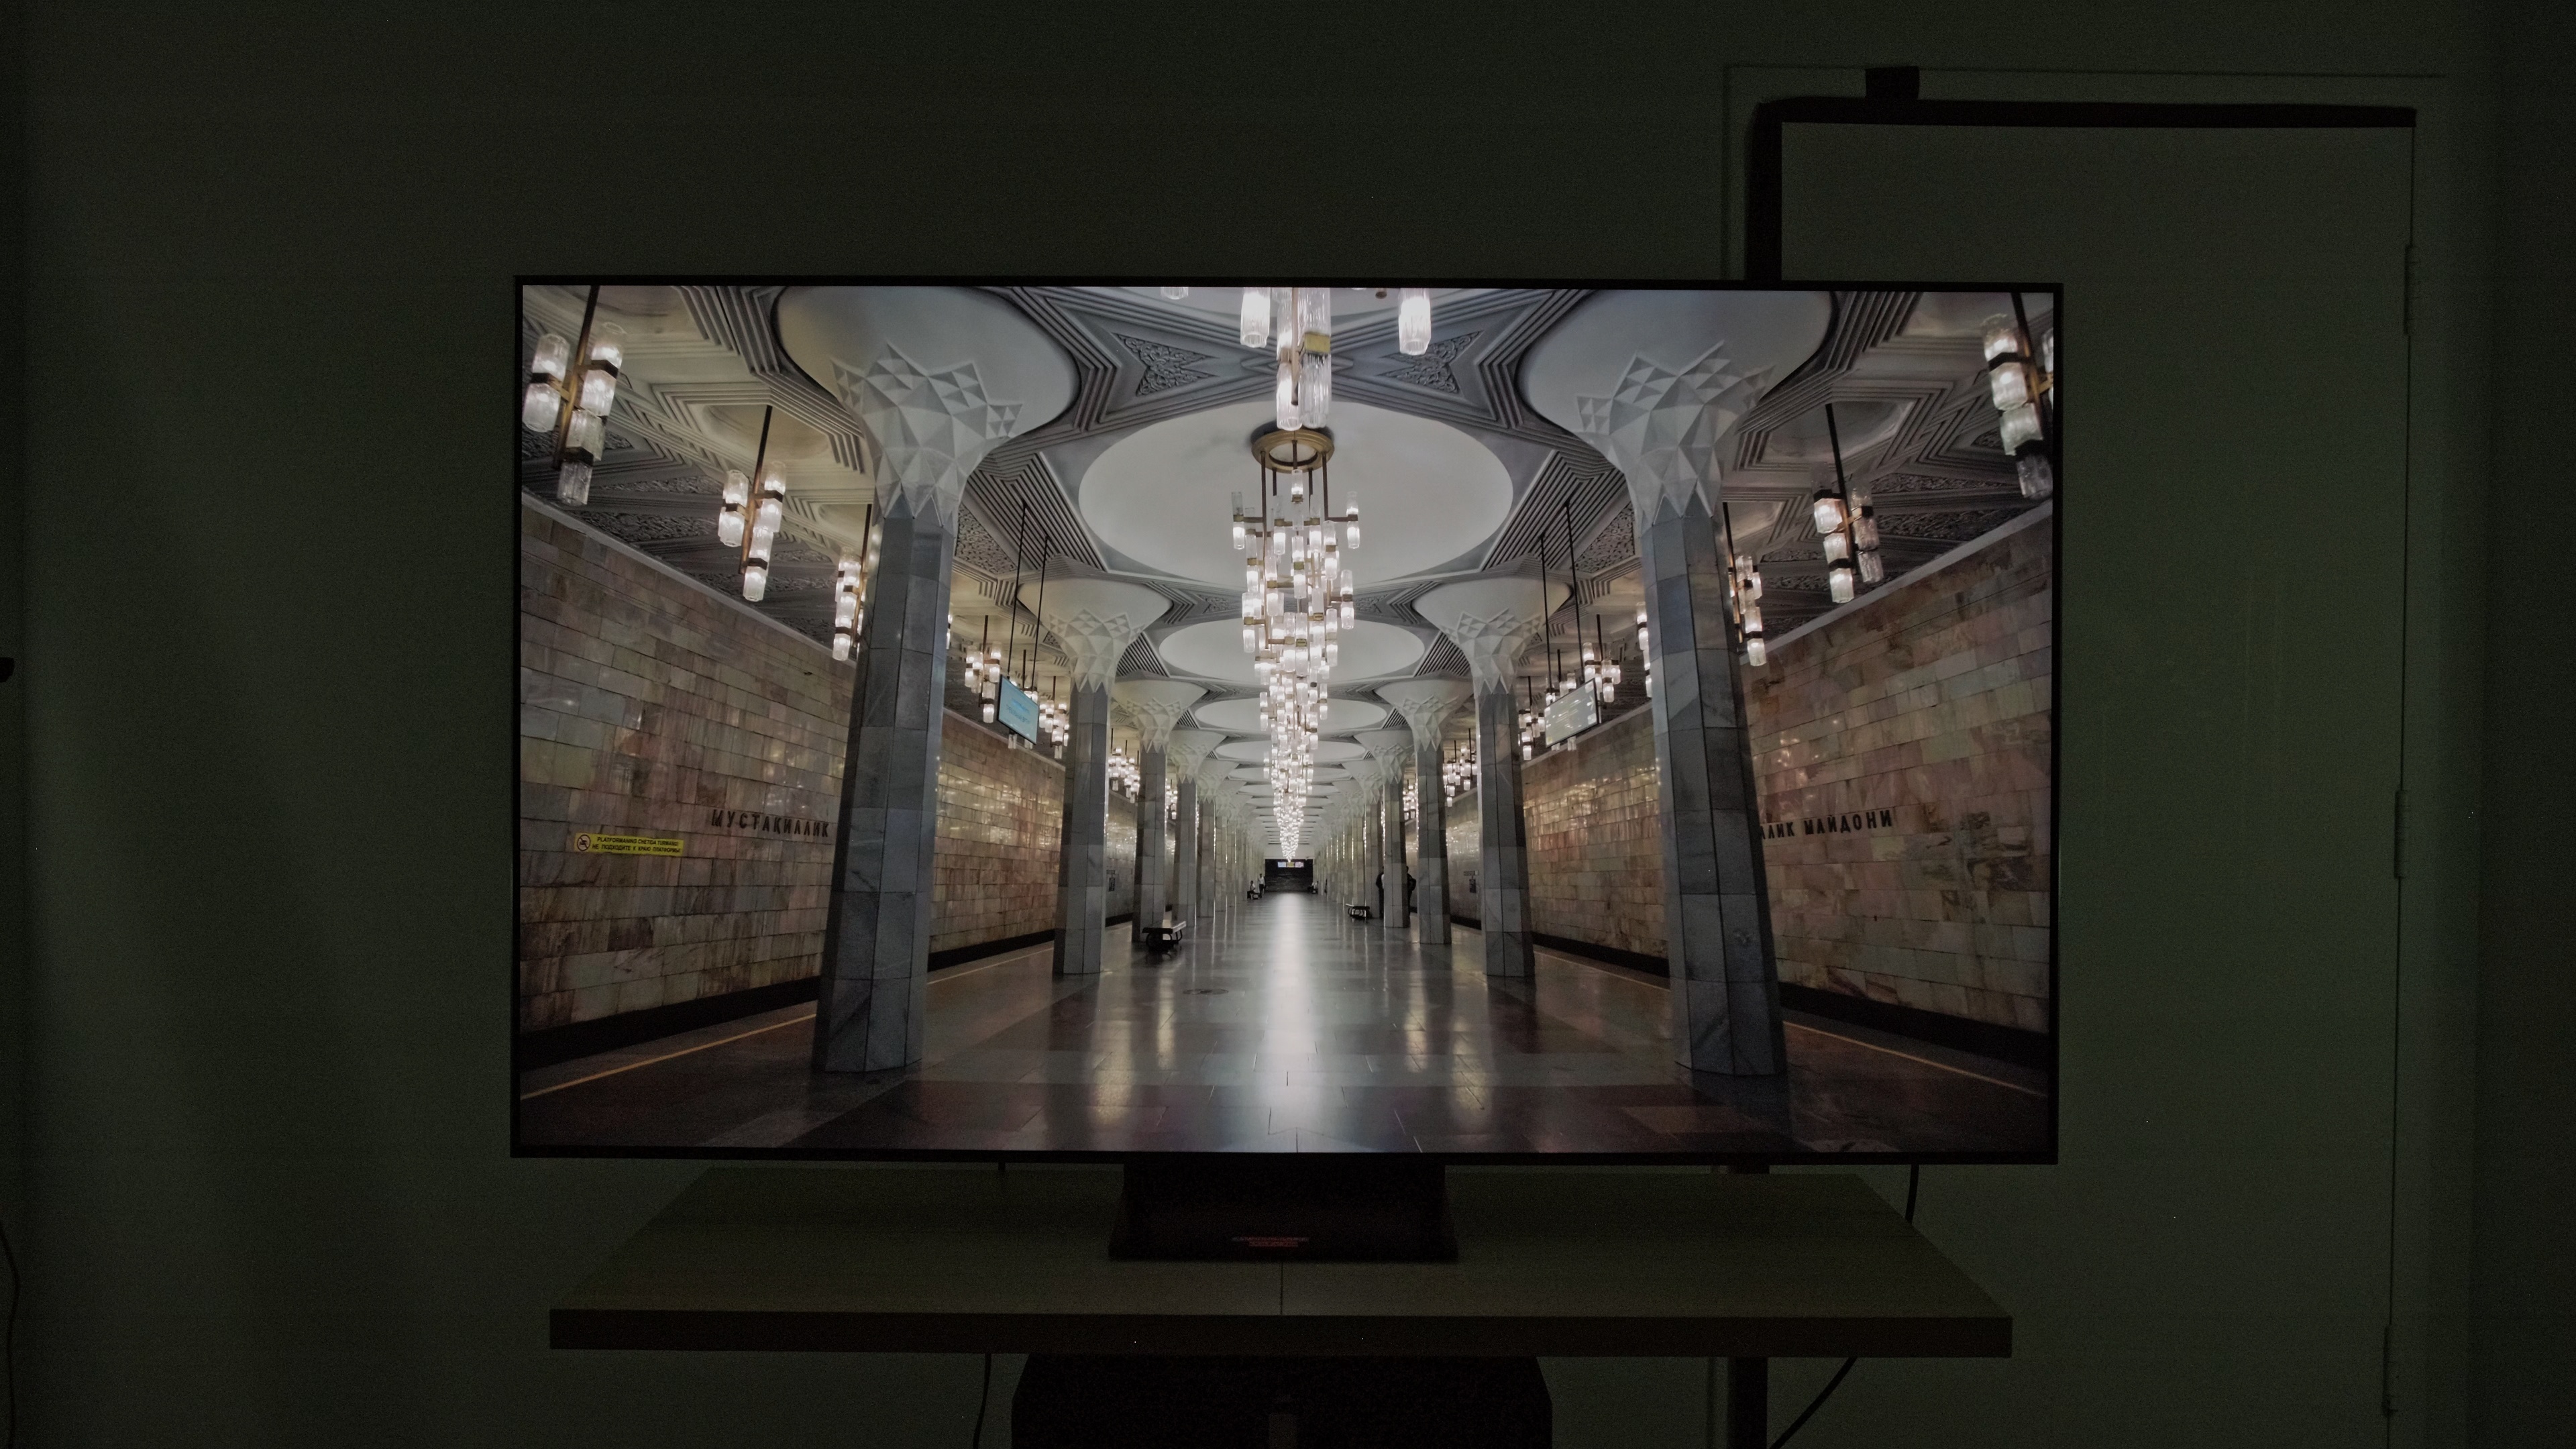
| Hallway Lights (~1950 cd/m²) | 664 | 458 | 206 | 45% |
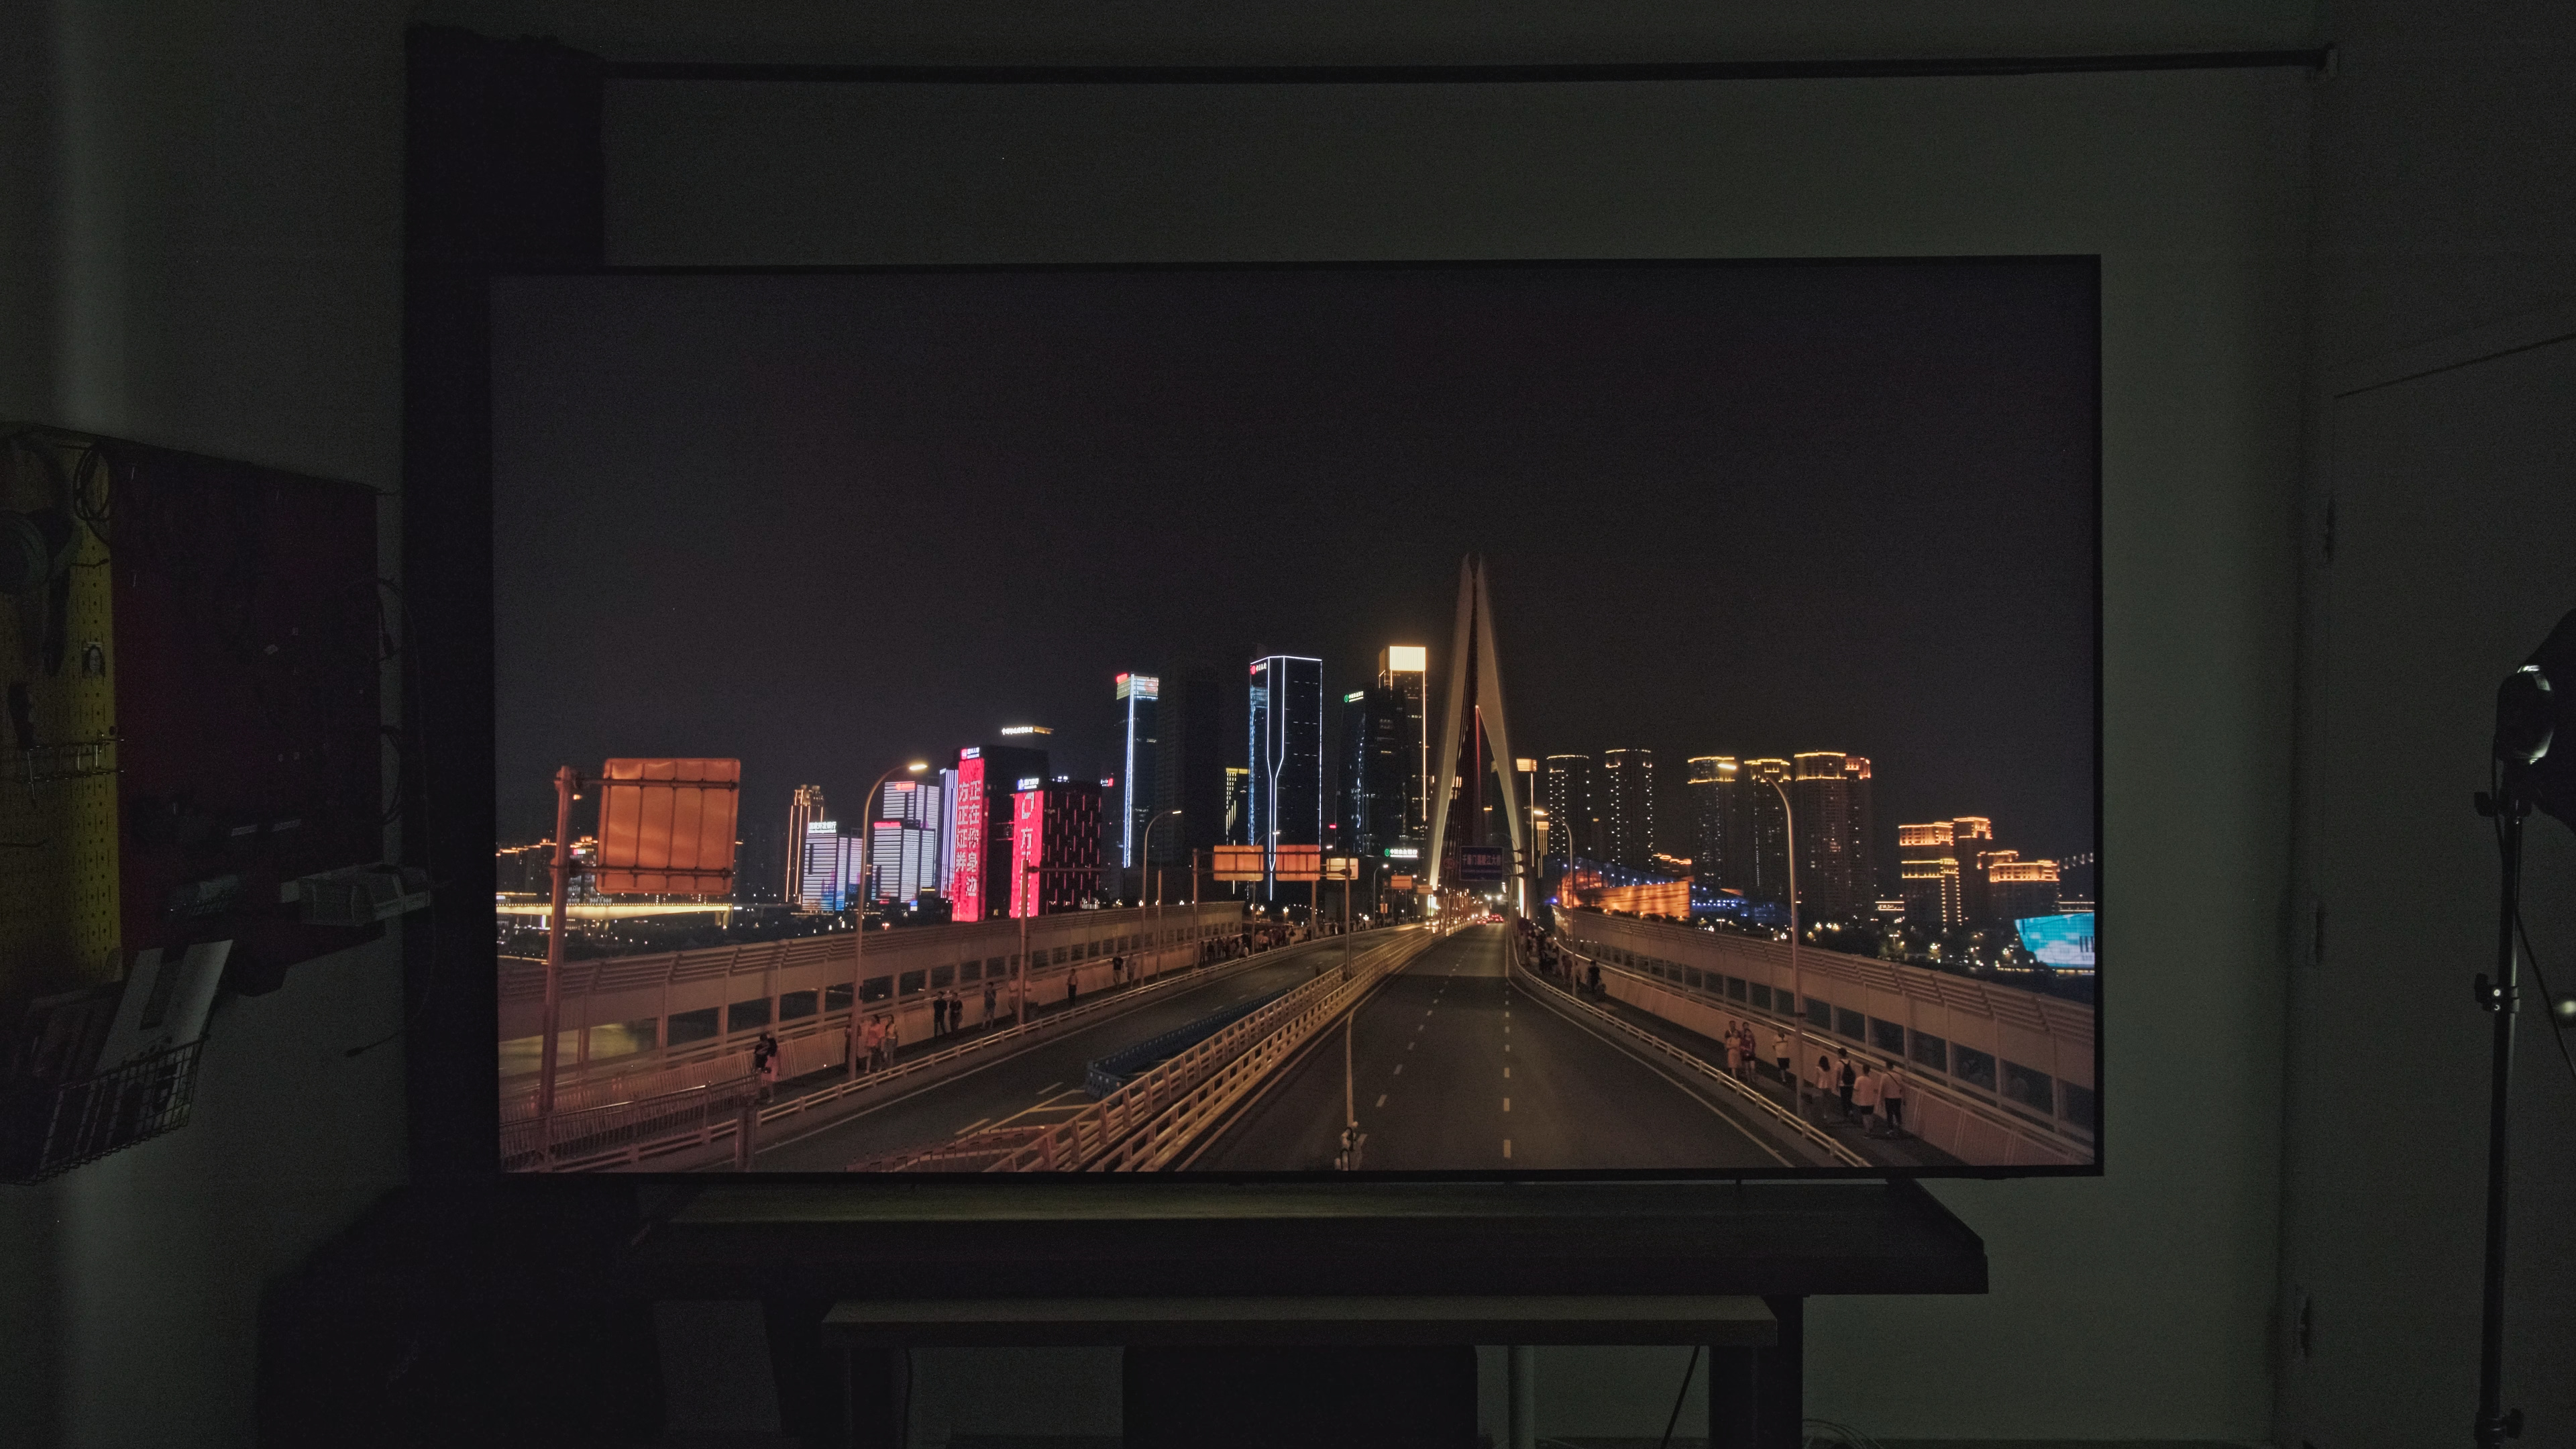
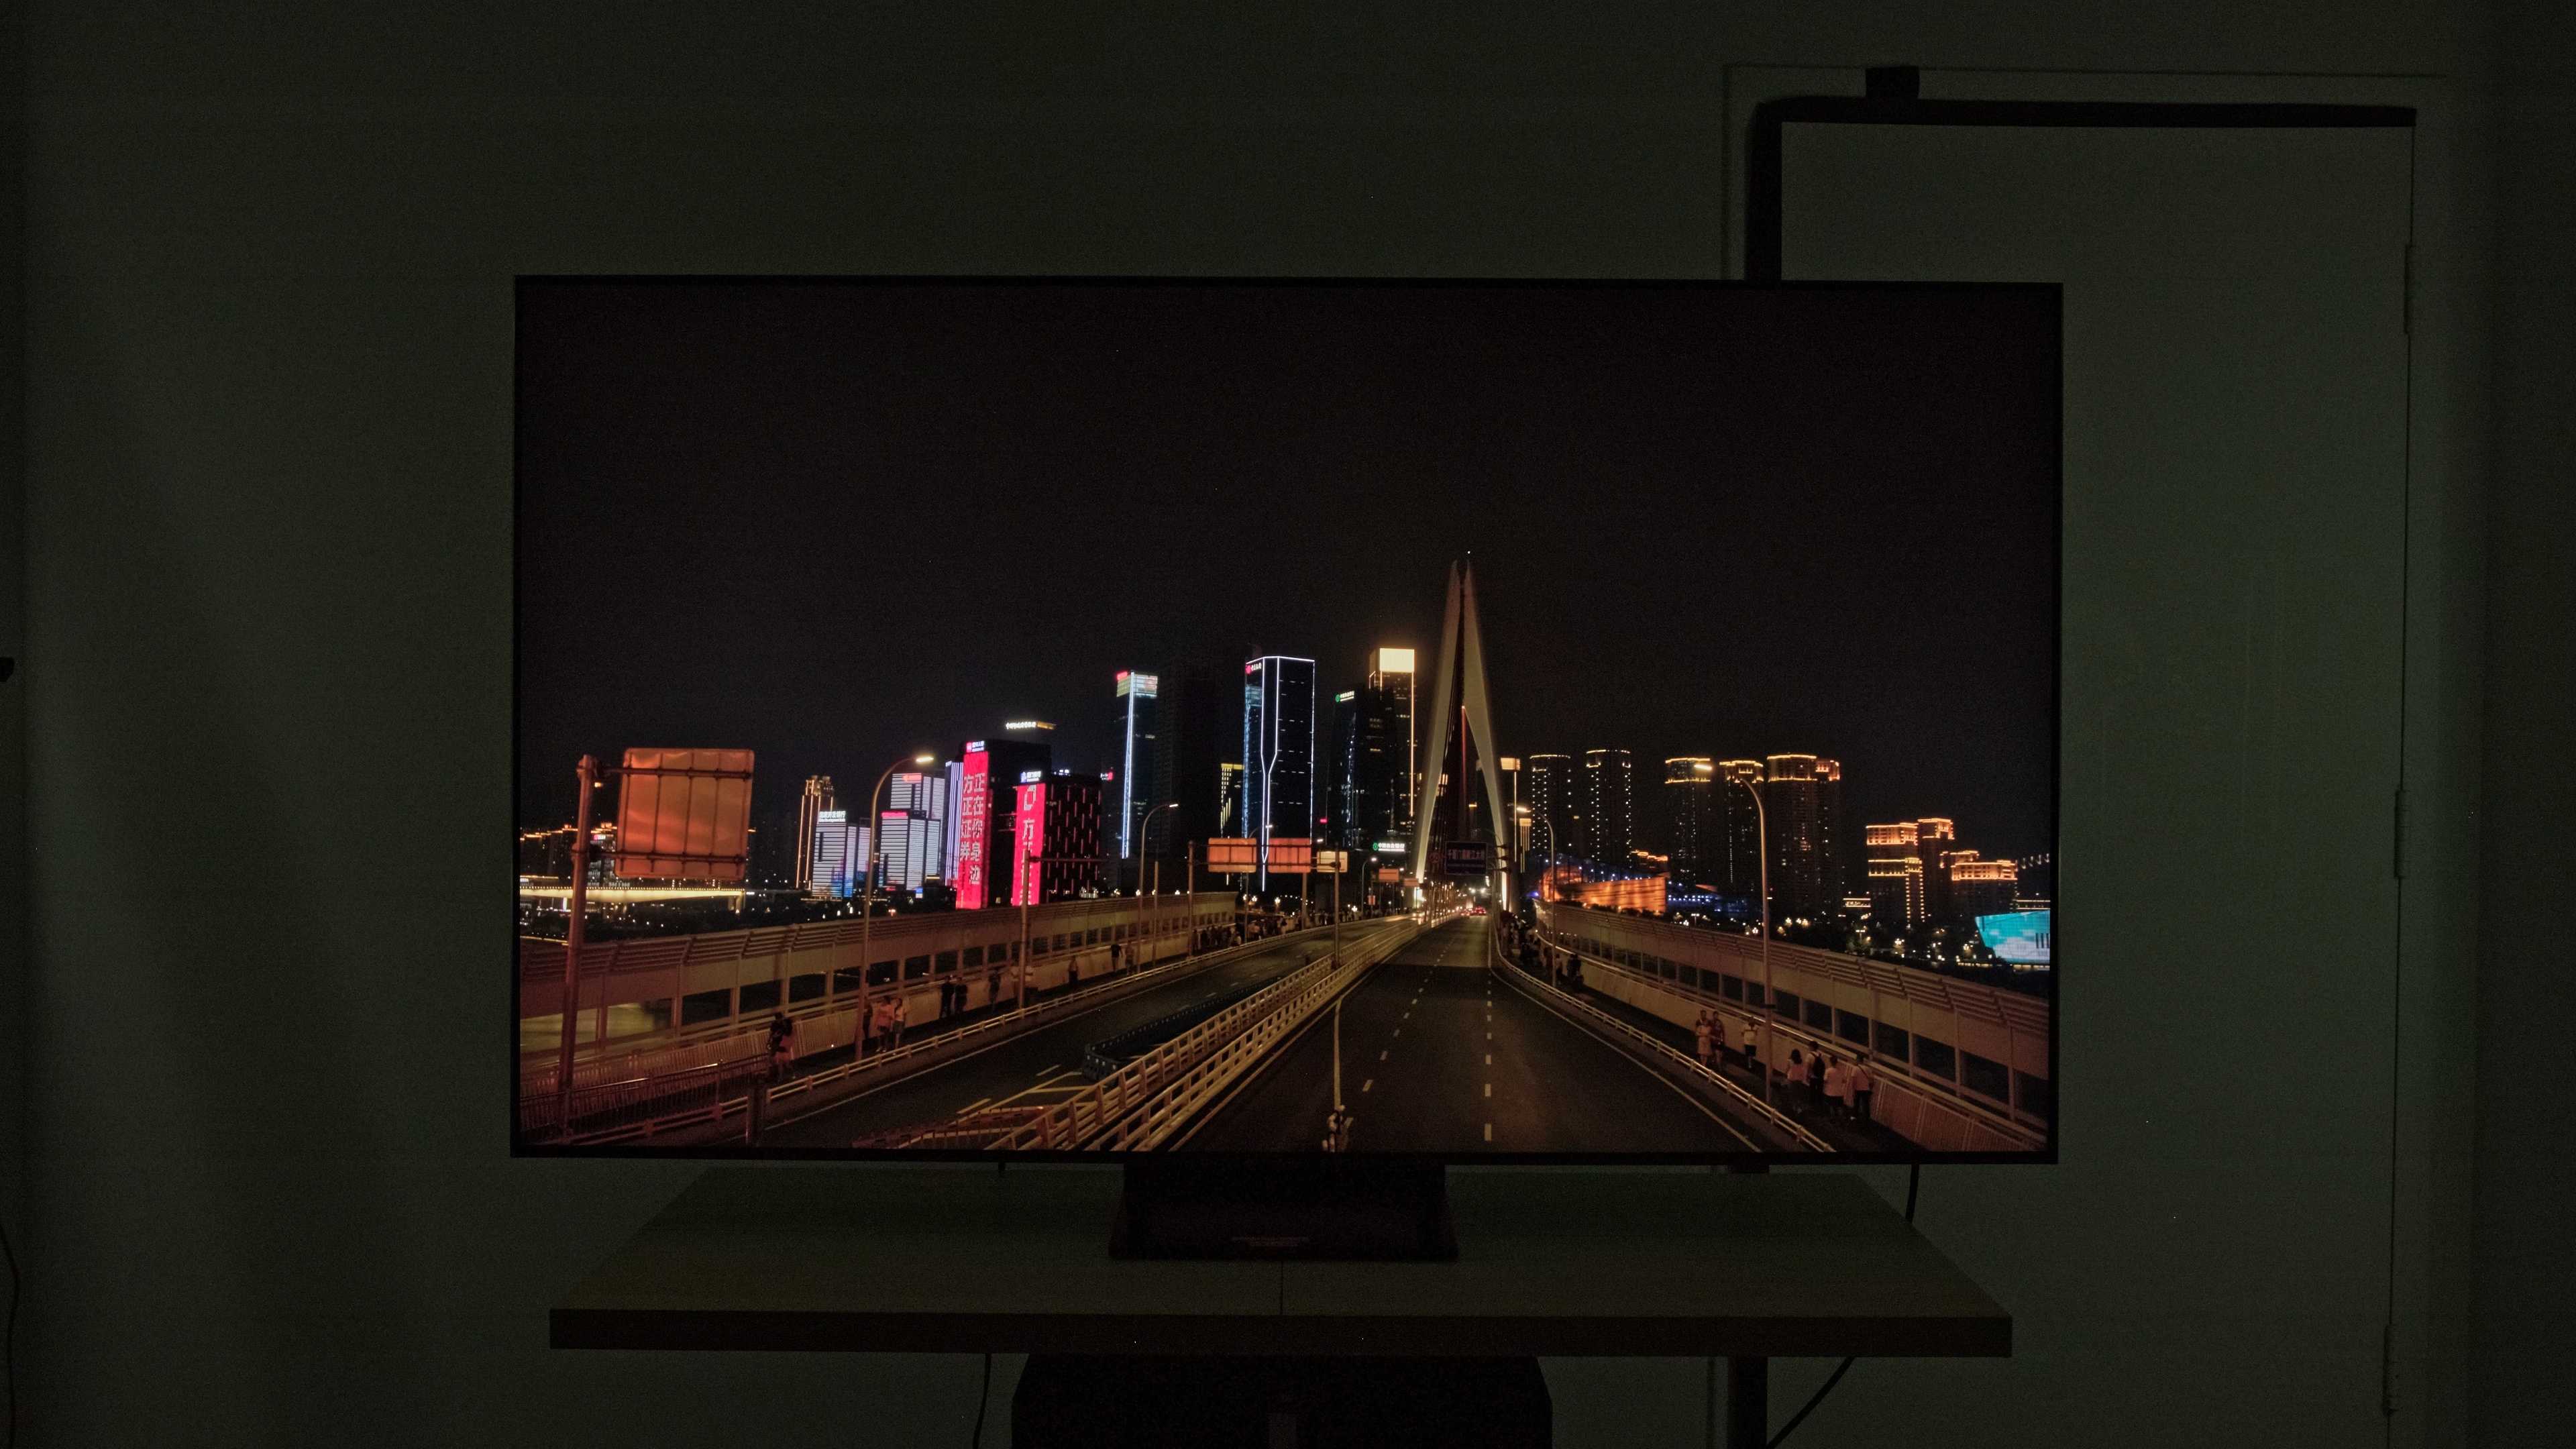
| Yellow Skyscraper (~700 cd/m²) | 806 | 506 | 300 | 59% |
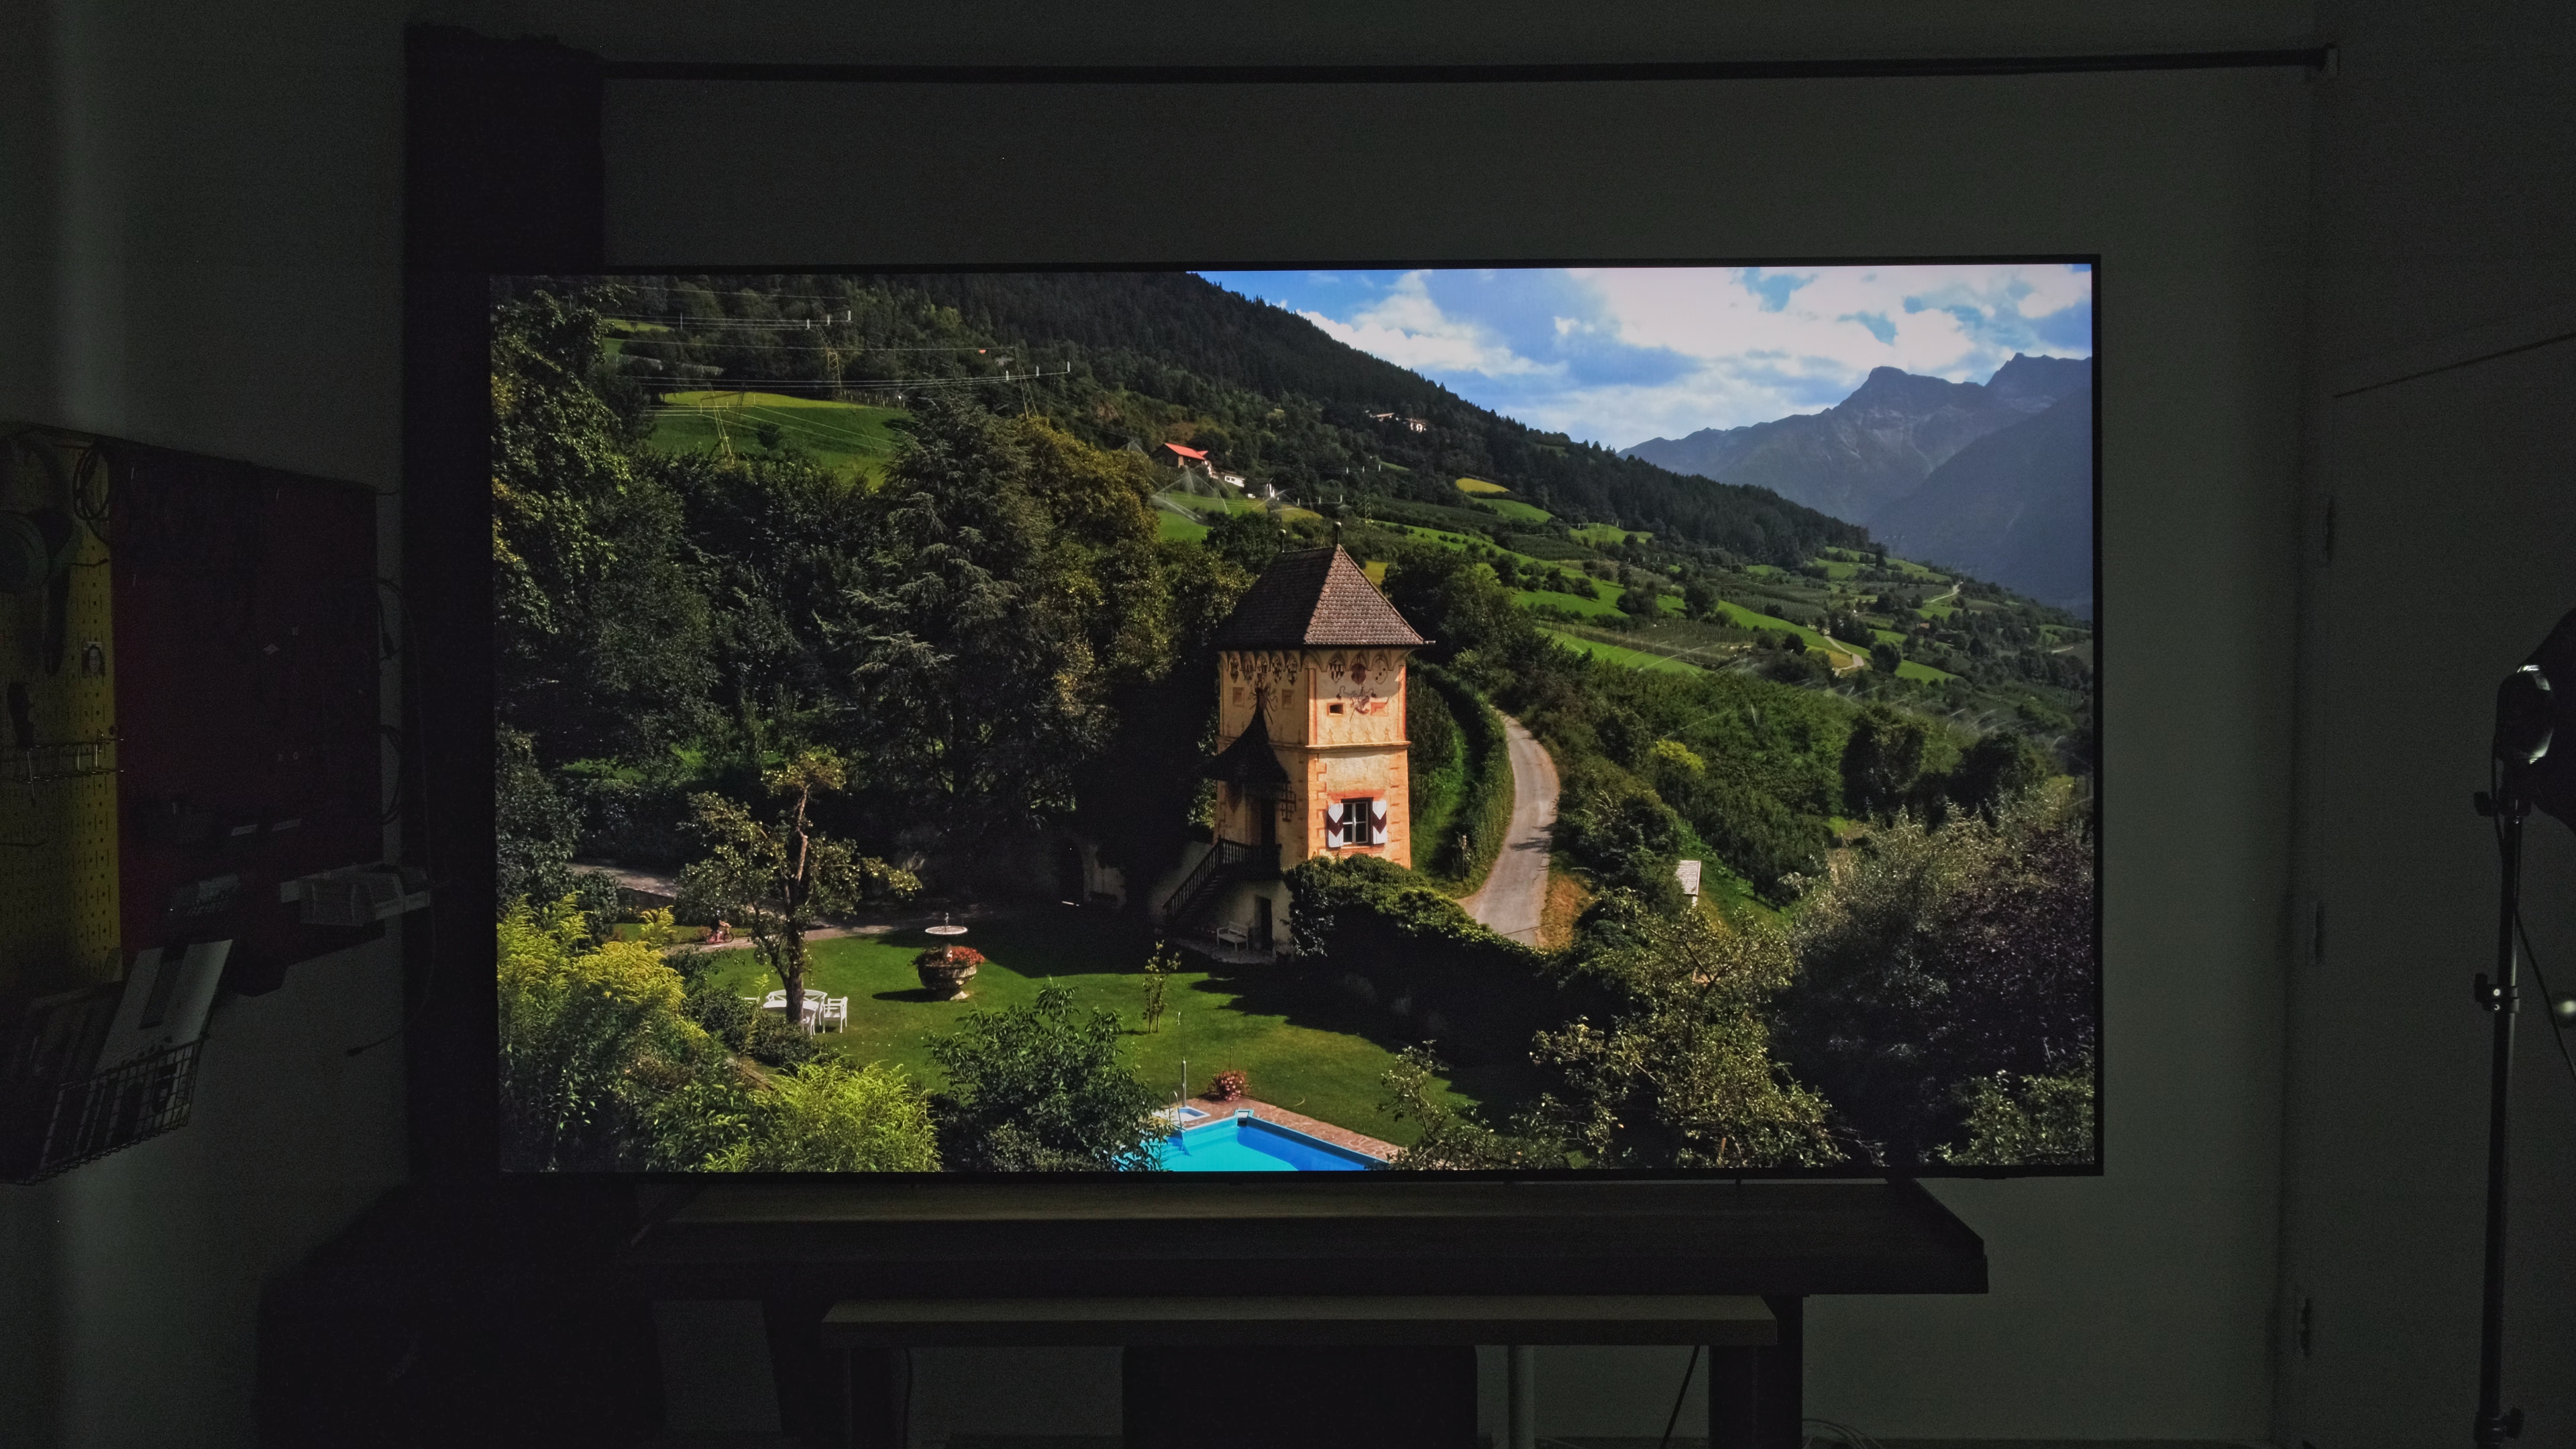
| Landscape Pool (~300 cd/m²) | 224 | 140 | 84 | 60% |
| Peak 2% Window | 1,205 | 972 | 233 | 24% |
| Peak 10% Window | 1,256 | 930 | 326 | 35% |
| Peak 25% Window | 1,047 | 791 | 256 | 32% |
| Peak 50% Window | 771 | 603 | 168 | 28% |
| Peak 100% Window | 702 | 561 | 141 | 25% |
| Sustained 2% Window | 1,180 | 937 | 243 | 26% |
| Sustained 10% Window | 1,243 | 912 | 331 | 36% |
| Sustained 25% Window | 1,042 | 785 | 257 | 33% |
| Sustained 50% Window | 769 | 601 | 168 | 28% |
| Sustained 100% Window | 701 | 560 | 141 | 25% |
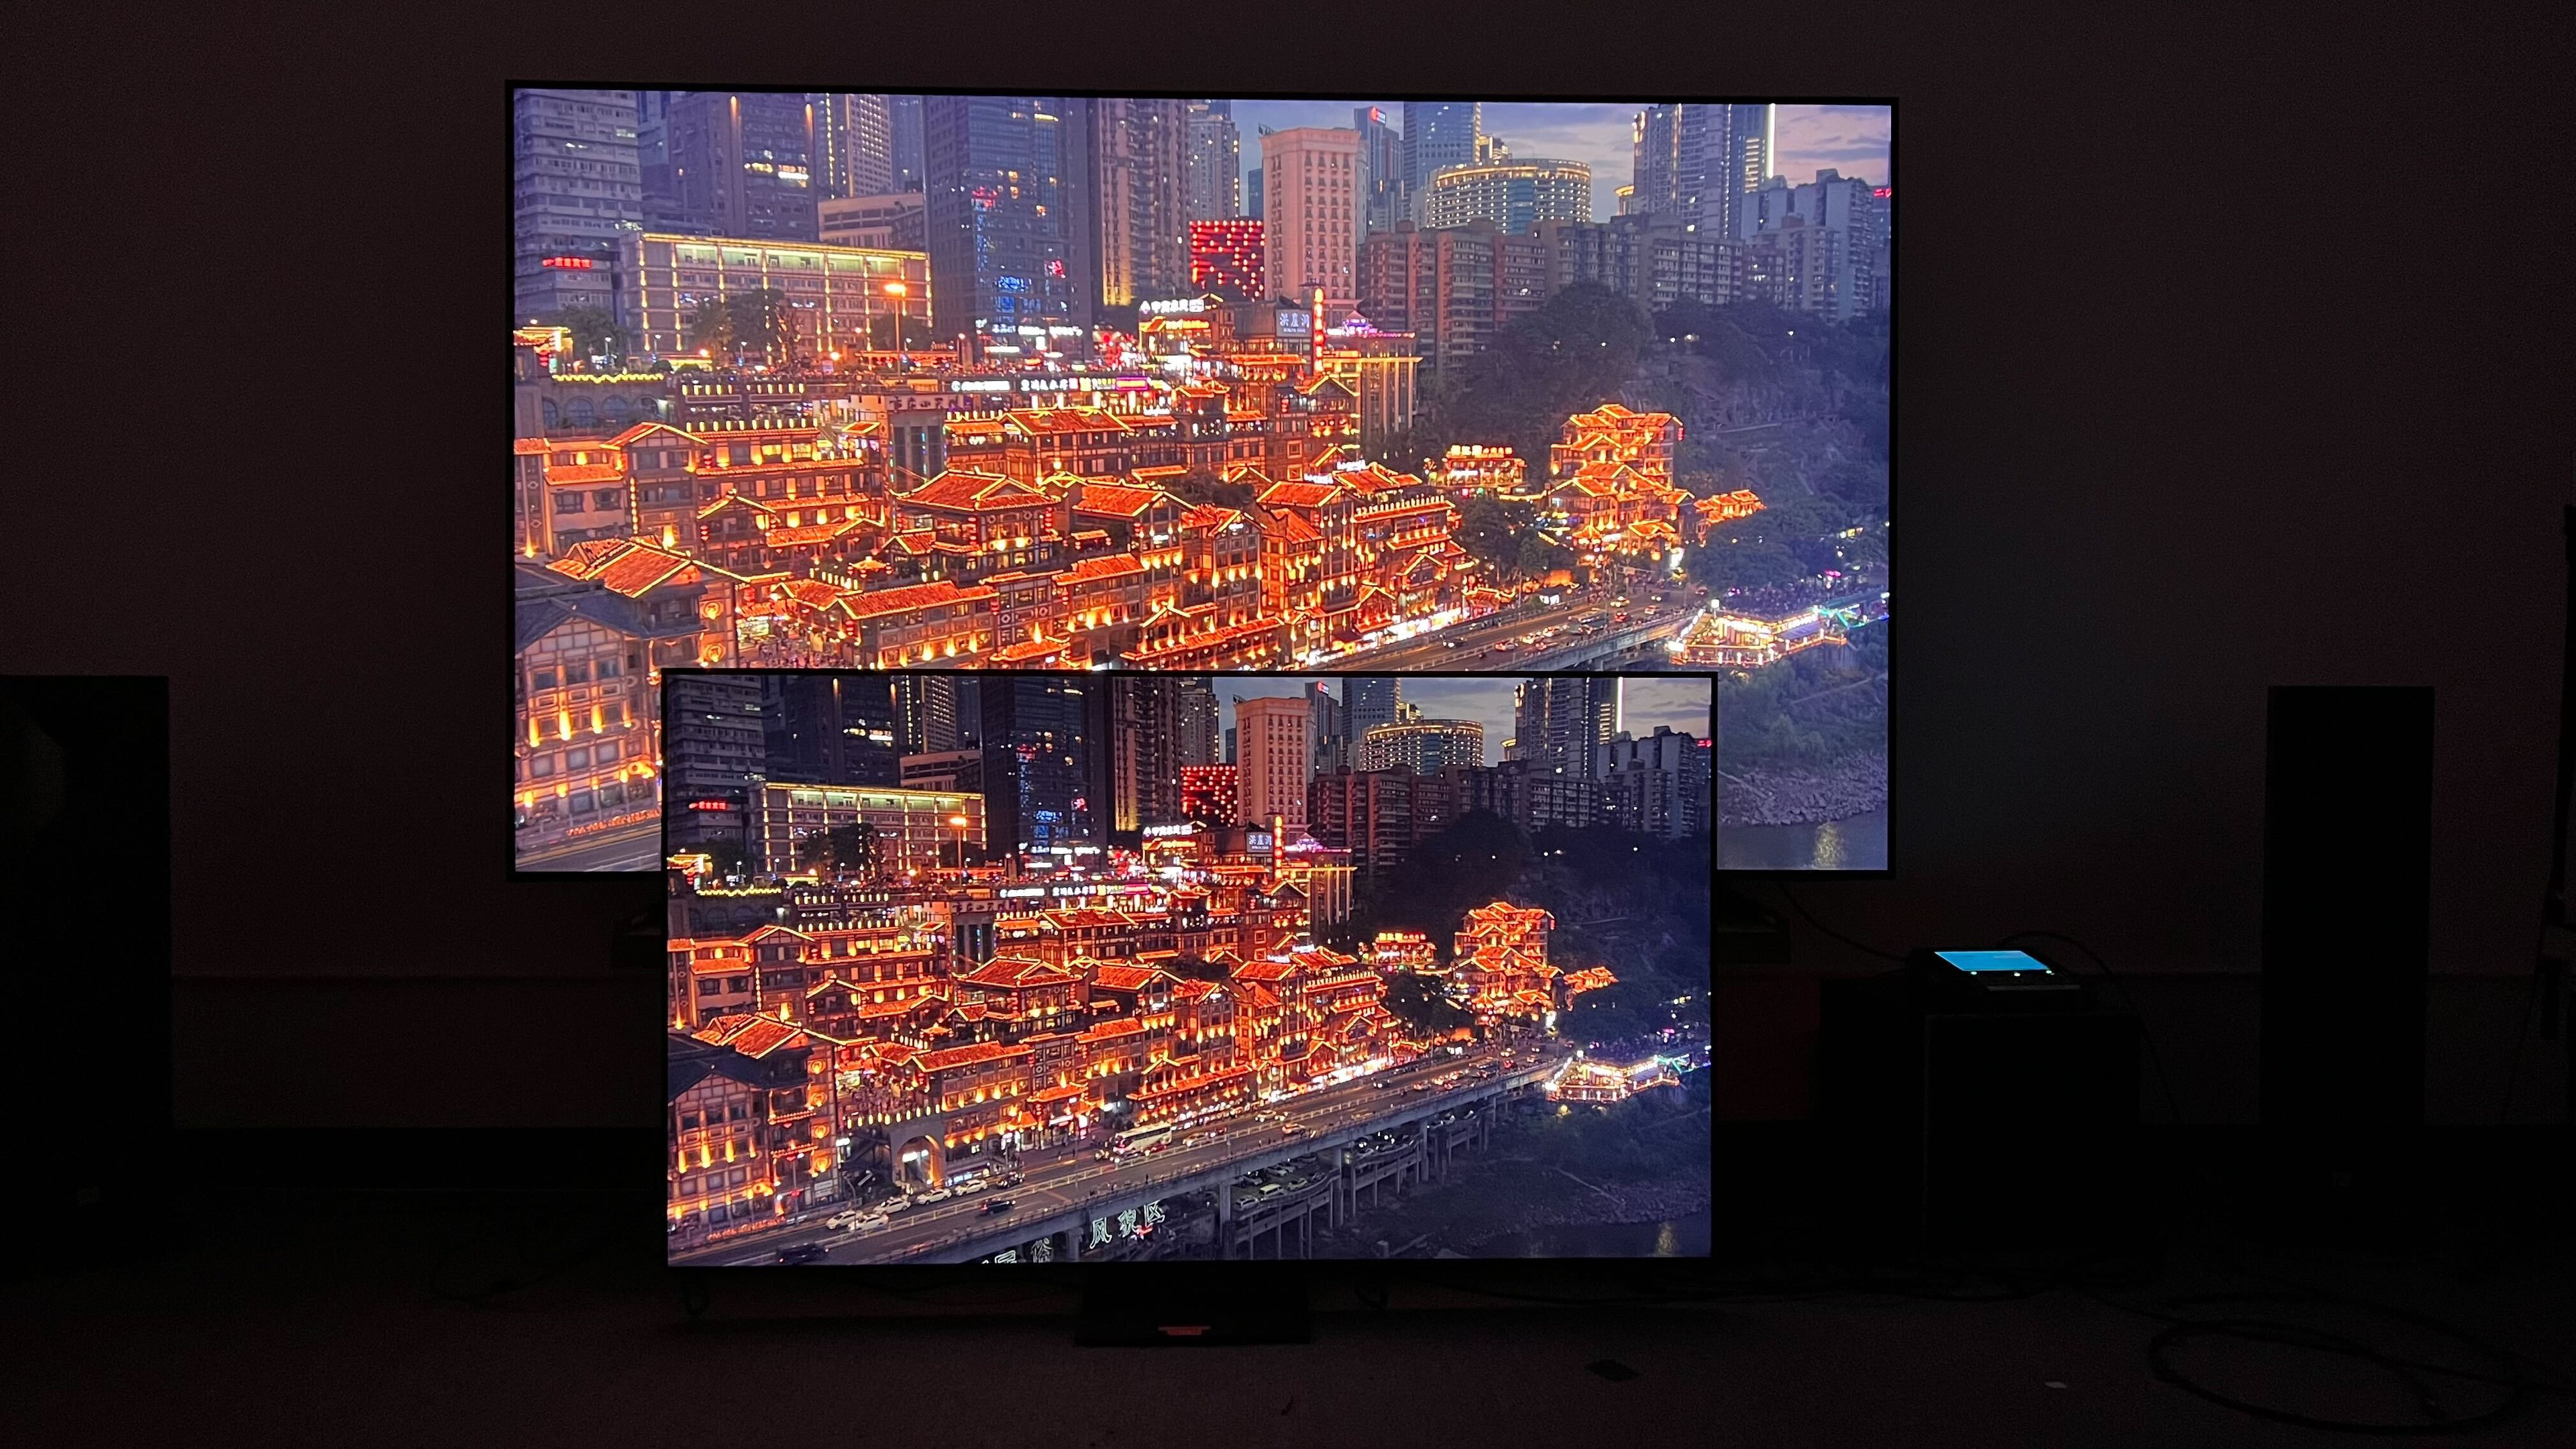
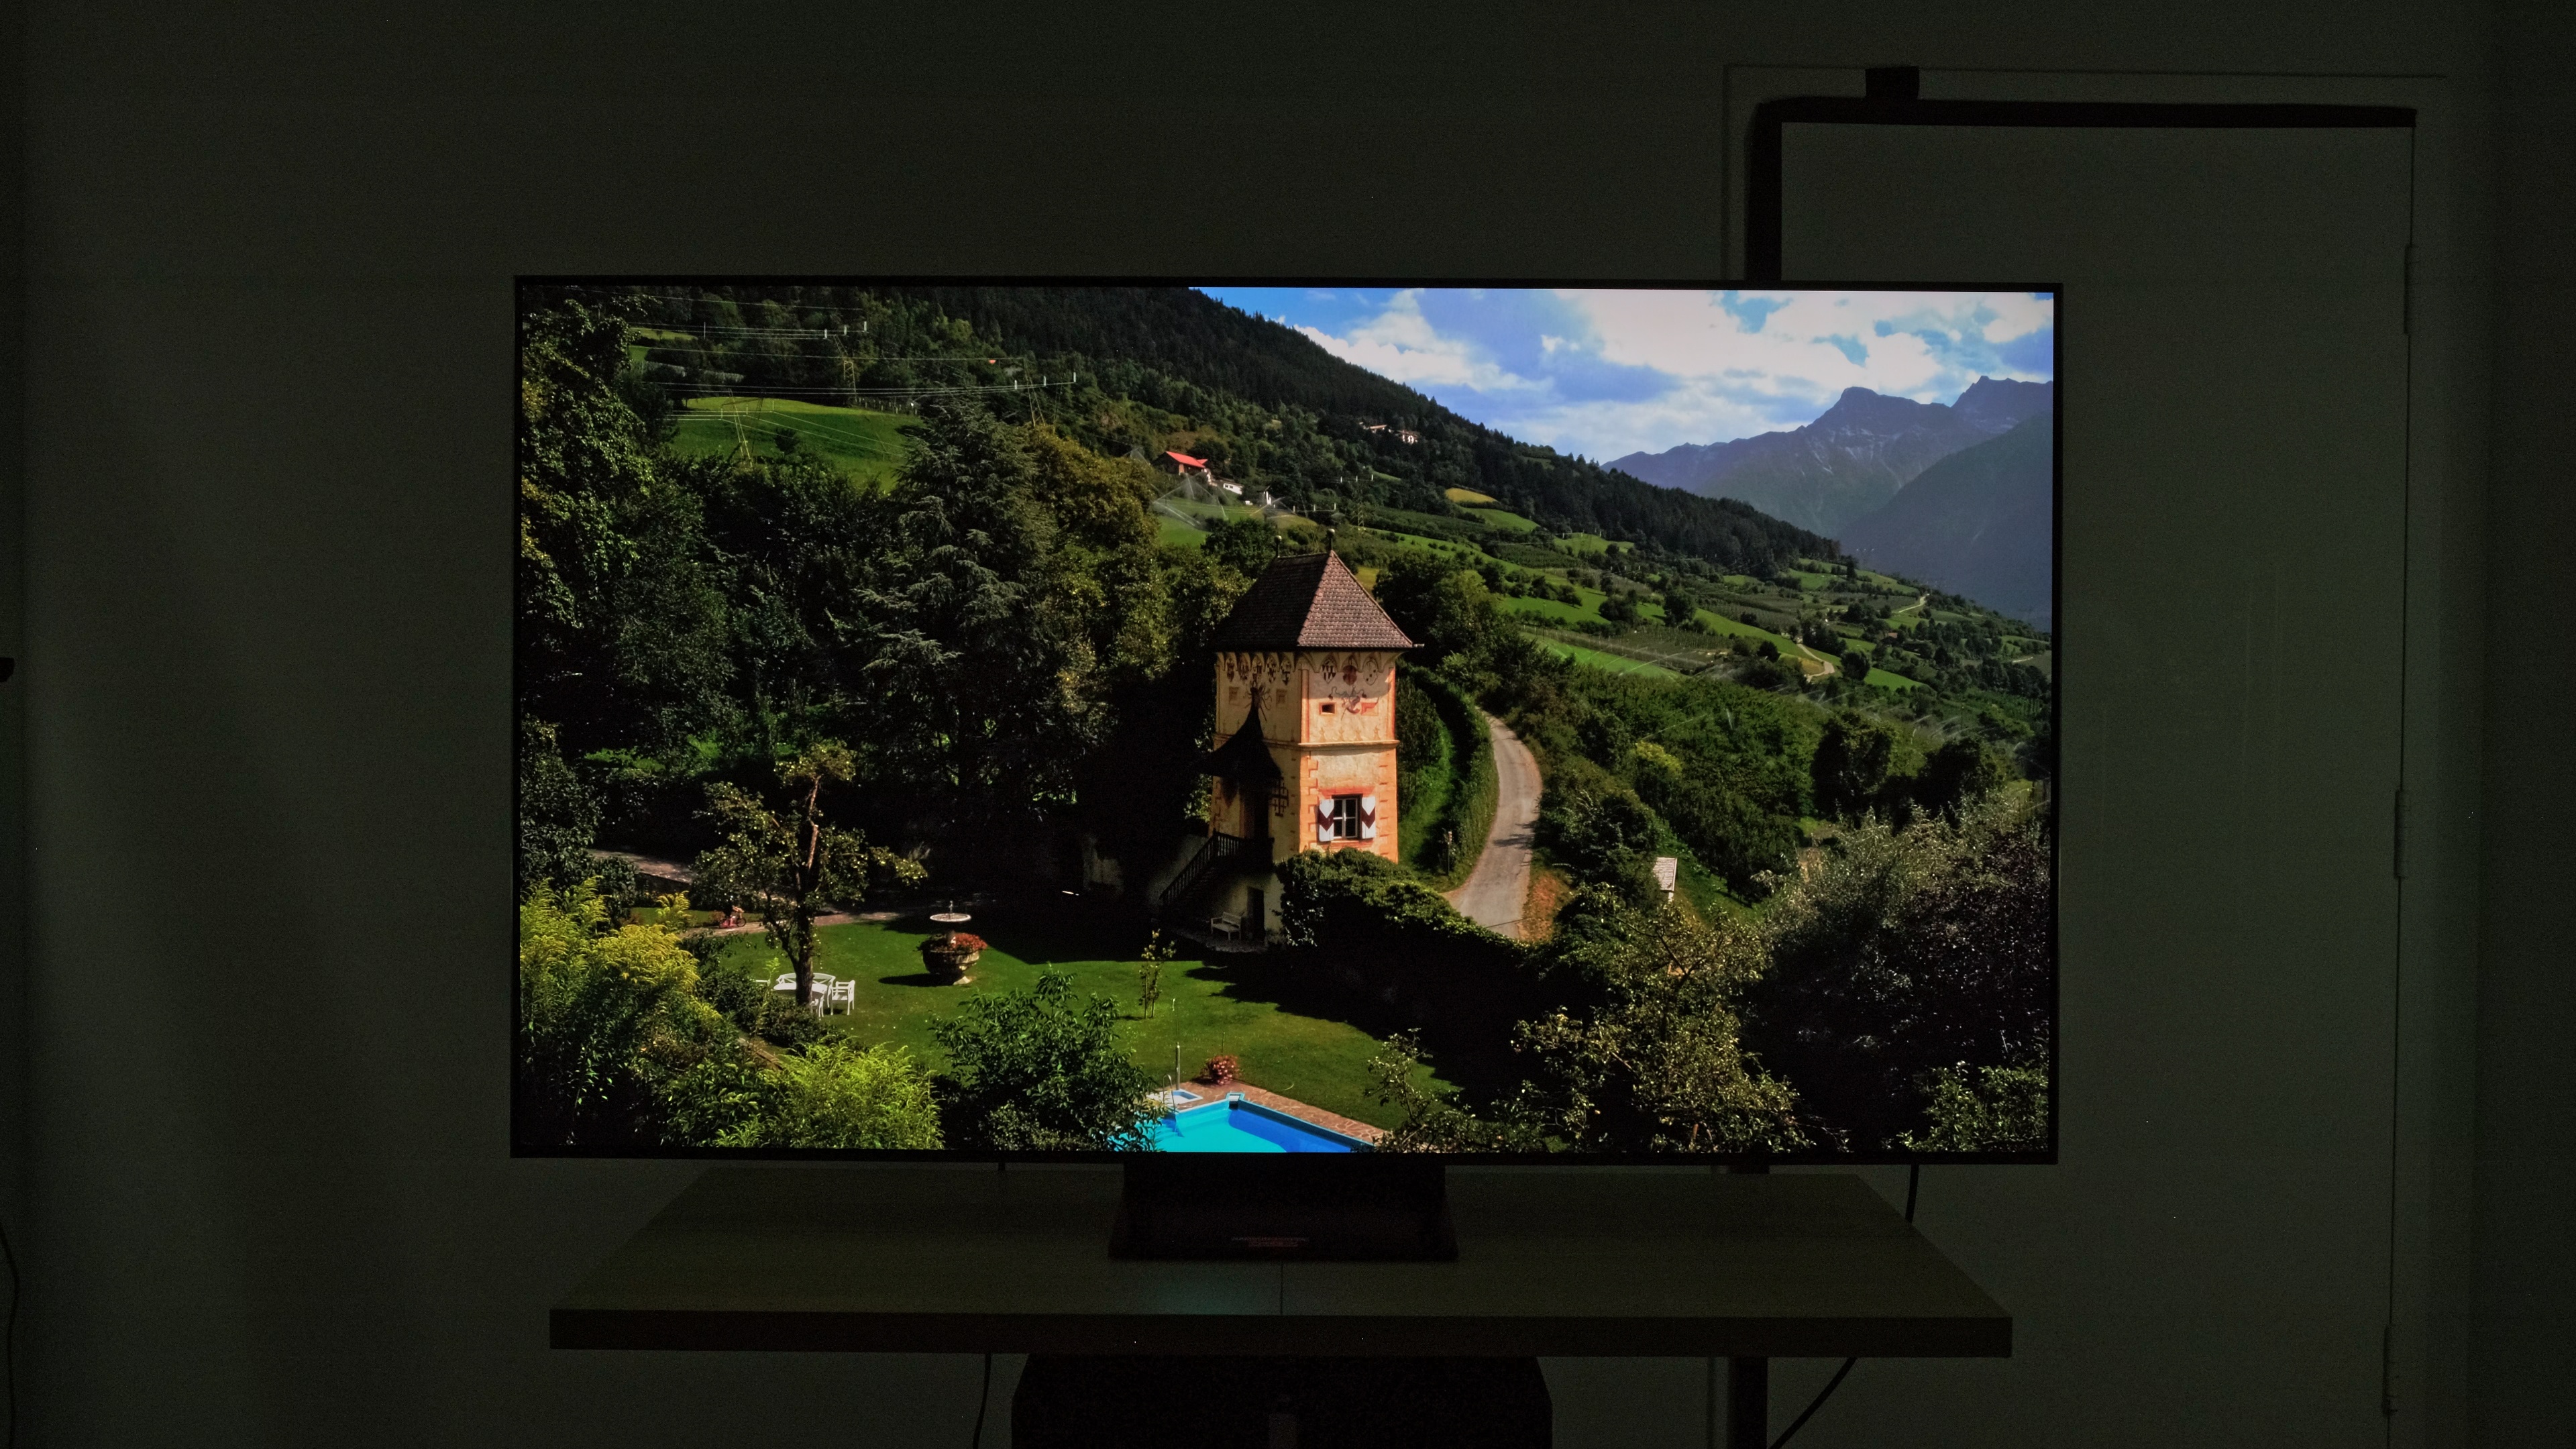
HDR brightness measures how bright a TV can get when displaying HDR content. Higher peak brightness produces brighter highlights that stand out more effectively. As you can see, the 100-inch version of this TV is about 30% brighter than the smaller model on average with test slides, but that difference is even more significant with most real content. Overall, this results in a far more vibrant HDR experience, with brighter highlights and more vivid bright scenes.
Contrast
| Samsung 100QN80F | Samsung 65QN80F |
|---|---|
 Native Contrast 7,009 : 1 |
 Native Contrast 6,611 : 1 |
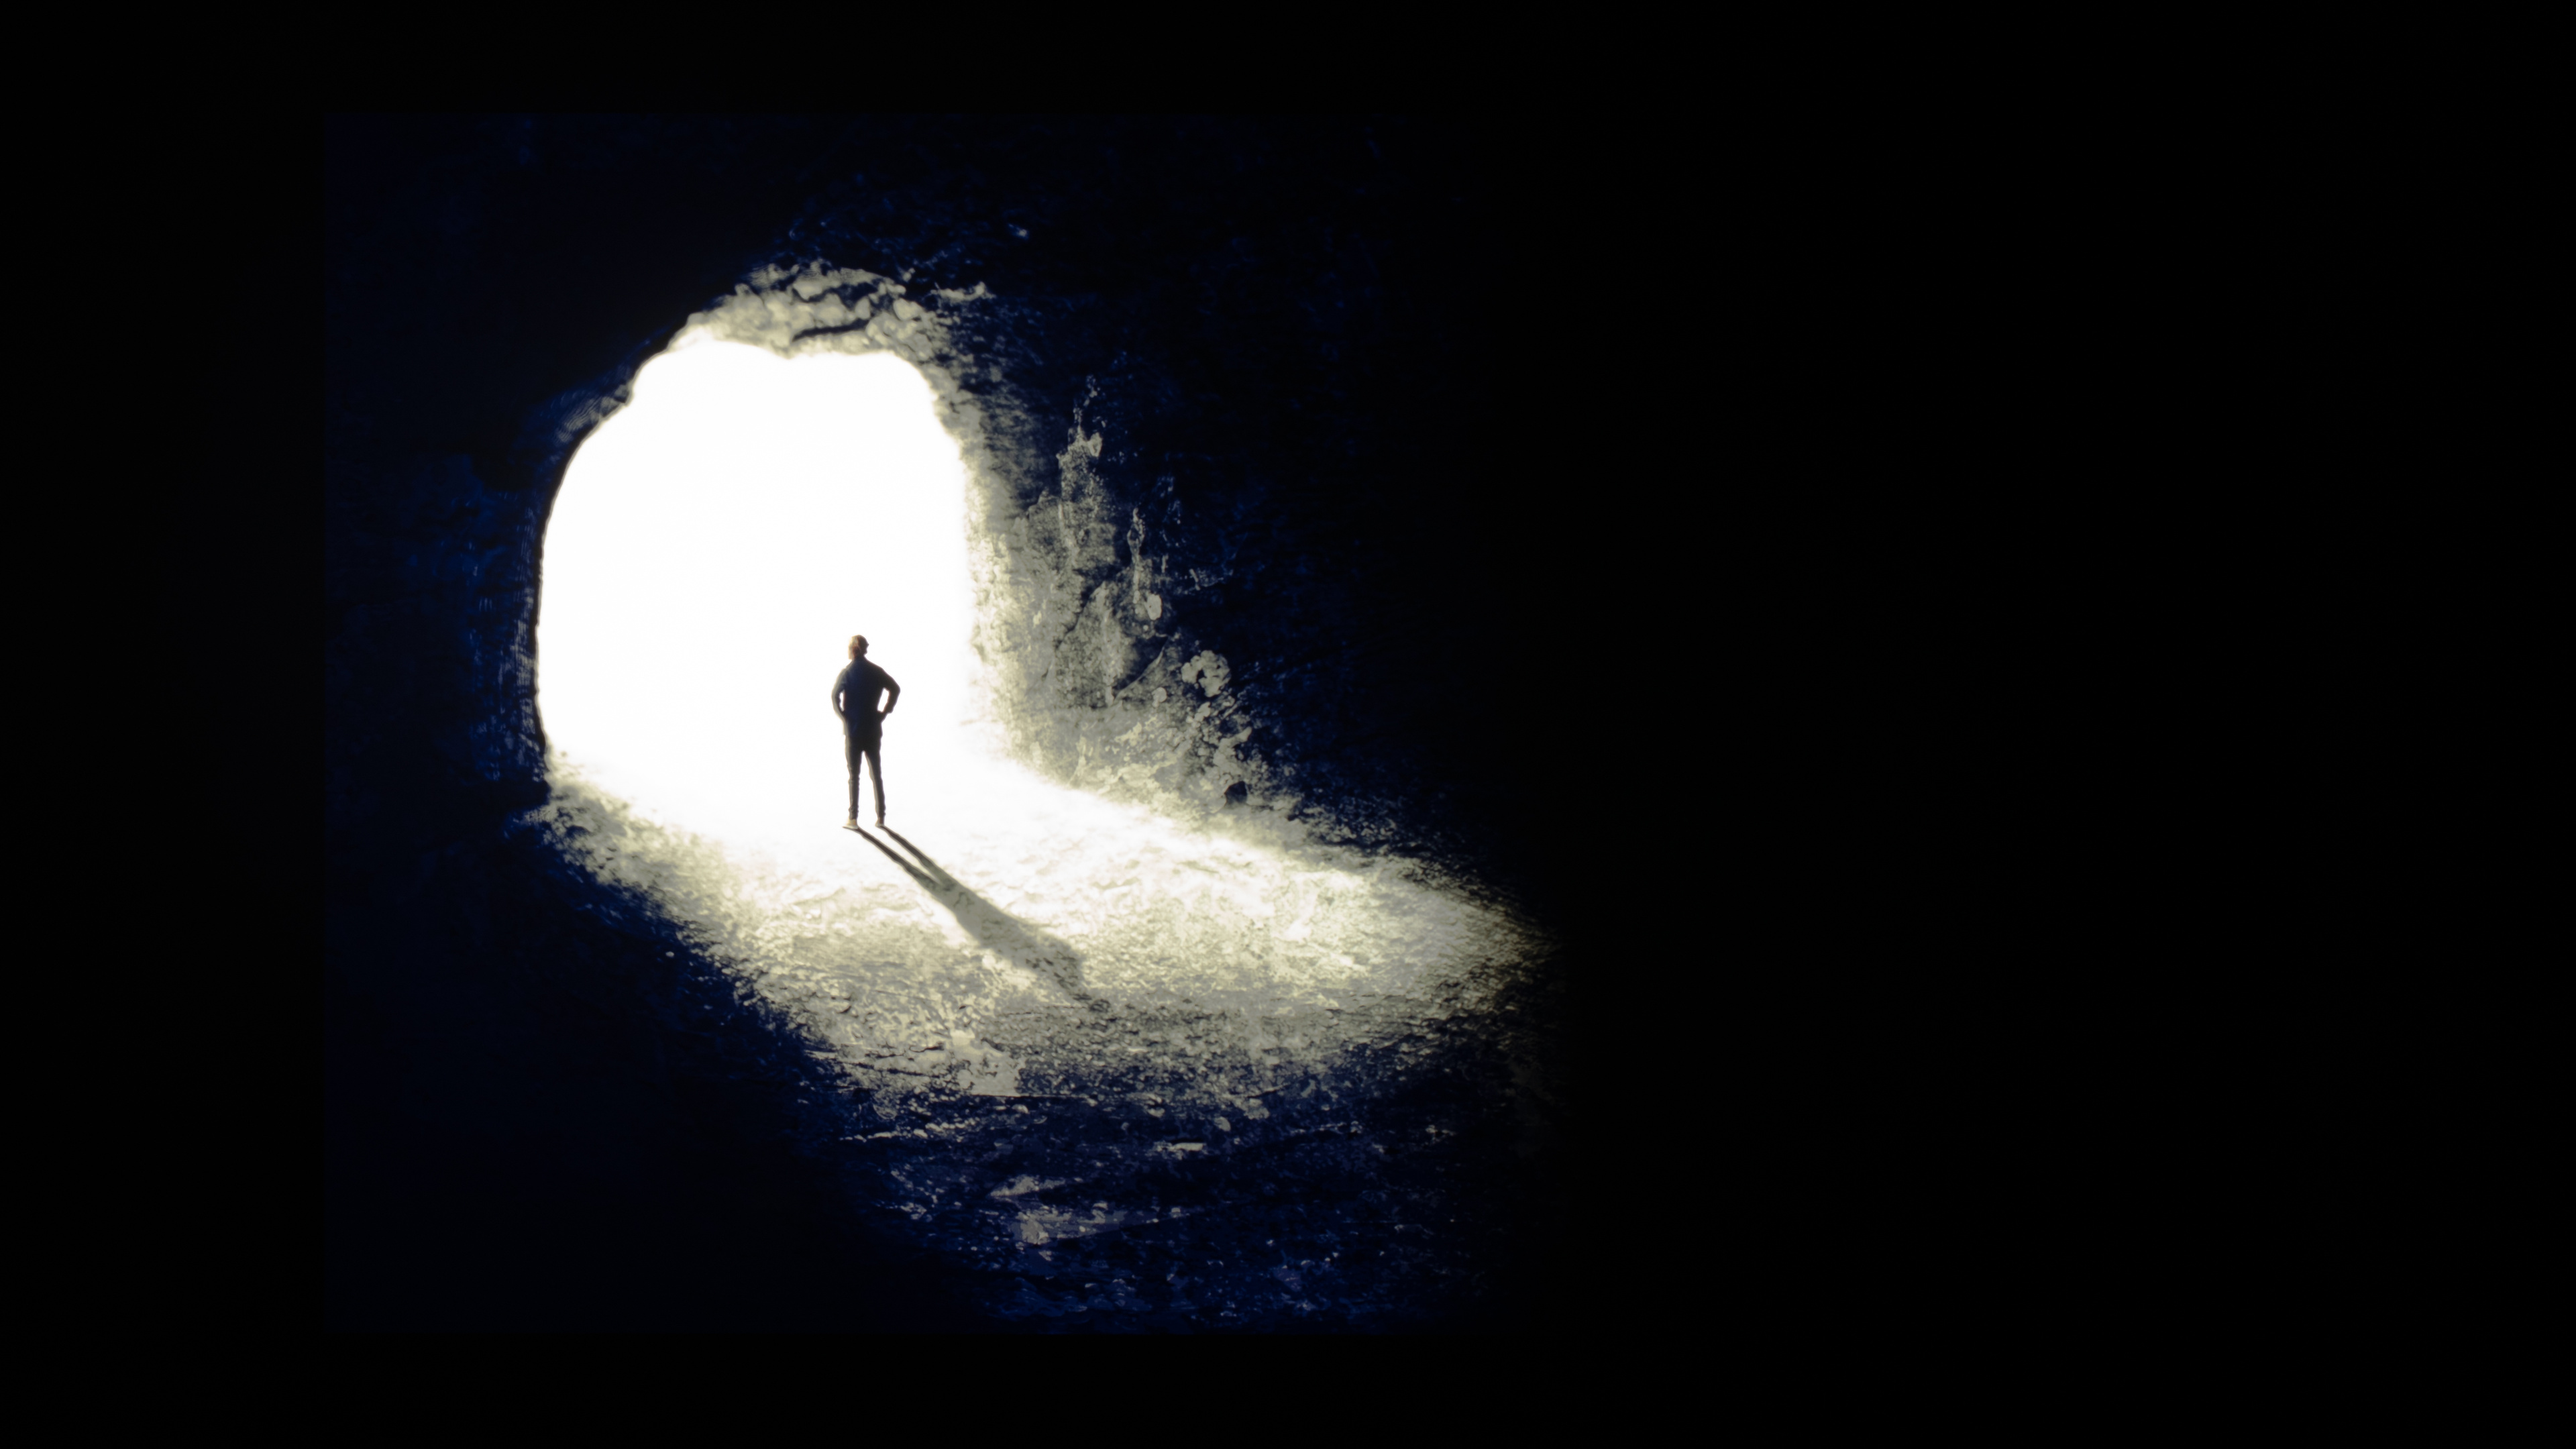
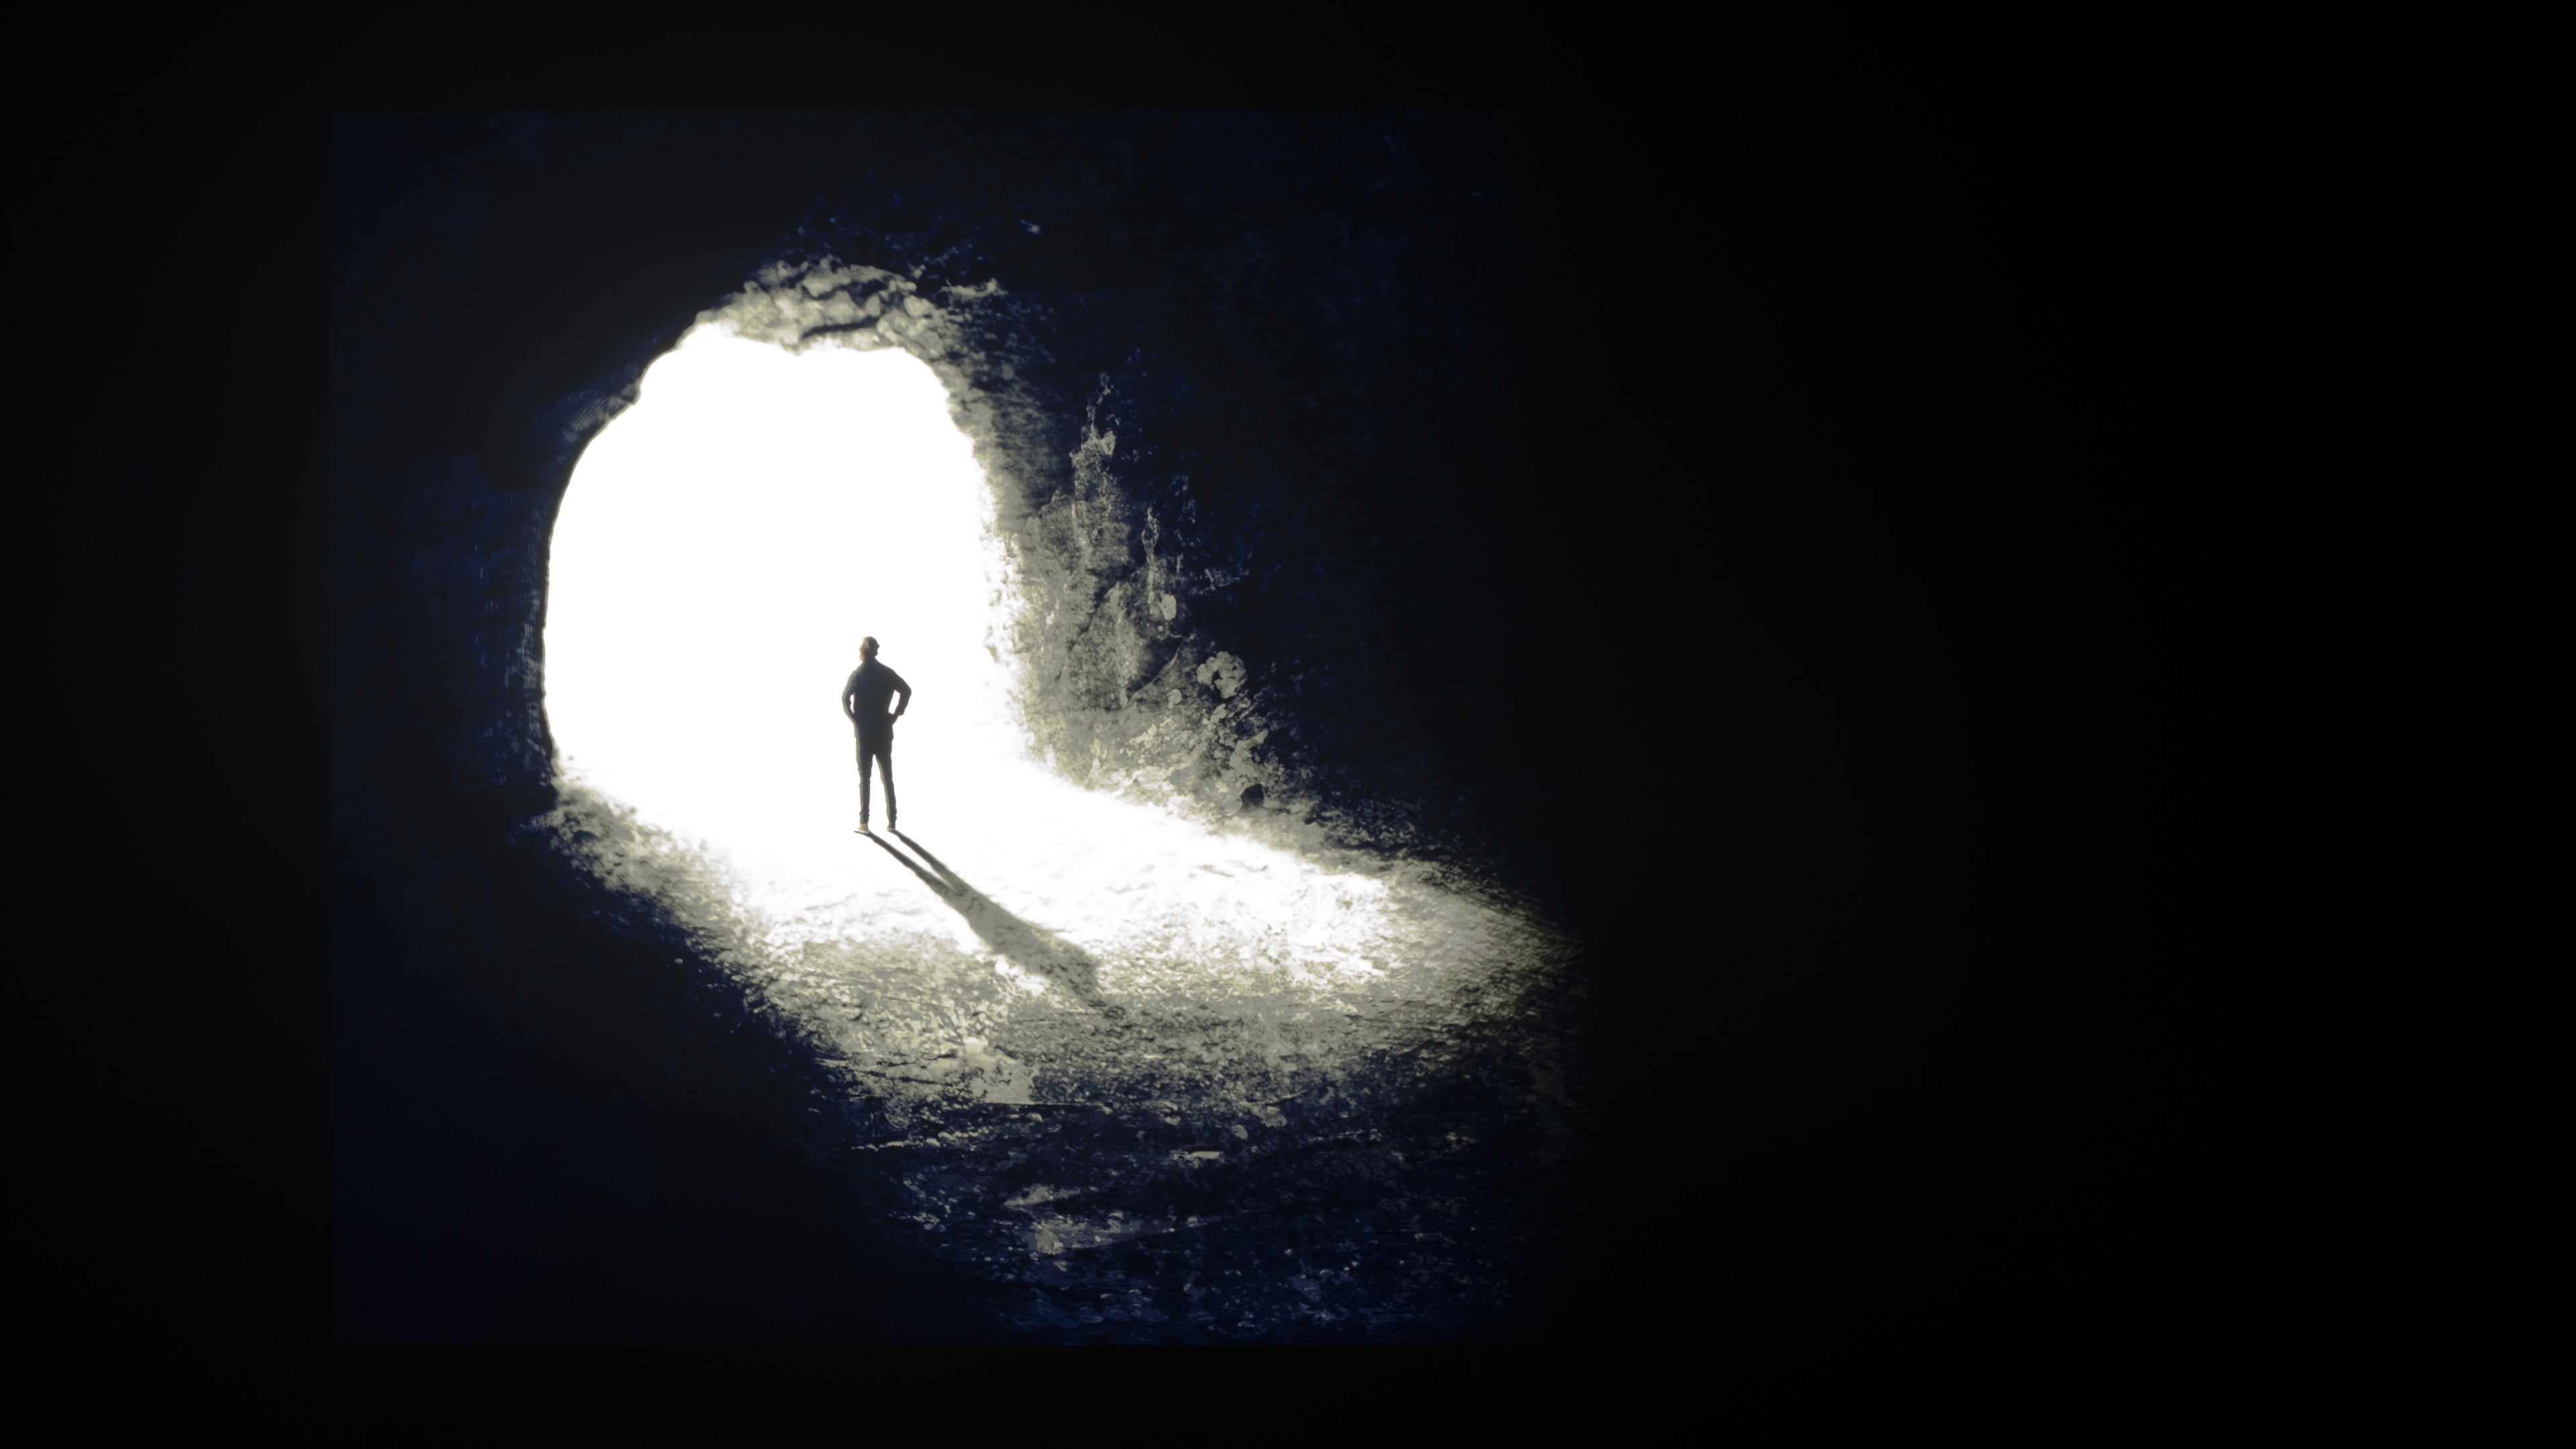
A display's contrast ratio shows the ratio between the darkest black a display can produce and the luminance of the brightest white. The higher the contrast ratio, the deeper the blacks appear while simultaneously highlighting bright elements. Our contrast test is conducted with the center of the cave set as close to 200 nits as possible, which gives us the white luminance measurement for our calculation. The lowest black reading we obtain is based on an average of four measurements. If you want to learn more about the specific way we measure contrast, check out our in-depth Contrast Ratio article. Let's examine the numbers we measured for each size.
| TV Size | White Level (nits) | Lowest Average Black Level (nits) | Contrast Ratio |
|---|---|---|---|
| 65" | 191.3 | 0.004 | 47,825 : 1 |
| 100" | 205.8 | 0.00875 | 23,520 : 1 |
Unfortunately, the 100-inch model has noticeably worse contrast. The lowest average black level is more than twice that of the 65-inch model. What's interesting here is that the native contrast of the panel itself is actually slightly higher on the 100-inch, but the local dimming feature isn't as effective at reducing black levels. The reason behind that likely has to do with the number and size of the local dimming zones, which we'll explore in the next section.
Dimming Zone Precision
| Samsung 100QN80F | Samsung 65QN80F |
|---|---|
 |
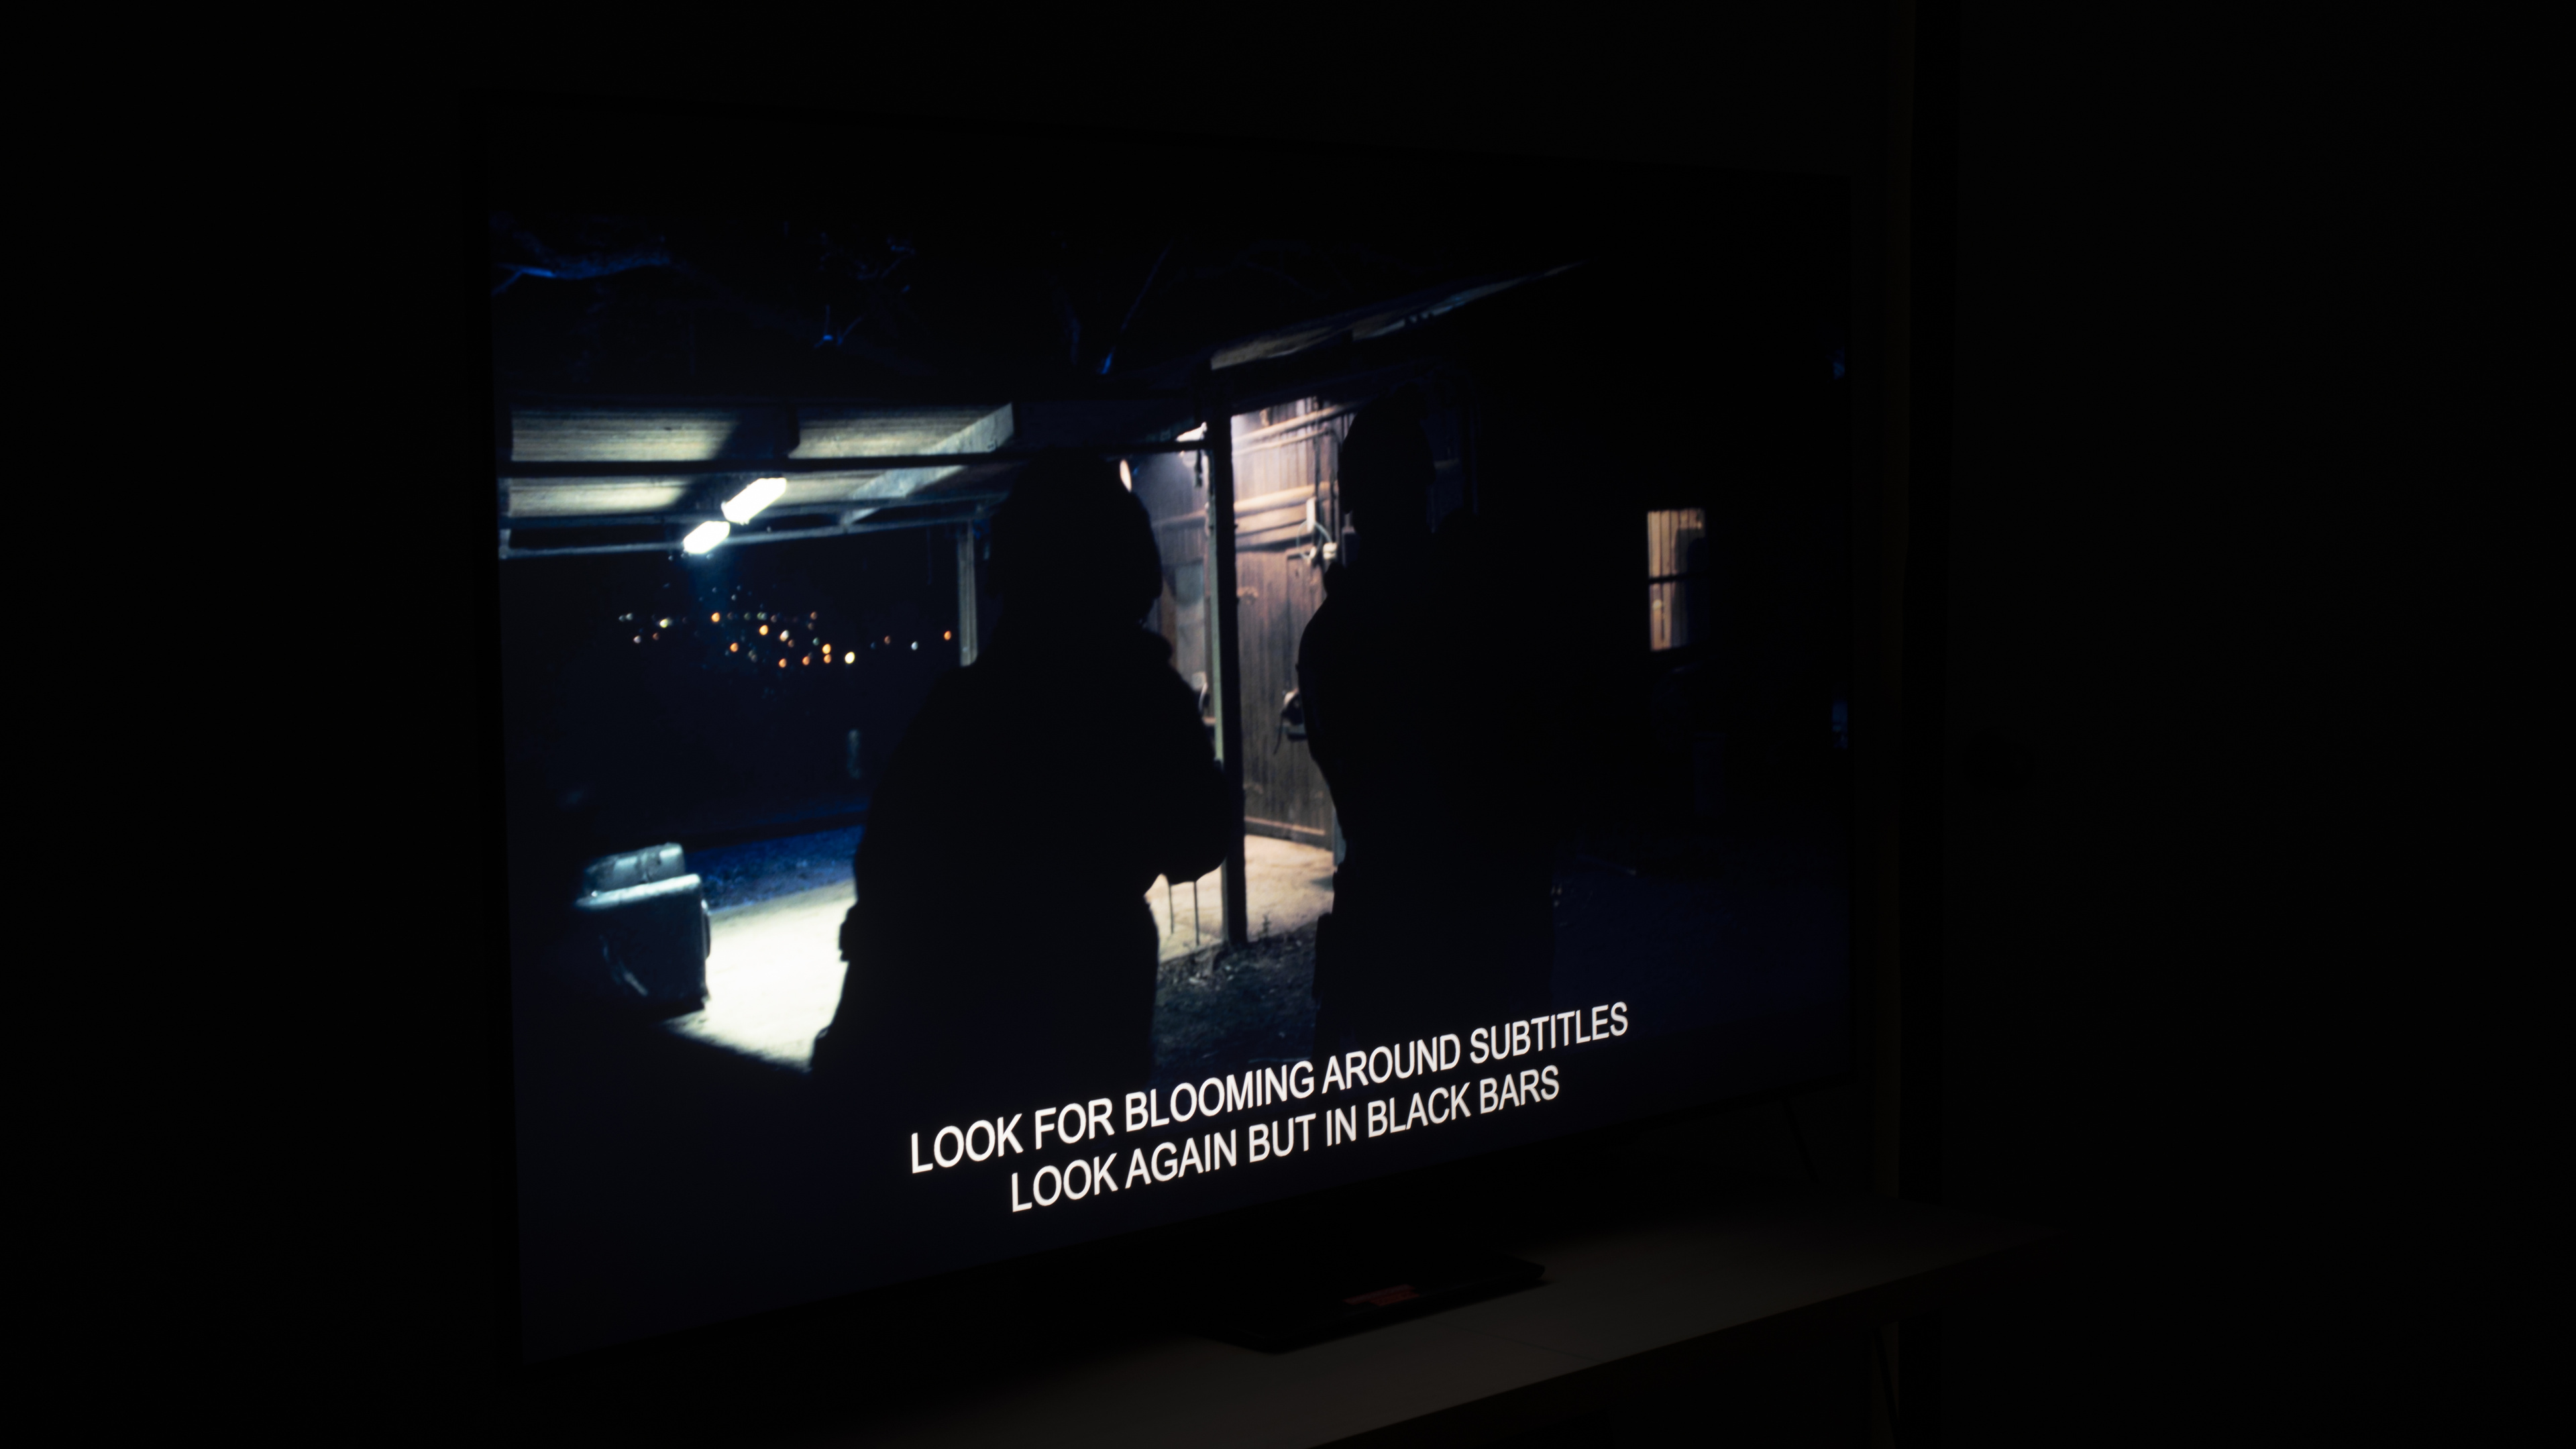 |
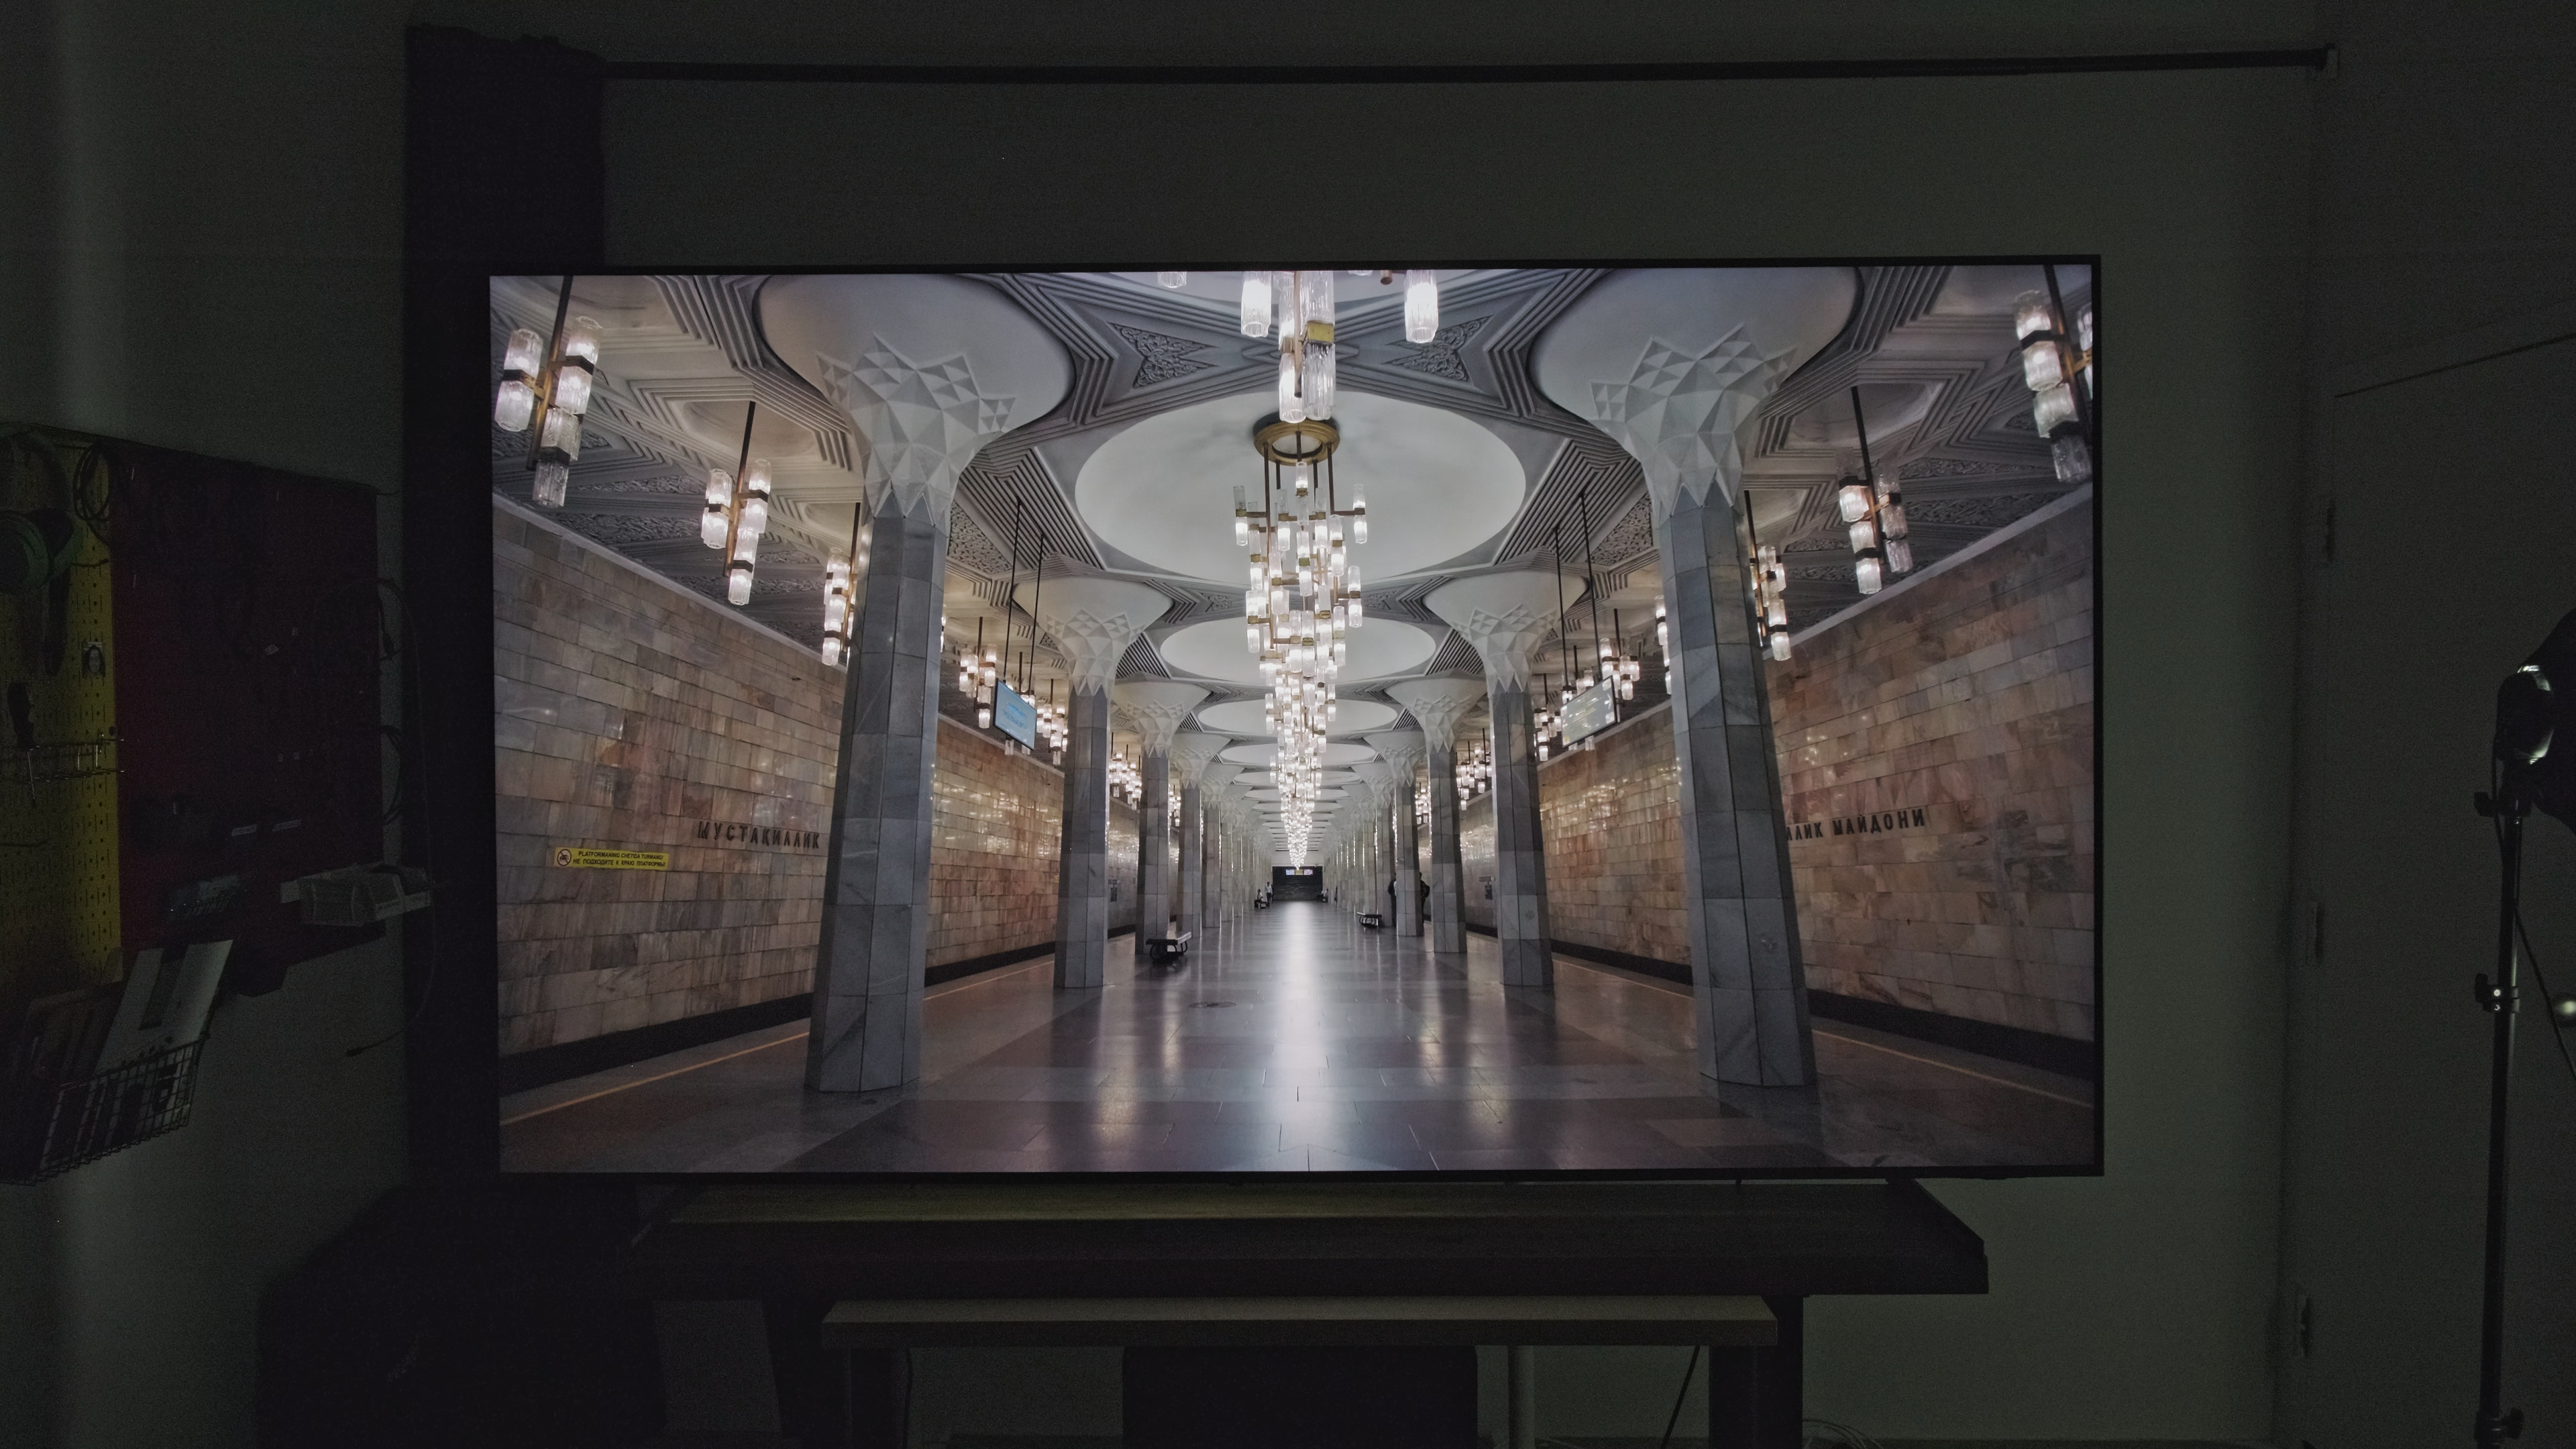
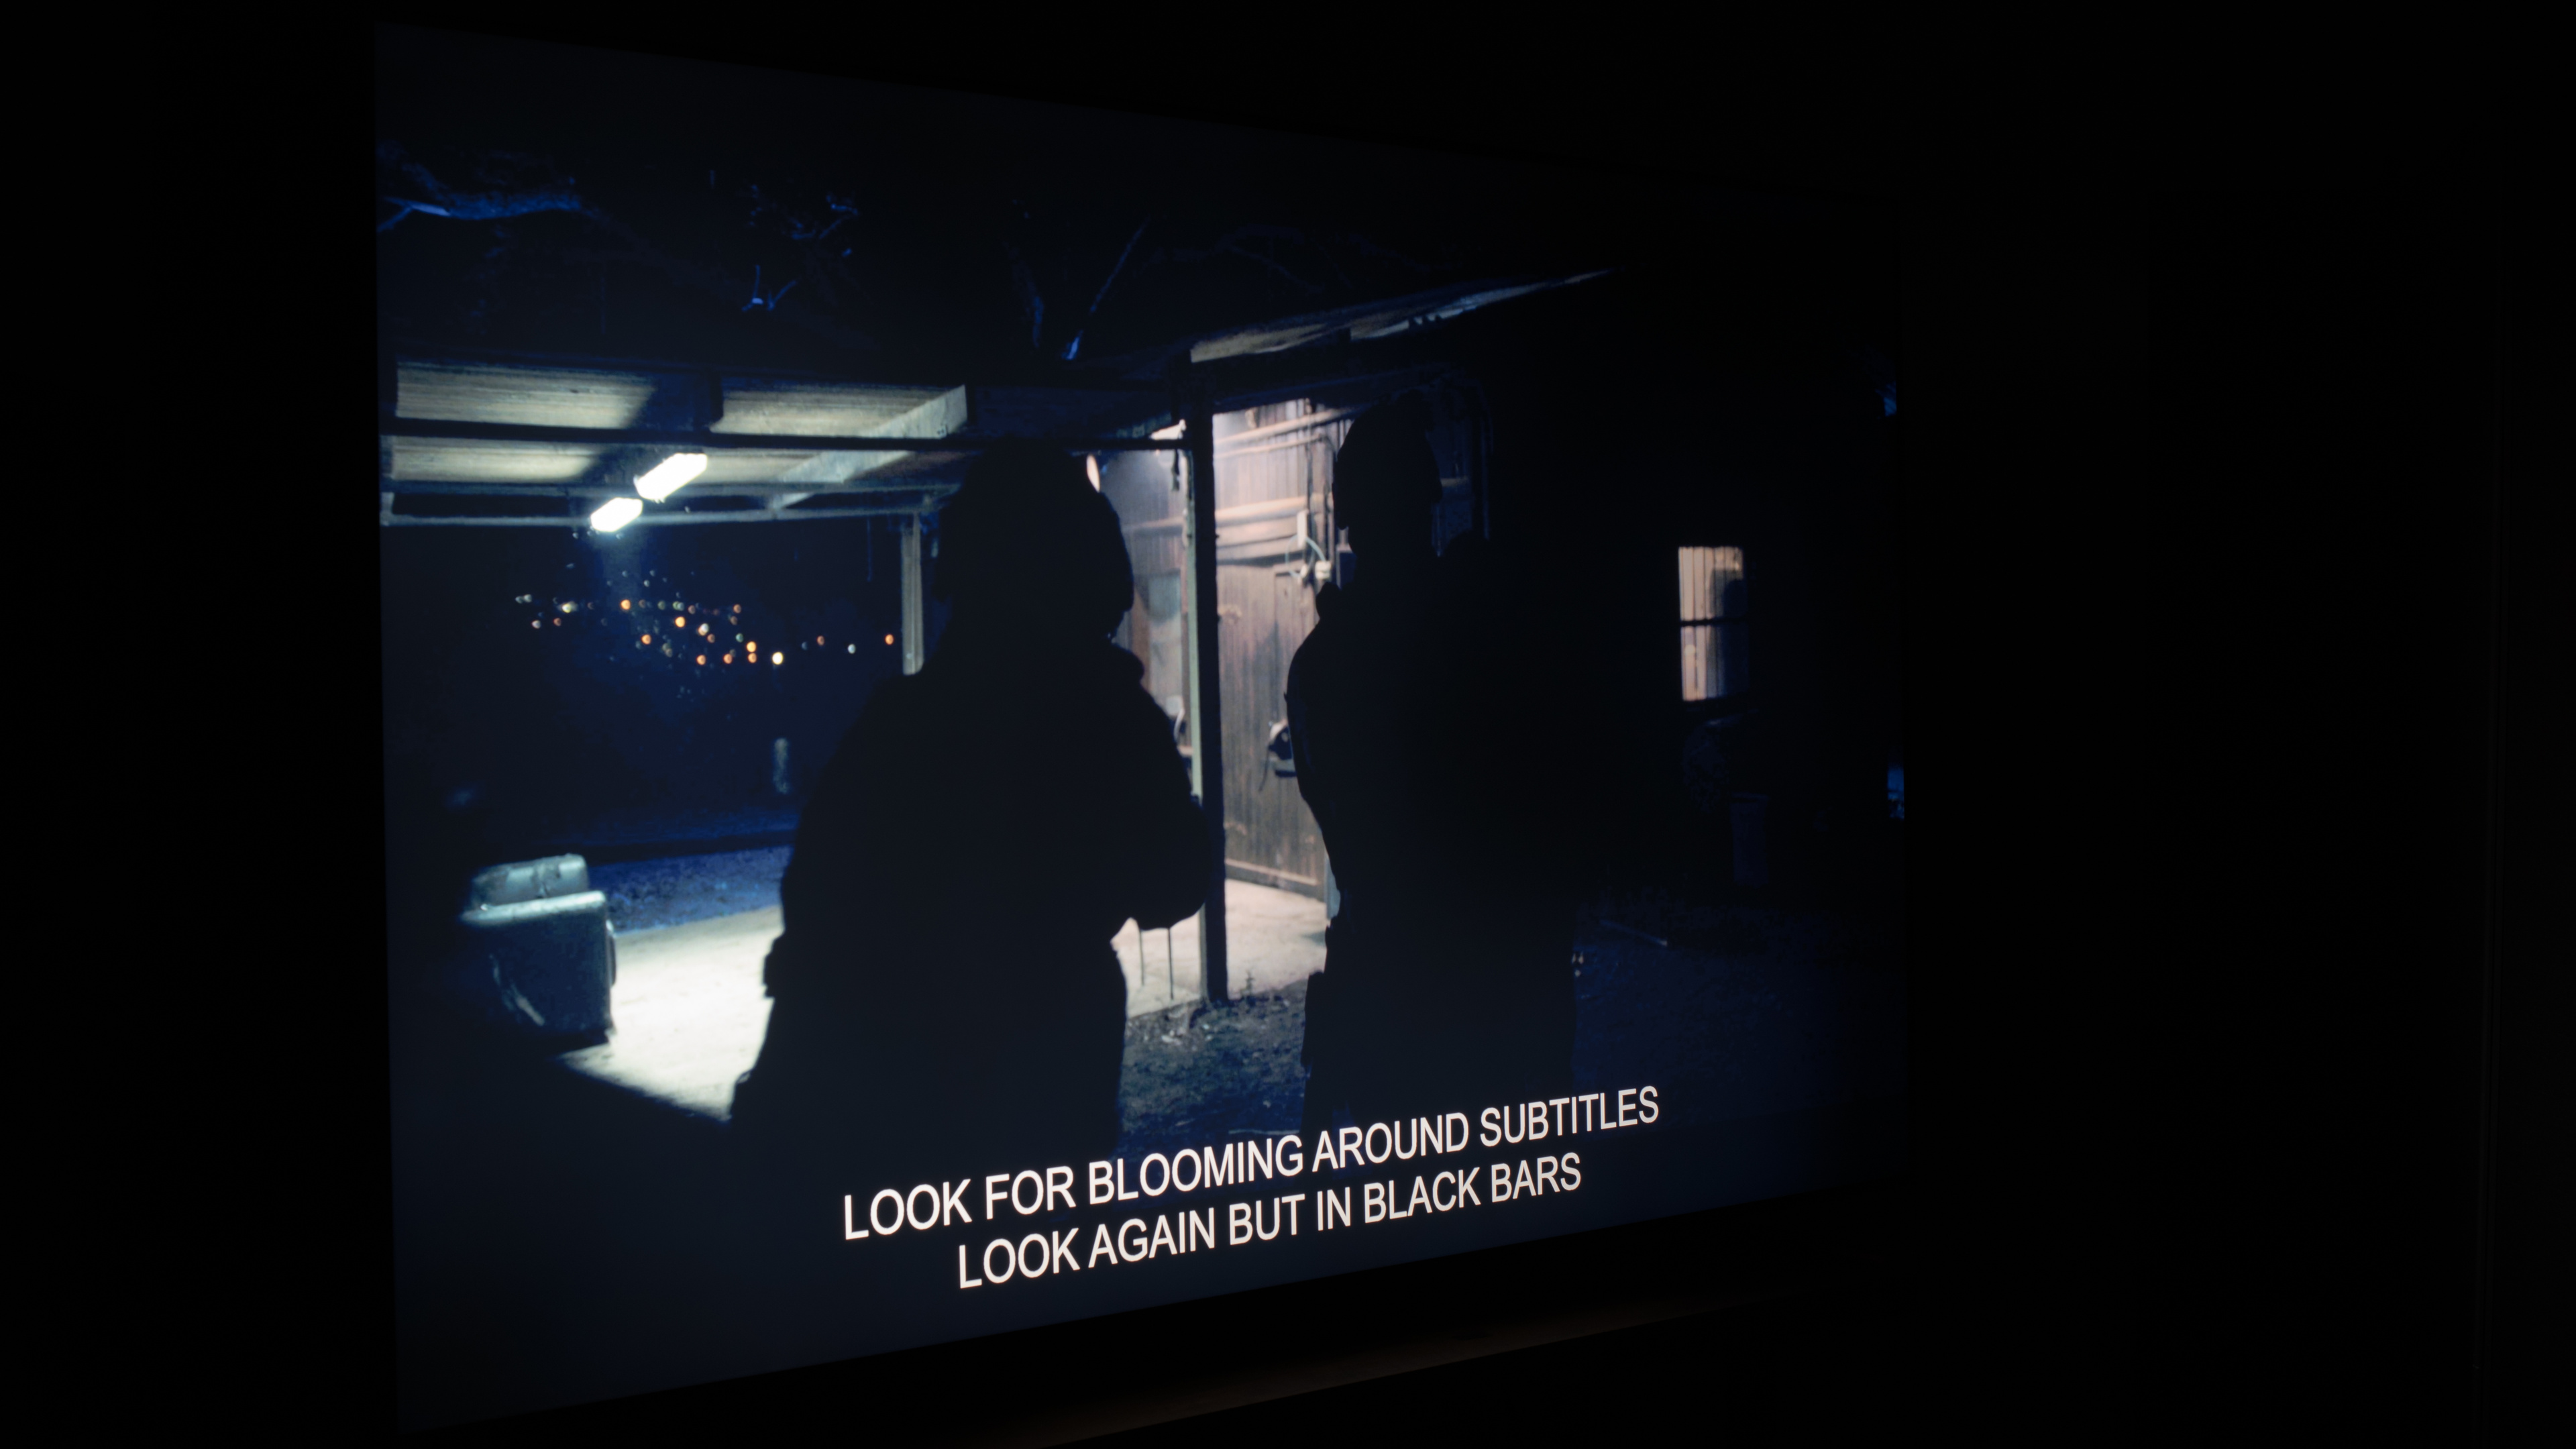
Contrast isn't the only thing that impacts a TV's overall black levels. Our lighting zone precision test examines how precisely a TV can dim the dark areas of an image surrounding highlights. If a TV performs poorly in this regard, the highlights will bleed into the dark areas, which can be distracting and affect the depth of blacks surrounding the highlights. The precision of zones is mostly determined by two things: the local dimming algorithm and the number of dimming zones a TV has. Let's break down the number of dimming zones and other key measurements for each TV size.
| TV Size | Zones | Pixels per Zone | Zone Size (in²) |
| 65" | 96 | 86,400 | 18.8" |
| 100" | 140 | 59,245 | 30.5" |
Here we can see that Samsung hasn't simply scaled the local dimming to the size of the panel. The physical dimming zones are actually significantly larger on the 100-inch model, with each zone covering 62% more area compared to the smaller size. This is disappointing, to say the least. This large size directly translates to worse overall dimming performance, as each zone covers more of the screen, and there's more haloing around bright highlights. As you can see in the zone precision photo above, the 100-inch model is cloudy across most of the screen.
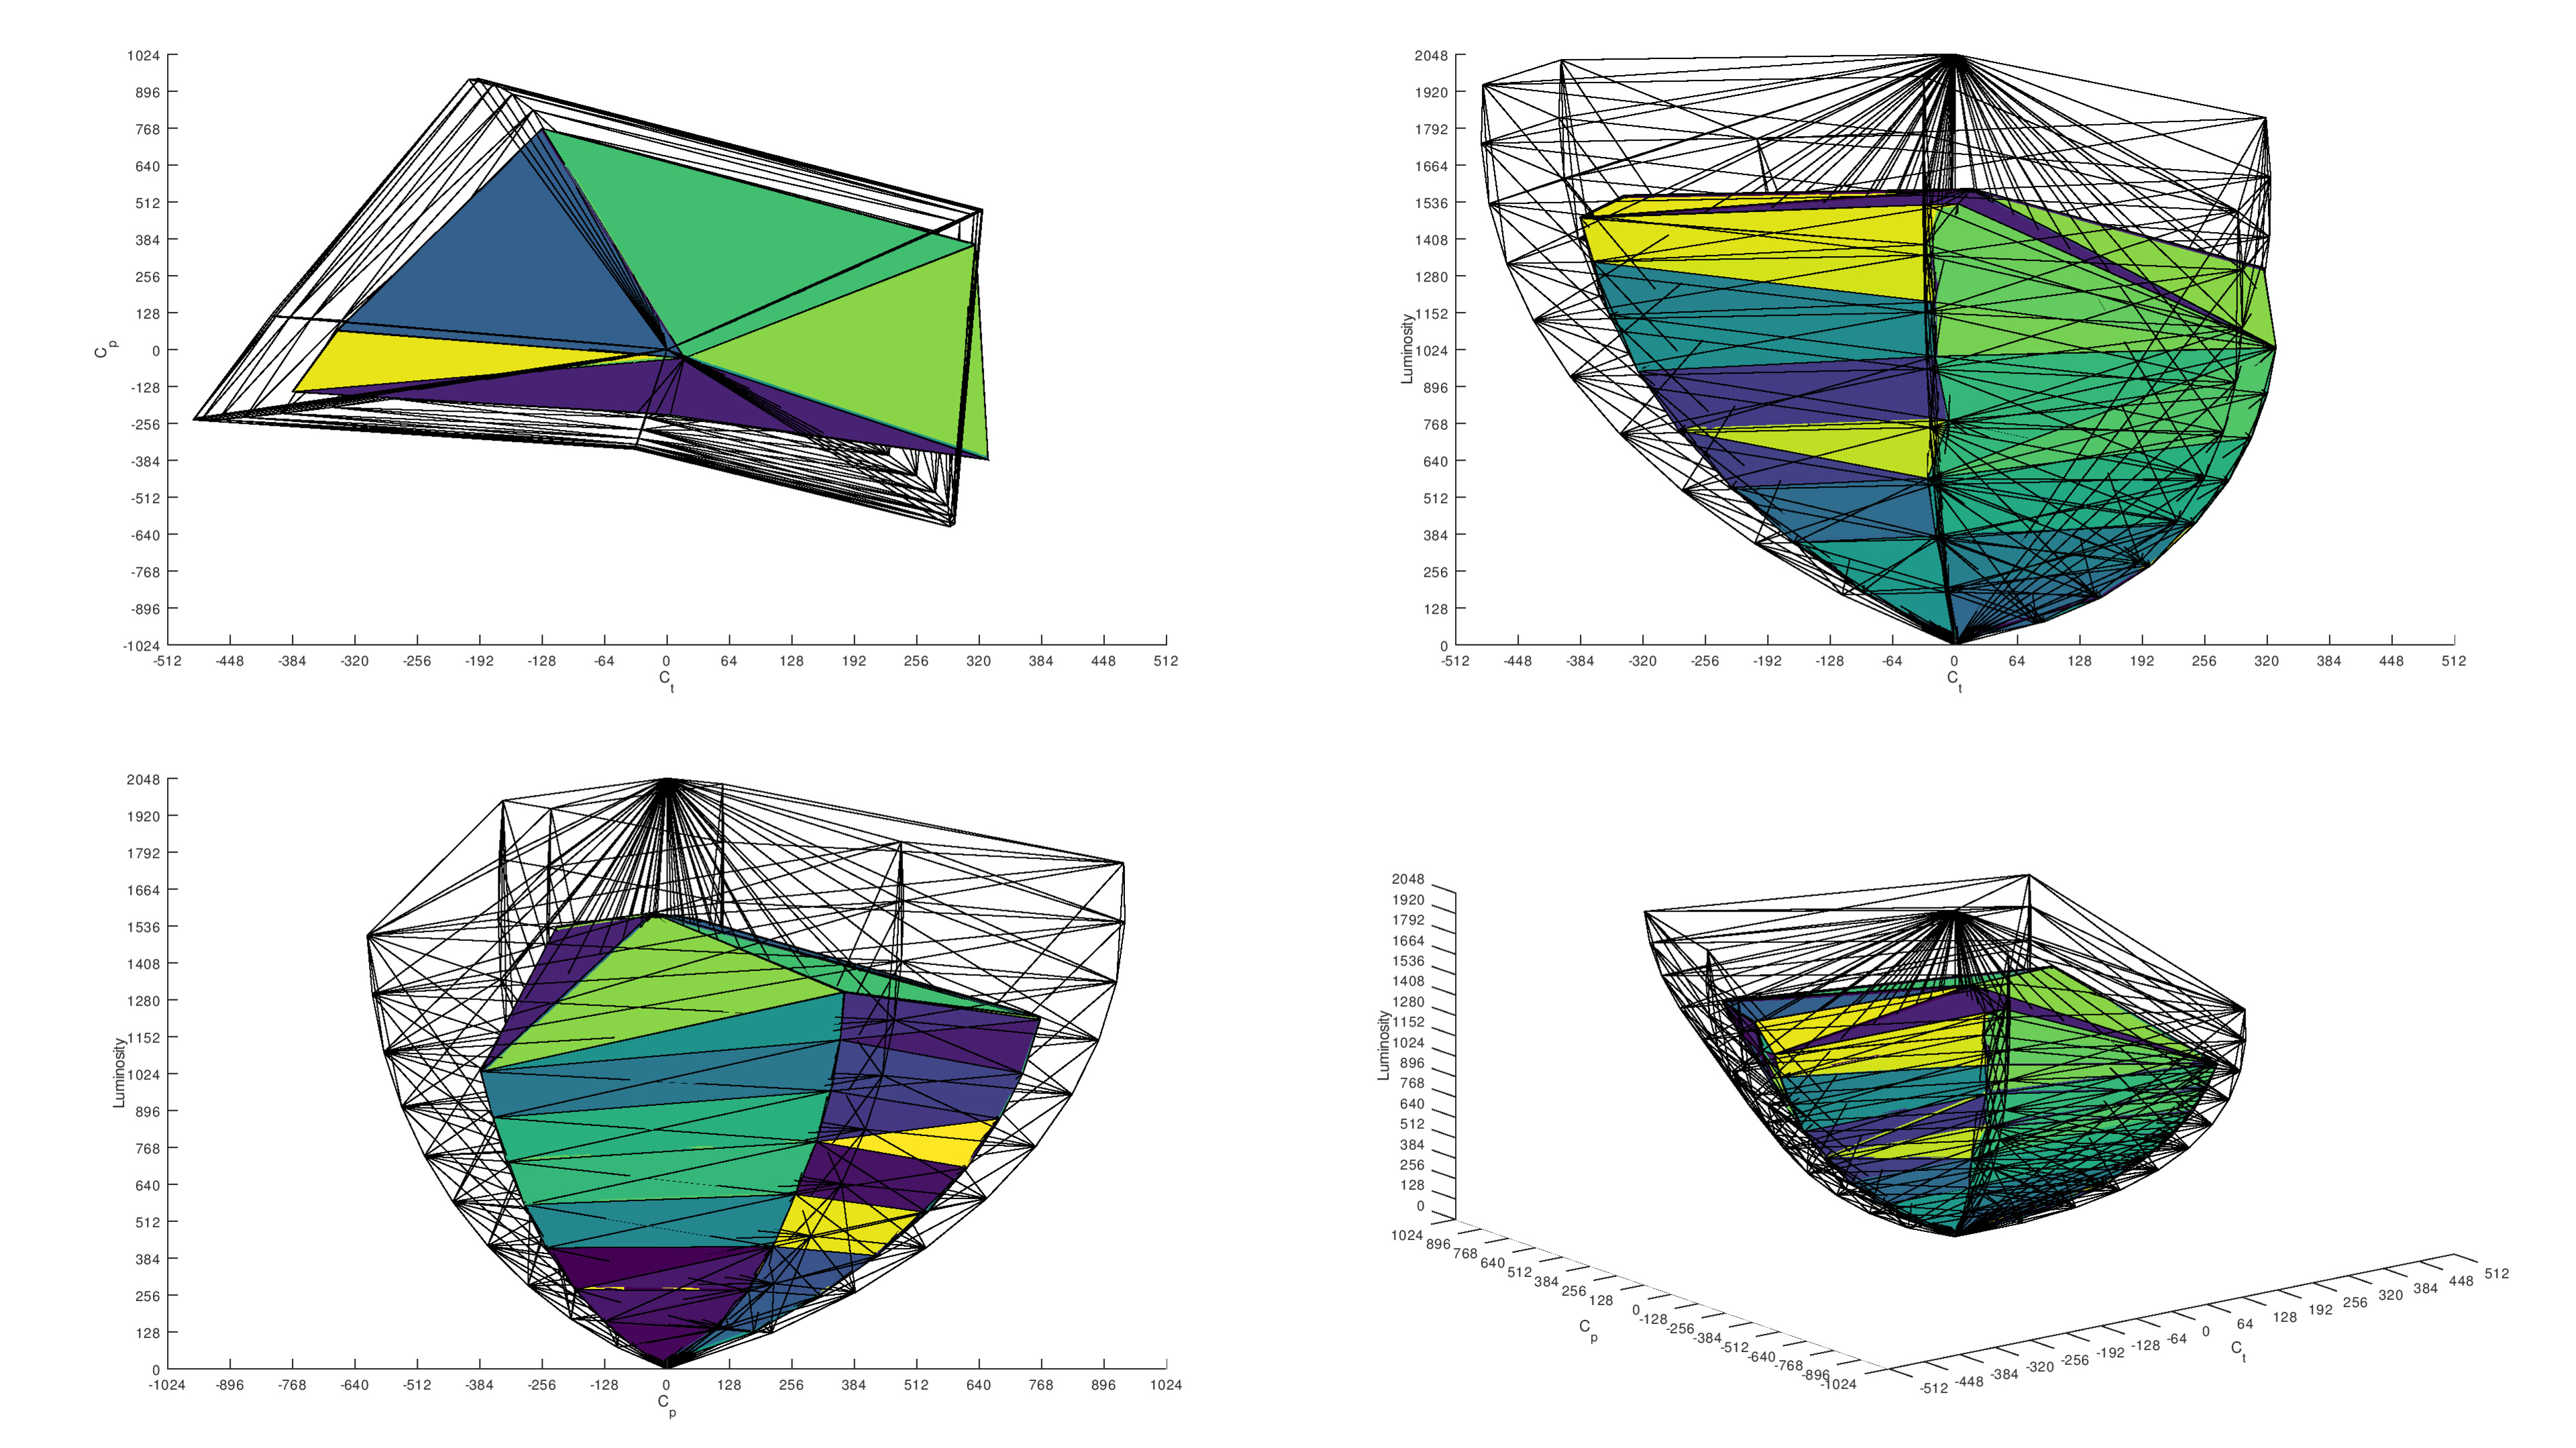
Color Volume
| Samsung 100QN80F | Samsung 65QN80F |
|---|---|
 |
 |
 |
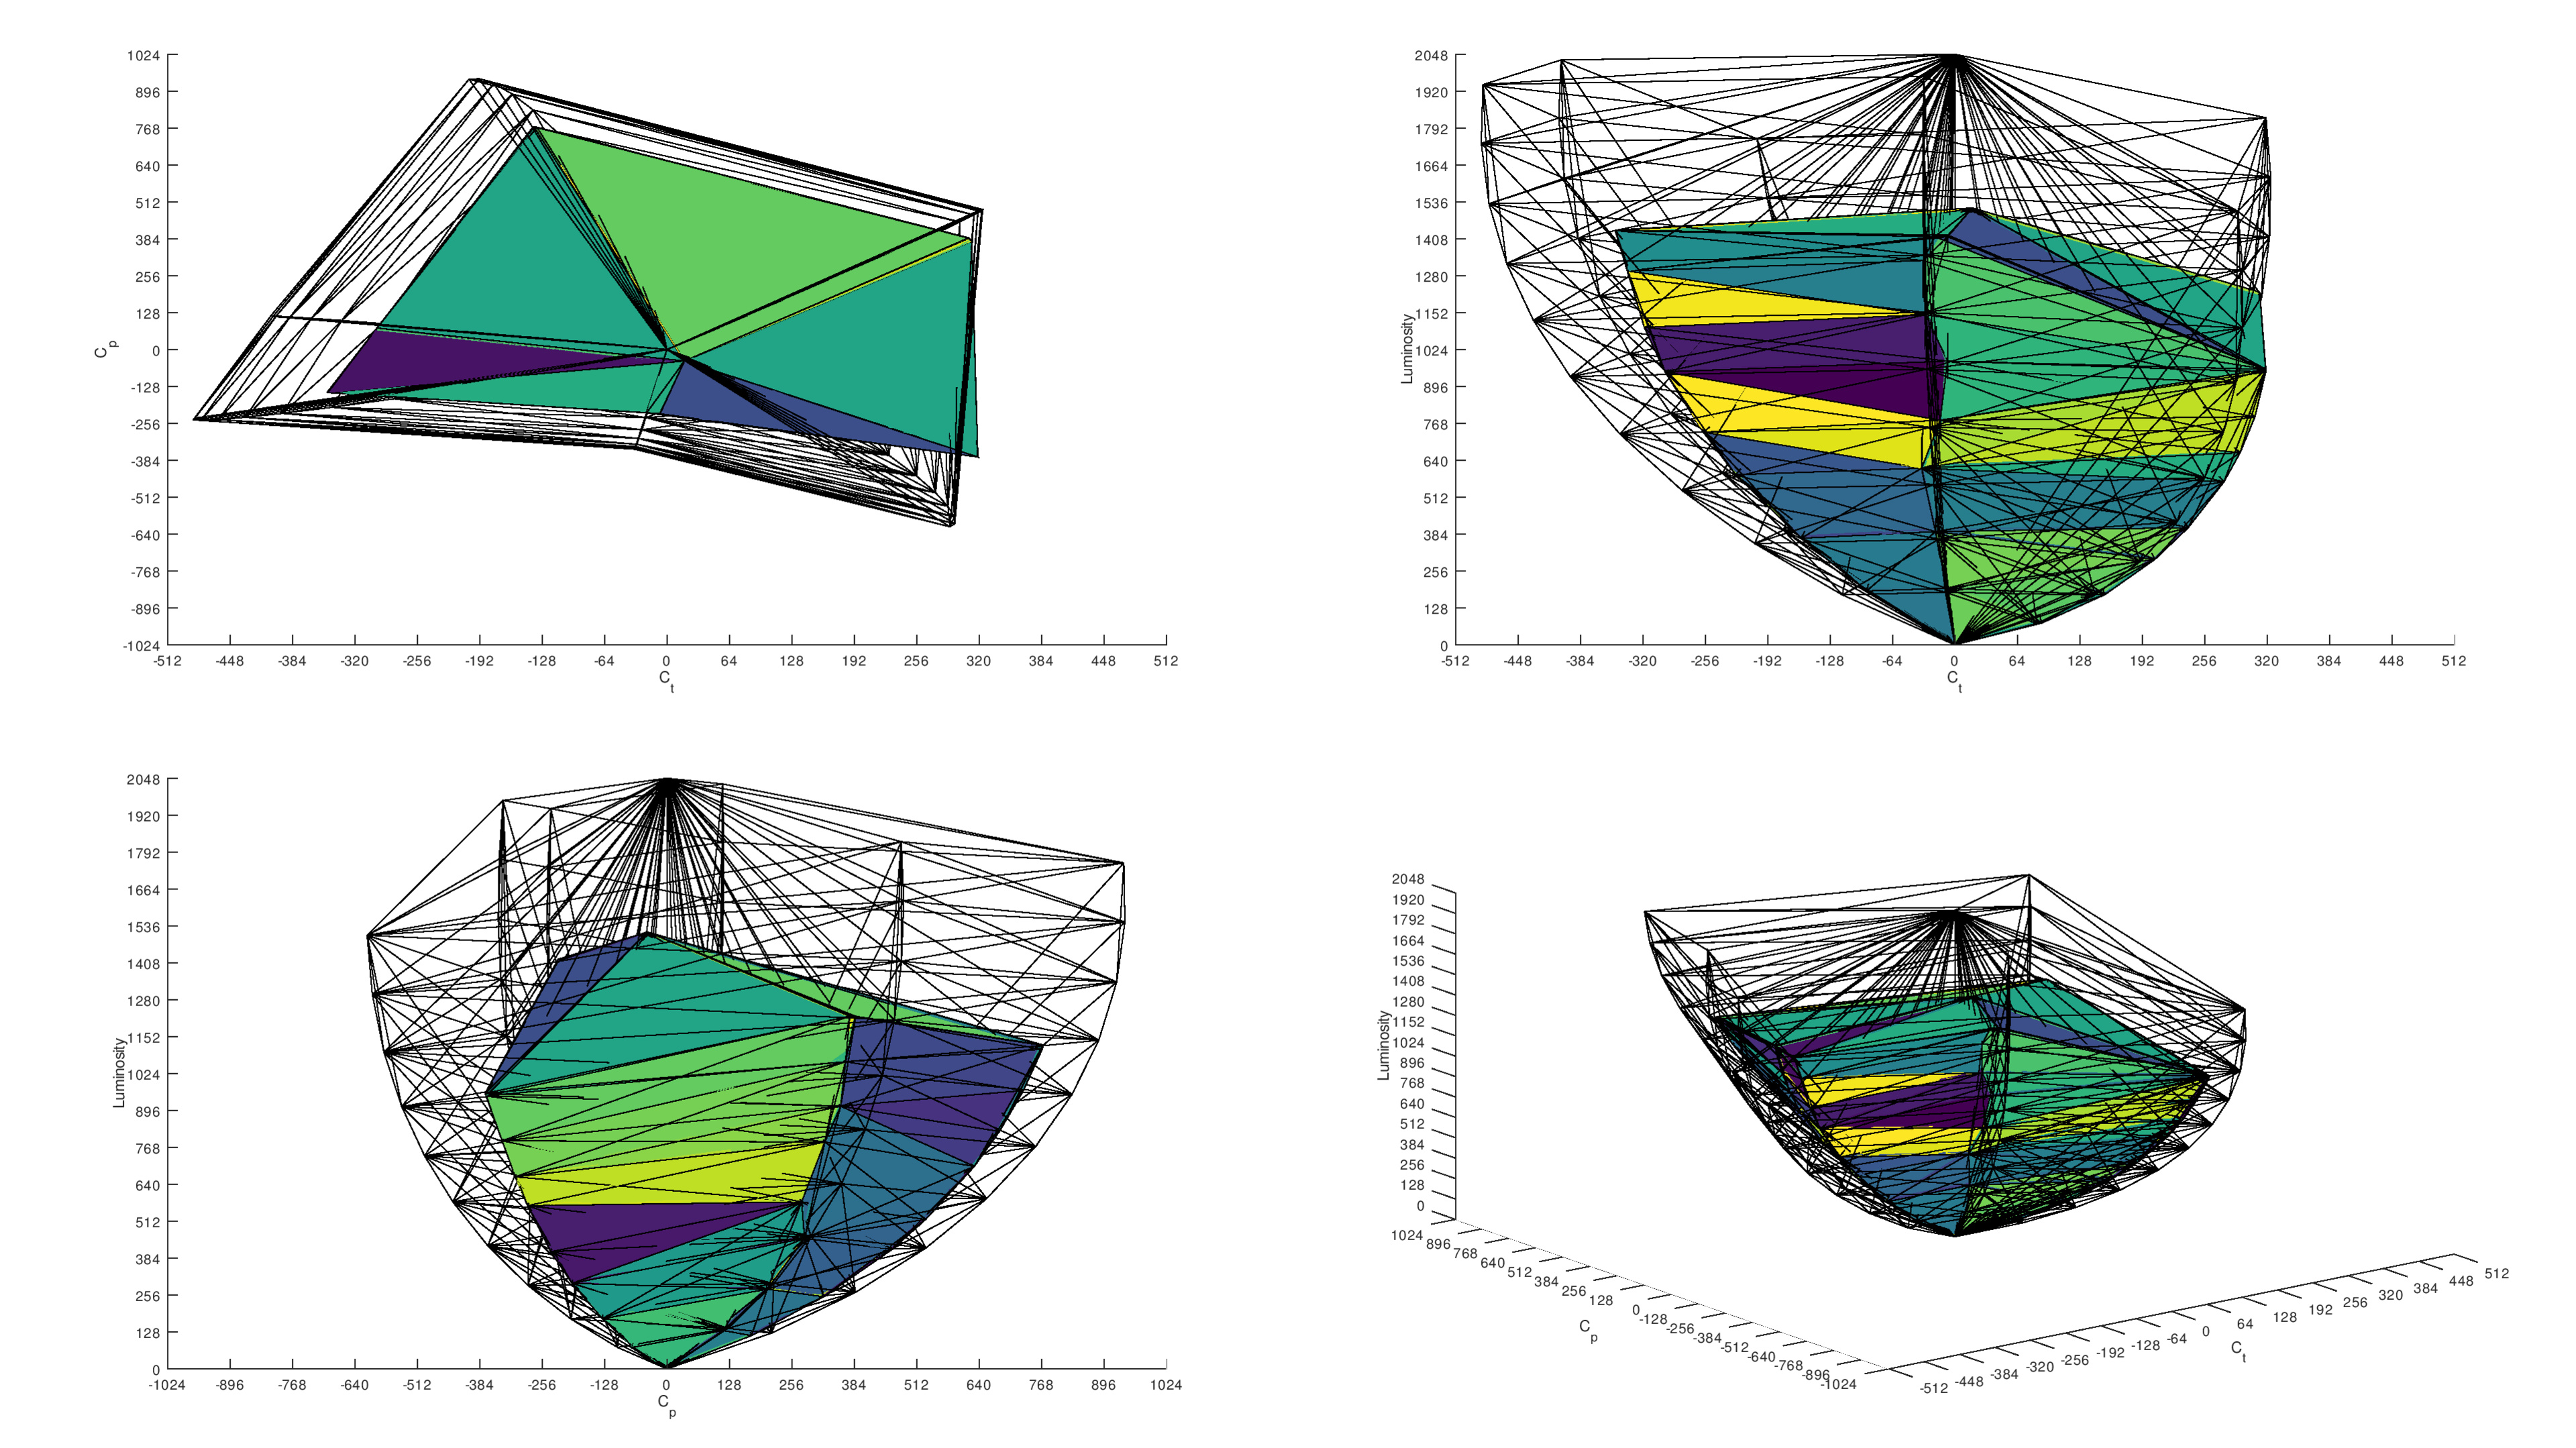 |
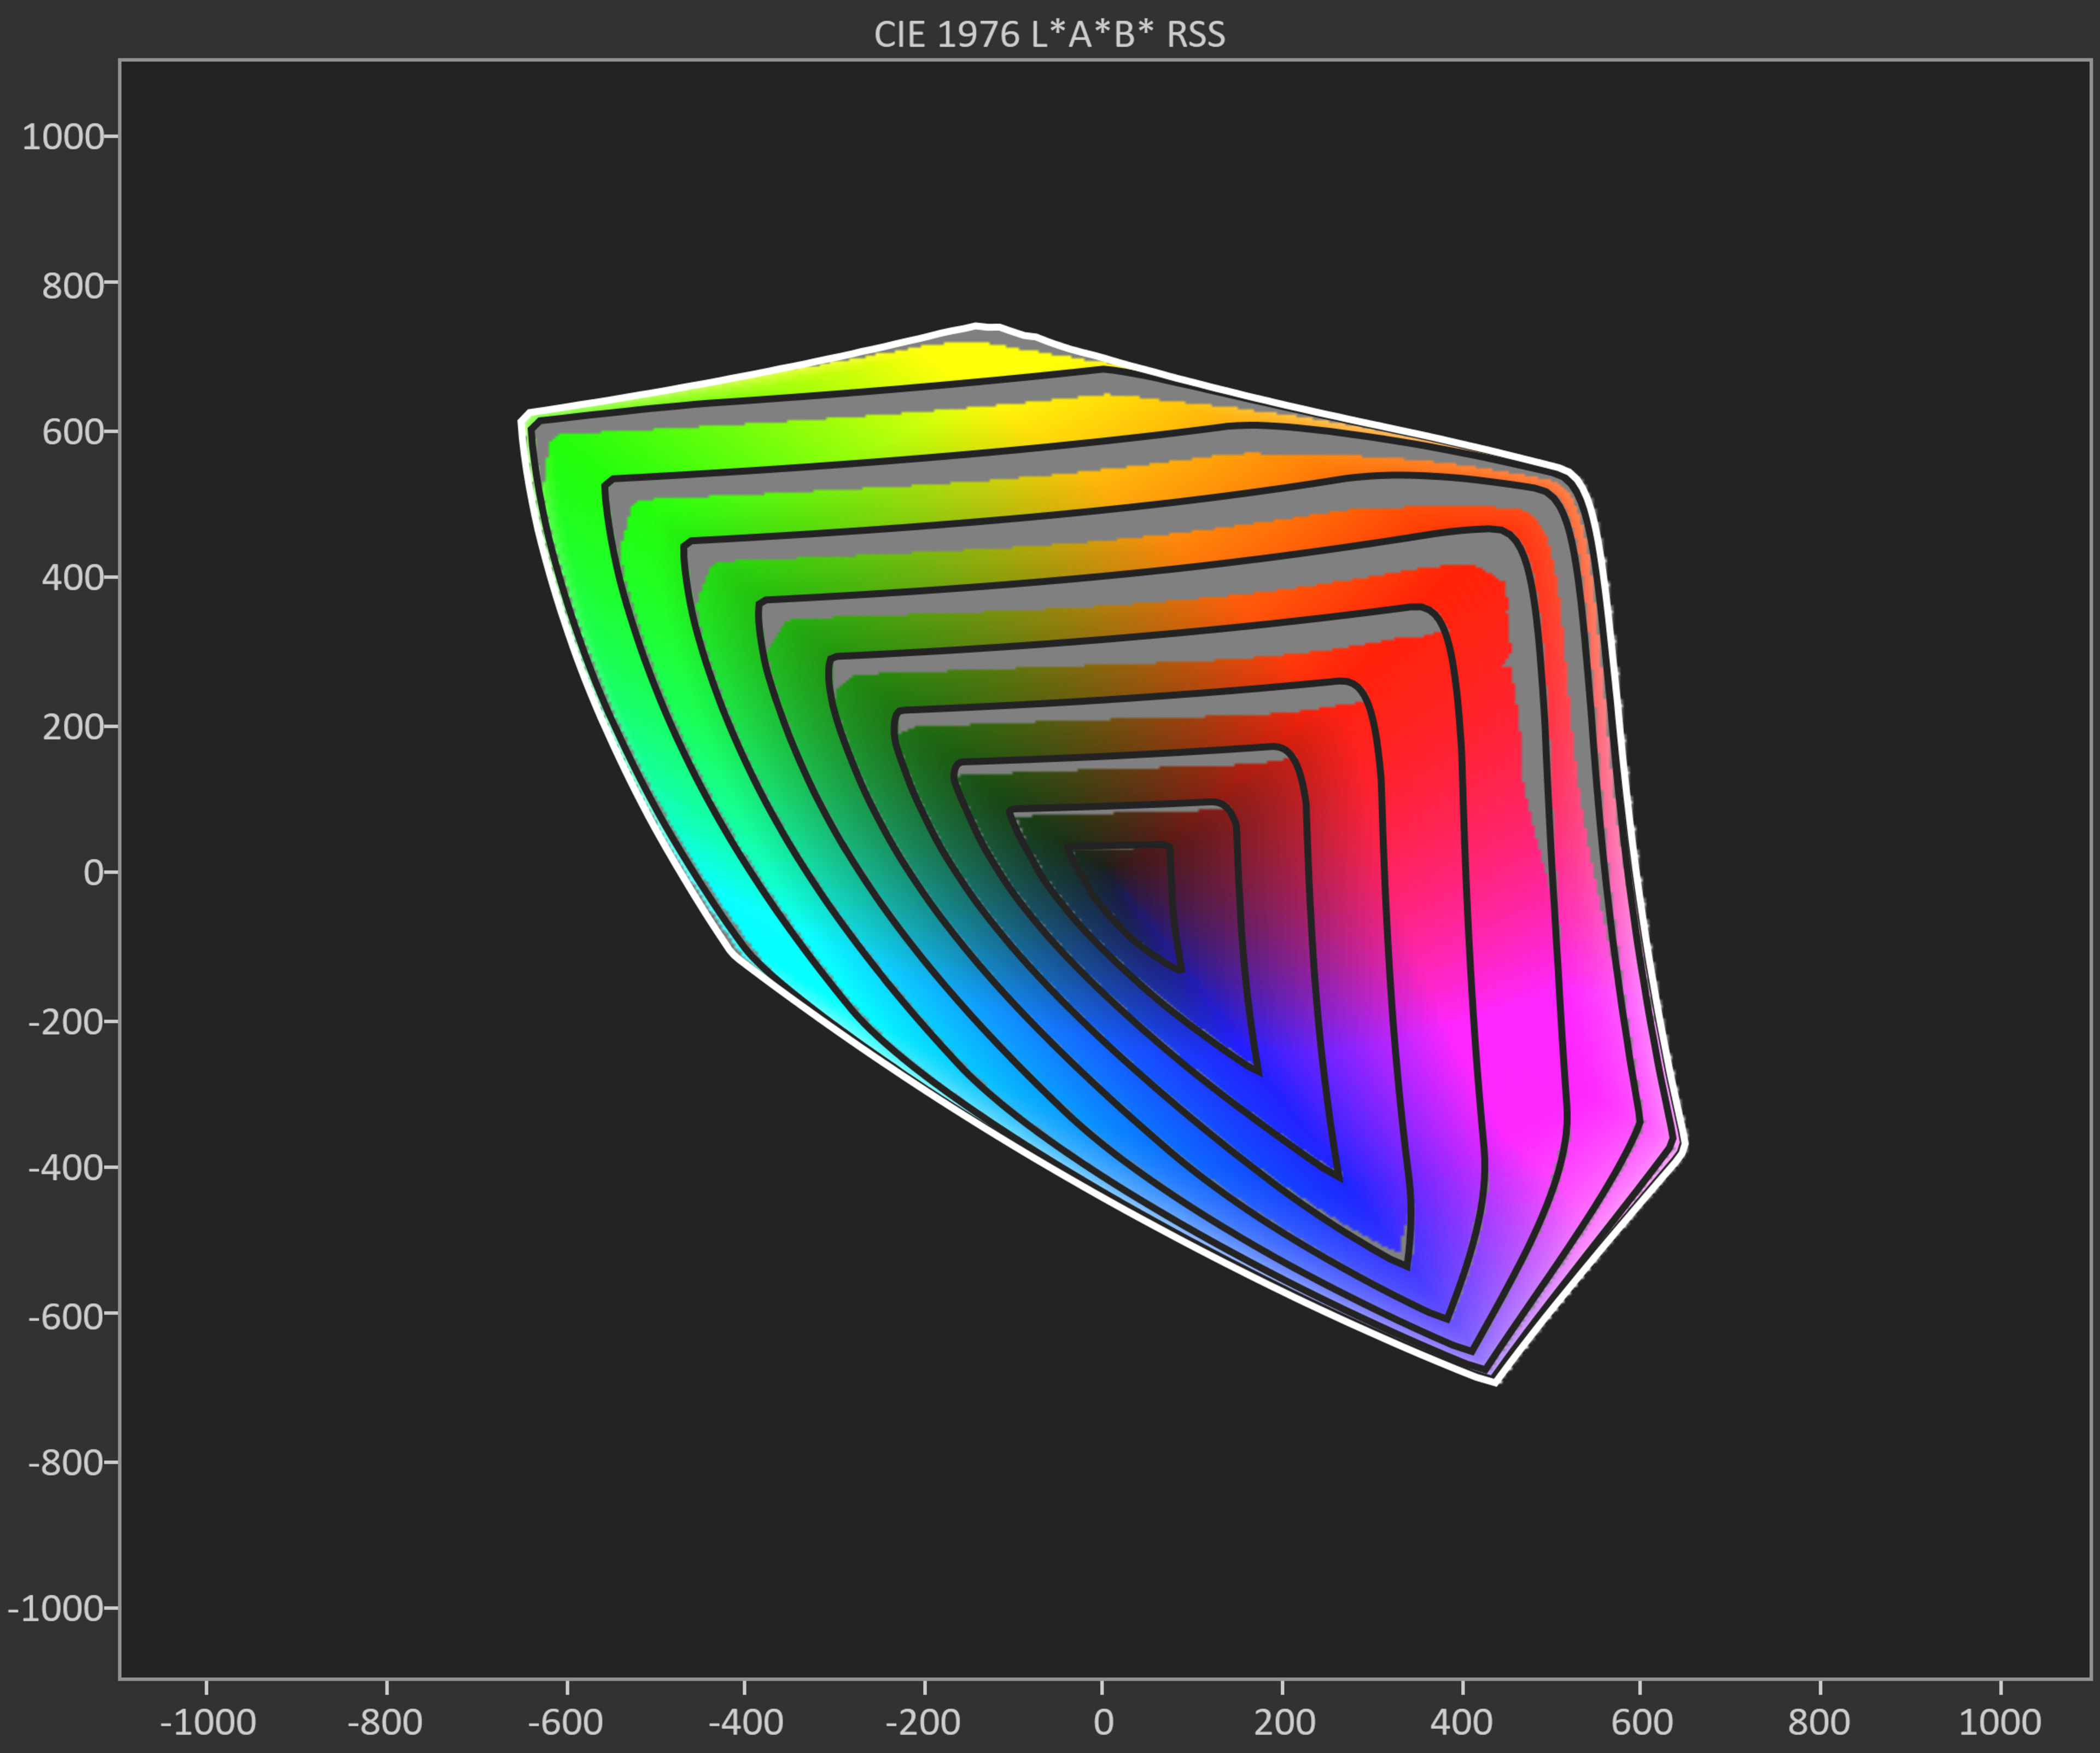
SDR color volume is a representation of a TV's color performance when displaying SDR content. Ideally, you want a TV with large coverage of the DCI-P3 and BT.2020 color spaces so your SDR content is as colorful and accurate as possible. Instead of showing a TV's color volume performance with a 3D graphic, as we do with our HDR Color Volume test, our SDR color volume test shows us a display's capabilities with an easier-to-understand 2D image, which is broken down into slices called gamut rings.
Overall color performance is similar between the two models. The 100-inch model has slightly better color volume, mainly due to its increased brightness, which allows it to display brighter, more vivid highlights in bright scenes. That being said, both TVs suffer from the same color washout in very light scenes, especially in SDR.
Viewing Angle
| Samsung 100QN80F | Samsung 65QN80F |
|---|---|
 |
 |
 |
 |
 Black level raise: 12° Gamma shift: 20° |
 Black level raise: 16° Gamma shift: 34° |
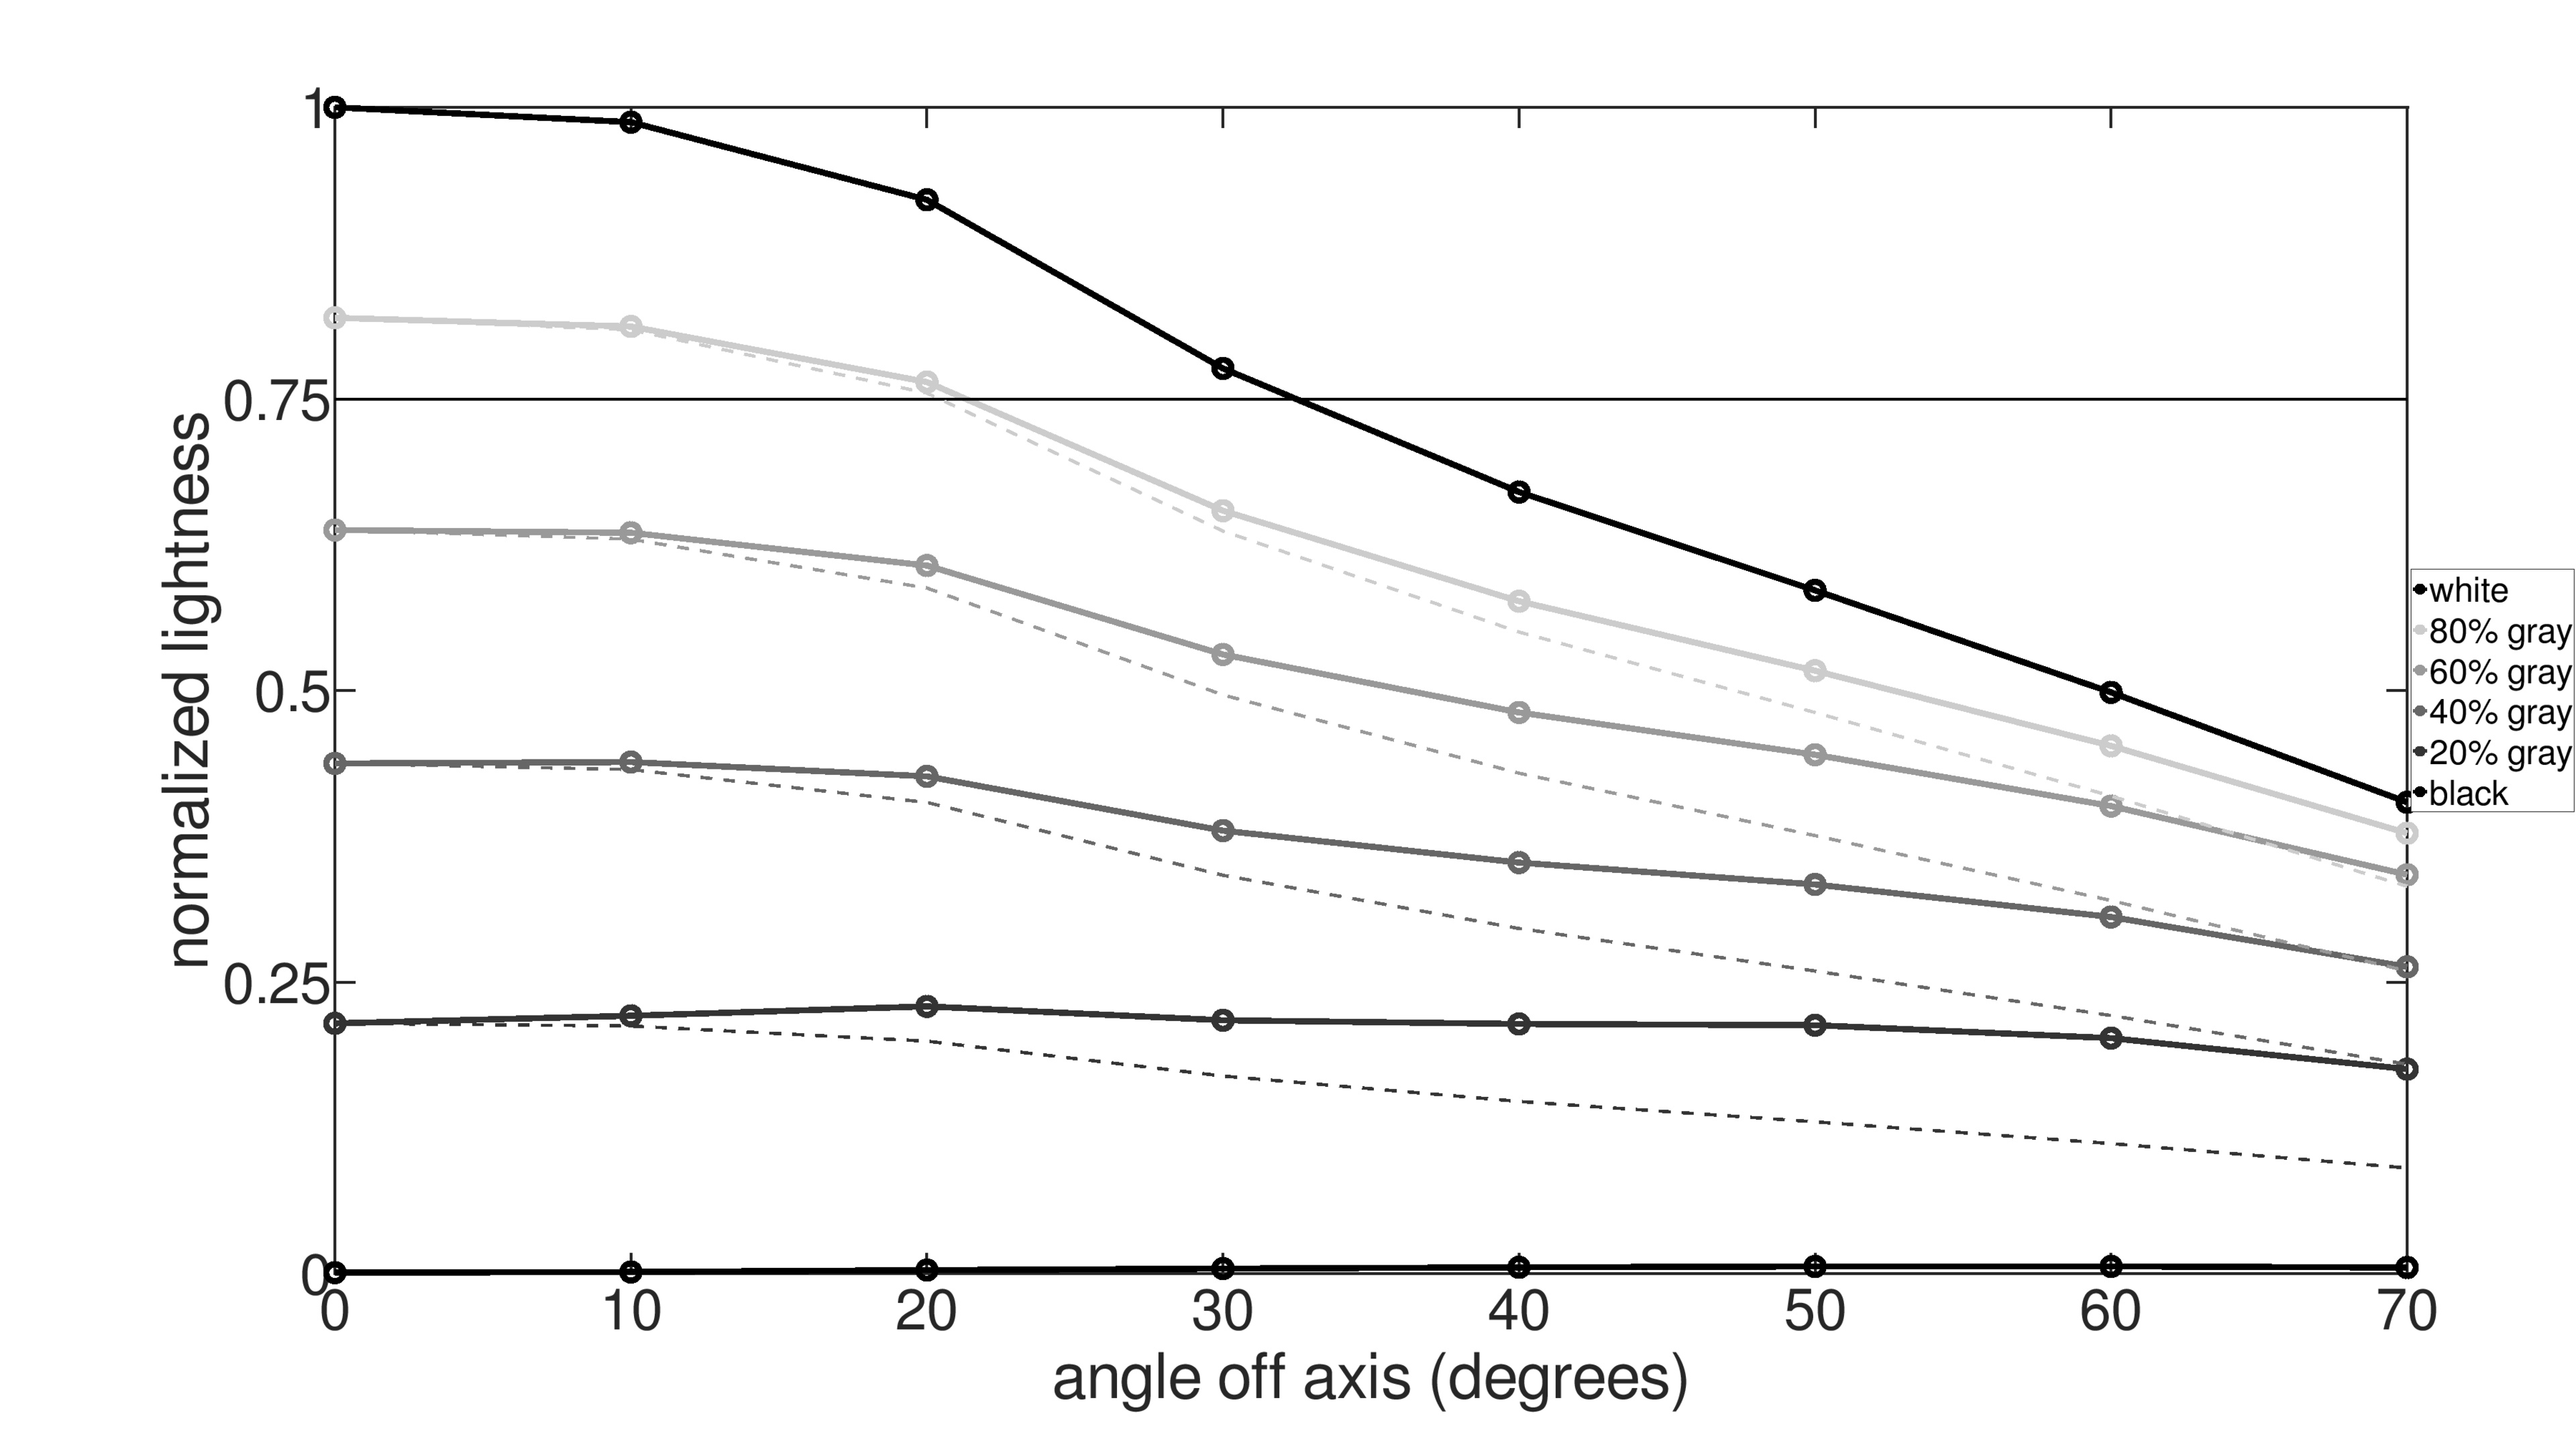
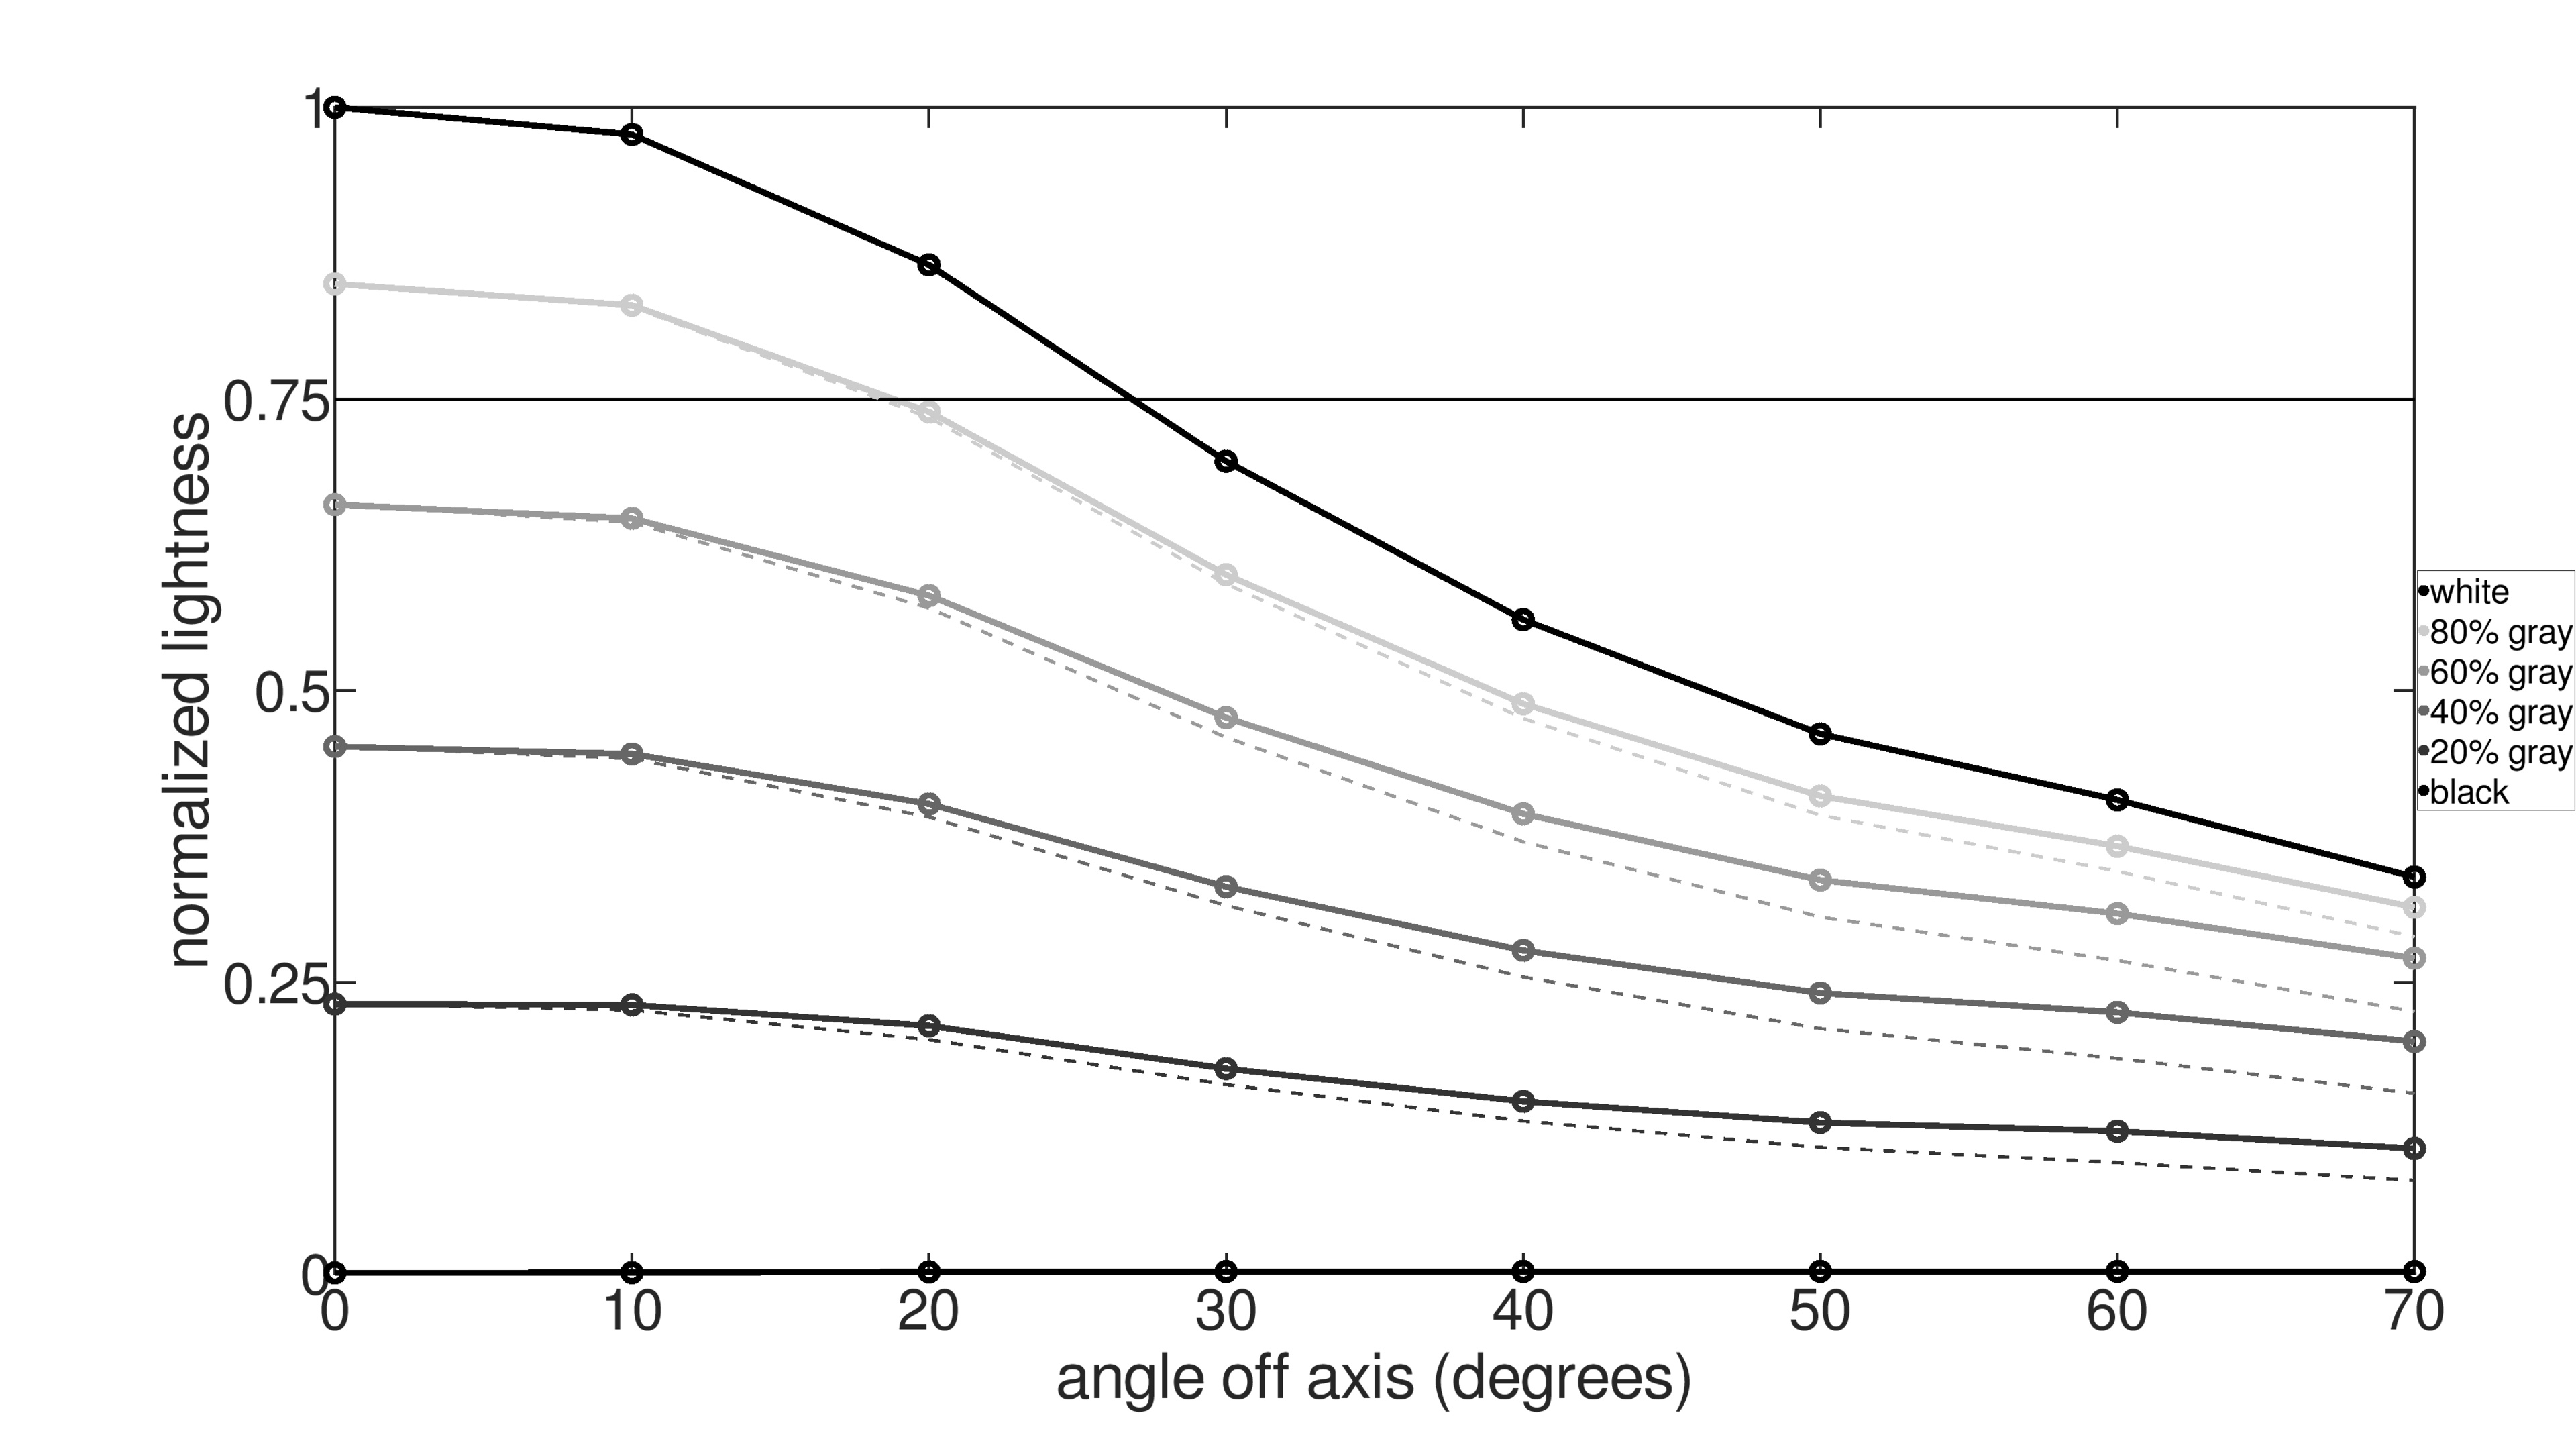
A TV's viewing angle tells us when an image starts to look inaccurate when viewing off-center. Whether we've realized it or not, an image looks different when we view our TV from the side, and some TVs retain image accuracy at an angle better than others. If you need a TV that looks good from various positions in a room with a wide seating arrangement, wide viewing angles are very important. However, if you sit directly in front of the TV, viewing angles aren't as important to you.
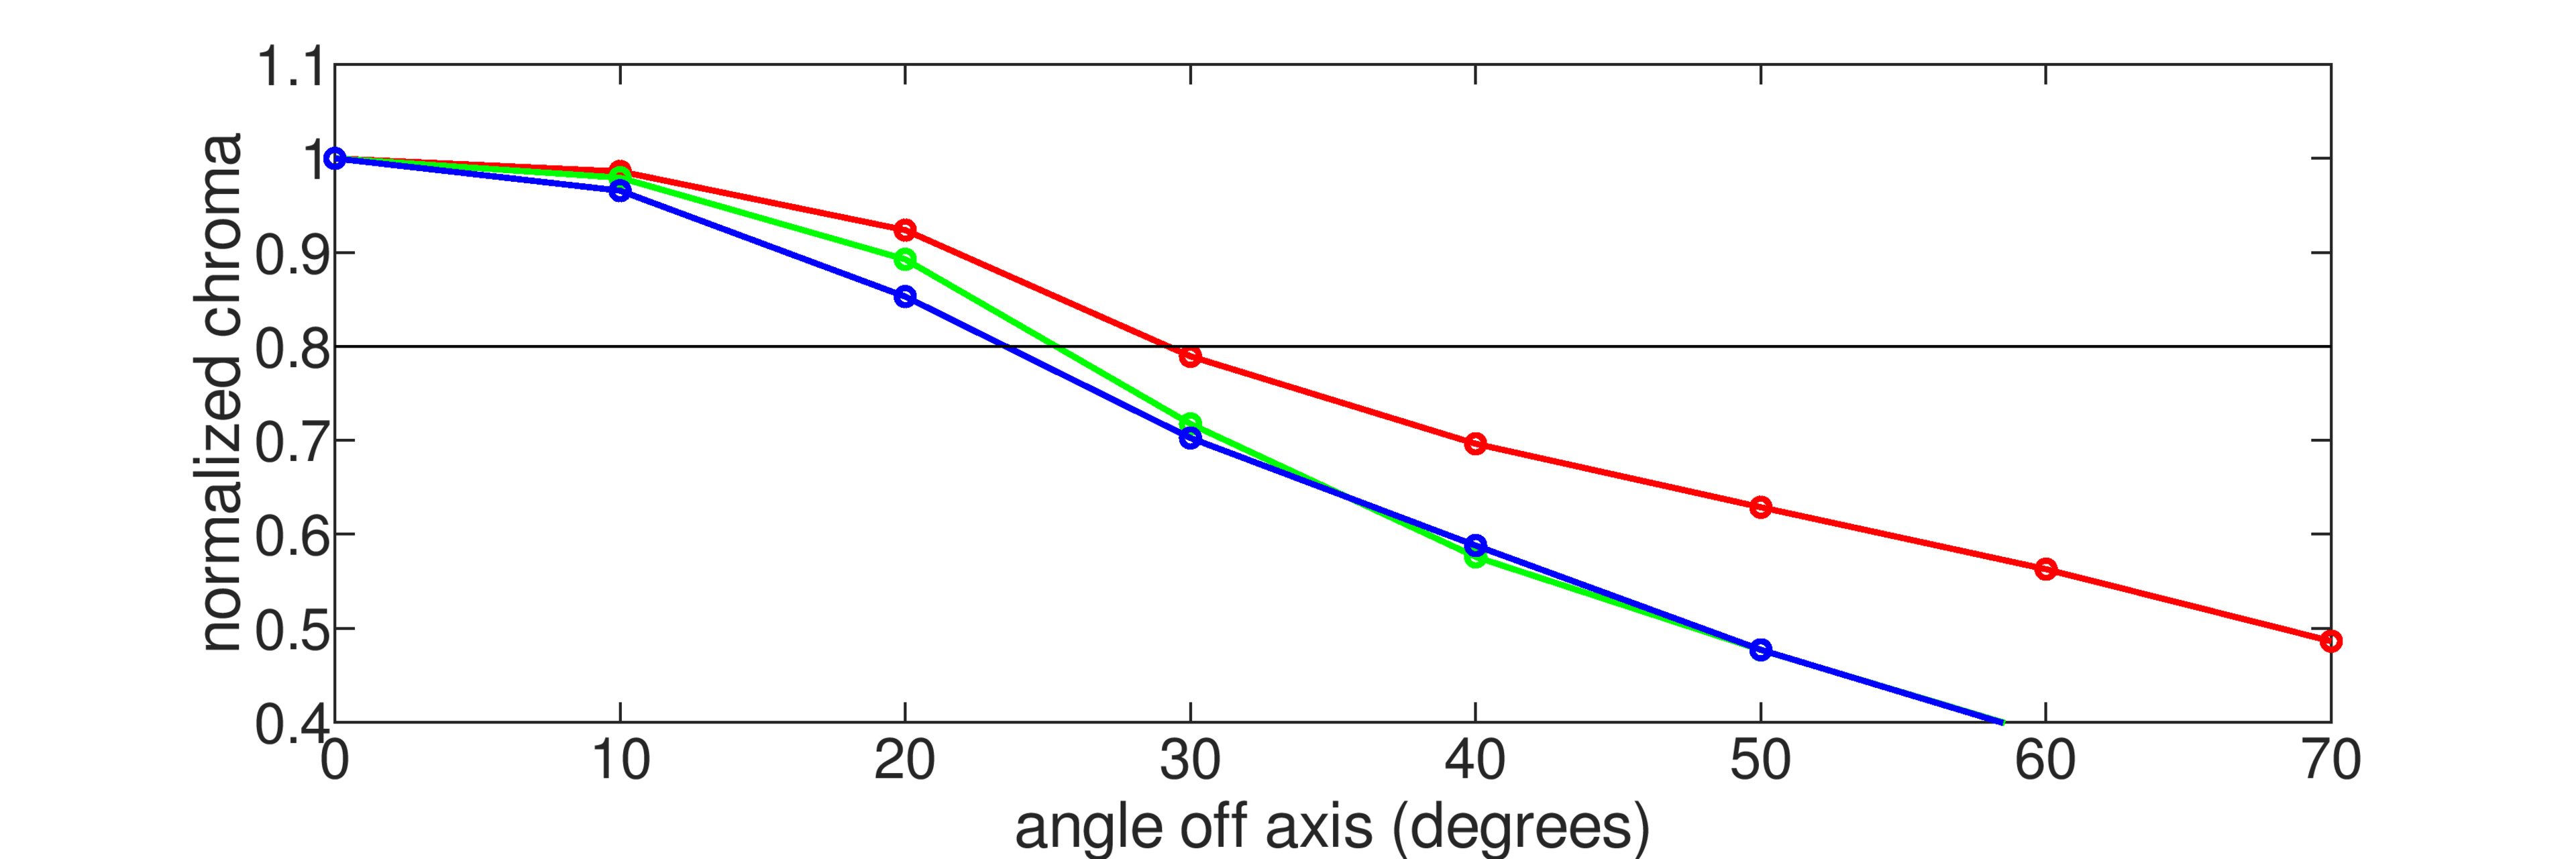
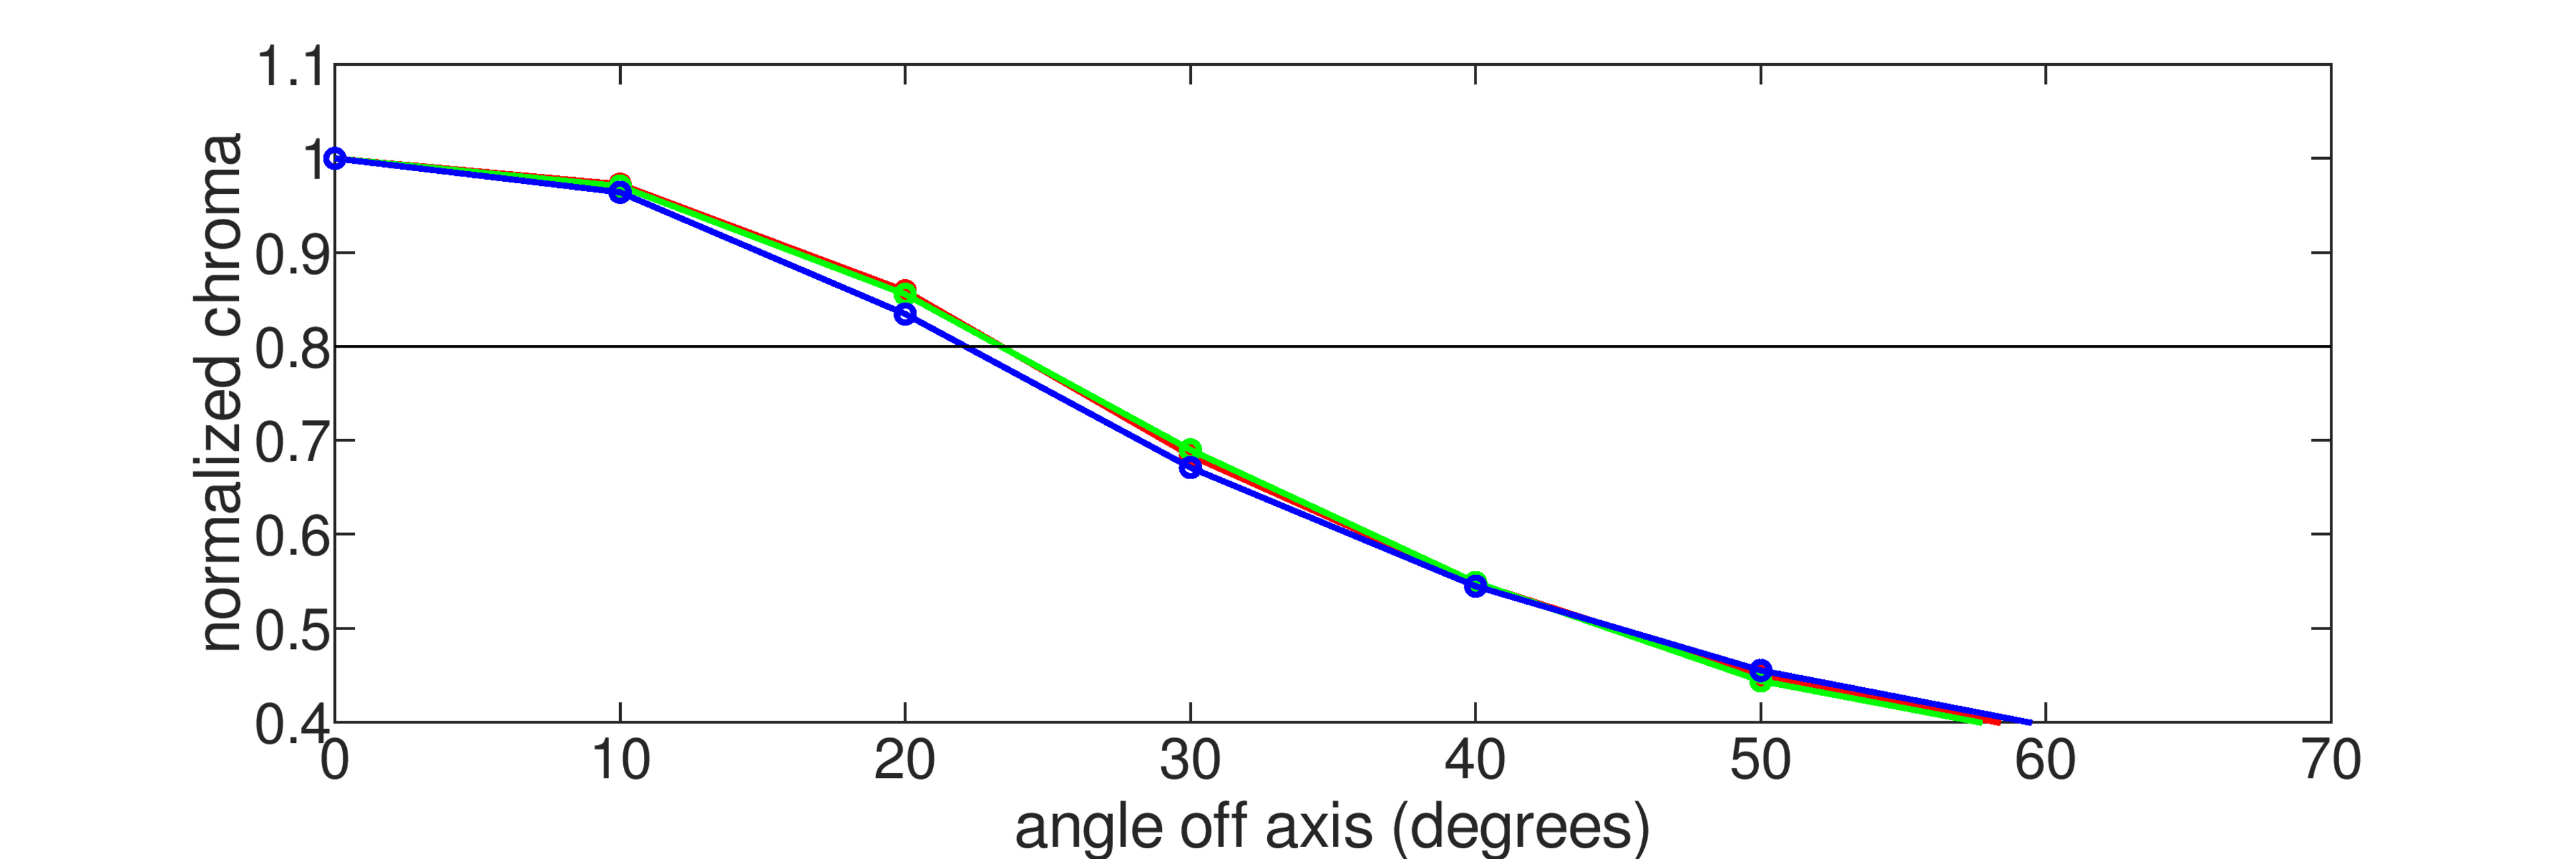
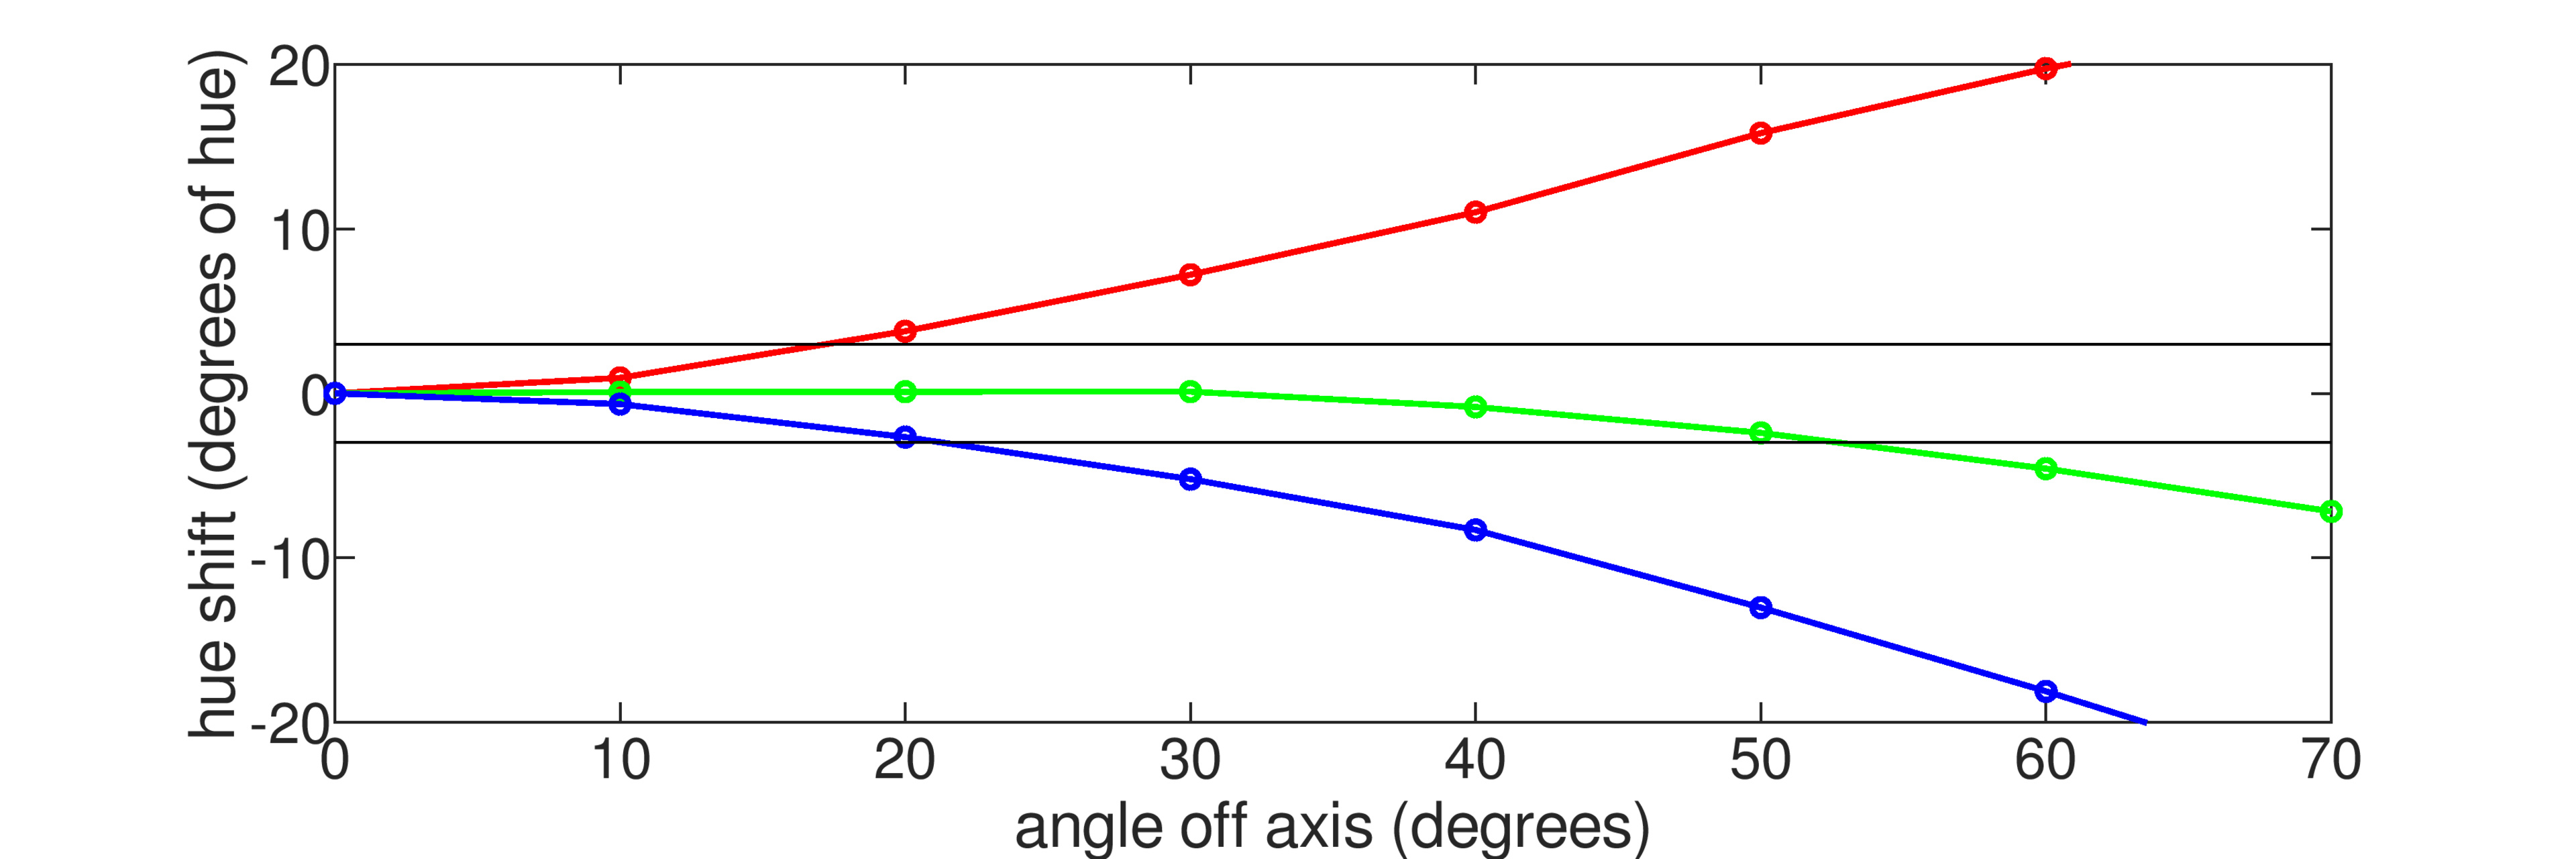
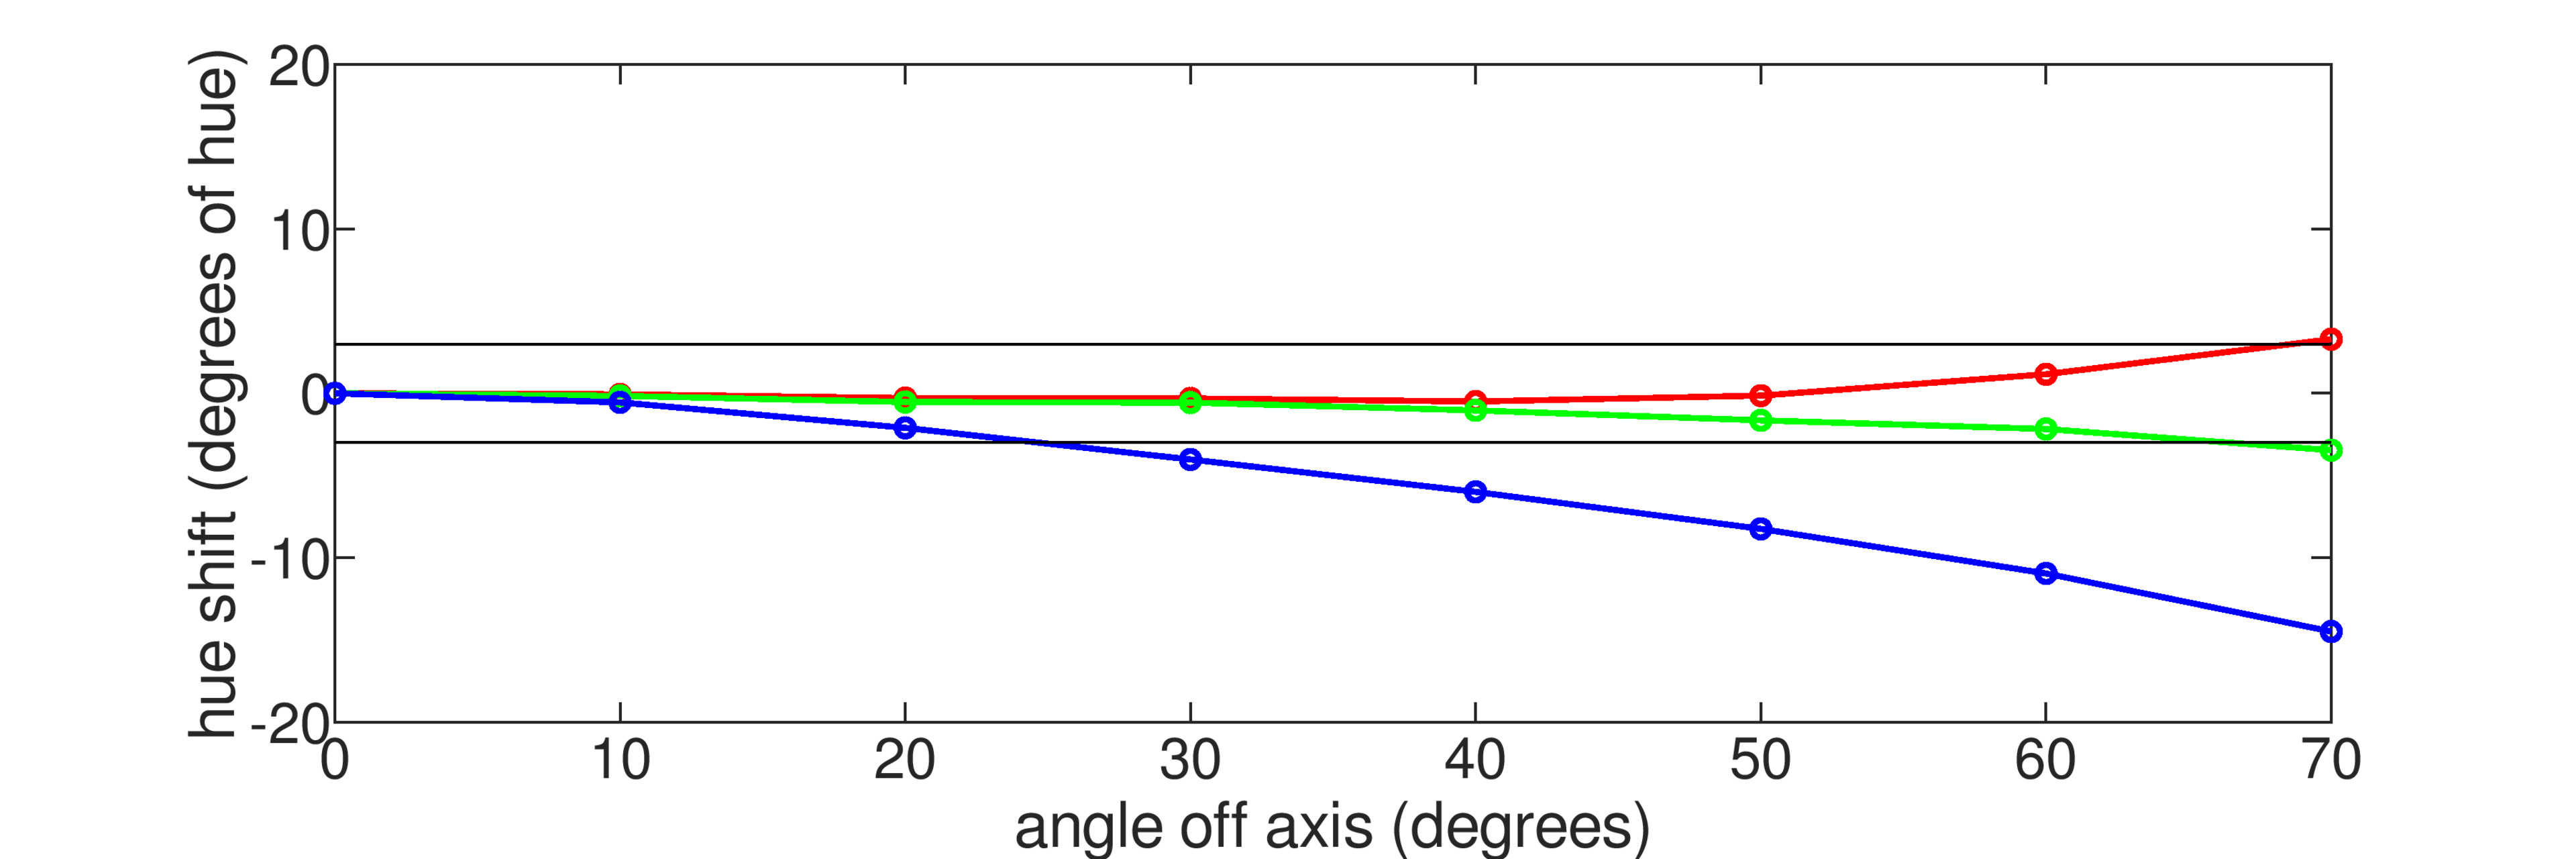
The viewing angles on the two sizes are similar, but there are also some significant differences in how they perform. The large model shows more of a divergence between the different colors, with reds washing out slower than other colors and a positive hue shift. This means that while both TVs degrade at roughly the same point, the 100-inch model takes more of a red shift, whereas the 65-inch simply washes out from the sides.
Size-To-Distance
| Samsung 100QN80F | Samsung 65QN80F | |
|---|---|---|
| Width | 87.2" (221.5 cm) | 56.7" (144 cm) |
| Height | 49" (124.5 cm) | 31.9" (81 cm) |
| Area | 4,273 in² (2.758 m²) | 1,809 in² (1.166 m²) |
| Recommended Mixed Usage Distance (30°) |
13'3" (4.05 m) | 8'10" (2.69 m) |
| Recommended Cinema Distance (40°) |
9'9" (2.98 m) | 6'6" (1.98 m) |
Going from 65-inch to 100-inch is a fairly significant increase in size. The 100-inch TV has roughly 136% more screen area. Using our size-to-distance calculator, we can see that this results in a fairly significant increase in the recommended viewing distance for the 100-inch model, so it's not well-suited for smaller rooms.
Conclusion
The Samsung QN80F is a decent TV, no matter which size you get. The 100-inch model stands out as a bit of an outlier here, as it's quite a bit brighter than the smaller size, but it also has worse local dimming. Overall, it's a bit of a disappointment relative to the rest of the ultra-large TV market, and if you're looking for a 98-100" TV, there are better options available like the Hisense 100U8QG or the TCL 98QM8K.