Products
Tested using Methodology v1.1
Updated Jun 07, 2024 08:54 PM
SEE PRICE
Amazon
Tested using Methodology v1.0
Updated Jun 07, 2024 08:51 PM
SEE PRICE
Amazon


Size25"
Pixel Type
TN
Variable Refresh Rate
FreeSync
Native Resolution1920 x 1080
Max Refresh Rate
240 Hz
Size27"
Pixel Type
IPS
Variable Refresh Rate
No
Native Resolution2560 x 1440
Max Refresh Rate
60 Hz
Our Verdict
BenQ ZOWIE XL2540
Dell U2715H
The Dell U2715H is marginally better than the BenQ ZOWIE XL2540, unless your main usage is for gaming. The Dell has a larger IPS screen with a higher native resolution, so you can see more details when working. The Dell has wider viewing angles so the image remains accurate when sitting very close to the screen or if sharing your work with someone else. If your main usage is for gaming, the ZOWIE has less motion blur, less input lag, and a much faster refresh rate, plus it supports FreeSync VRR.
Variants
- XL2540 (25")
- U2715H (27")
Check Price
25"
XL2540
SEE PRICE
Amazon
27"
U2715H
SEE PRICE
Amazon
25"
XL2540
SEE PRICE
BestBuy.com
27"
U2715H
SEARCH
B&H
25"
XL2540
SEE PRICE
Walmart.com
27"
U2715H
SEARCH
BestBuy.com
25"
XL2540
SEARCH
B&H
27"
U2715H
SEARCH
Dell
25"
XL2540
SEARCH
BenQ
27"
U2715H
SEARCH
Walmart.com
Main Differences for
Mixed Usage
Mixed Usage
Threshold
Mixed Usage
Full Comparison
Design
Style
Design Picture

Size
Curved
Curve Radius
Weight (without stand)
Weight (with stand)
Stand
Stand Picture

Width
Depth
Ergonomics
Ergonomics Picture

Height Adjustment
Switch Portrait/Landscape
Swivel Range
Tilt Range
Back
Back Picture

Wall Mount
Borders
Borders Picture

Borders
Thickness
Thickness Picture

Thickness (with stand)
Thickness (without stand)
Build Quality
Build Quality Picture

Picture Quality
Contrast
Checkerboard Picture

LCD Type
Native Contrast
Contrast With Local Dimming
Local Dimming
Local Dimming Video


Local Dimming Video
Local Dimming
Backlight
SDR Peak Brightness
SDR Real Scene
SDR Peak 2% Window
SDR Peak 10% Window
SDR Peak 25% Window
SDR Peak 50% Window
SDR Peak 100% Window
SDR Sustained 2% Window
SDR Sustained 10% Window
SDR Sustained 25% Window
SDR Sustained 50% Window
SDR Sustained 100% Window
SDR ABL
HDR Peak Brightness
HDR Real Scene
HDR Peak 2% Window
HDR Peak 10% Window
HDR Peak 25% Window
HDR Peak 50% Window
HDR Peak 100% Window
HDR Sustained 2% Window
HDR Sustained 10% Window
HDR Sustained 25% Window
HDR Sustained 50% Window
HDR Sustained 100% Window
HDR ABL
Horizontal Viewing Angle
Horizontal Viewing Angle Video

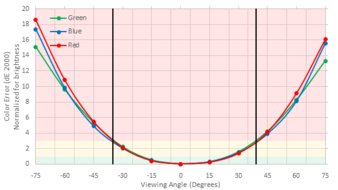
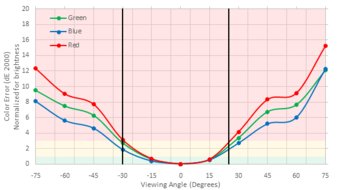
Horizontal Chroma Graph

Color Washout From Left
Color Washout From Right
Horizontal Color Shift Picture
Horizontal Hue Graph

Color Shift From Left
Color Shift From Right
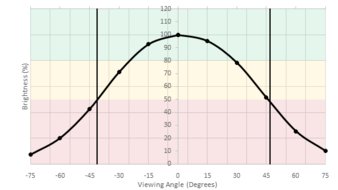
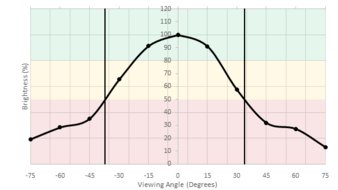
Horizontal Brightness Picture
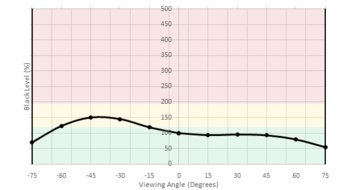
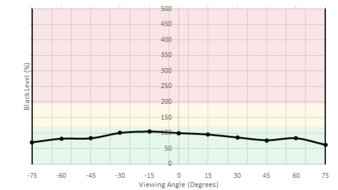
Horizontal Black Level Picture
Horizontal Lightness Graph

Brightness Loss From Left
Brightness Loss From Right
Black Level Raise From Left
Black Level Raise From Right
Curve Radius
Gamma Shift From Left
Gamma Shift From Right
Vertical Viewing Angle
Vertical Viewing Angle Video

Vertical Chroma Graph

Color Washout From Below
Color Washout From Above
Vertical Color Shift Picture
Vertical Hue Graph

Color Shift From Below
Color Shift From Above
Vertical Brightness Picture
Vertical Black Level Picture
Vertical Lightness Graph

Brightness Loss From Below
Brightness Loss From Above
Black Level Raise From Below
Black Level Raise From Above
Gamma Shift From Below
Gamma Shift From Above
Gray Uniformity
50% Uniformity Picture

50% Std. Dev.
50% DSE
5% Uniformity Picture

5% Std. Dev.
5% DSE
Black Uniformity
Native Black Uniformity Picture

Native Std. Dev.
Black Uniformity Picture With Local Dimming
Std. Dev. w/ L.D.
Pre Calibration
Pre Calibration Picture

Pre Gamma Curve Picture

Pre Color Picture

Picture Mode
Luminance
Luminance Settings
Contrast Setting
RGB Controls
Gamma Setting
Color Temperature
White Balance dE
Color dE
Gamma
Post Calibration
Post Calibration Picture

Post Gamma Curve Picture

Post Color Picture

Picture Mode
Luminance
Luminance Settings
Contrast Setting
RGB Controls
Gamma Setting
Color Temperature
White Balance dE
Color dE
Gamma
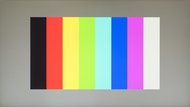
SDR Color Gamut
Color Gamut sRGB Picture
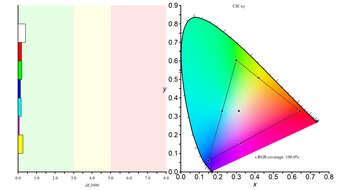
sRGB xy
Color Gamut ARGB Picture
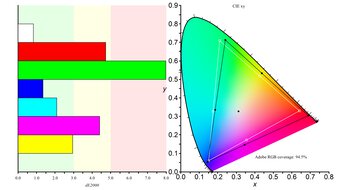
Adobe RGB xy
sRGB Picture Mode
Adobe RGB Picture Mode
SDR Color Volume
sRGB Color Volume ITP Picture
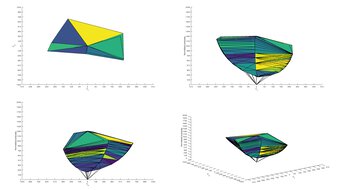
sRGB In ICtCp
Adobe RGB Color Volume ITP Picture
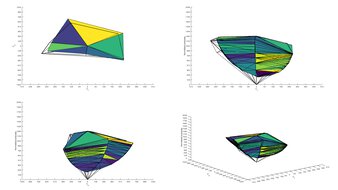
Adobe RGB In ICtCp
sRGB Picture Mode
Adobe RGB Picture Mode
HDR Color Gamut
Wide Color Gamut
Color Gamut DCI-P3 Picture
DCI P3 xy
Color Gamut Rec.2020 Picture
Rec. 2020 xy
DCI P3 Picture Mode
Rec. 2020 Picture Mode
HDR Color Volume
P3 Color Volume ITP Picture
DCI-P3 In ICtCp
2020 Color Volume ITP Picture
Rec. 2020 In ICtCp
DCI P3 Picture Mode
Rec. 2020 Picture Mode
Image Retention
Image Retention Picture

IR After 0 Min Recovery
IR After 2 Min Recovery
IR After 4 Min Recovery
IR After 6 Min Recovery
IR After 8 Min Recovery
IR After 10 Min Recovery
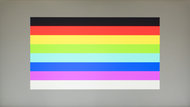
Gradient
Gradient Picture

Color Depth
Color Bleed
Color Bleed Horizontal
Pixel Row Error
Color Bleed Vertical
Pixel Column Error
Reflections
Average Room

Average Room Off Picture

Bright Room Off Picture

Screen Finish
Total Reflections
Indirect Reflections
Calculated Direct Reflections
Text Clarity
ClearType On

Pixel Type
ClearType Off

Pixels
Sub-Pixel Layout
Motion
Response Time @ Max Refresh Rate
Motion Blur Picture

Motion Blur Picture
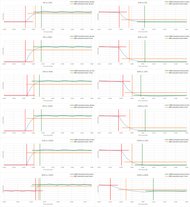
Response Time Chart
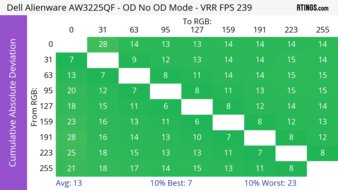
Response Time Table
Best Overdrive Setting
Rise / Fall Time
Total Response Time
Overshoot Error
Dark Rise / Fall Time
Dark Total Response Time
Dark Overshoot Error
Response Time @ 60Hz
Motion Blur Picture

Response Time Table
Best Overdrive Setting
Rise / Fall Time
Total Response Time
Overshoot Error
Dark Rise / Fall Time
Dark Total Response Time
Dark Overshoot Error
Image Flicker
Backlight Picture

Flicker-Free
PWM Dimming Frequency
Black Frame Insertion (BFI)
BFI Picture

BFI Frequency Picture

BFI Maximum Frequency
BFI Minimum Frequency
Black Frame Insertion (BFI)
Black Frame Insertion (BFI)
BFI Picture
BFI Frequency Picture
BFI Maximum Frequency
BFI Minimum Frequency
Refresh Rate
Variable Refresh Rate
Native
Max Refresh Rate
Factory Overclock
Variable Refresh Rate
FreeSync
G-SYNC
VRR Maximum
VRR Minimum
VRR Maximum With OC
VRR Supported Connectors
Inputs
Input Lag
Native Resolution
Non-Native Res @ Native Refresh
Native Resolution @ 60Hz
Variable Refresh Rate
Variable Refresh Rate @ 60Hz
10 Bit HDR
Black Frame Insertion (BFI)
Resolution And Size
Native Resolution
Aspect Ratio
Megapixels
Pixel Density
Screen Diagonal
Screen Area
Inputs
Inputs 1

Inputs 2

Total Inputs
DisplayPort
Mini DisplayPort
HDMI
DVI
VGA
DisplayPort Out
USB
USB C
Analog Audio Out 3.5mm
Microphone In 3.5mm
Digital Optical Audio Out
Analog Audio Out RCA
Power Supply
Features
Additional Features
RGB Illumination
Speakers
HDR10
Multiple Input Display
On-Screen Display (OSD)
OSD Picture

Controls
Controls Picture

In The Box
In The Box Picture

Check Price
25"
XL2540
SEE PRICE
Amazon
27"
U2715H
SEE PRICE
Amazon
25"
XL2540
SEE PRICE
BestBuy.com
27"
U2715H
SEARCH
B&H
25"
XL2540
SEE PRICE
Walmart.com
27"
U2715H
SEARCH
BestBuy.com
25"
XL2540
SEARCH
B&H
27"
U2715H
SEARCH
Dell
25"
XL2540
SEARCH
BenQ
27"
U2715H
SEARCH
Walmart.com
BenQ ZOWIE XL2540
Dell U2715H
Comments
BenQ ZOWIE XL2540 vs Dell U2715H: Main Discussion
What do you think of these products? Let us know below.
Looking for a personalized buying advice from the RTINGS.com experts? Members have direct access to buying advice on our member forum.