Products
Tested using Methodology v0.12
Updated Jun 16, 2026 04:00 PM
Tested using Methodology v0.13
Updated Jun 30, 2026 08:25 PM

Our Verdict
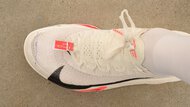
Nike Alphafly 3
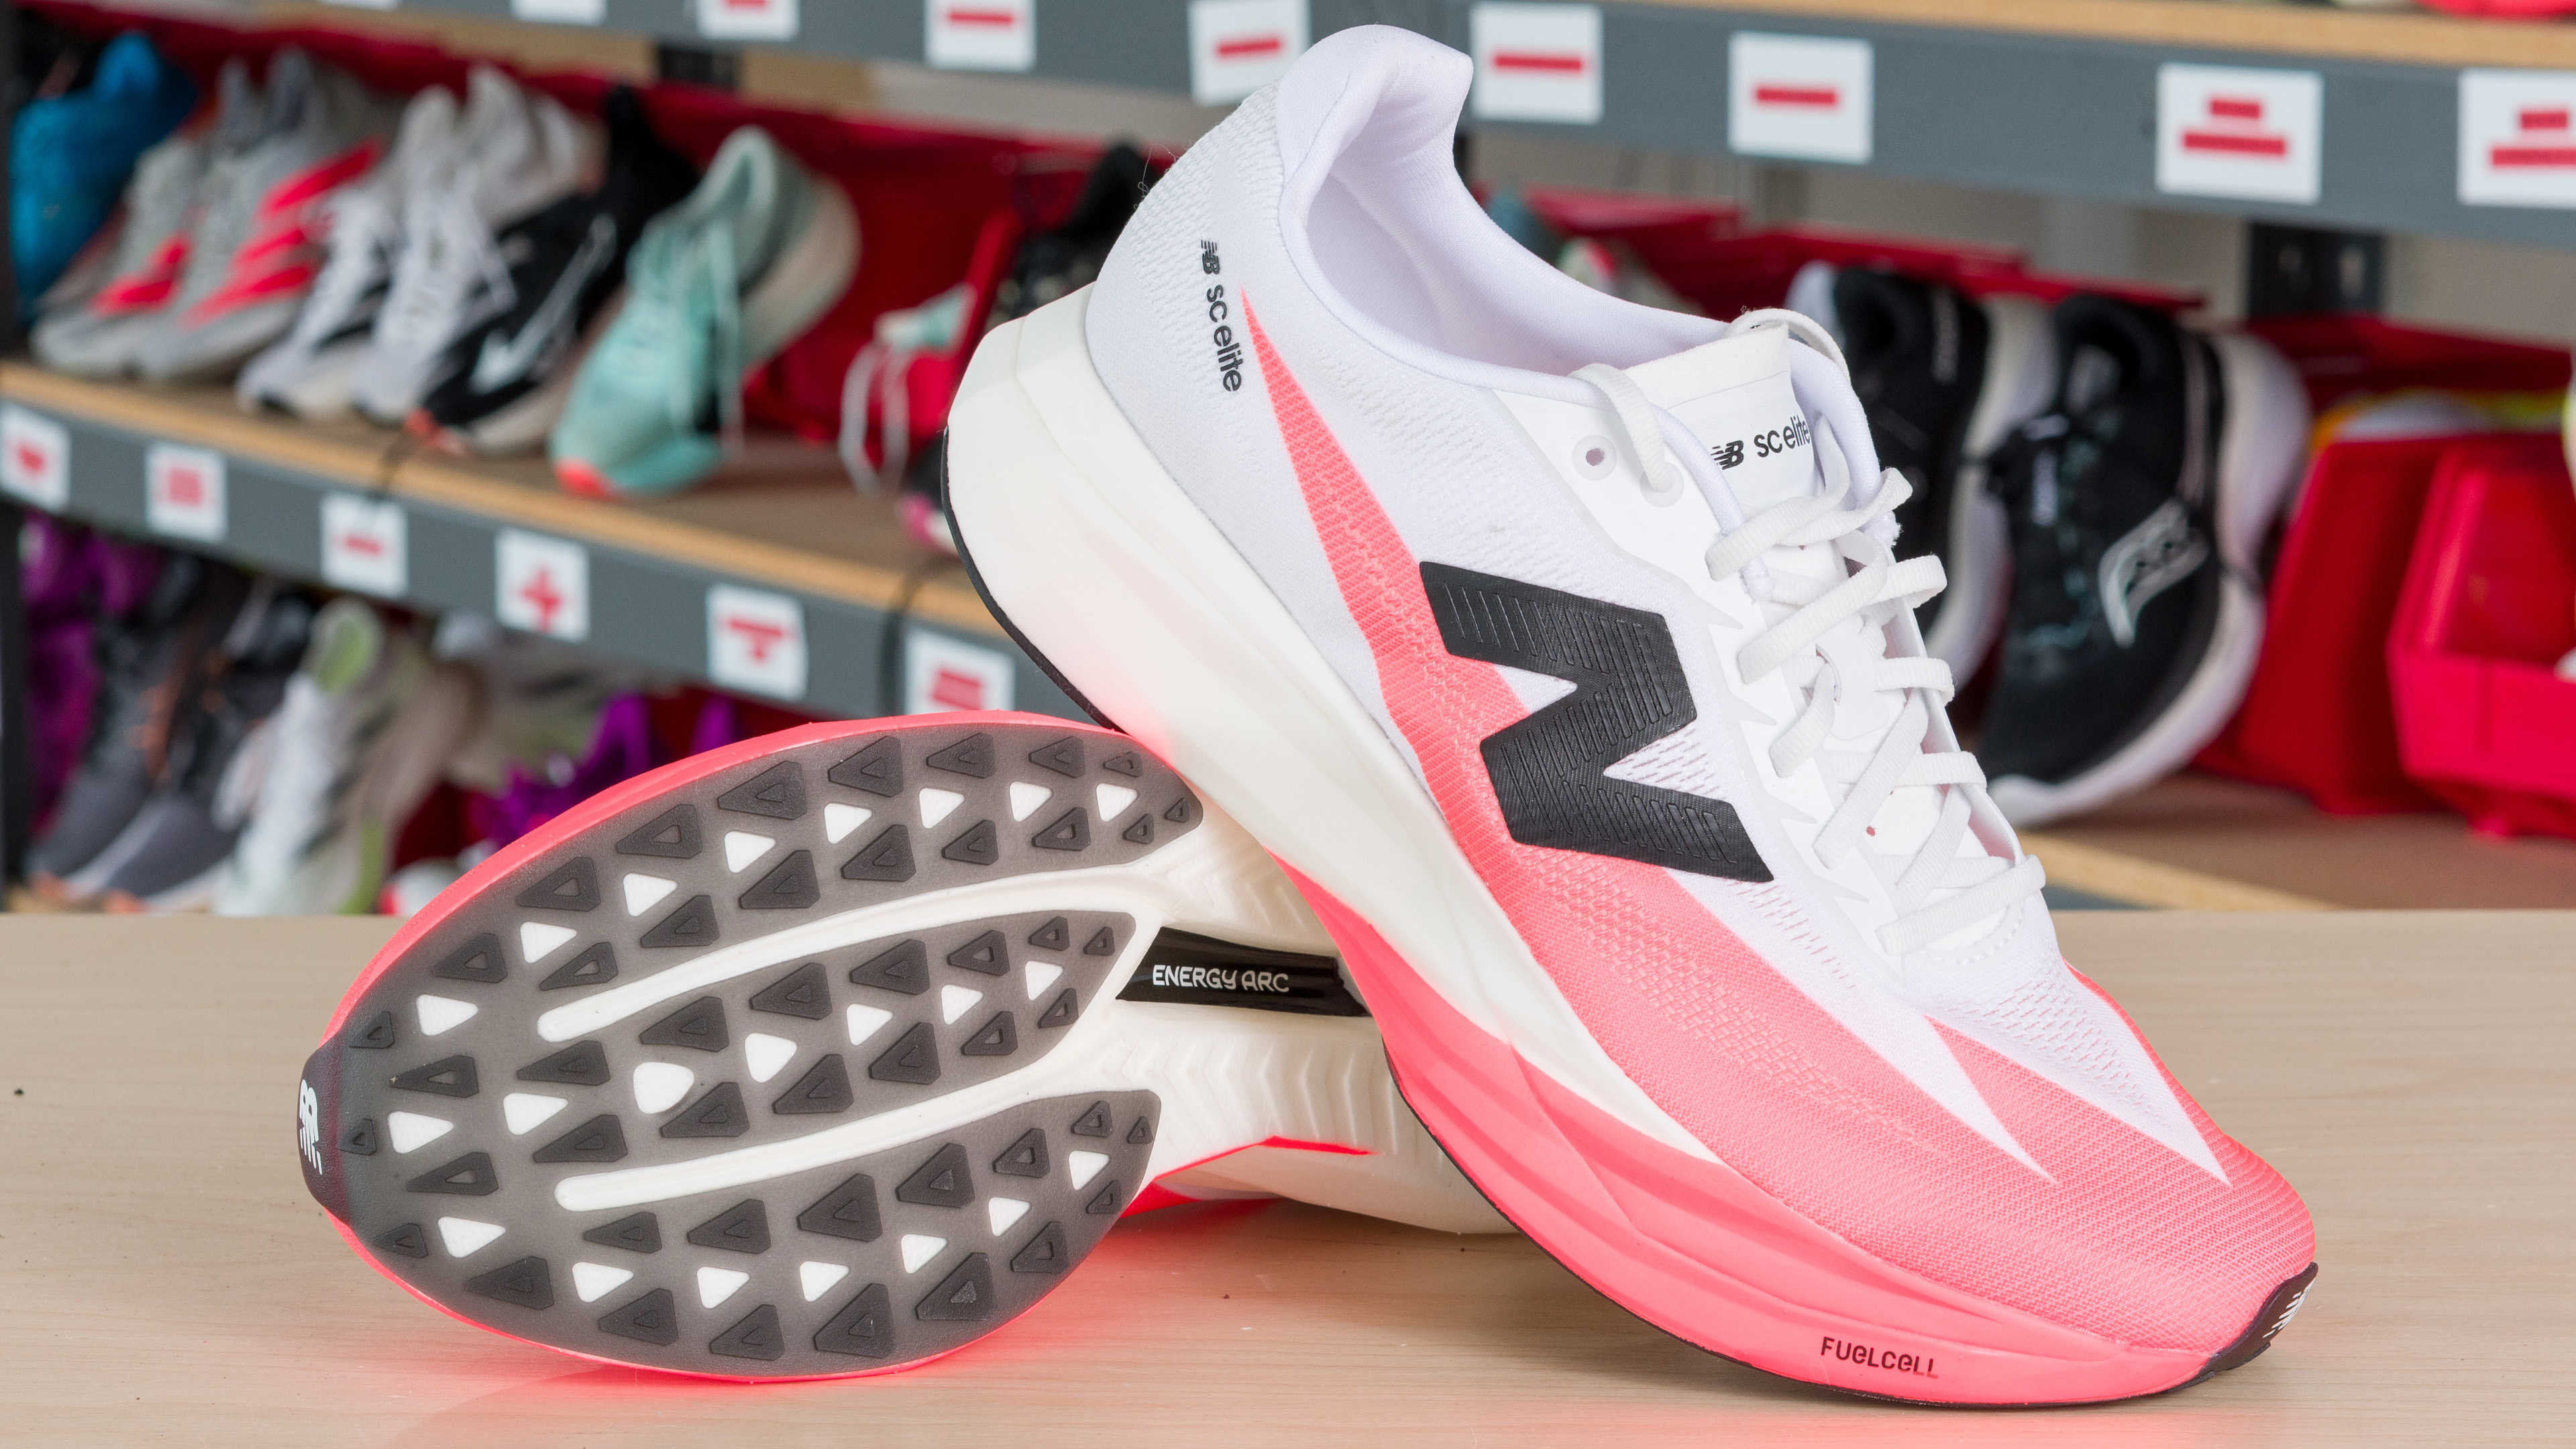
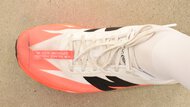
New Balance FuelCell SuperComp Elite v5
The Nike Alphafly 3 and New Balance FuelCell SuperComp Elite v5 are two popular racing shoes built around different principles. The Alphafly 3 is purpose-built for the marathon, featuring cushioning that holds up better over long distances and a broader platform that provides more stability when form breaks down late in the marathon. Whereas Nike has three different racing shoes, each built for different distances, the Elite v5 is New Balance's only super shoe, meant to be a do-it-all racer for everything from 5ks up to marathons. As such, it has lots of tradeoffs: its cushioning isn't as protective over long distances, but its firmness helps maintain higher turnover in shorter races. It returns energy more efficiently than the Alphafly 3, but is less stable, meaning that stabiliser muscles will be recruited earlier in the race.
Variants
- Alphafly 3 (Black/Olive Aura/Metallic Silver - (Men - US 9))
- Alphafly 3 (Bright Crimson/Lime Blast/Mint Foam/Cave Purple - (Men - US 9))
- FuelCell SuperComp Elite v5 (Urgent Red/White/Black - (Men - US 9))
- FuelCell SuperComp Elite v5 (Urgent Red/White/Black - (Women - US 7))
Main Differences for
Half/Full Marathon Racing
Threshold
Half/Full Marathon Racing
Full Comparison
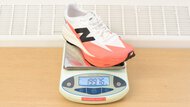
Weight
Right Shoe Weight Photo

Left Shoe Weight Photo

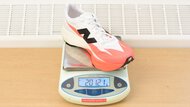
Weight
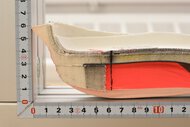
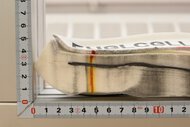
Stack Heights
Stack Height Photo

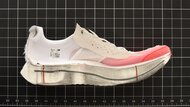
Heel Stack Height
Forefoot Stack Height
Heel-To-Toe Drop
Advertised Heel-To-Toe Drop
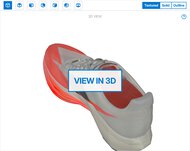
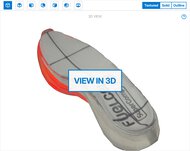
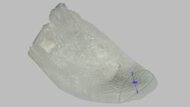
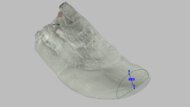
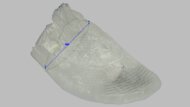
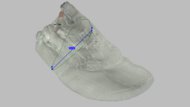
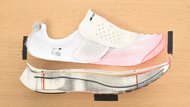
External Shape
3D Model Full Shoe

Outsole Heel Width
Outsole Arch Width
Outsole Forefoot Width
Heel Width-To-Stack Ratio
Forefoot Width-To-Stack Ratio
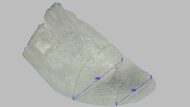
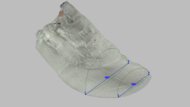
Internal Shape
3D Model Internal

Internal Length
Internal Heel Width
Internal Forefoot Width
Wide Sizing Available
Forefoot Fit: Width
Forefoot Width Photo
Ball-Of-Foot TTS Deviation
Toe TTS Deviation
Forefoot Fit: Height
Forefoot Height Photo
Toe TTS Deviation
Arch Fit: Width
Arch Fit Photo
Arch Width TTS Deviation
Length Fit
Toe Clearance Photo
Heel Rocker Geometry
Heel Rocker Photo
Heel Spring
Heel Apex Position
Heel Rocker Angle
Forefoot Rocker Geometry
Forefoot Rocker Photo
Toe Spring
Toe Apex Position
Forefoot Rocker Angle
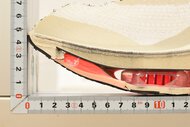
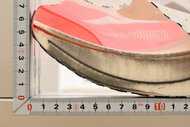
Foam
Primary Foam Picture
Secondary Foam Picture

Primary Foam Name
Primary Foam Type
Secondary Foam Name
Secondary Foam Type
Other Features
Other Features Photo

Tongue Gusset Type
Plate
Heel Compression Energy Return
Heel Compression Video
Heel Energy Return
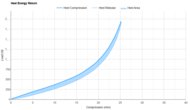
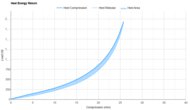
Heel Energy Return
Forefoot Compression Energy Return
Forefoot Compression Video
Forefoot Energy Return
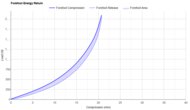
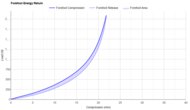
Forefoot Energy Return
Heel Cushioning
Heel Cushioning Picture


Heel Cushioning
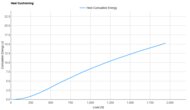
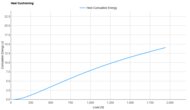
Energy Absorbed At 550N
Energy Absorbed At 1100N
Energy Absorbed At 1900N
Forefoot Cushioning
Forefoot Cushioning Picture


Forefoot Cushioning
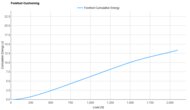
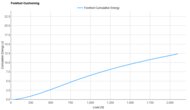
Energy Absorbed At 800N
Energy Absorbed At 1300N
Energy Absorbed At 2050N
Heel Firmness
Heel Firmness Graph
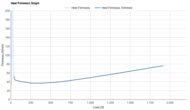
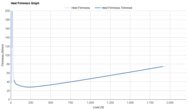
Firmness At 550N
Firmness At 1100N
Firmness At 1900N
Forefoot Firmness
Forefoot Firmness Graph
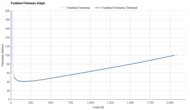
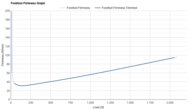
Firmness At 800N
Firmness At 1300N
Firmness At 2050N
Forefoot Long Run Cushioning
Forefoot Long Run Cushioning
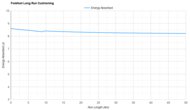
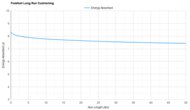
Energy Absorbed At 10km
Energy Absorbed At 20km
Energy Absorbed At 30km
Energy Absorbed At 40km
Rocker Stiffness
Forefoot Rocker Stiffness Video
Forefoot Rocker Stiffness Graph
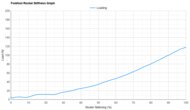
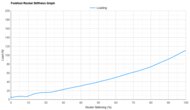
Force To Flatten The Rocker
Forefoot Bending Energy Return
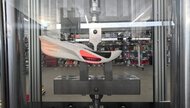
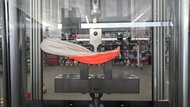
Forefoot Bending Video
Forefoot Bending Energy Return
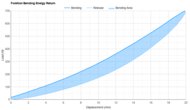
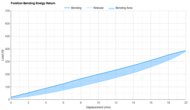
Forefoot Bending Energy Return
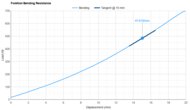
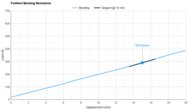
Forefoot Bending Stiffness
Forefoot Bending Resistance Picture
Forefoot Bending Resistance
Nike Alphafly 3
New Balance FuelCell SuperComp Elite v5
Comments
Nike Alphafly 3 vs New Balance FuelCell SuperComp Elite v5: Main Discussion
What do you think of these products? Let us know below.
Looking for a personalized buying advice from the RTINGS.com experts? Members have direct access to buying advice on our member forum.