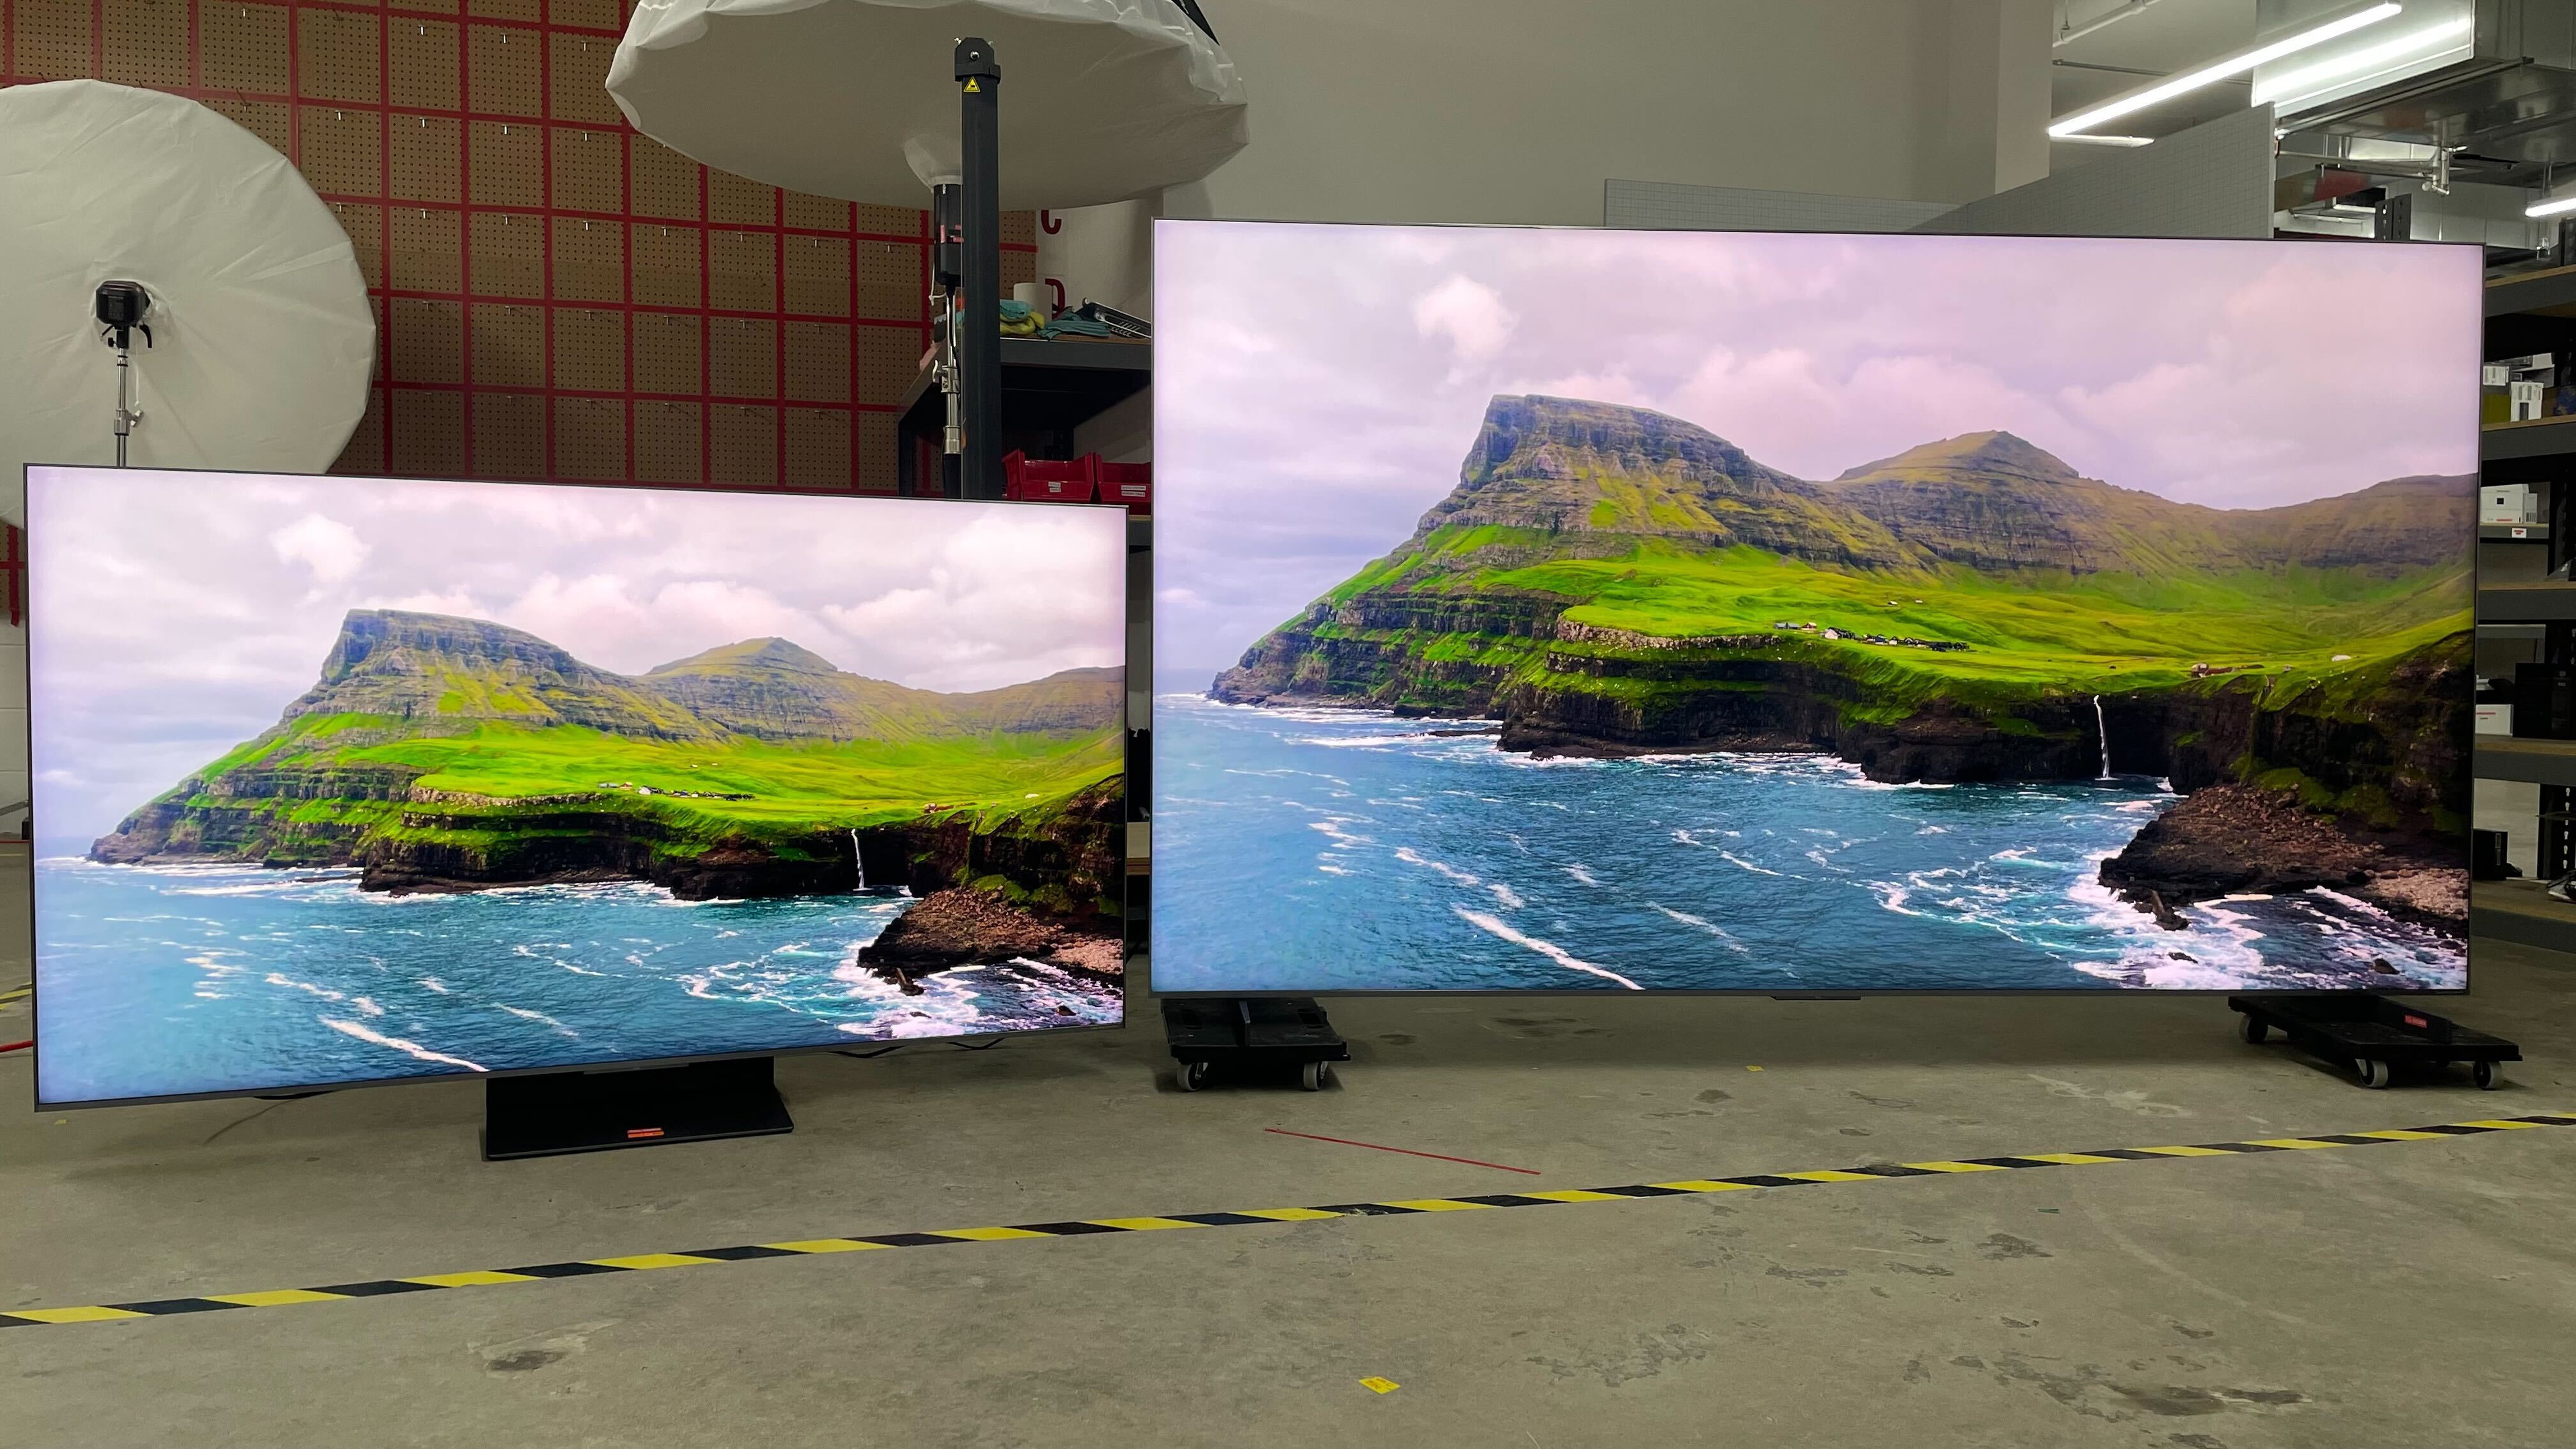
The TCL QM8K is one of the most popular new TVs of 2025, and for good reason. Its Mini LED backlight delivers incredibly bright highlights, vivid colors, and fantastic contrast, closing the gap between Mini LED and OLED technology. It's also available in a range of sizes, from 65 inches up to 98 inches, so there's something for most setups. We originally tested the 65-inch TCL 65QM8K, but given the popularity of this model, we also decided to buy the 98-inch TCL 98QM8K to see how it compares to the smaller sizes.
We were impressed to find that TCL has done an impressive job of maintaining performance across different sizes. There are a few minor differences, of course, but overall, you'll get a very consistent experience no matter which size of the QM8K you choose. Below, we'll break down some of the key differences between them and how they impact the viewing experience. If you want to skip the analysis and go straight to the data, check out our compare tool instead.
Panel Technology
Before we get into the actual performance differences, let's start by taking a look at the underlying panel technology used on each model. Feel free to skip ahead to the Performance Differences section if you just want to see how they stack up against each other.
Panel Technology And SPD
| TCL 98QM8K | TCL 65QM8K |
|---|---|
 |
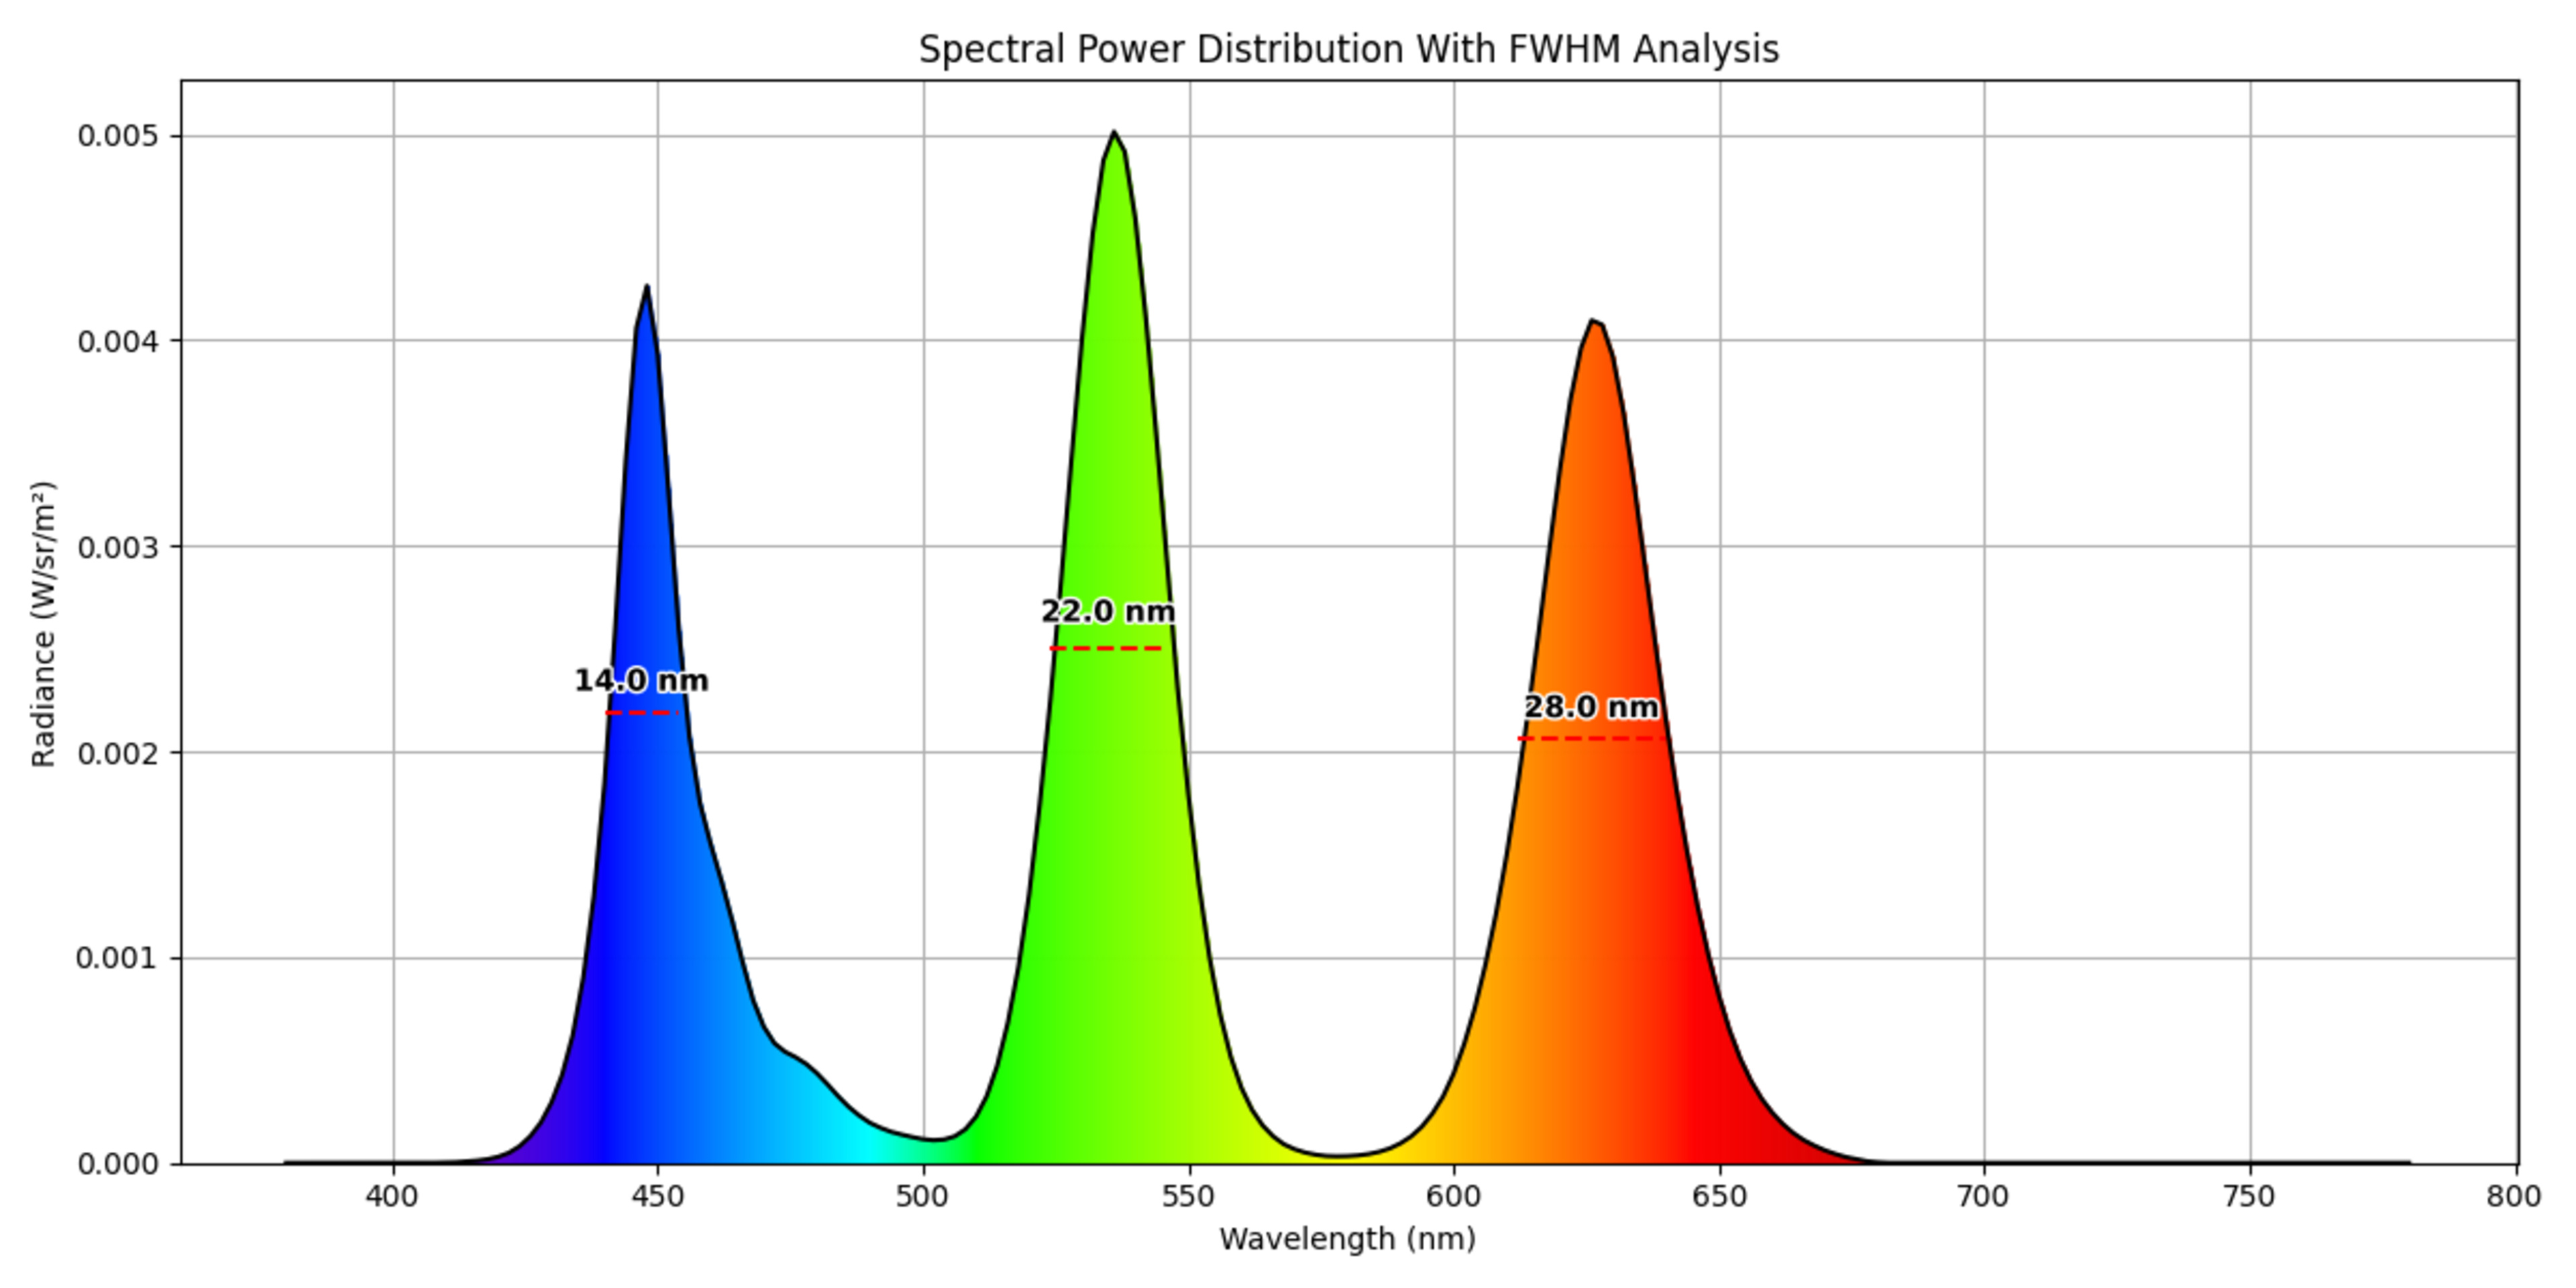 |
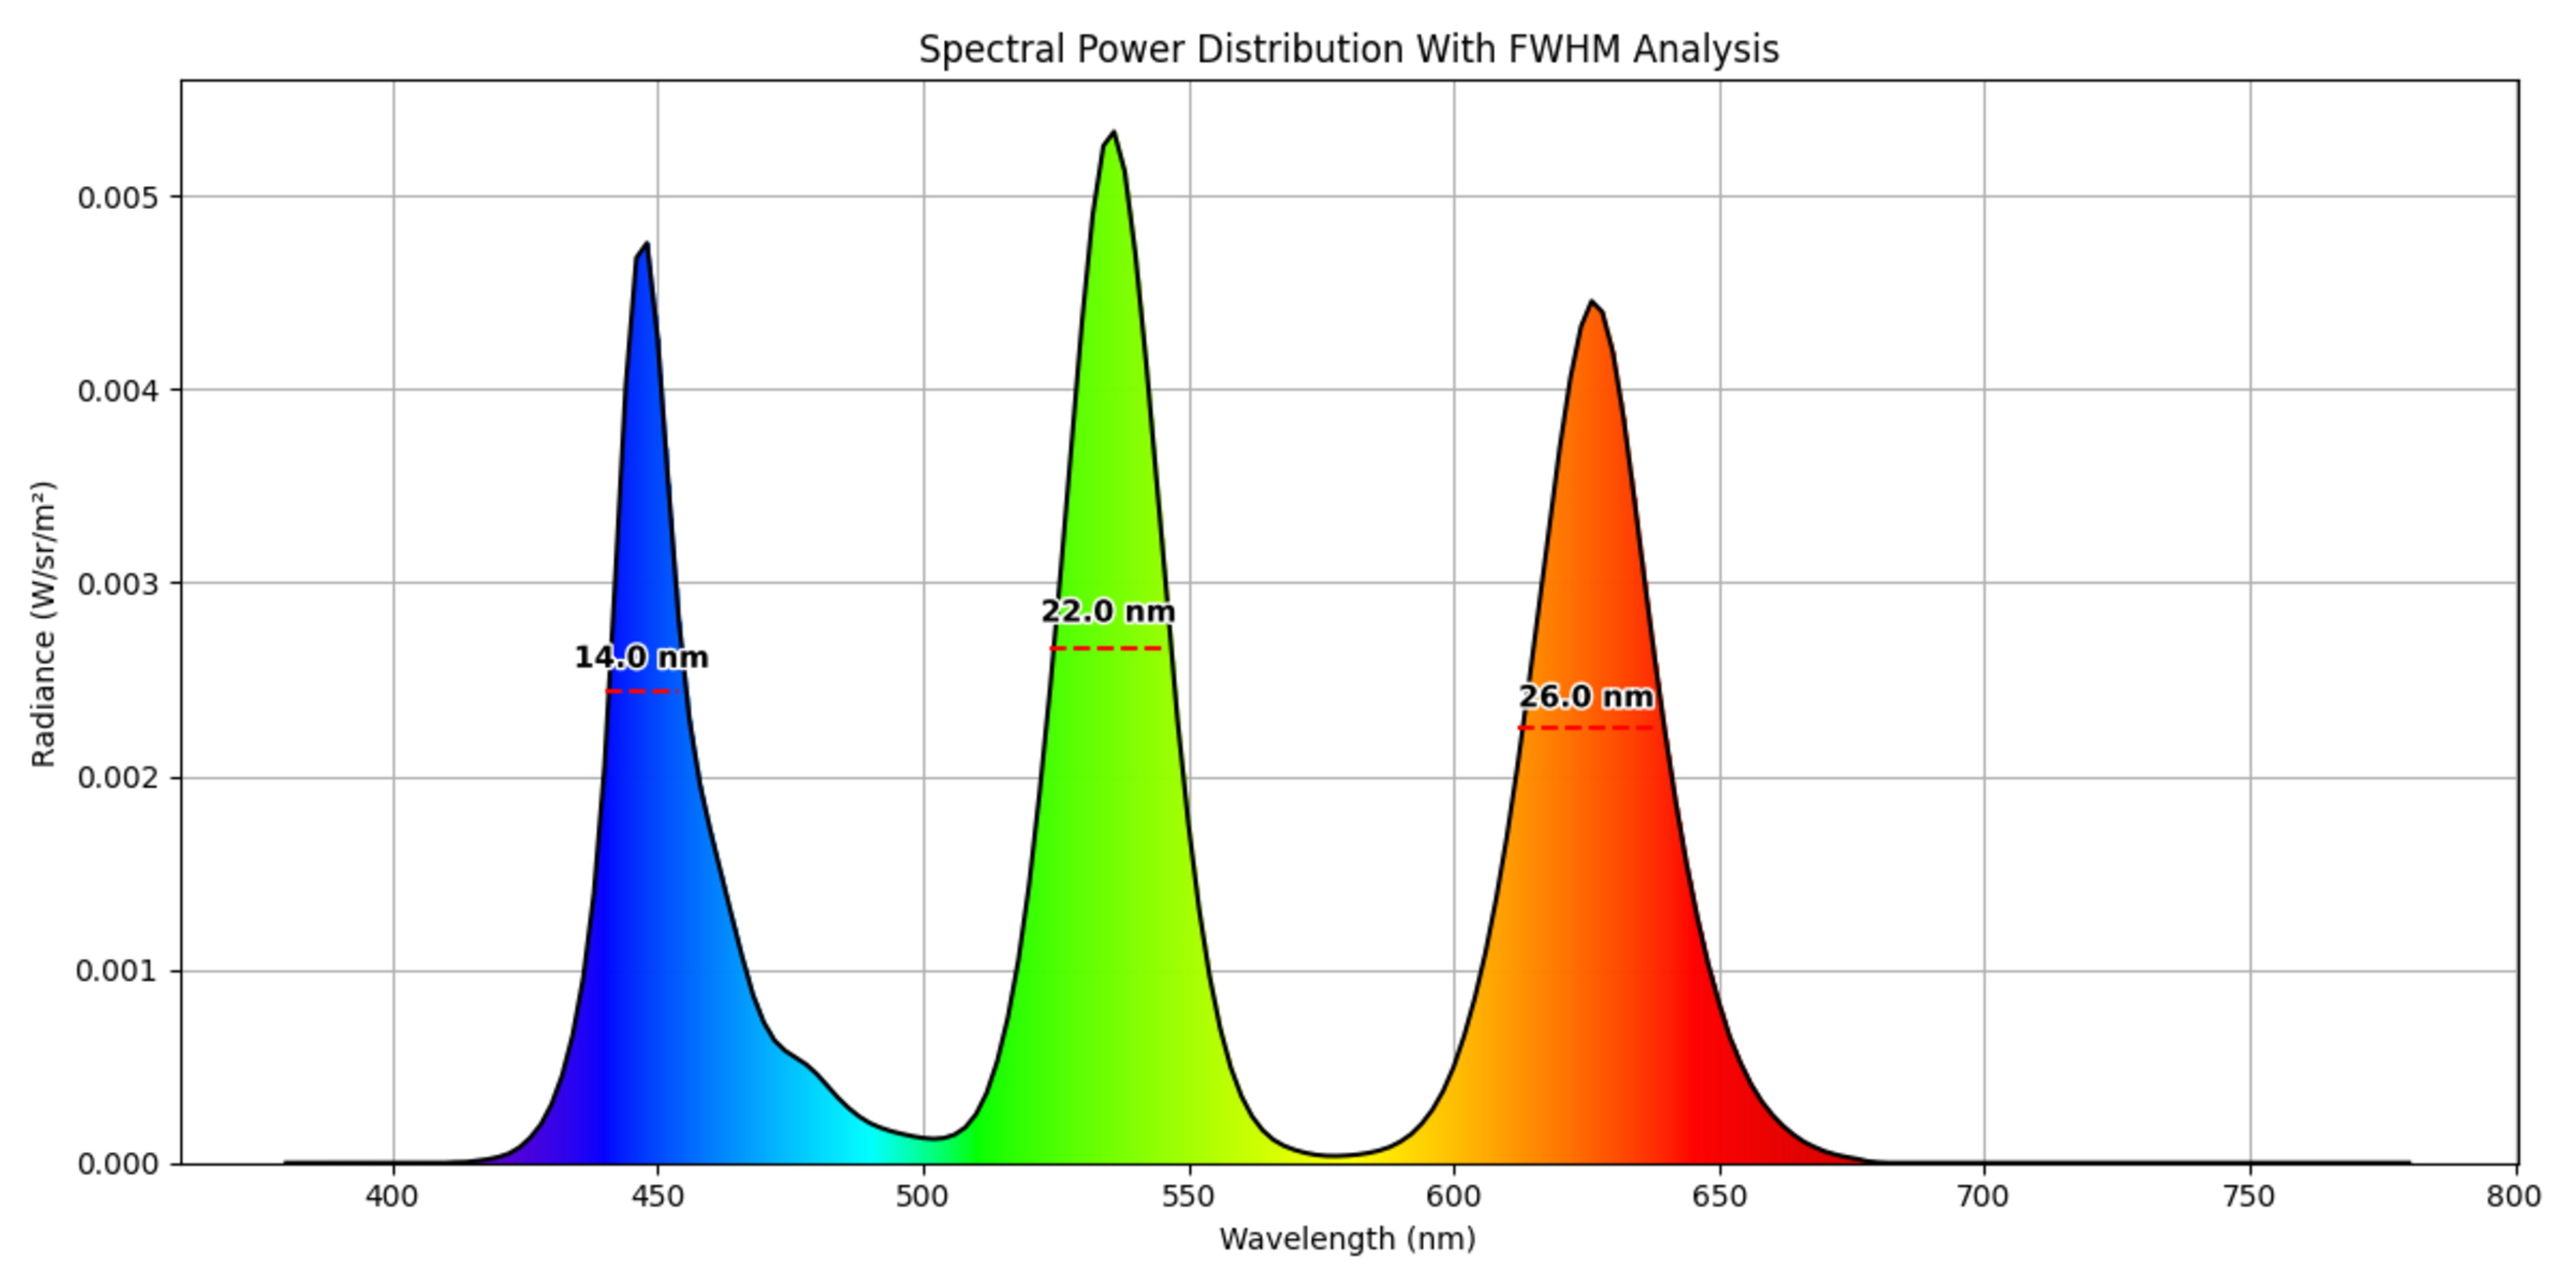
The panels used for these two TVs are remarkably similar. There are some very minor differences in the electrical structure of the pixels, but they're nearly identical otherwise. Spectral analysis of the TV's white light output shows nearly identical spectral power distribution as well.
Performance Differences
Now that we've explored the technical differences between the panels, let's examine how these two TVs perform. It's normal for some metrics to change slightly even between individual units of the same size. This comparison will focus on the performance metrics that are directly impacted by the panel itself, so we won't talk about smart features or processing.
| TCL 98QM8K | TCL 65QM8K |
|---|---|
 |
 |
 |
 |
 |
 |
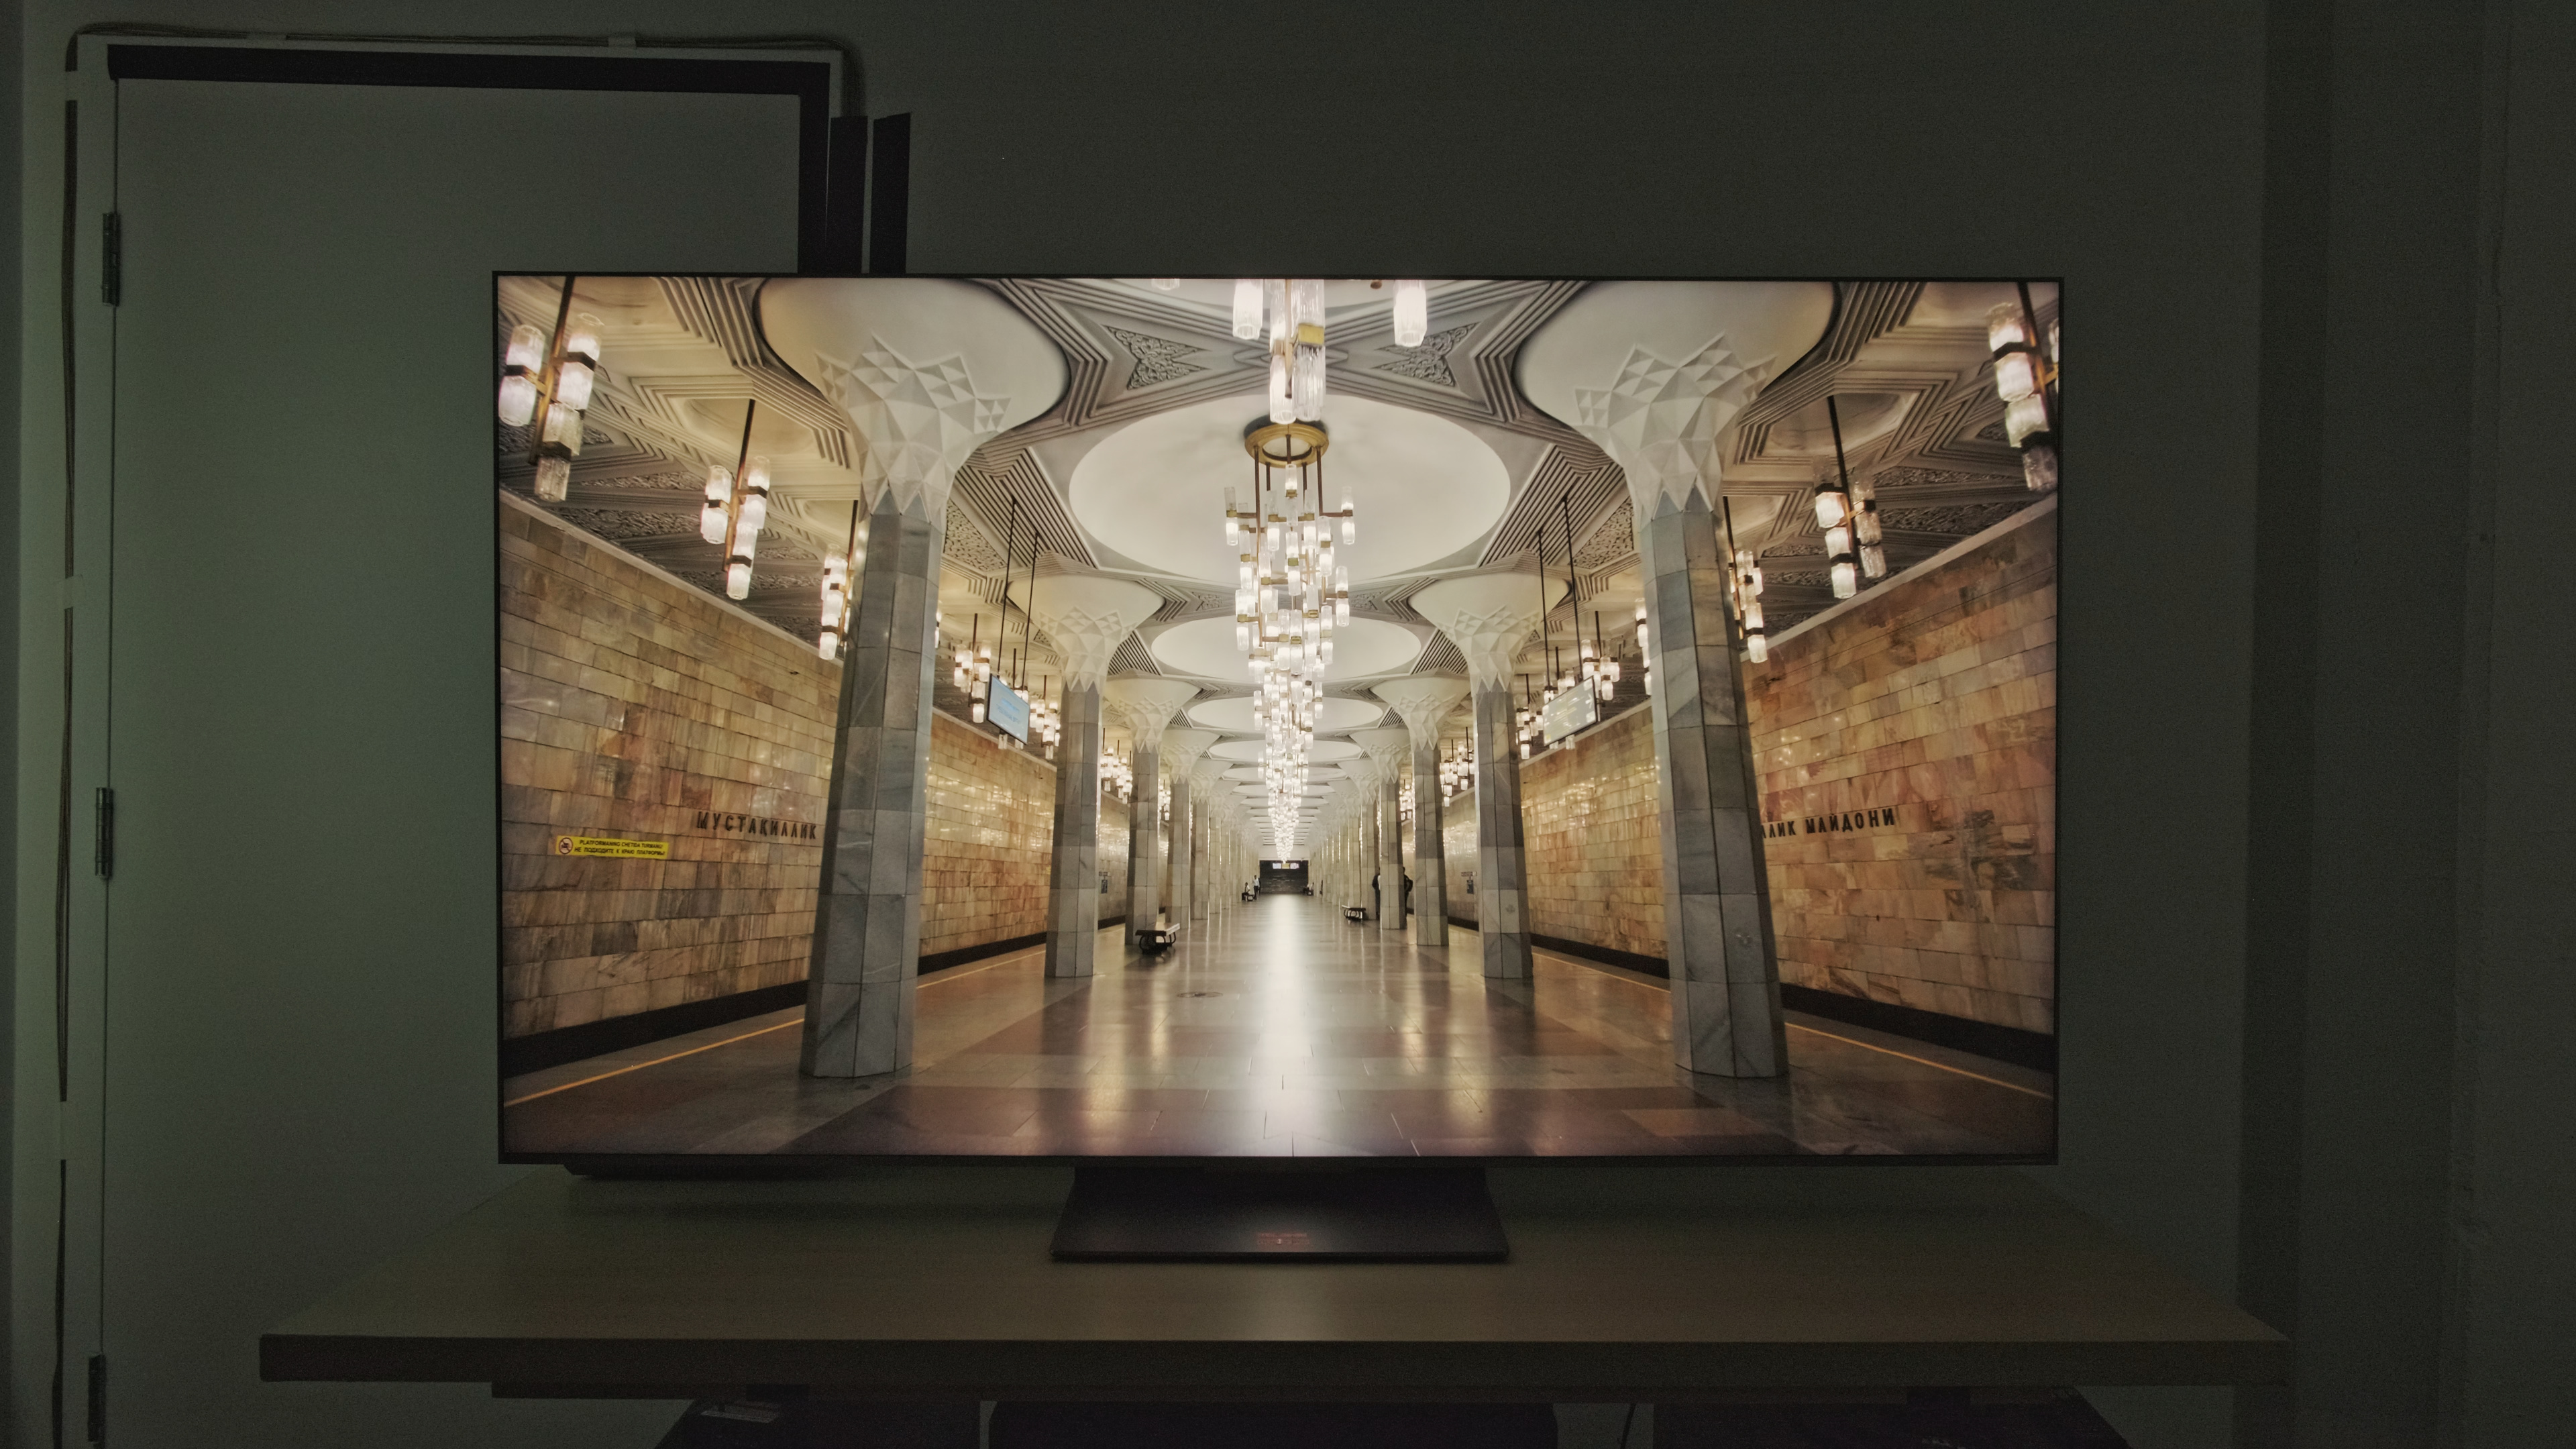
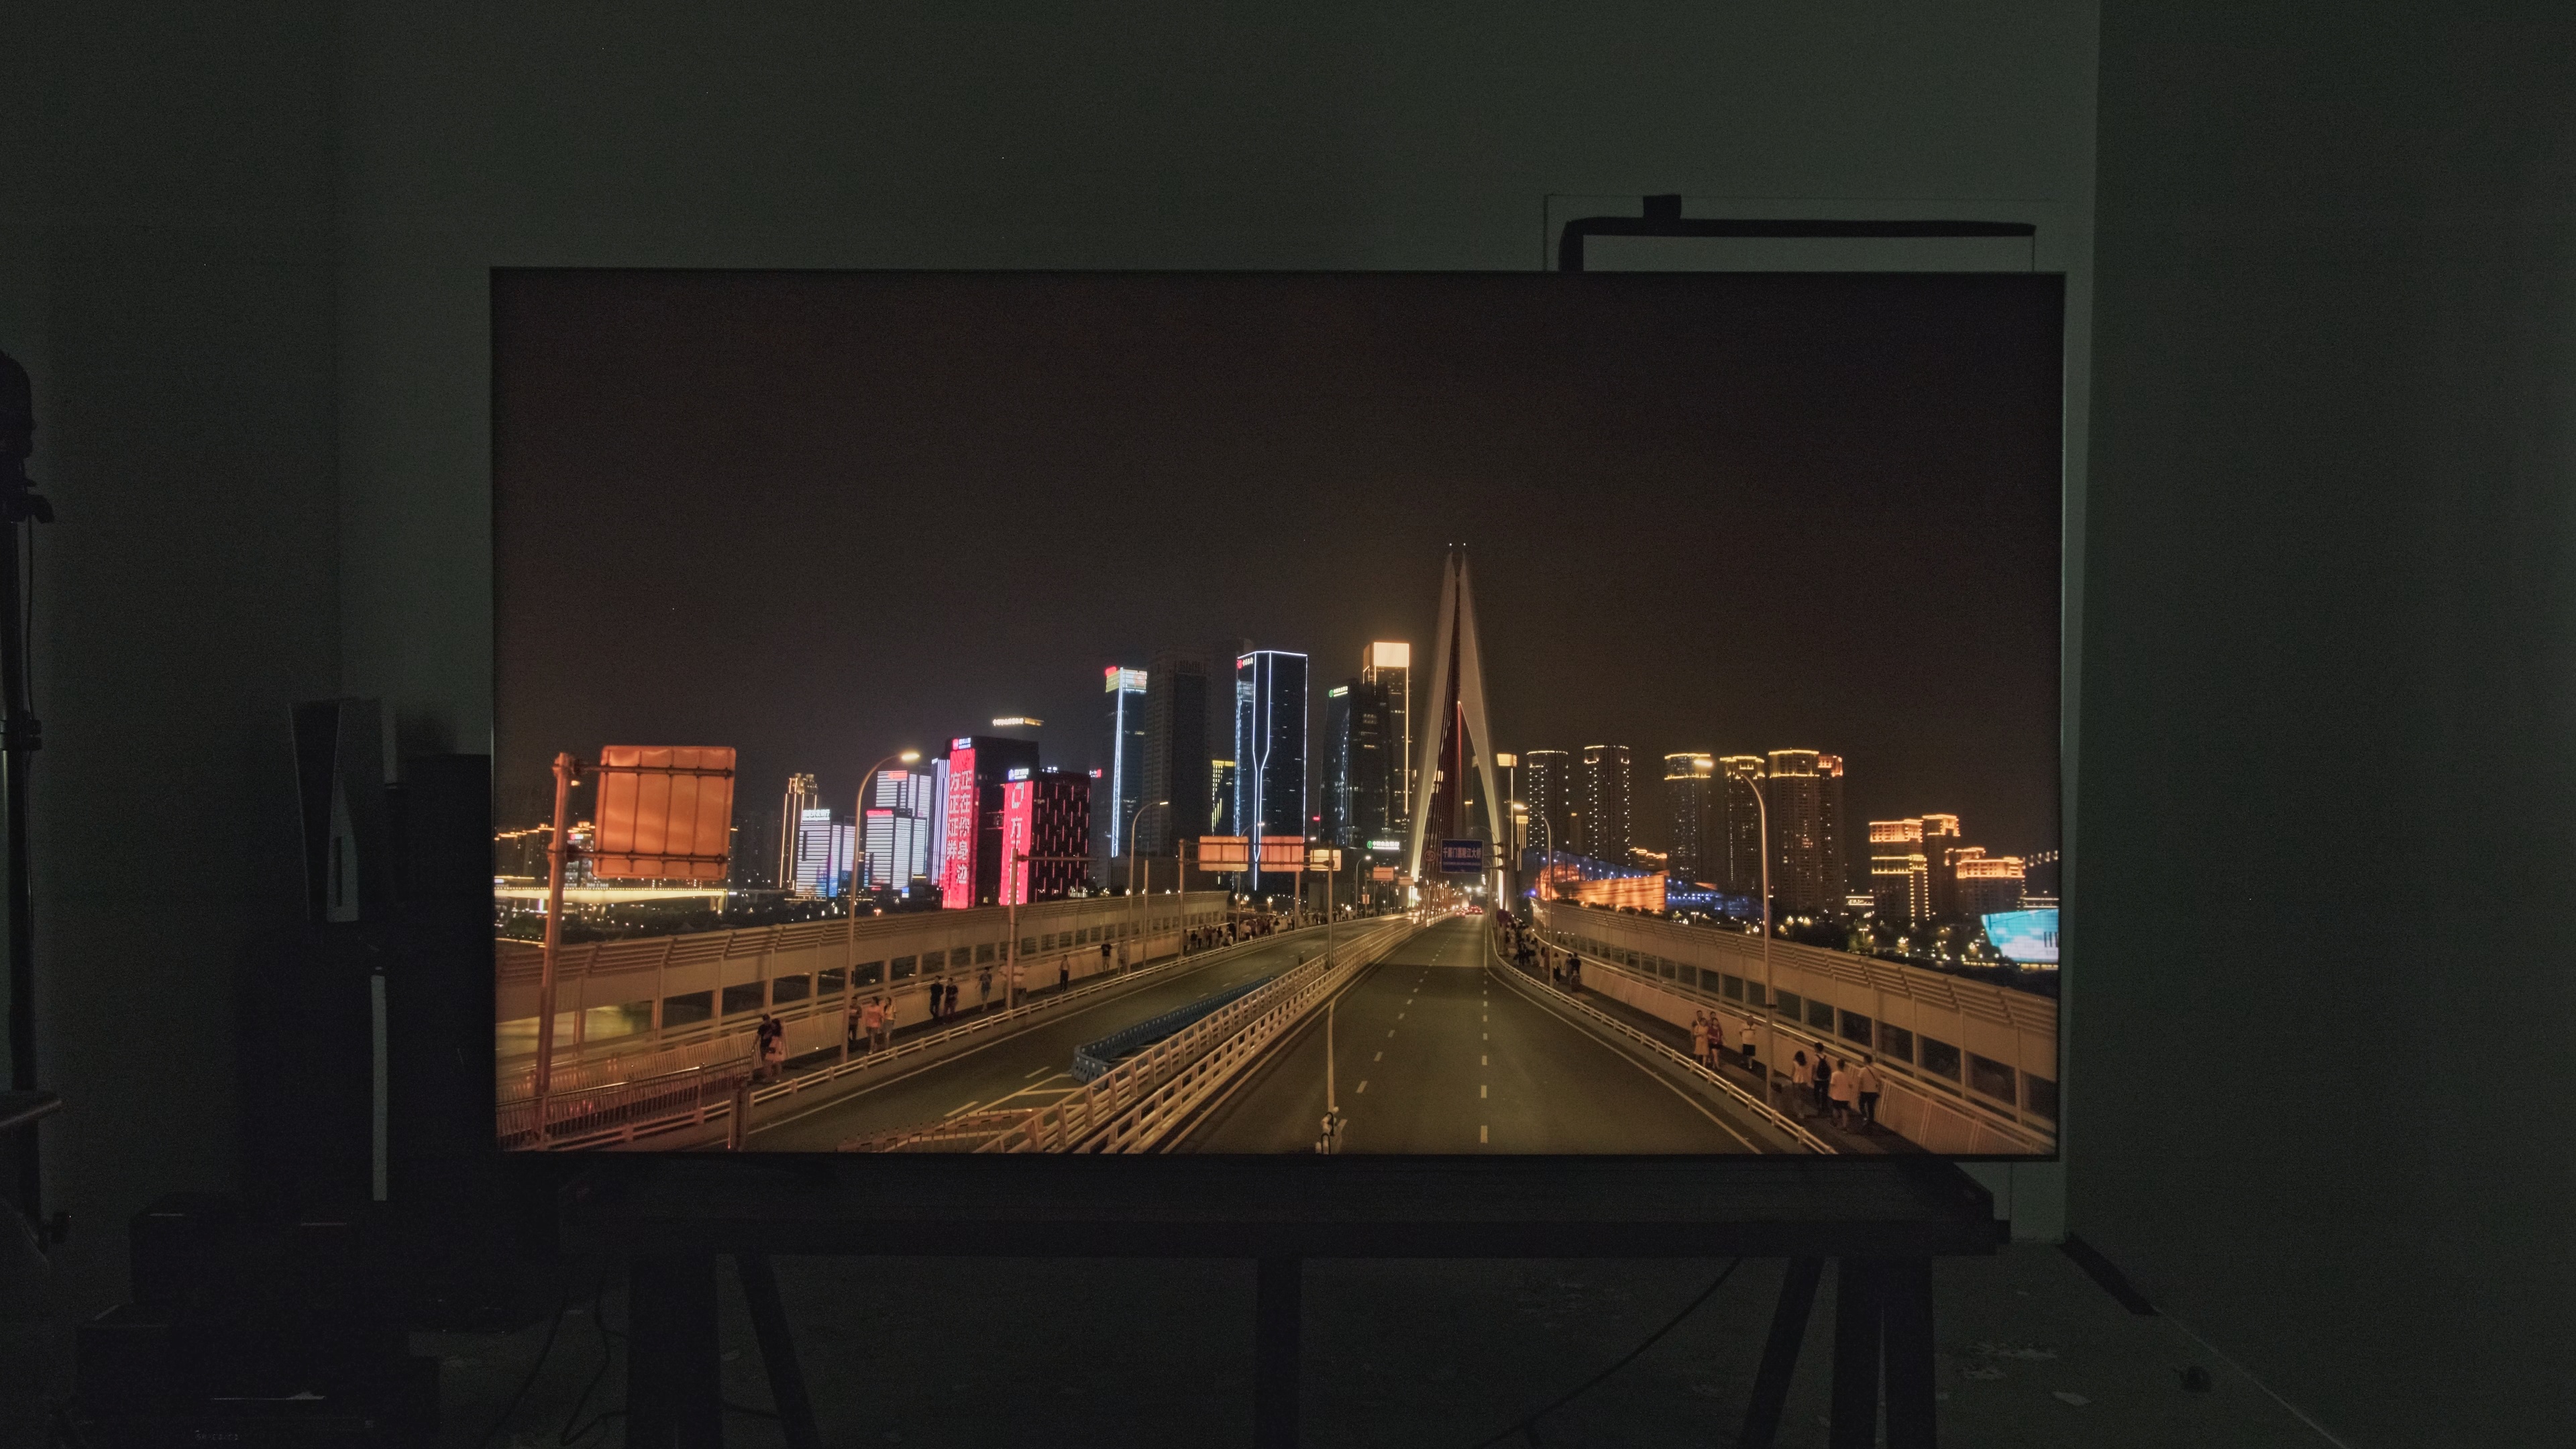
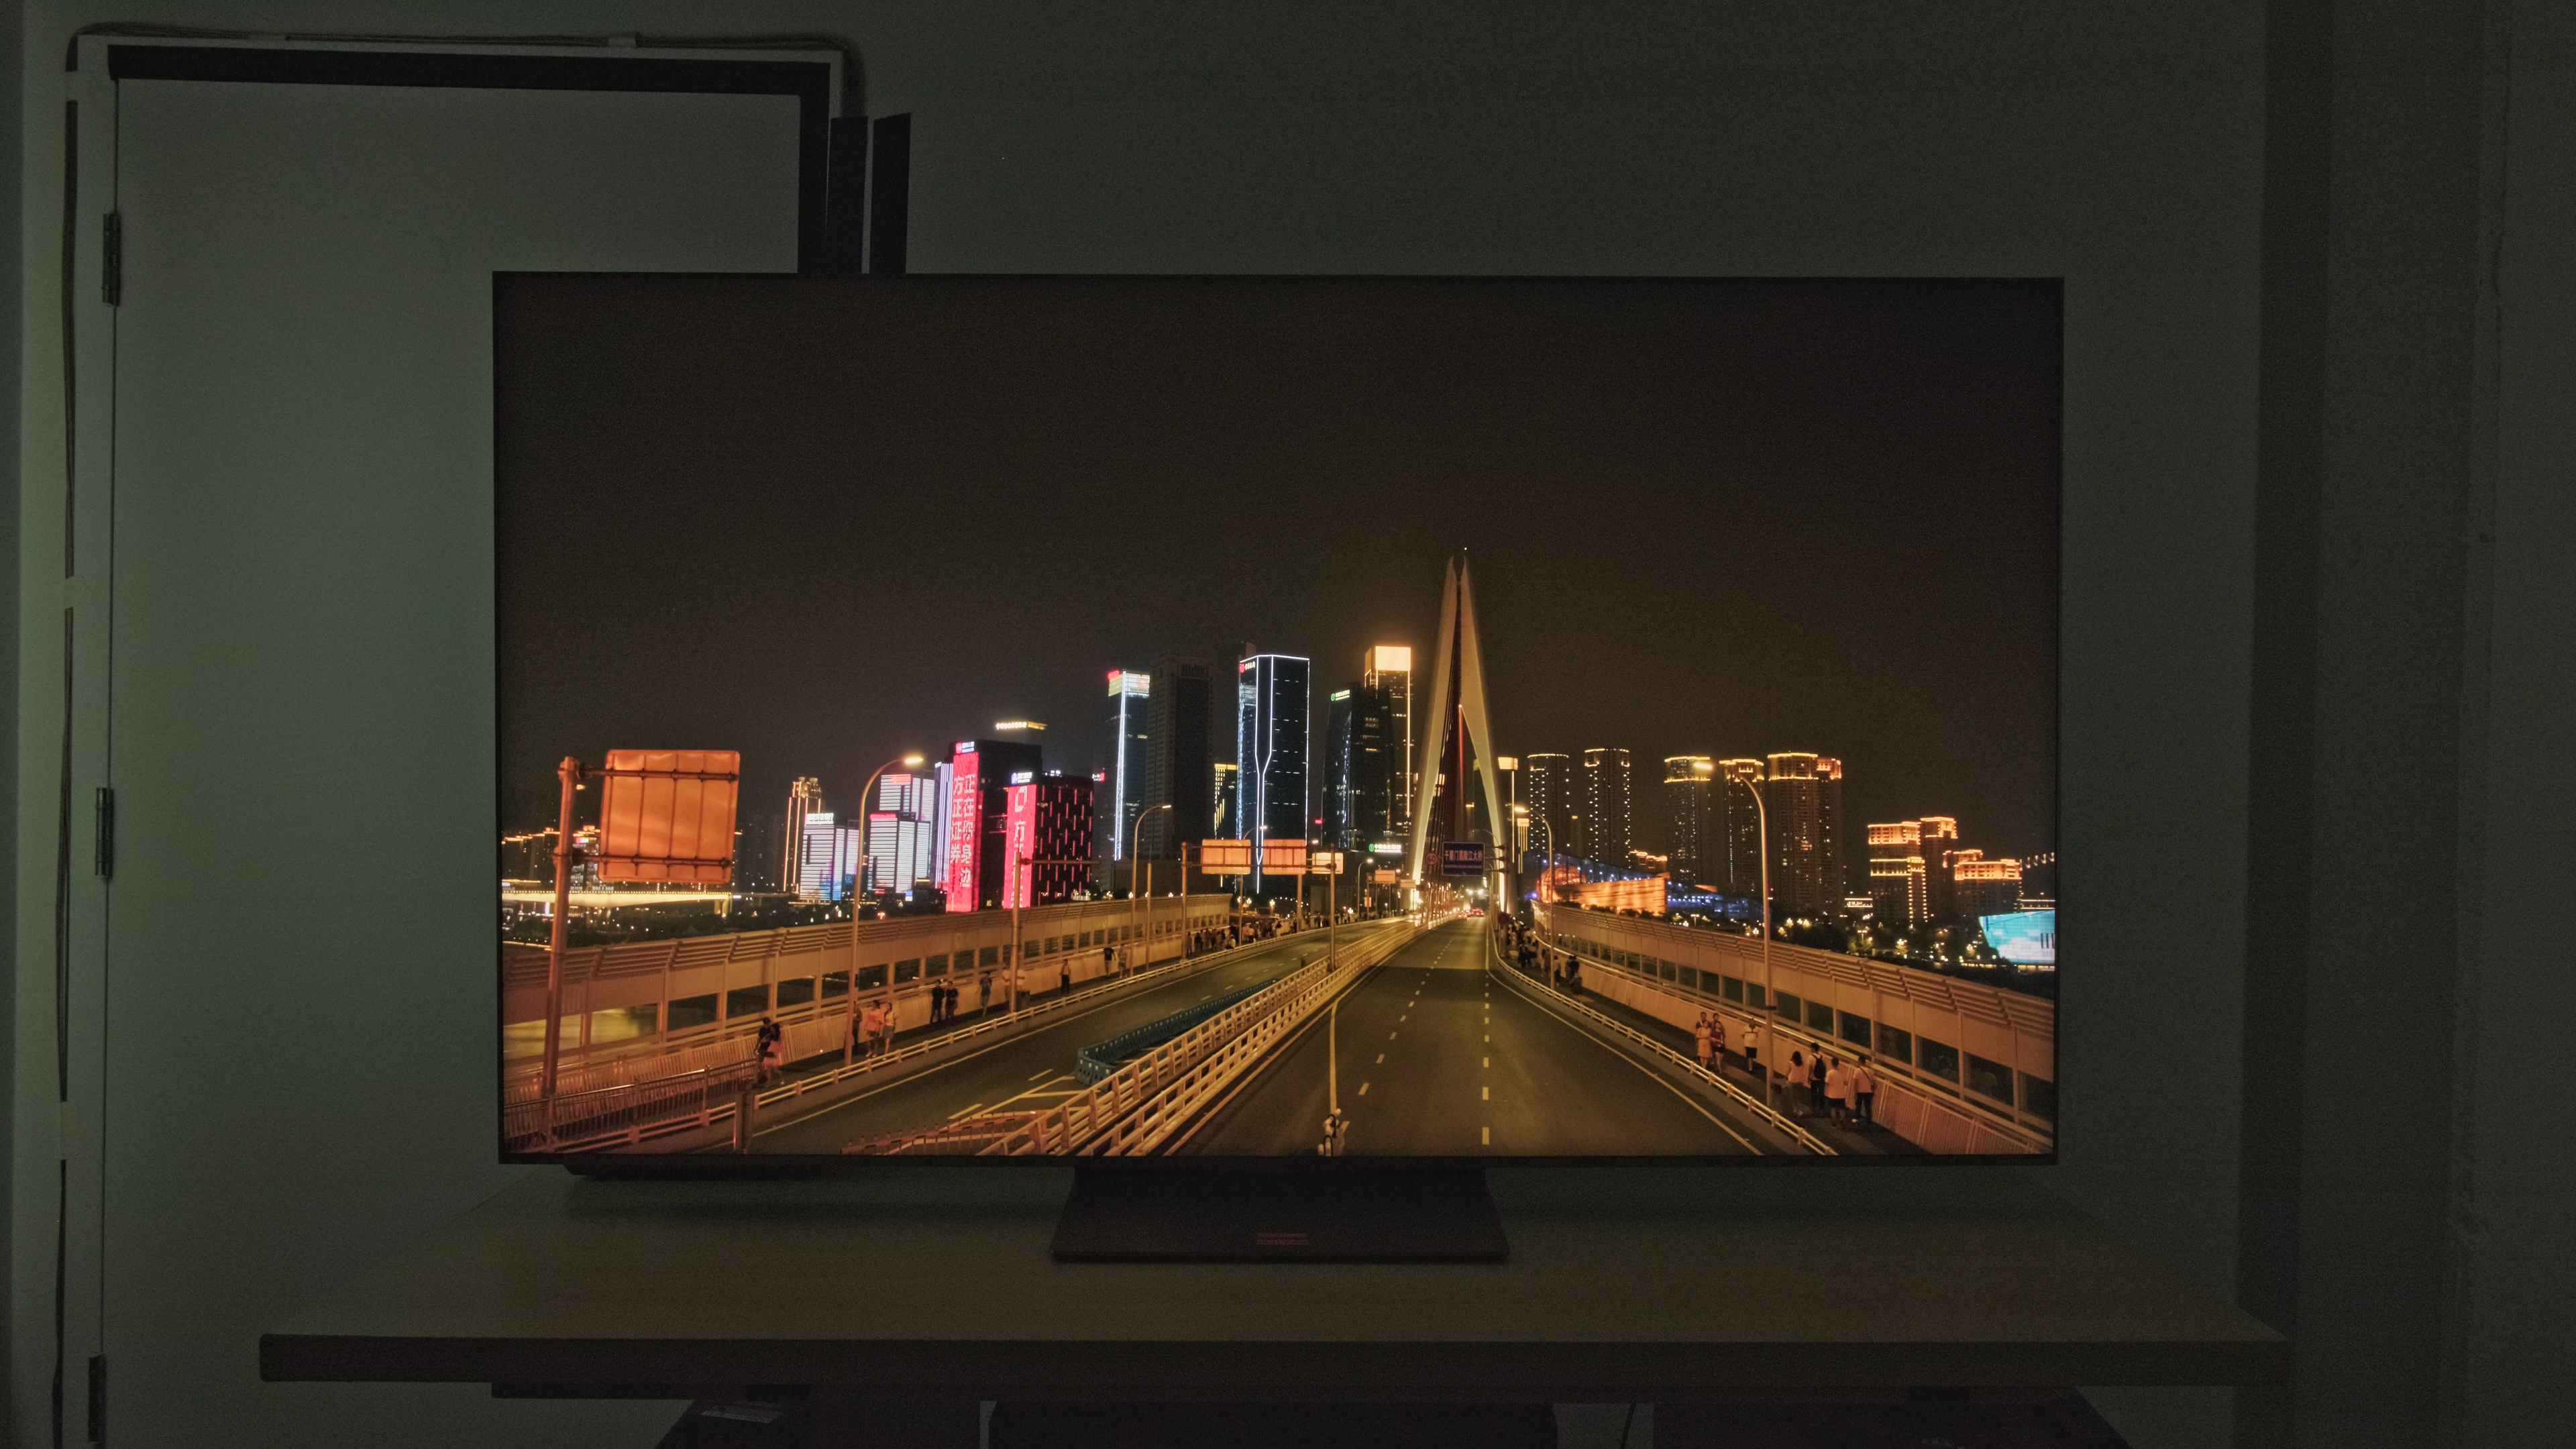
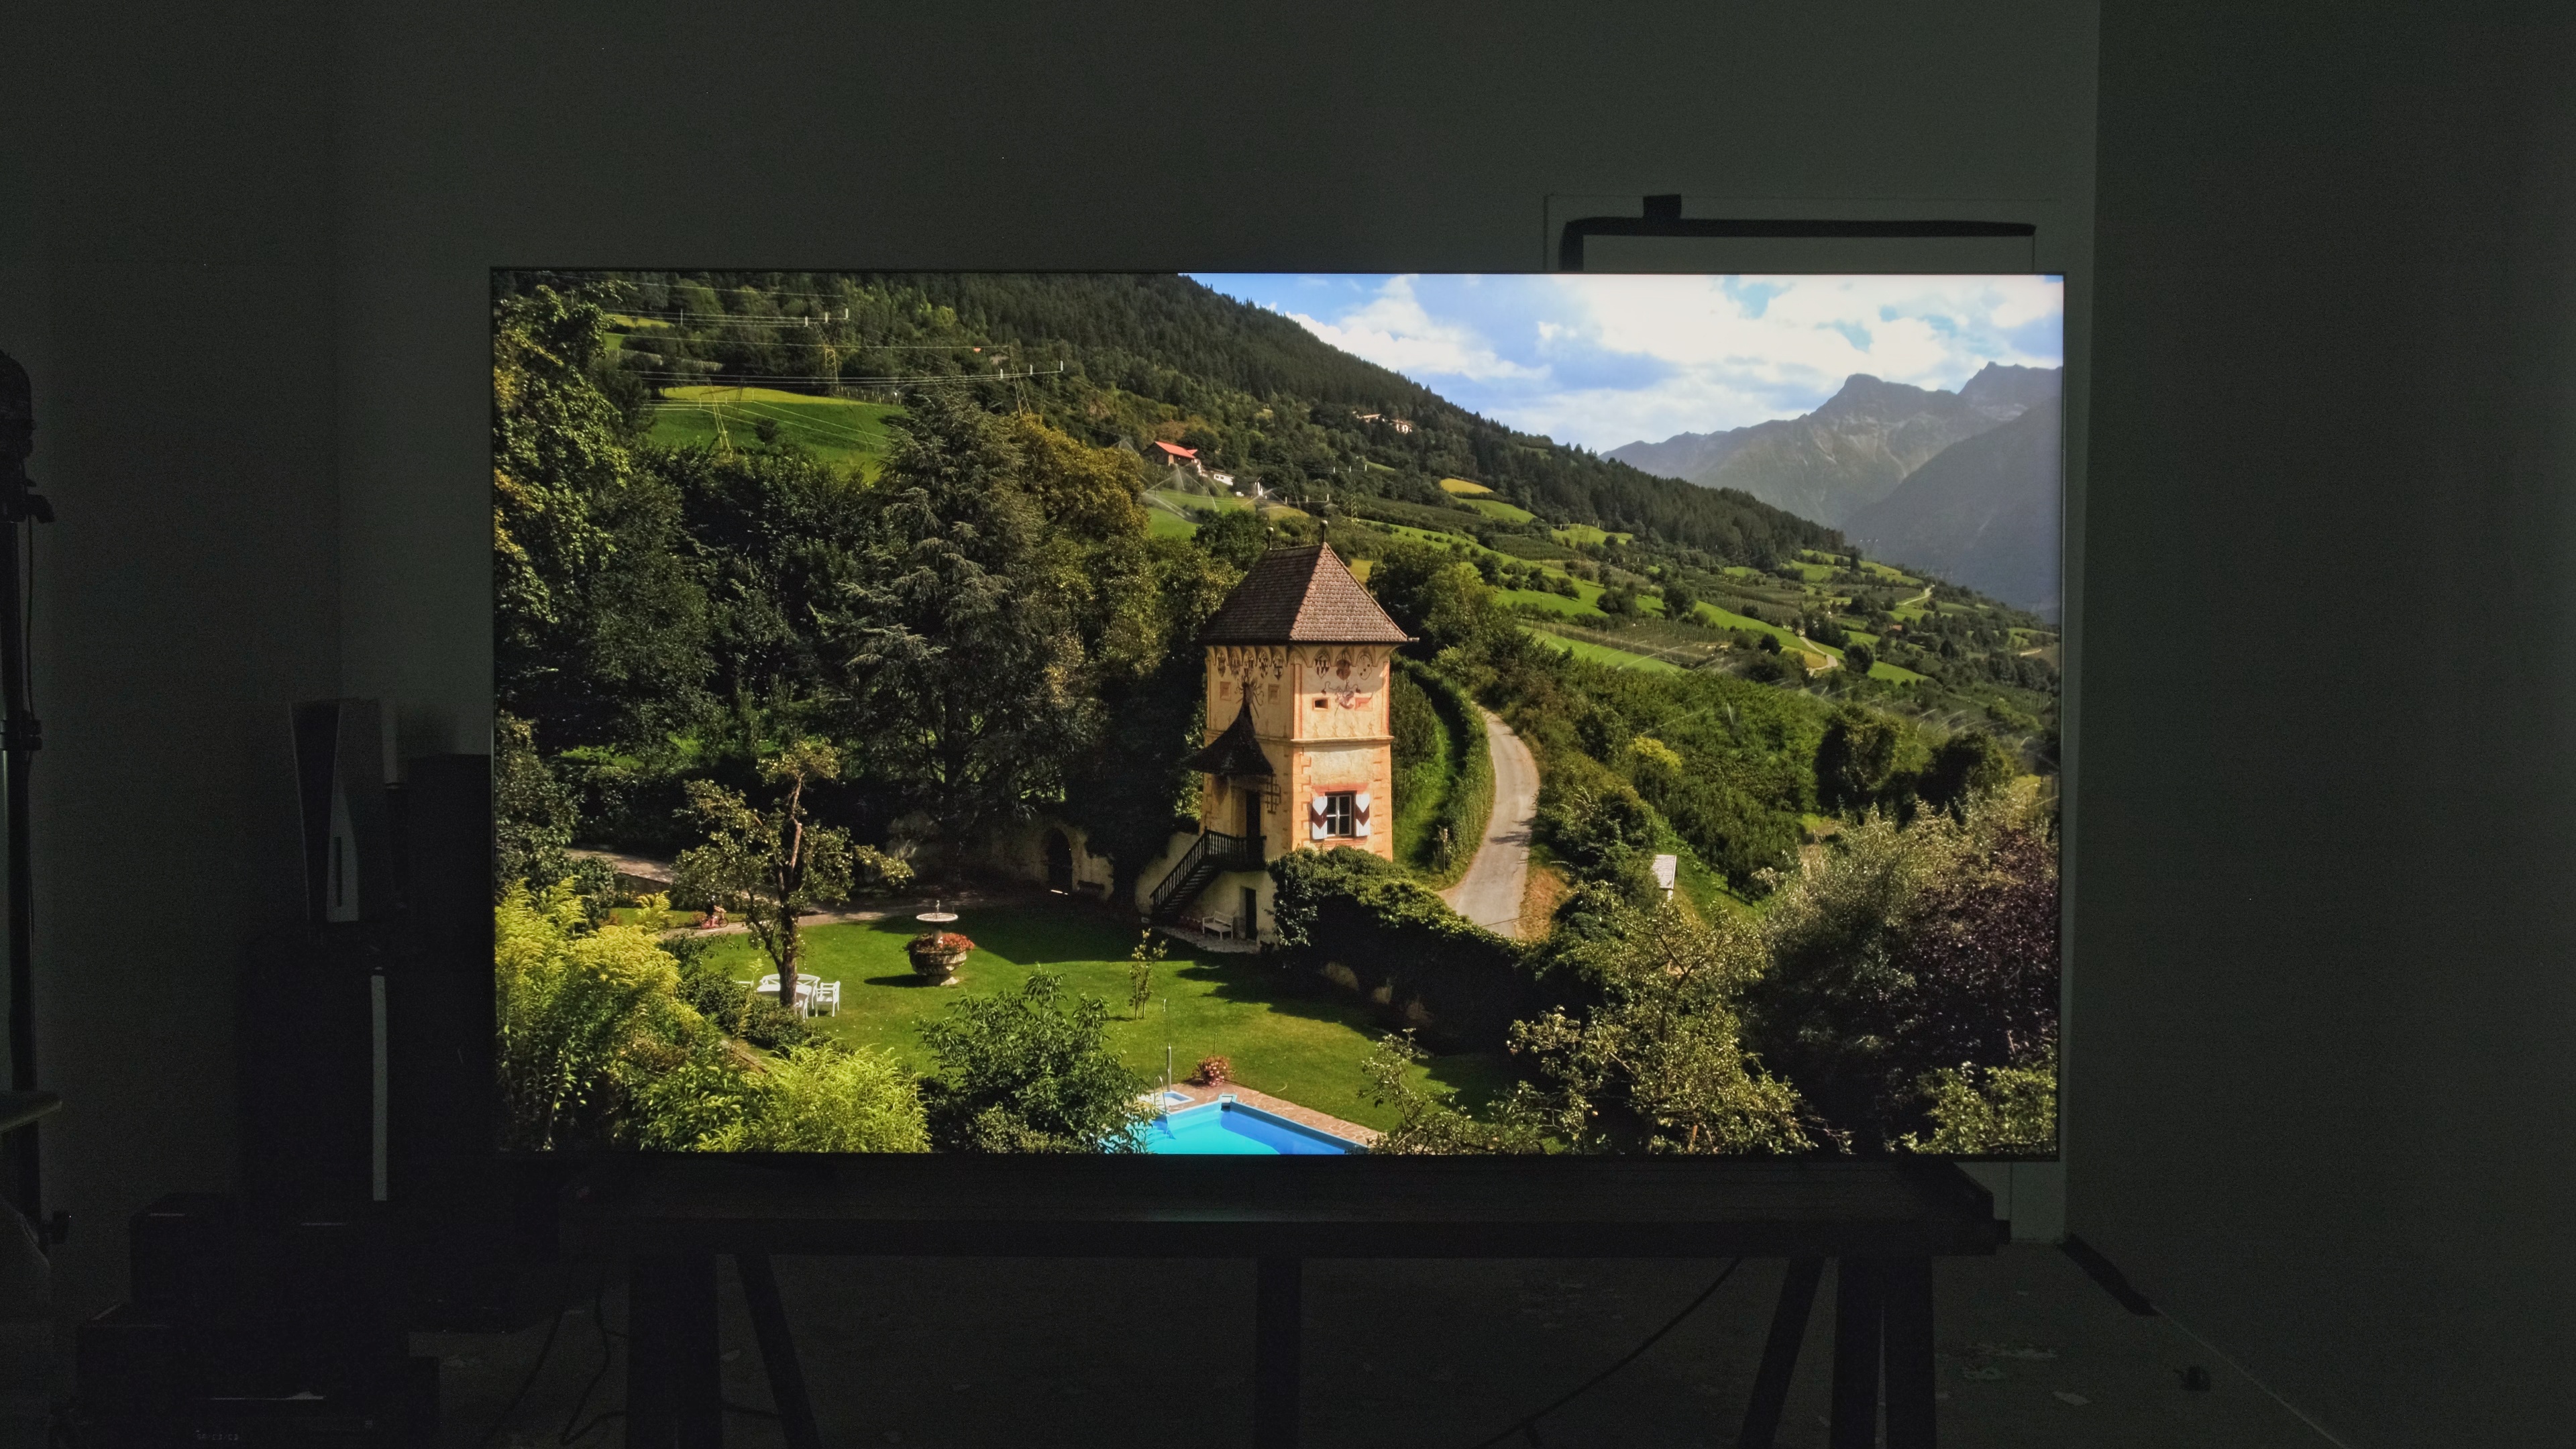
| Test | 98" (cd/m²) | 65" (cd/m²) | Difference In cd/m² | % Difference |
|---|---|---|---|---|
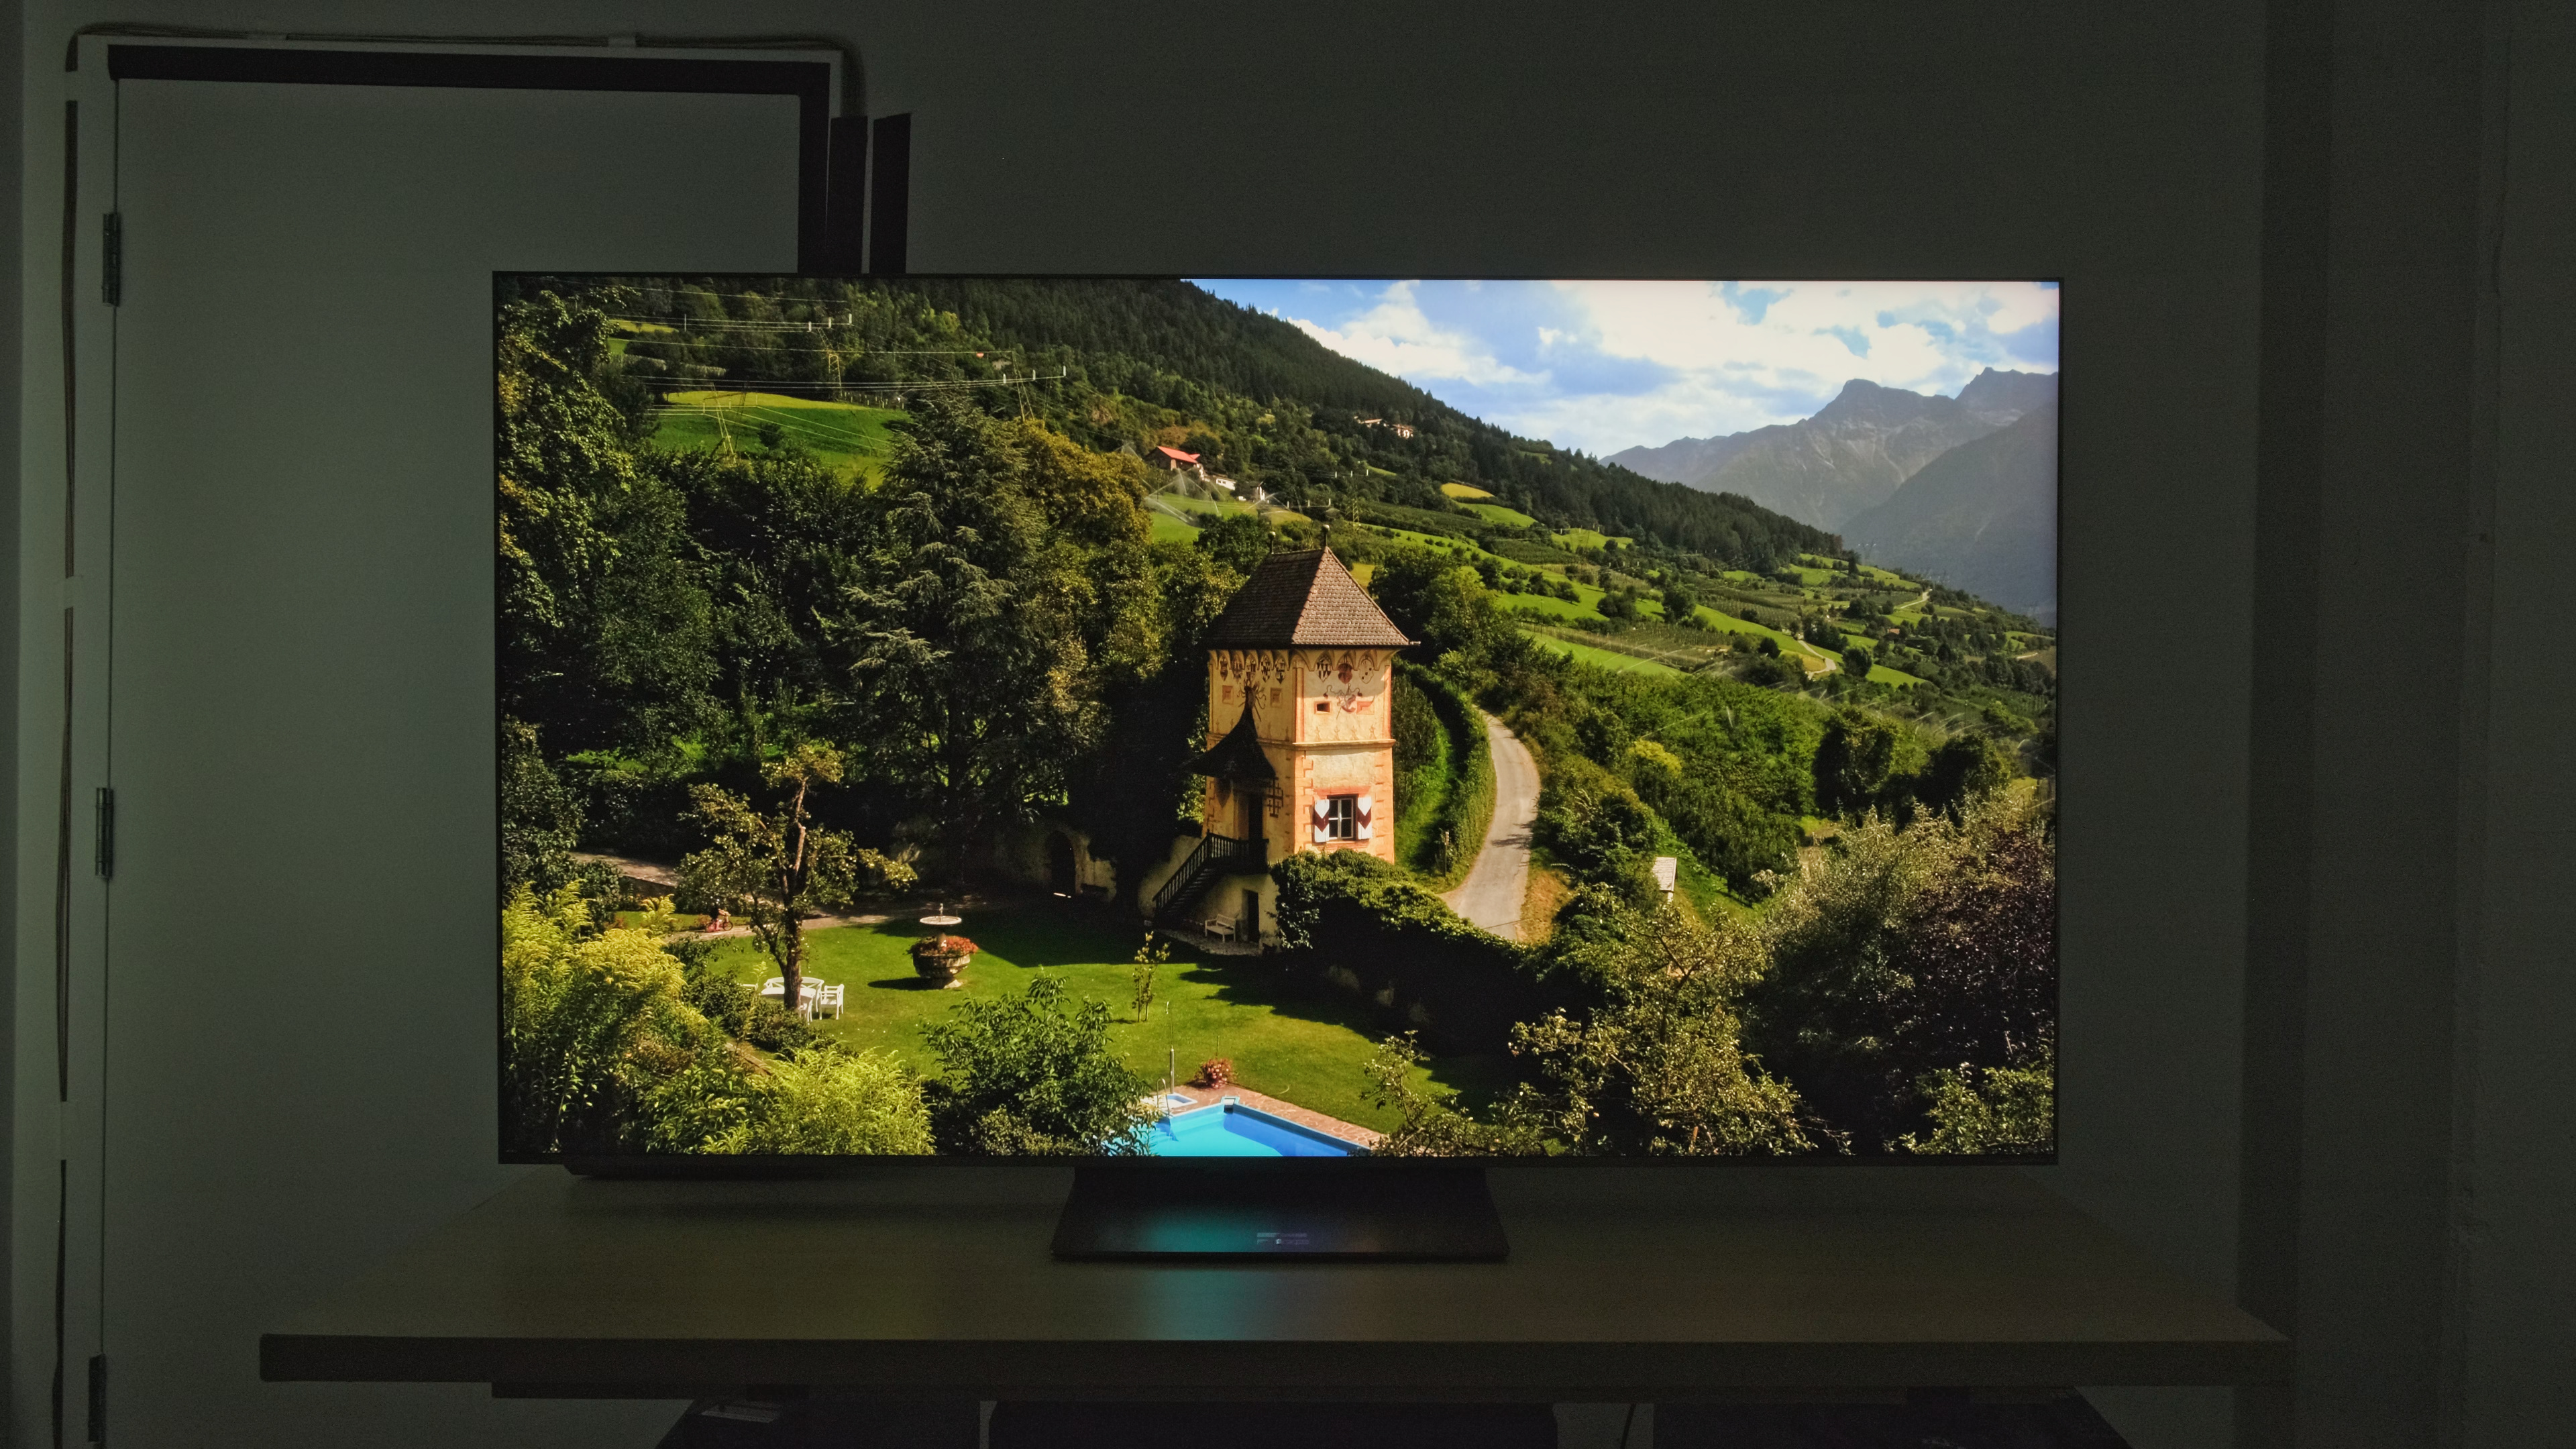
| Hallway Lights (~1950 cd/m²) | 1,008 | 961 | 47 | 4.9% |
| Yellow Skyscraper (~700 cd/m²) | 695 | 651 | 44 | 6.8% |
| Landscape Pool (~300 cd/m²) | 391 | 395 | -4 | -1.0% |
| Peak 2% Window | 4,111 | 3,431 | 680 | 19.8% |
| Peak 10% Window | 3,909 | 3,605 | 304 | 8.4% |
| Peak 25% Window | 1,981 | 2,467 | -486 | -19.7% |
| Peak 50% Window | 1,079 | 1,438 | -359 | -25.0% |
| Peak 100% Window | 613 | 810 | -197 | -24.3% |
| Sustained 2% Window | 2,557 | 1,813 | 744 | 41.0% |
| Sustained 10% Window | 2,297 | 1,725 | 572 | 33.2% |
| Sustained 25% Window | 1,905 | 1,675 | 230 | 13.7% |
| Sustained 50% Window | 1,076 | 1,001 | 75 | 7.5% |
| Sustained 100% Window | 613 | 667 | -54 | -8.1% |
Brightness is a bit of a mixed bag. The 98-inch version is slightly brighter than the 65-inch on some measurements, especially sustained, but it's lower on many of the peak measurements. The smaller model pushes small highlights brighter over short bursts, but can't sustain them as long. In the end, though, these differences are extremely minor and not noticeable in person.
Contrast
| TCL 98QM8K | TCL 65QM8K |
|---|---|
 Native Contrast 4,886 : 1 |
 Native Contrast 6,835 : 1 |
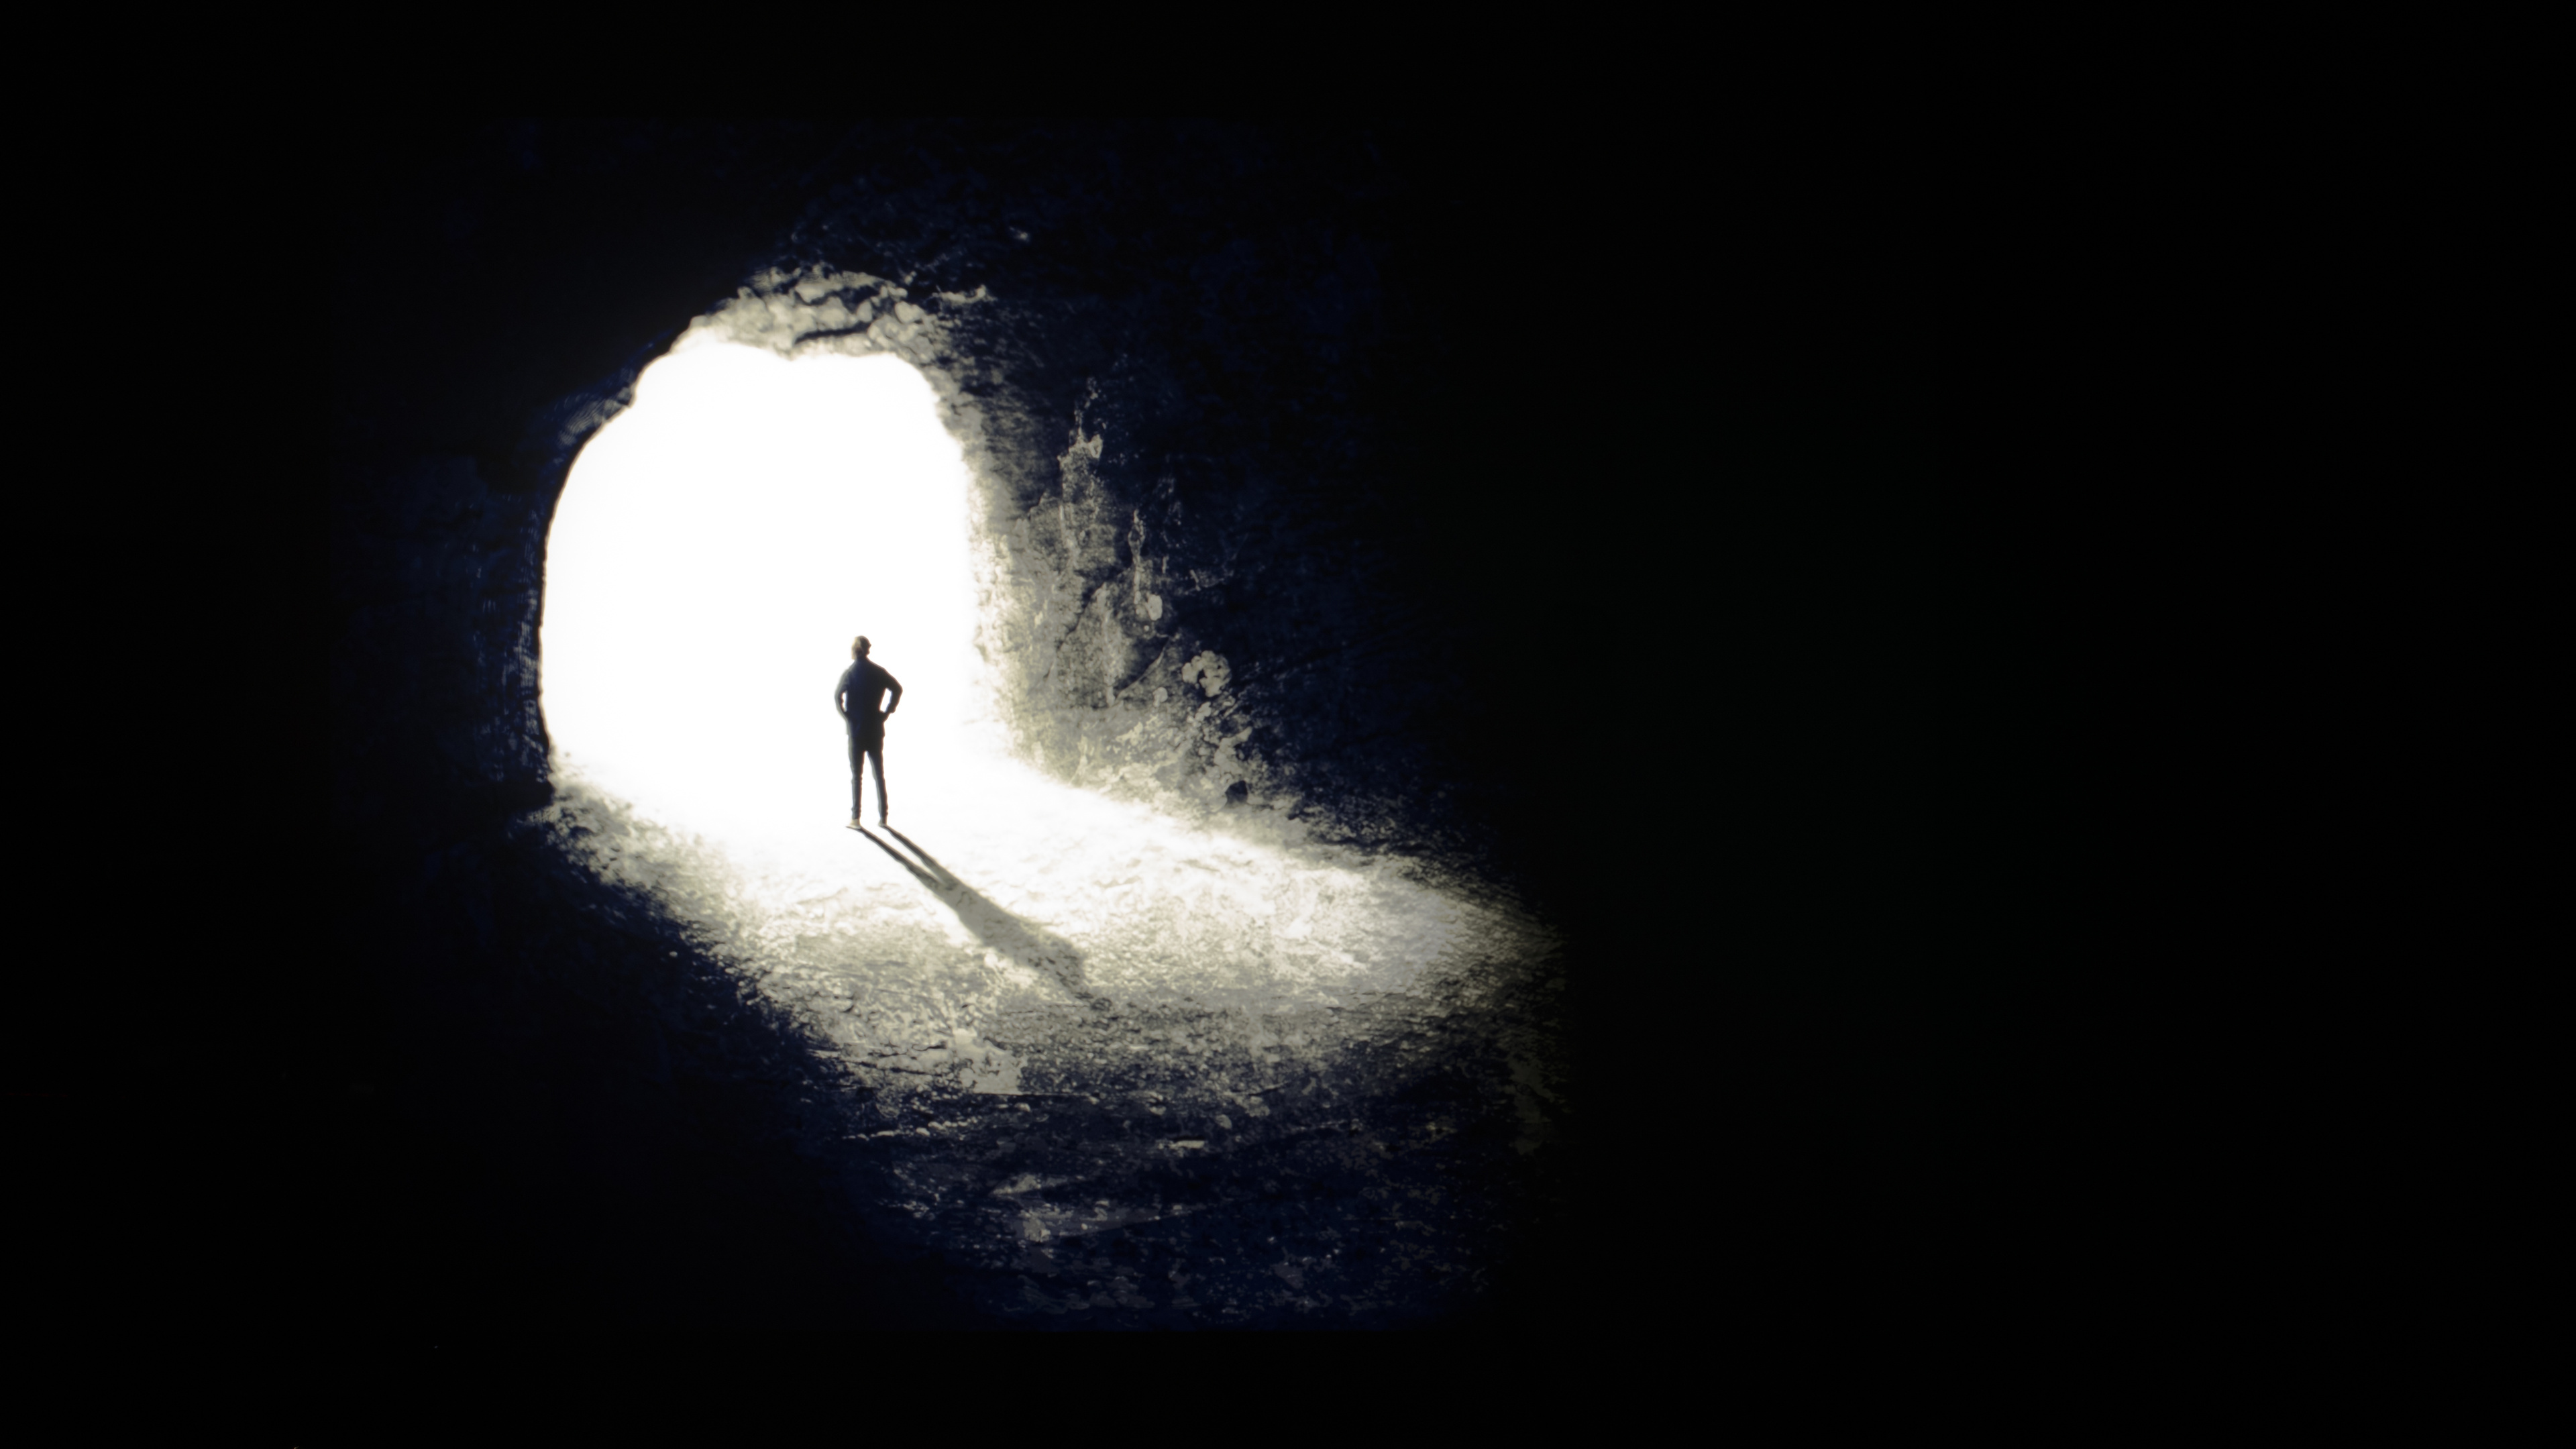
A display's contrast ratio shows the ratio between the darkest black a display can produce and the luminance of the brightest white. The higher the contrast ratio, the deeper the blacks appear while simultaneously highlighting bright elements. Our contrast test is conducted with the center of the cave set as close to 200 nits as possible, which gives us the white luminance measurement for our calculation. The lowest black reading we obtain is based on an average of four measurements. If you want to learn more about the specific way we measure contrast, check out our in-depth Contrast Ratio article. Let's examine the numbers we measured for each size.
| TV Size | White Level (nits) | Lowest Average Black Level (nits) | Contrast Ratio |
|---|---|---|---|
| 65" | 204.9 | 0.00075 | 273,200 : 1 |
| 98" | 201.45 | 0.00075 | 268,600 : 1 |
In the case of these two TVs, there's basically no difference in contrast. The black floor, which is the lowest average black level, is exactly the same on both TVs. This is great news, indicating that you'll enjoy deep blacks regardless of the size you choose.
Dimming Zone Precision
| TCL 98QM8K | TCL 65QM8K |
|---|---|
 |
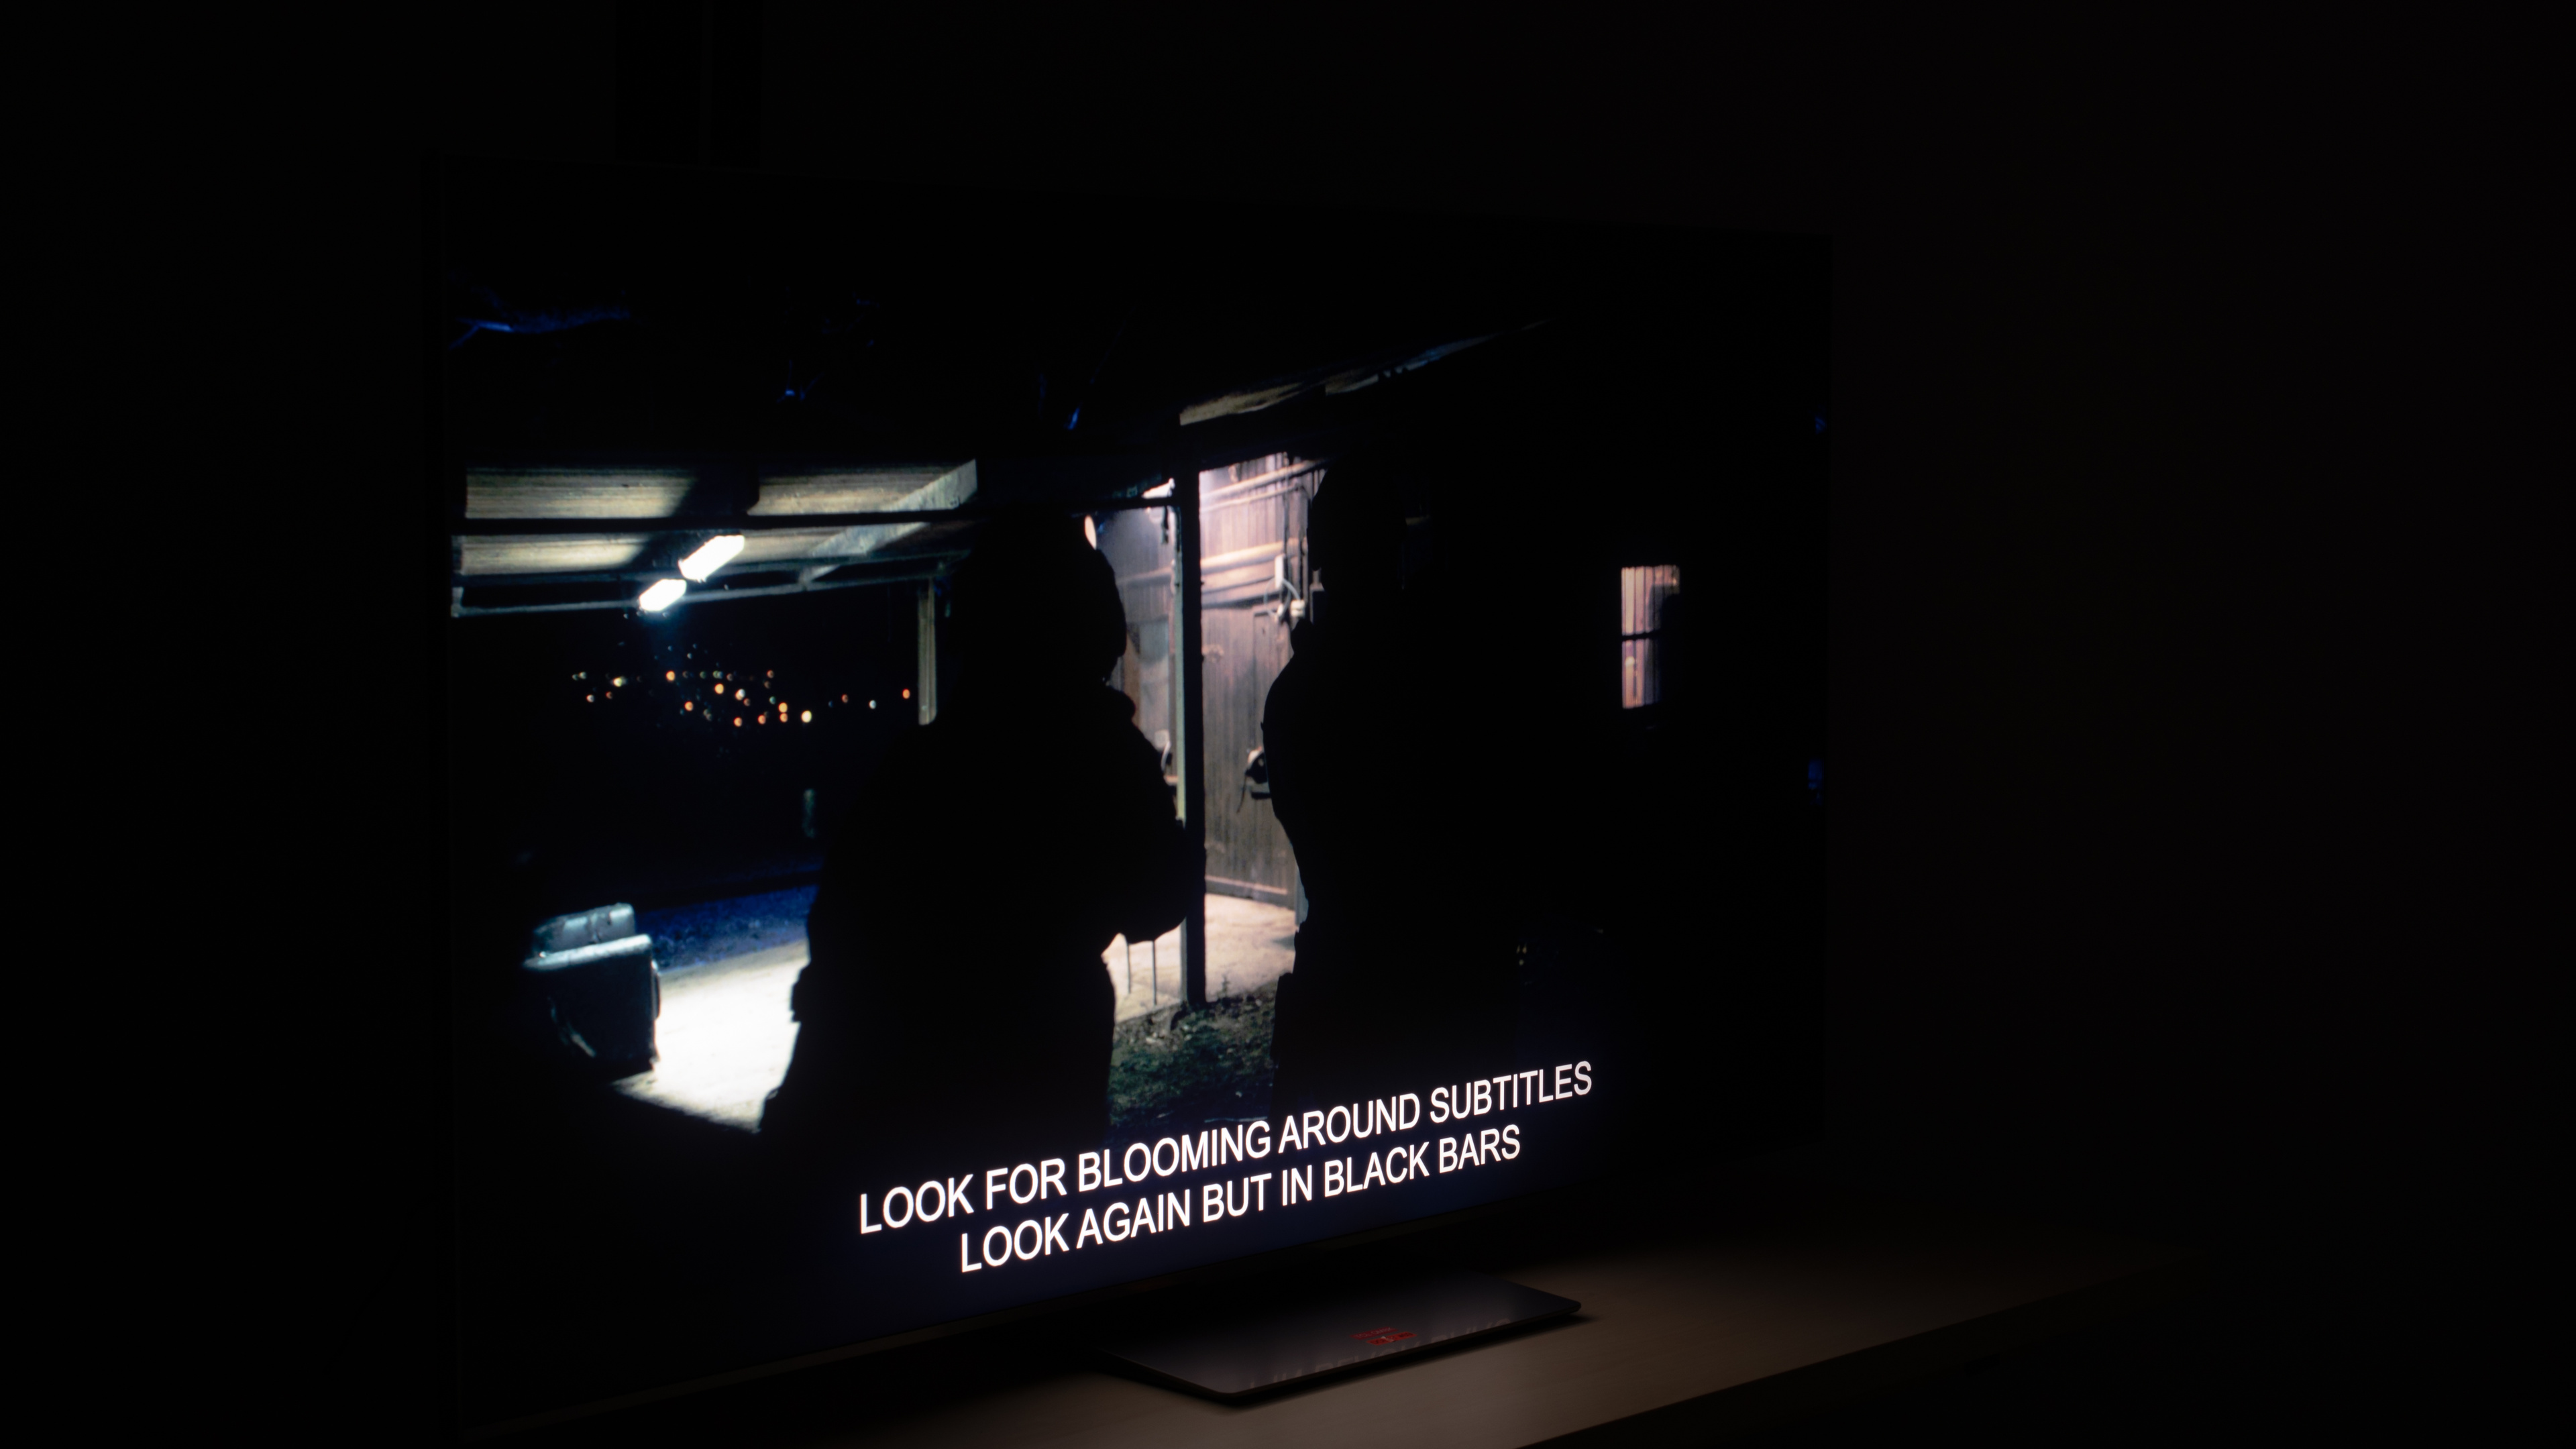 |
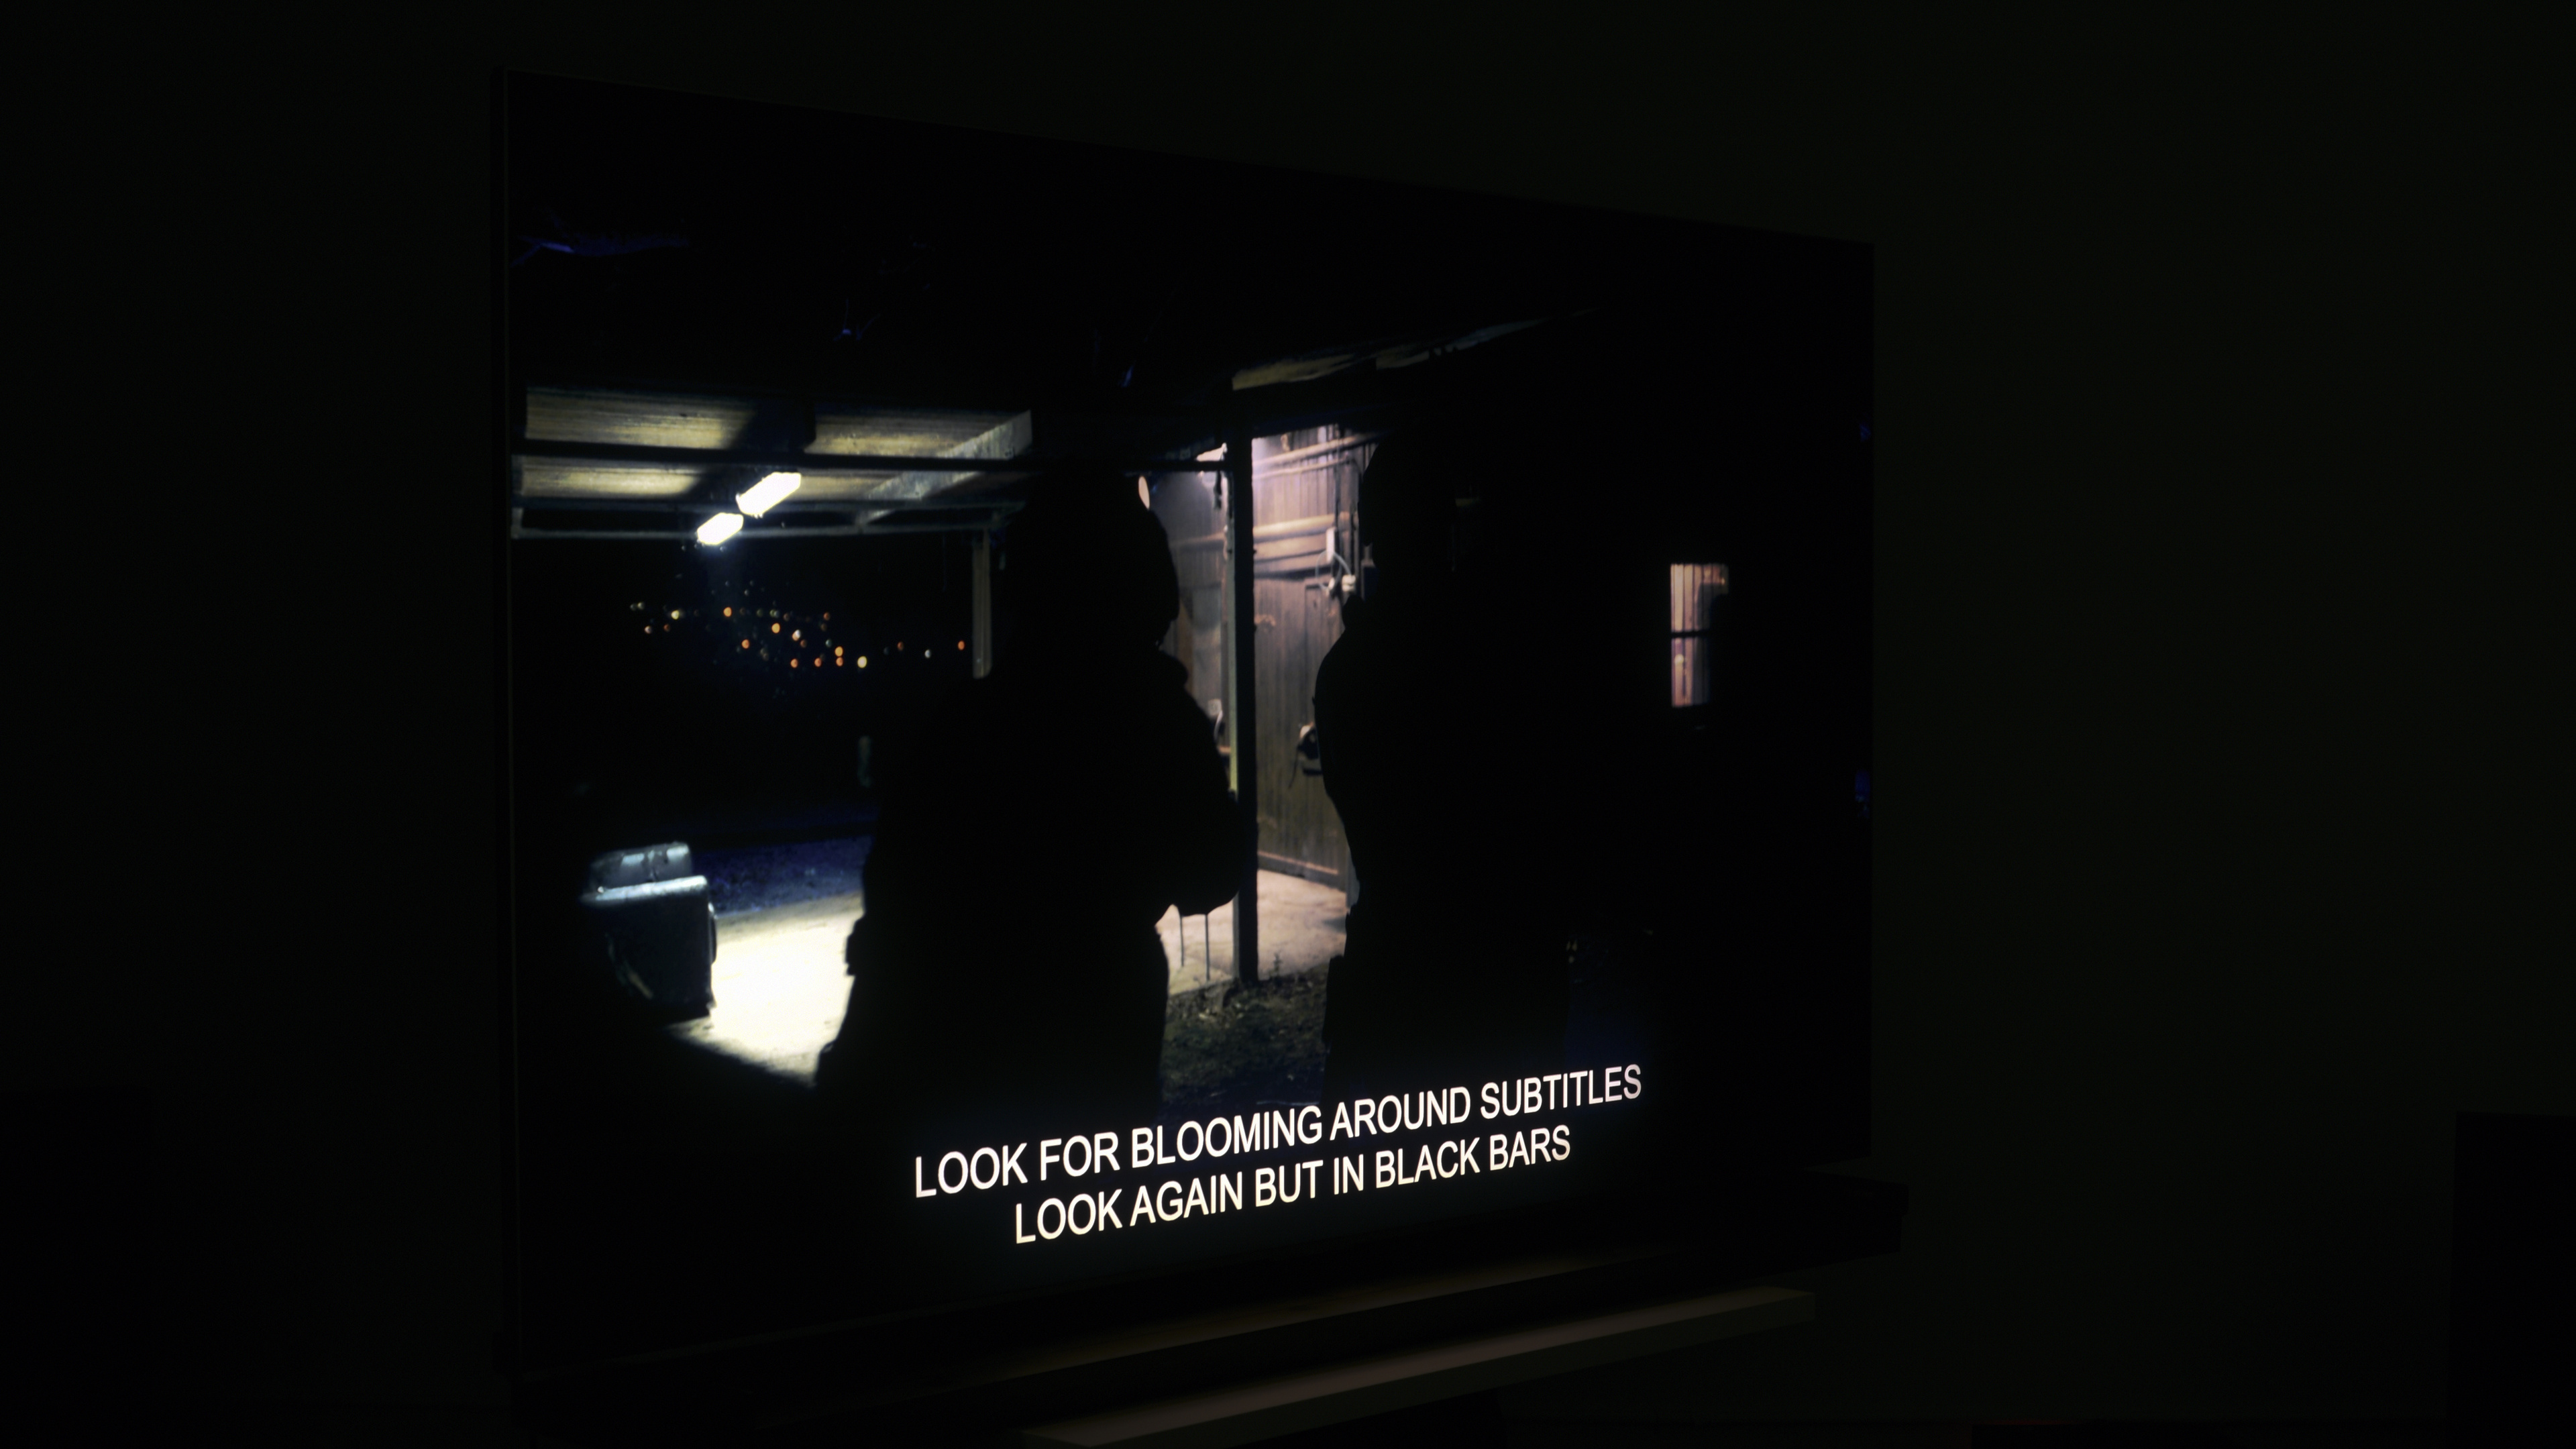
Contrast isn't the only thing that impacts a TV's overall black levels. Our lighting zone precision test examines how precisely a TV can dim the dark areas of an image surrounding highlights. If a TV performs poorly in this regard, the highlights will bleed into the dark areas, which can be distracting and affect the depth of blacks surrounding the highlights. The precision of zones is mostly determined by two things: the local dimming algorithm and the number of dimming zones a TV has. Let's break down the number of dimming zones and other key measurements for each TV size.
| TV Size | Zones | Pixels per Zone | Zone Size (in²) |
| 65" | 1,680 | 4,937 | 1.08" |
| 98" | 3,760 | 2,205 | 1.09" |
TCL has kept roughly the same zone size across both TV sizes, so the LEDs themselves are likely the same; there are just more of them on the larger model. Since the pixels are physically larger on the 98-inch model, though, this means that each zone covers fewer pixels. In theory, this should result in tight dimming control, but in practice, this is rarely the case. Like with the 65 and 100-inch Hisense U8QG, the algorithms that control the dimming zones play a greater role here, and the difference in pixel count doesn't necessarily translate to better local dimming performance. Ultimately, the zone precision is roughly the same for both of these TVs.
Color Volume
| TCL 98QM8K | TCL 65QM8K |
|---|---|
 |
 |
 |
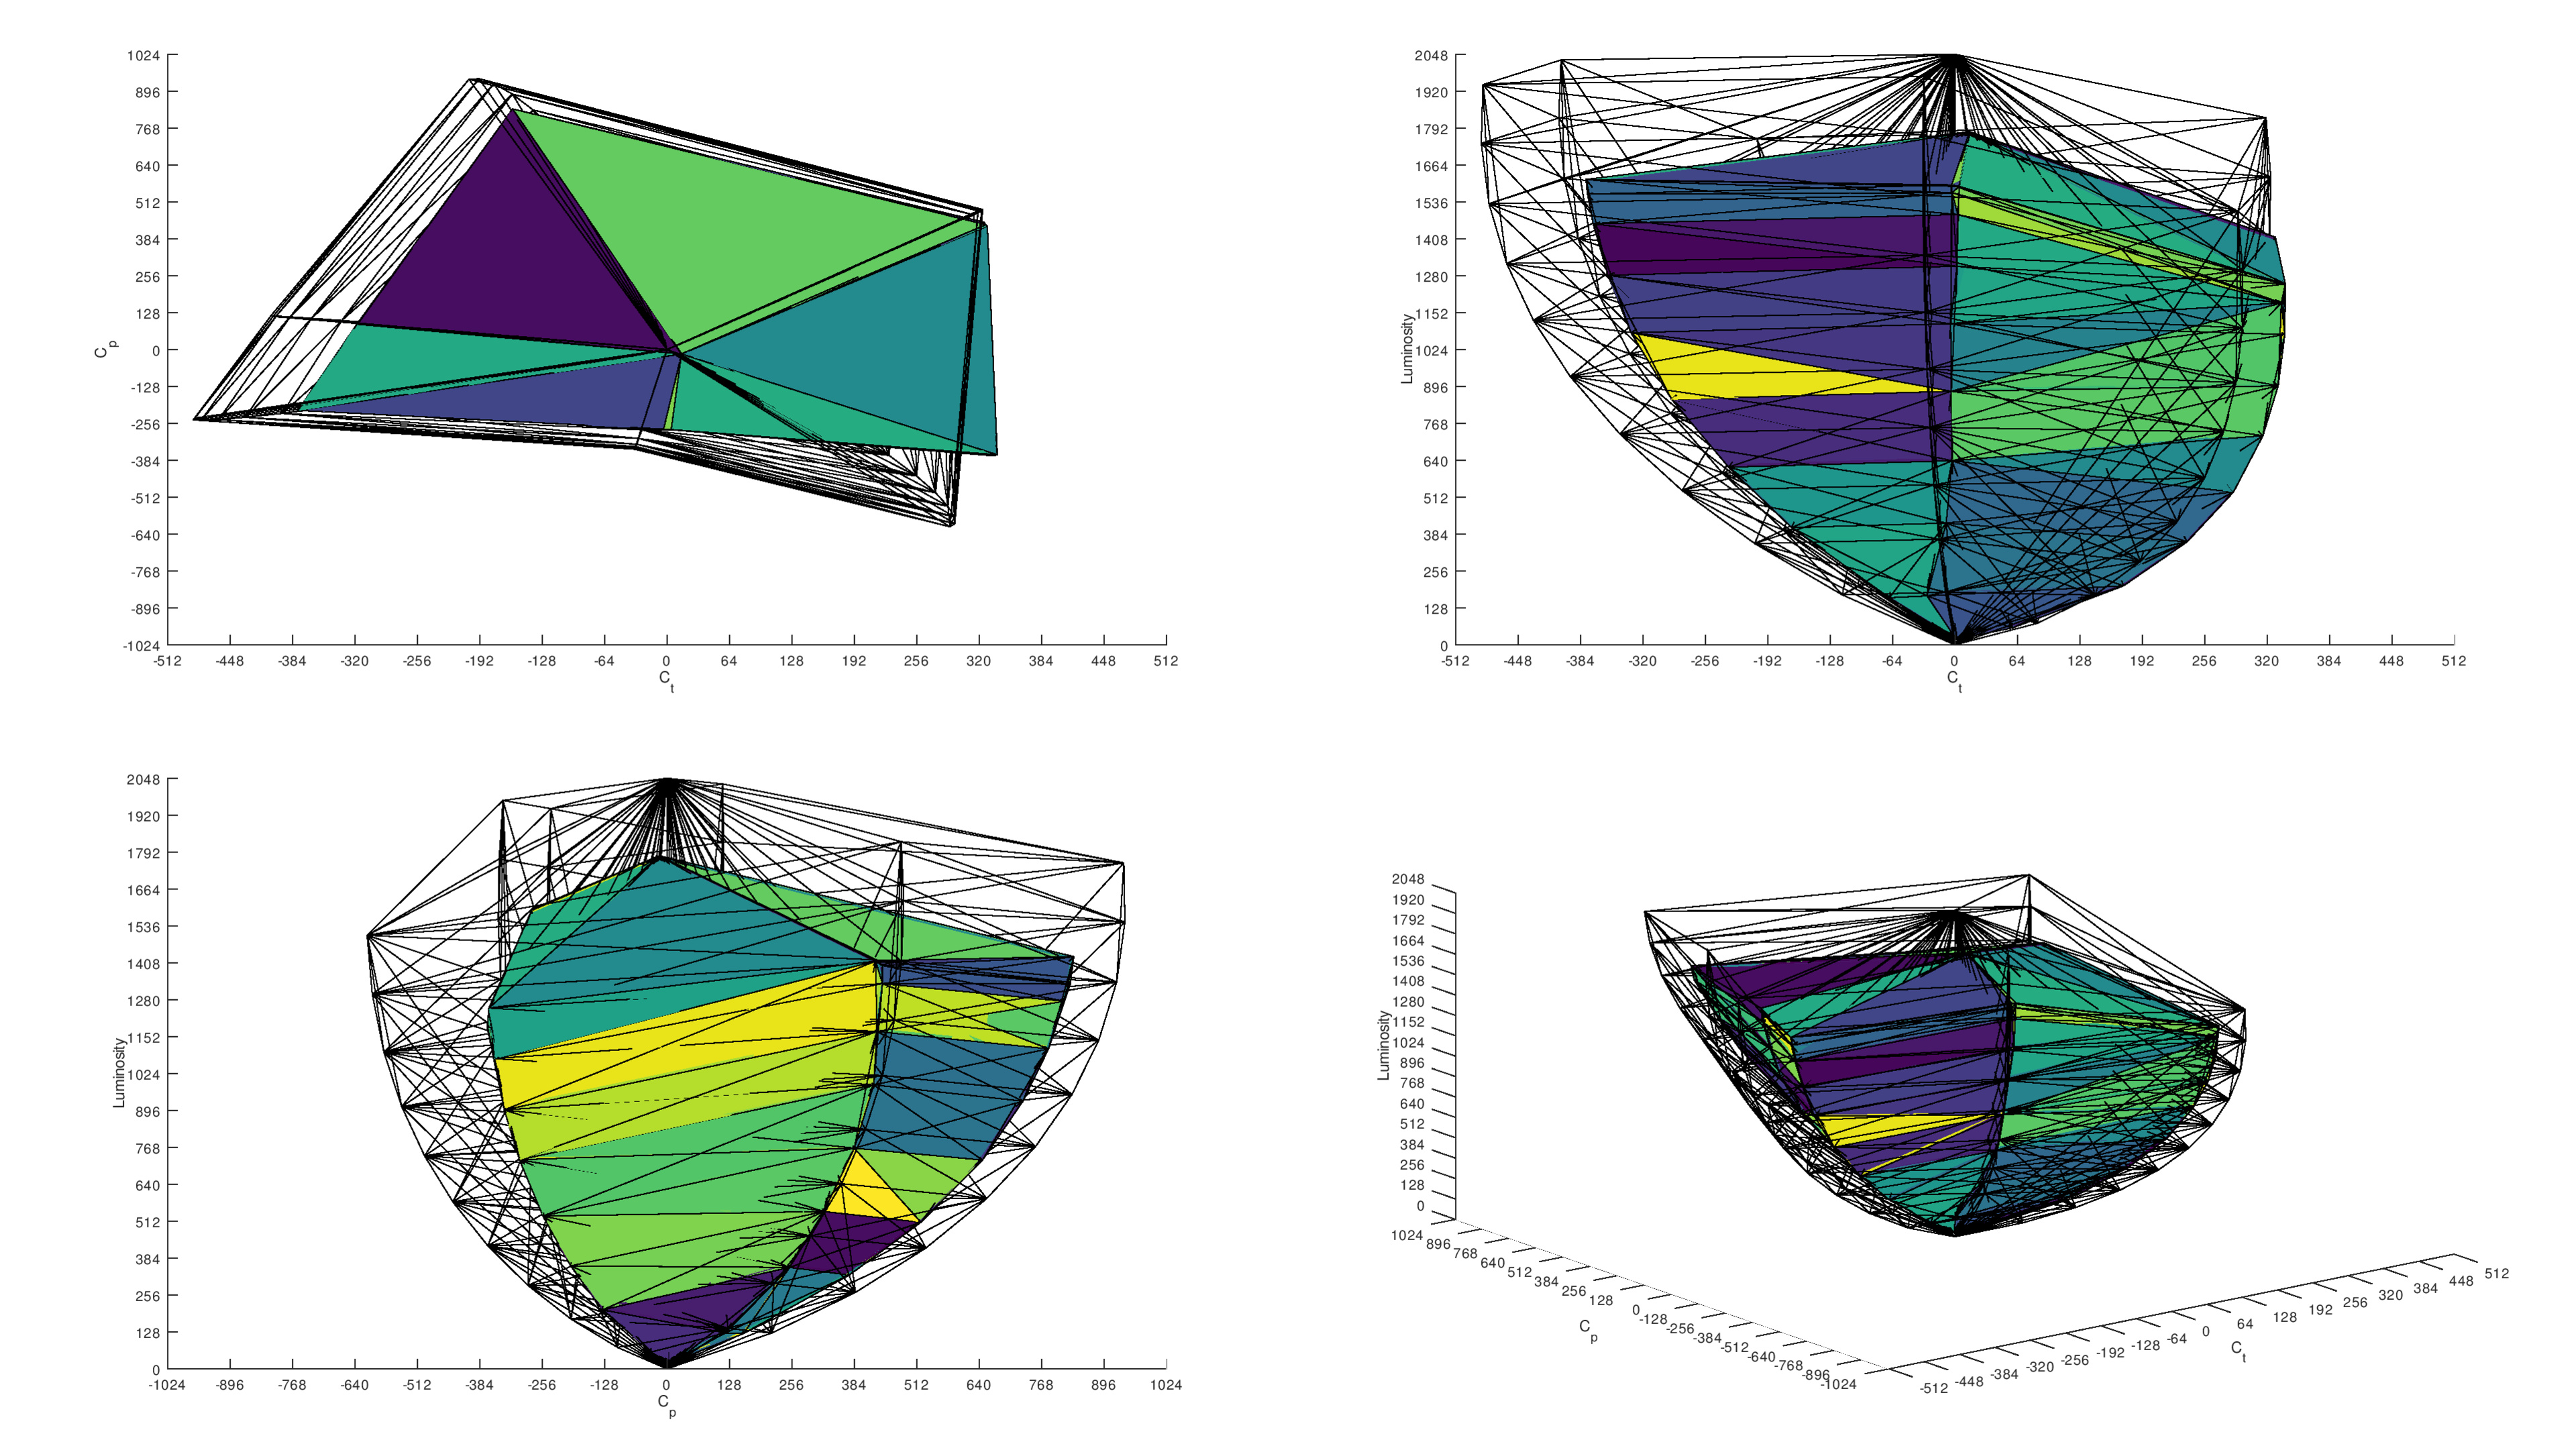 |
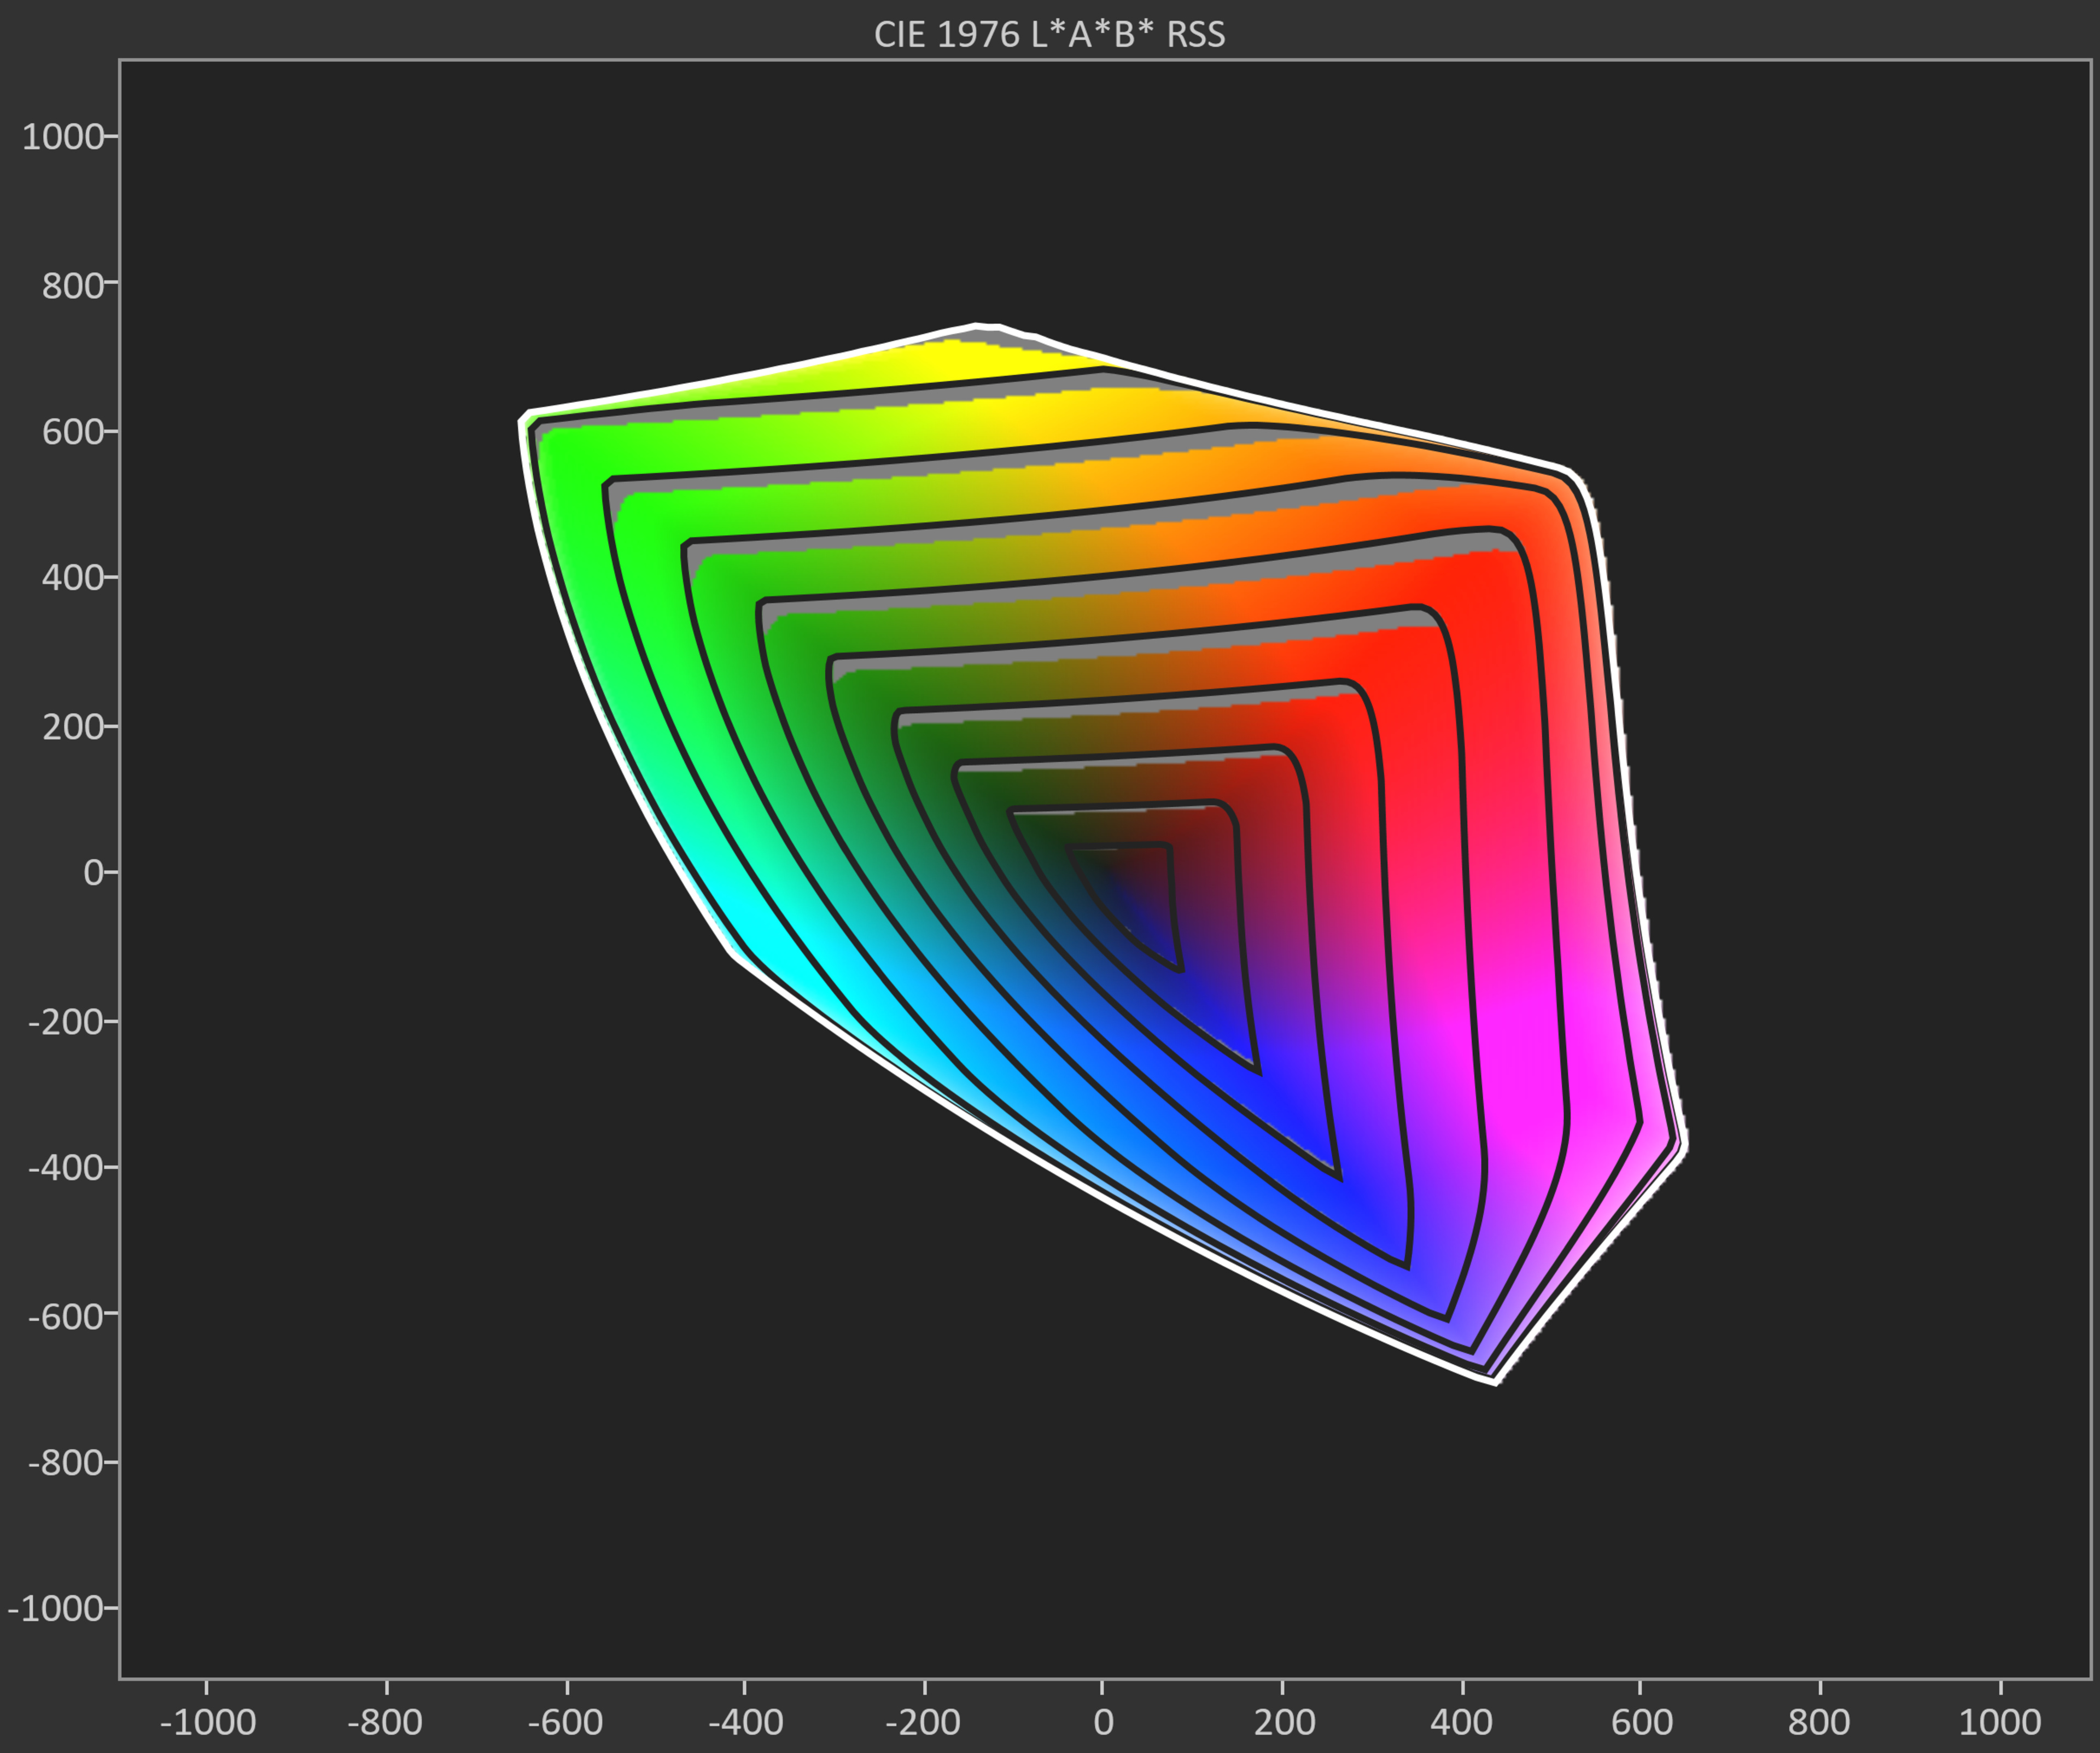
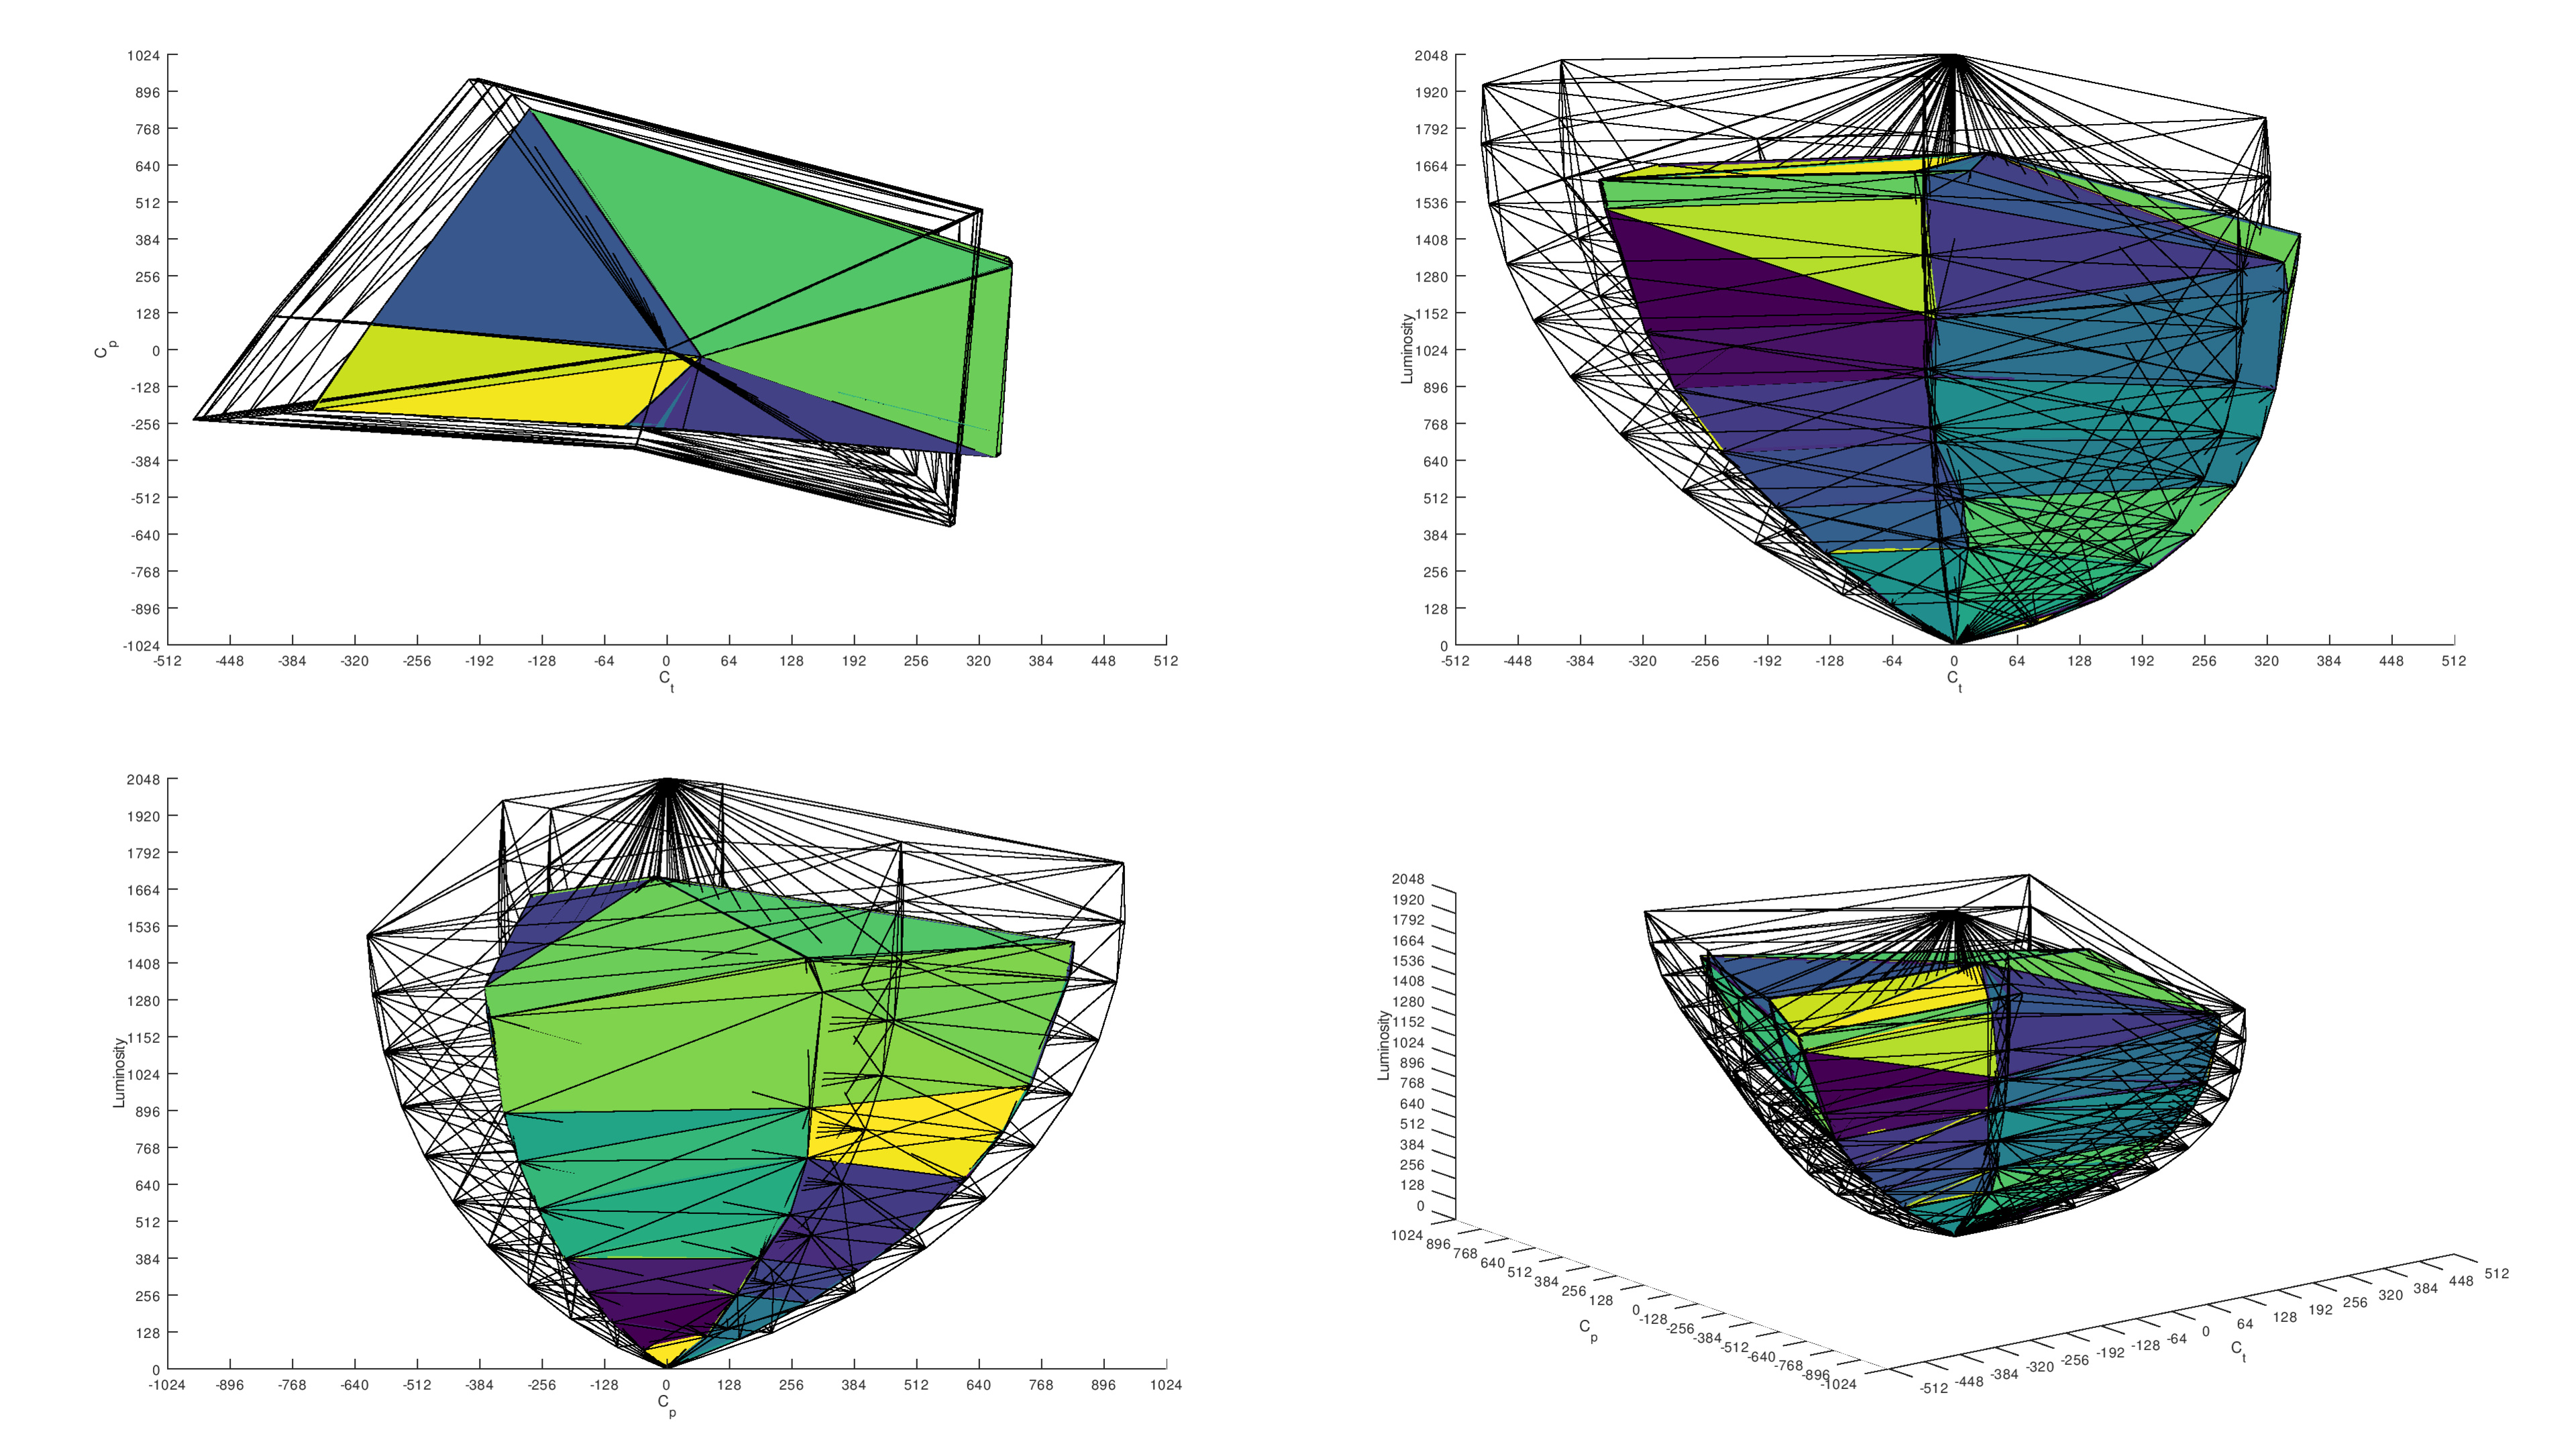
SDR color volume is a representation of a TV's color performance when displaying SDR content. Ideally, you want a TV with large coverage of the DCI-P3 and BT.2020 color spaces so your SDR content is as colorful and accurate as possible. Instead of showing a TV's color volume performance with a 3D graphic, as we do with our HDR Color Volume test, our SDR color volume test shows us a display's capabilities with an easier-to-understand 2D image, which is broken down into slices called gamut rings.
Overall color performance is very similar on the two sizes. The 65-inch model has slightly better coverage, especially in lighter shades. It's normal for this to vary a bit between individual units, though, and these two TVs are largely within manufacturer margins for this test. You won't notice any difference in color saturation between these sizes.
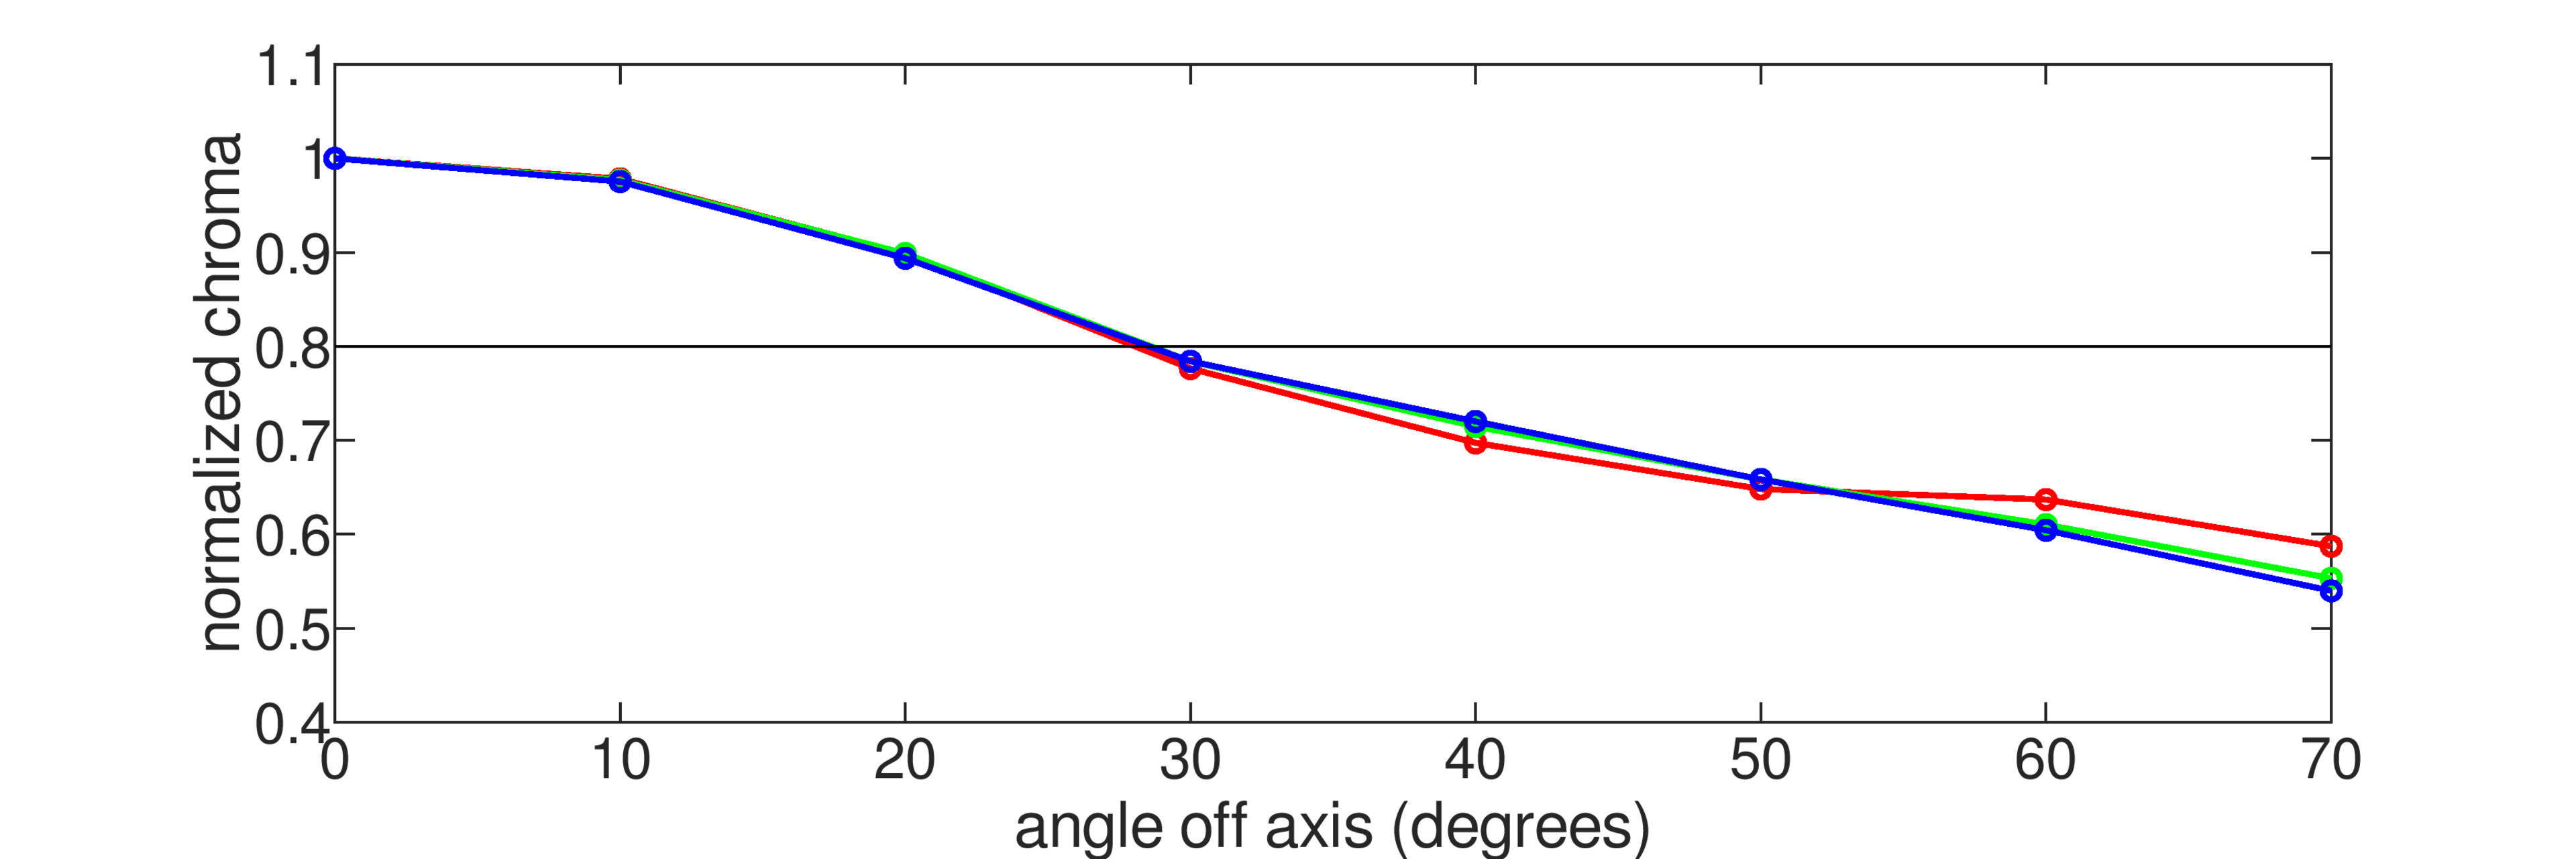
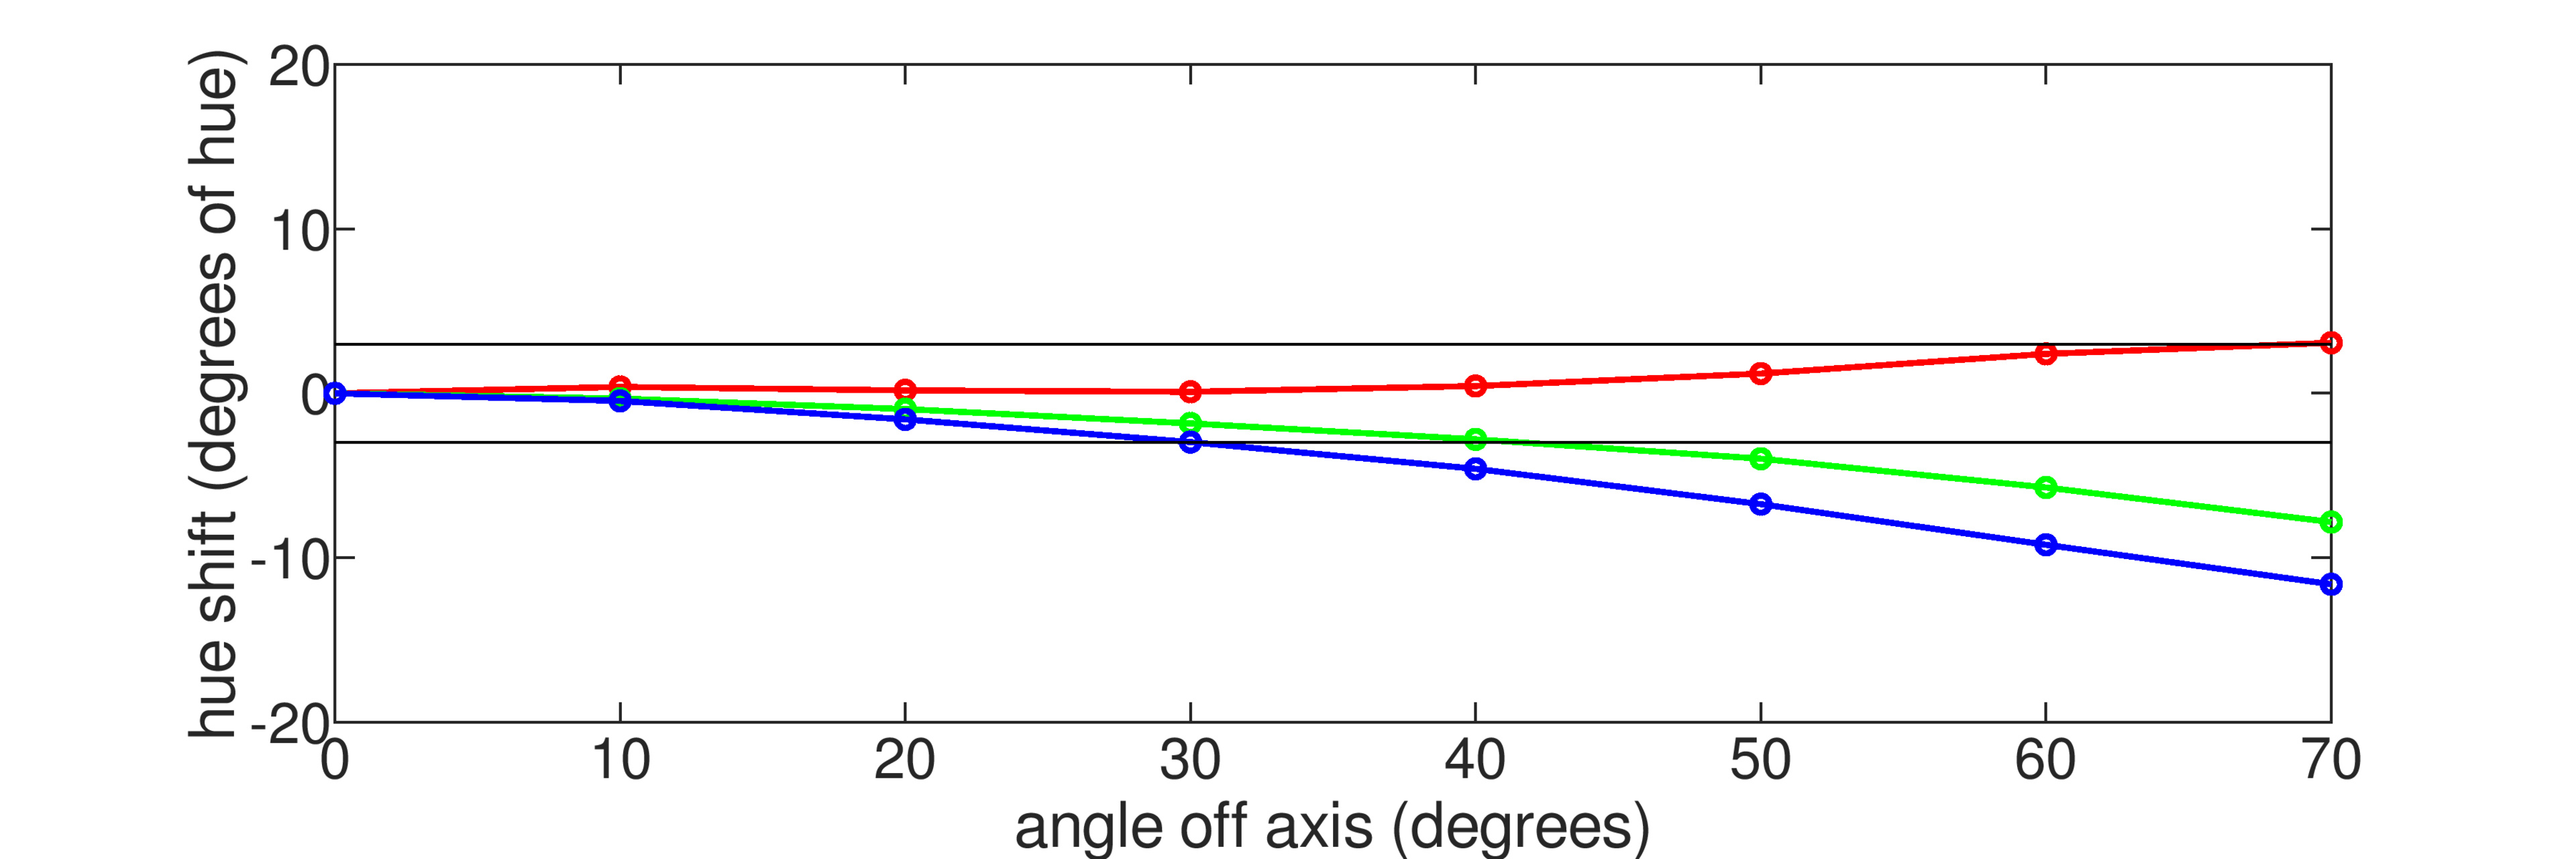
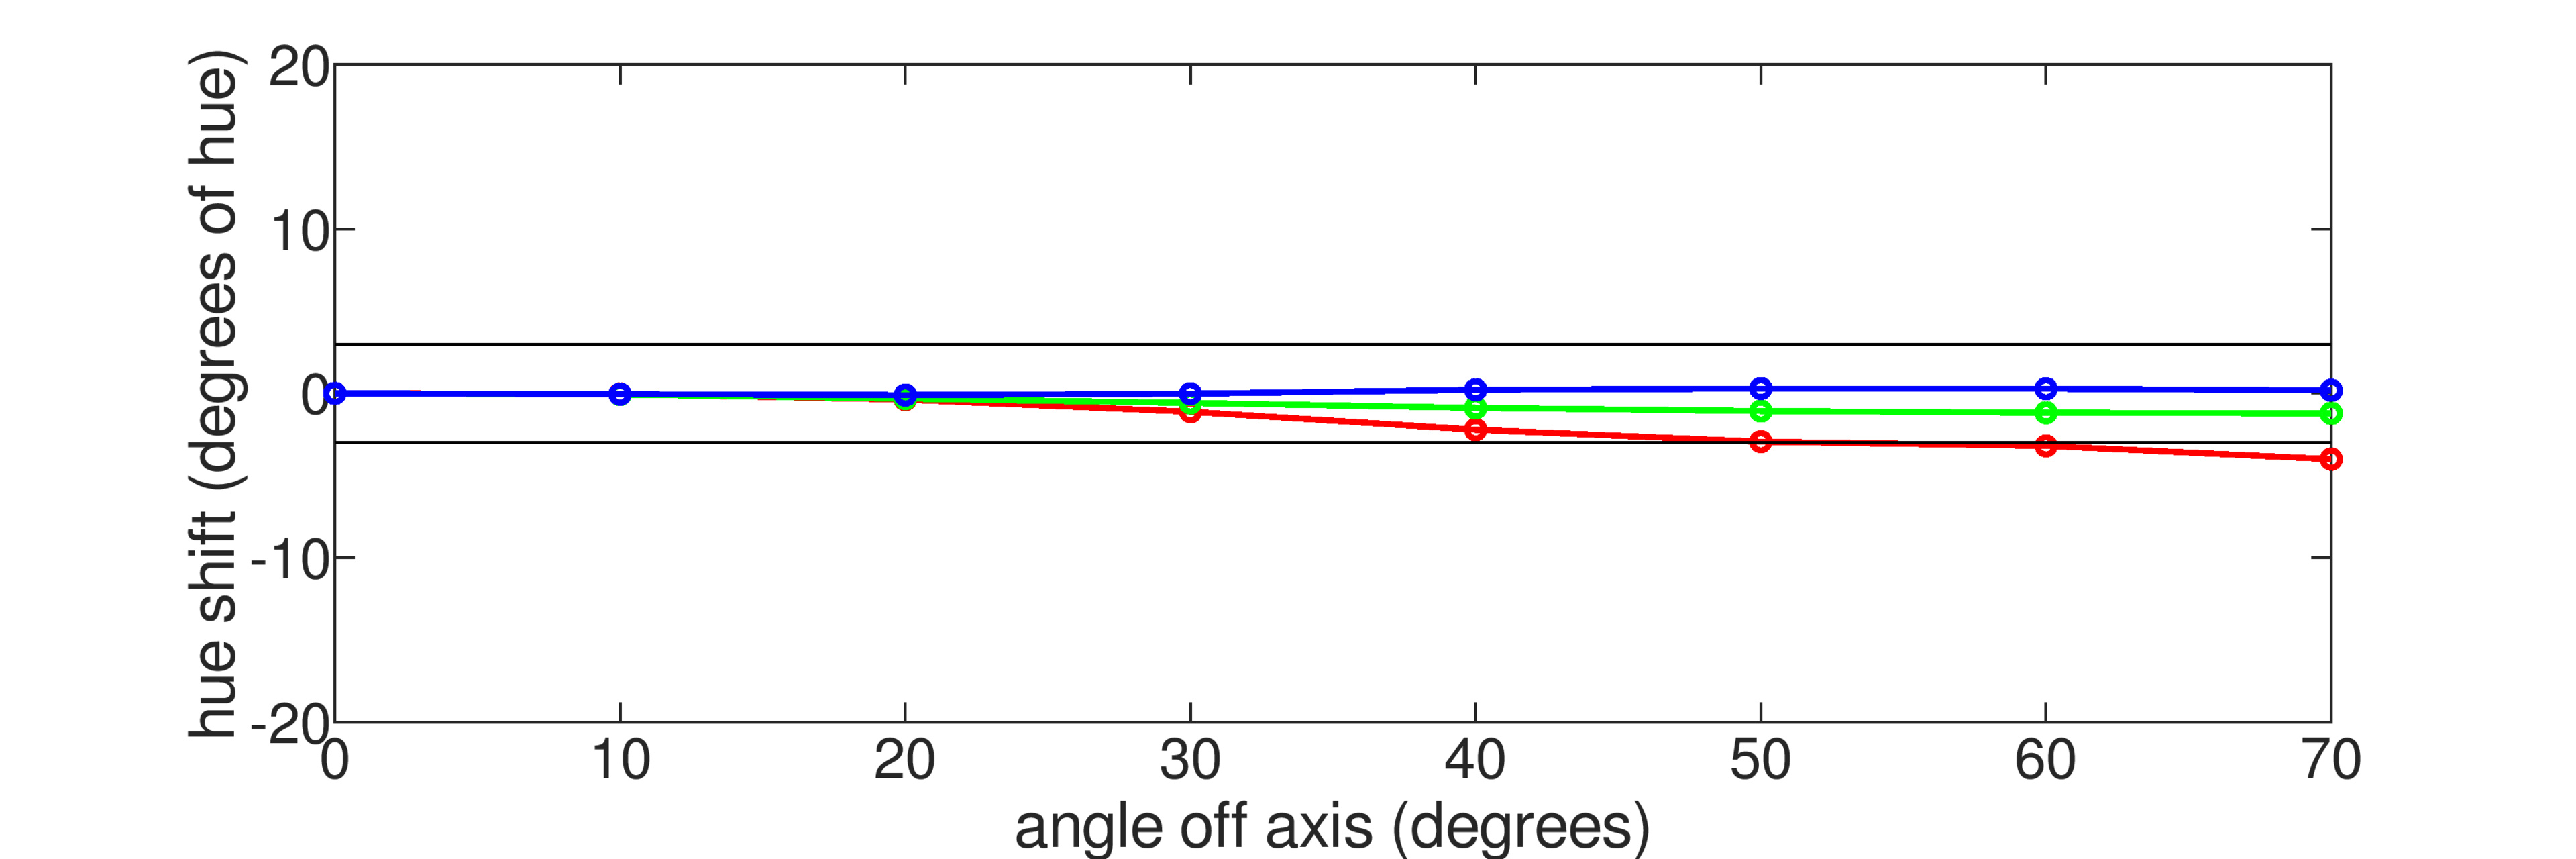
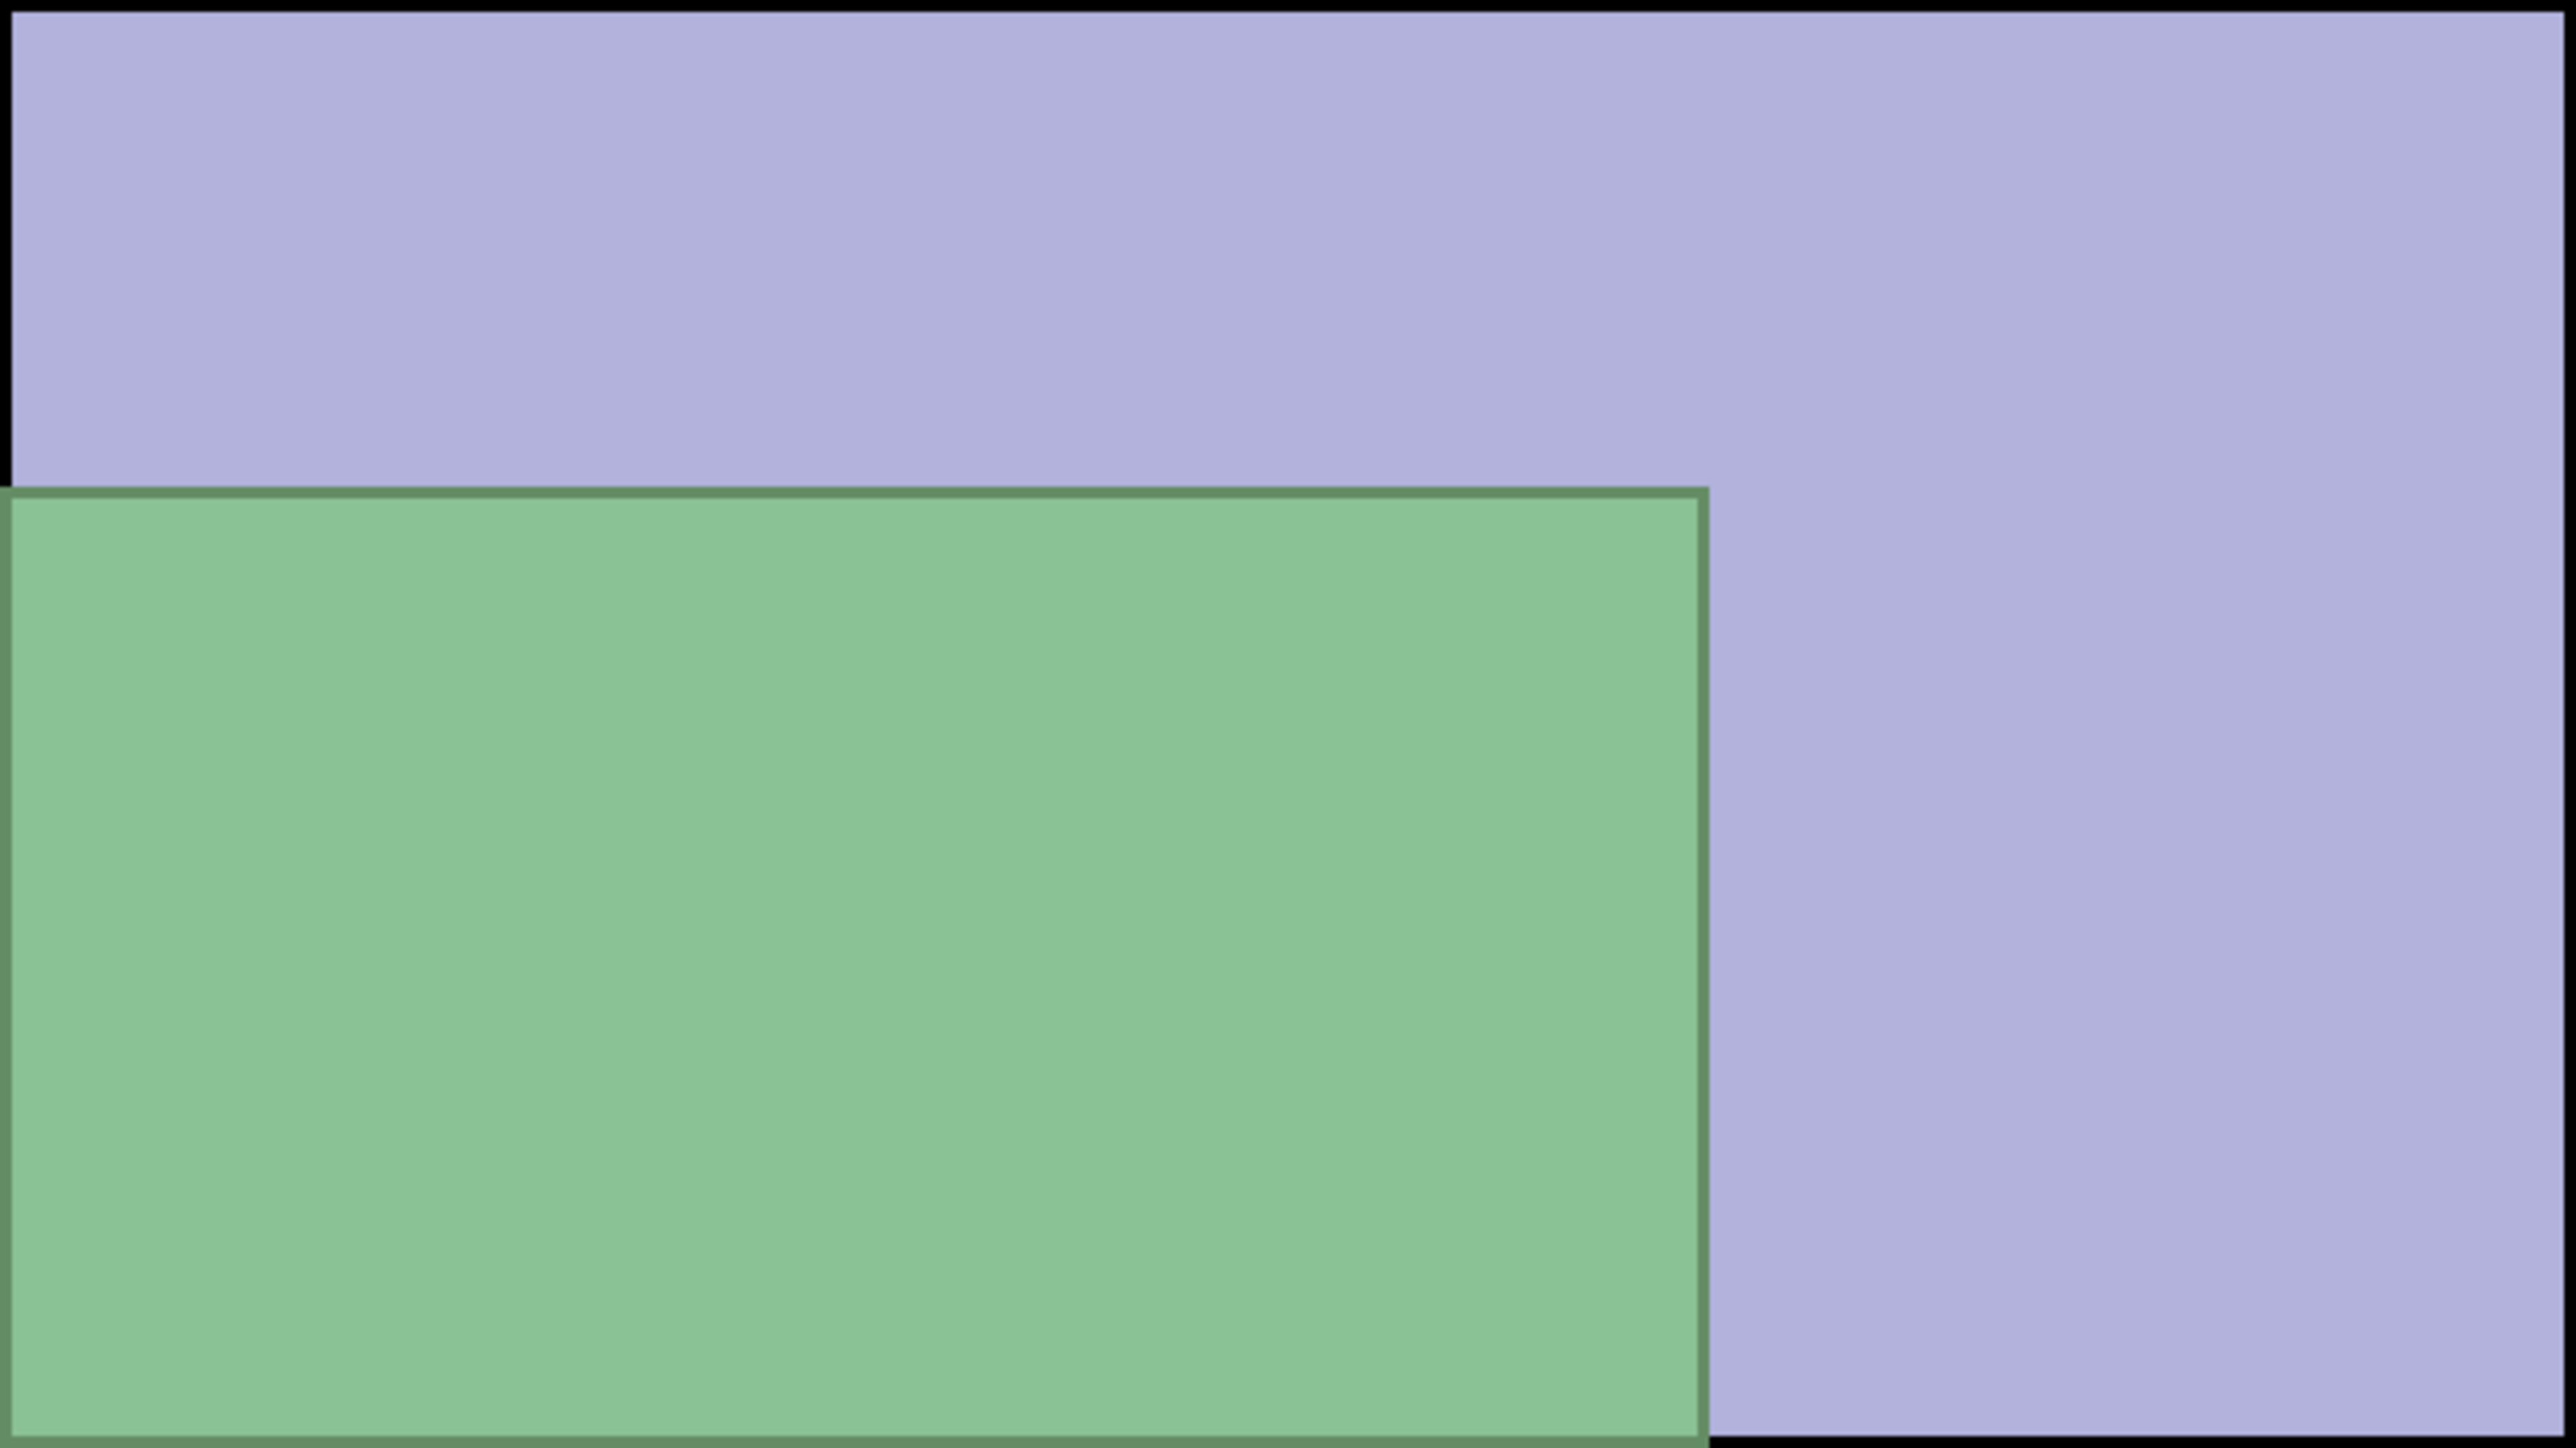
Viewing Angle
| TCL 98QM8K | TCL 65QM8K |
|---|---|
 |
 |
 |
 |
 Black level raise: 70° Gamma shift: 17° |
 Black level raise: 12° Gamma shift: 22° |
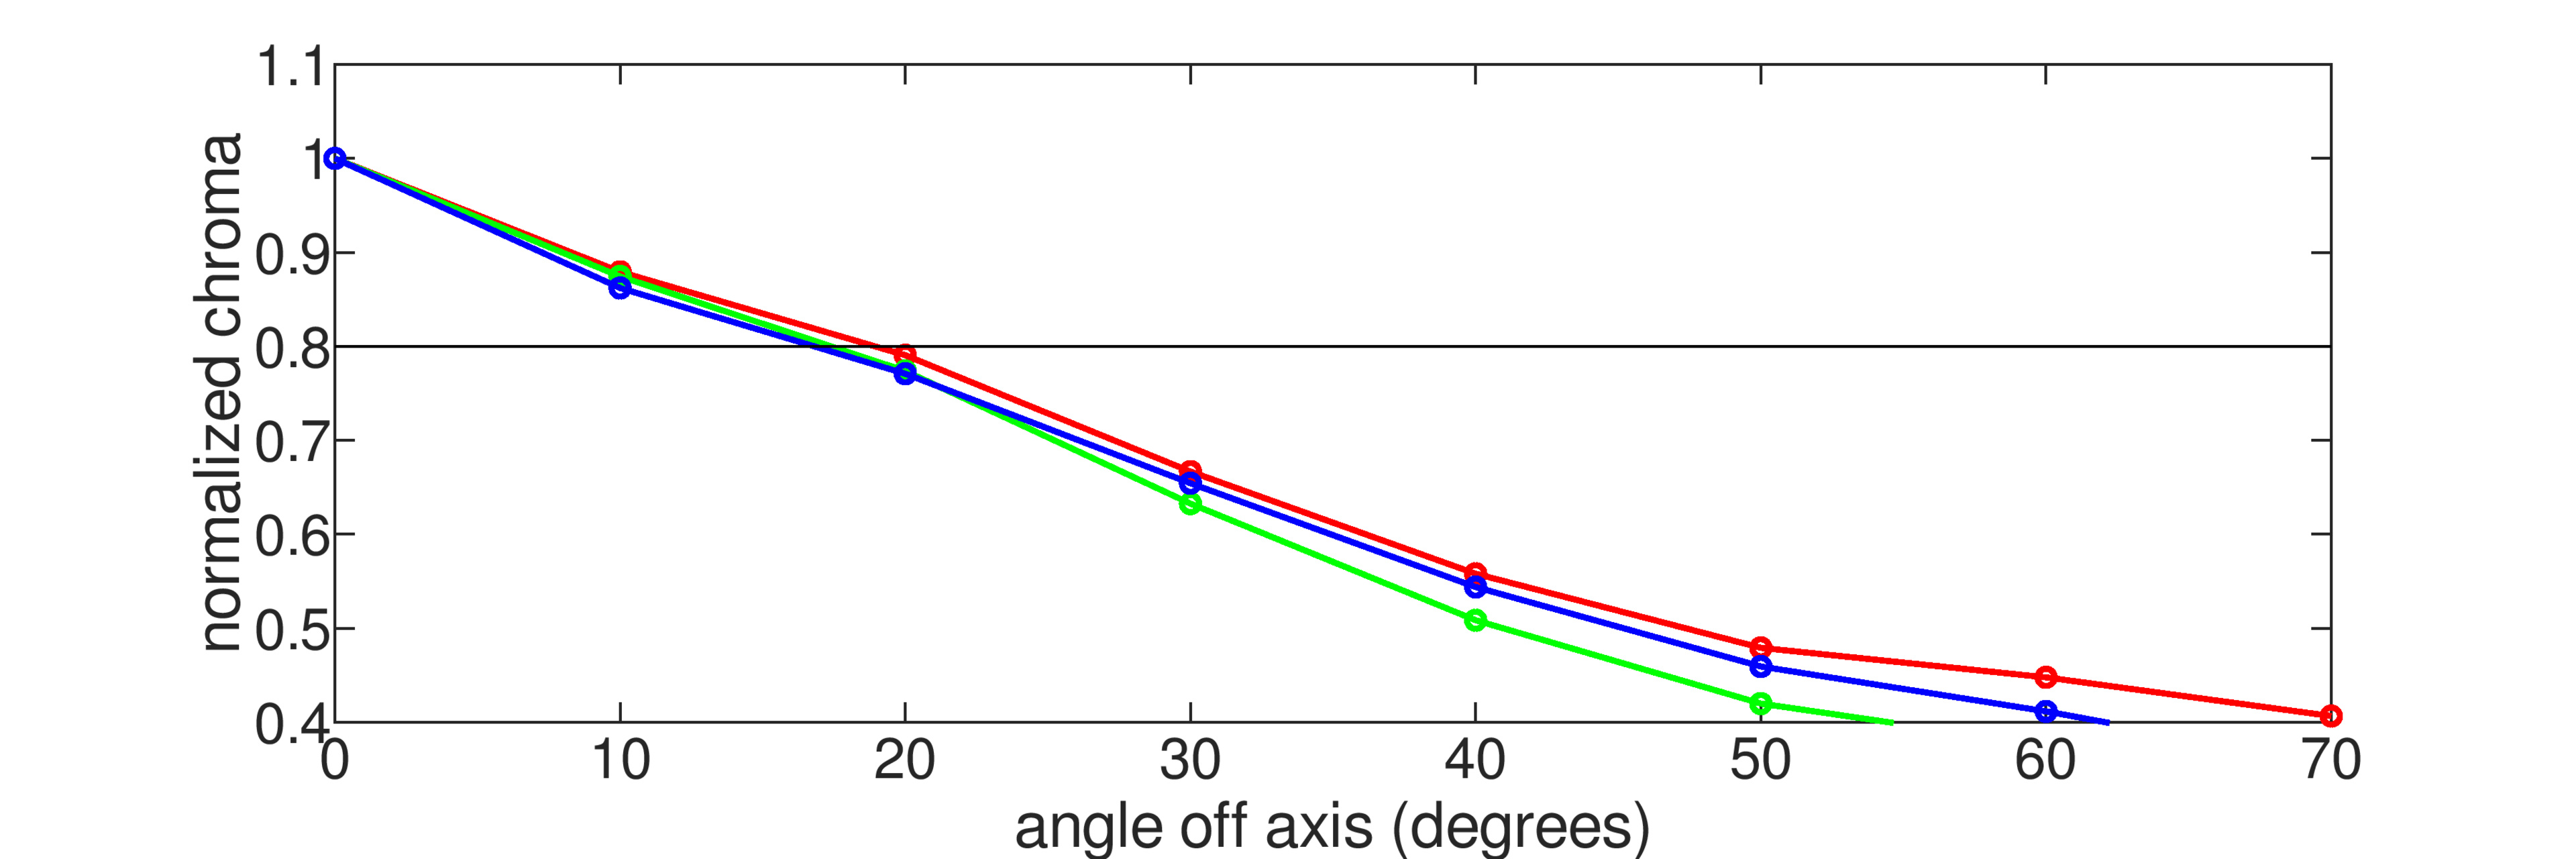
A TV's viewing angle tells us when an image starts to look inaccurate when viewing off-center. Whether we've realized it or not, an image appears differently when viewed from the side, and some TVs retain image accuracy at an angle better than others. If you need a TV that looks good from various positions in a room with a wide seating arrangement, wide viewing angles are very important. However, if you sit directly in front of the TV, viewing angles aren't as important to you.
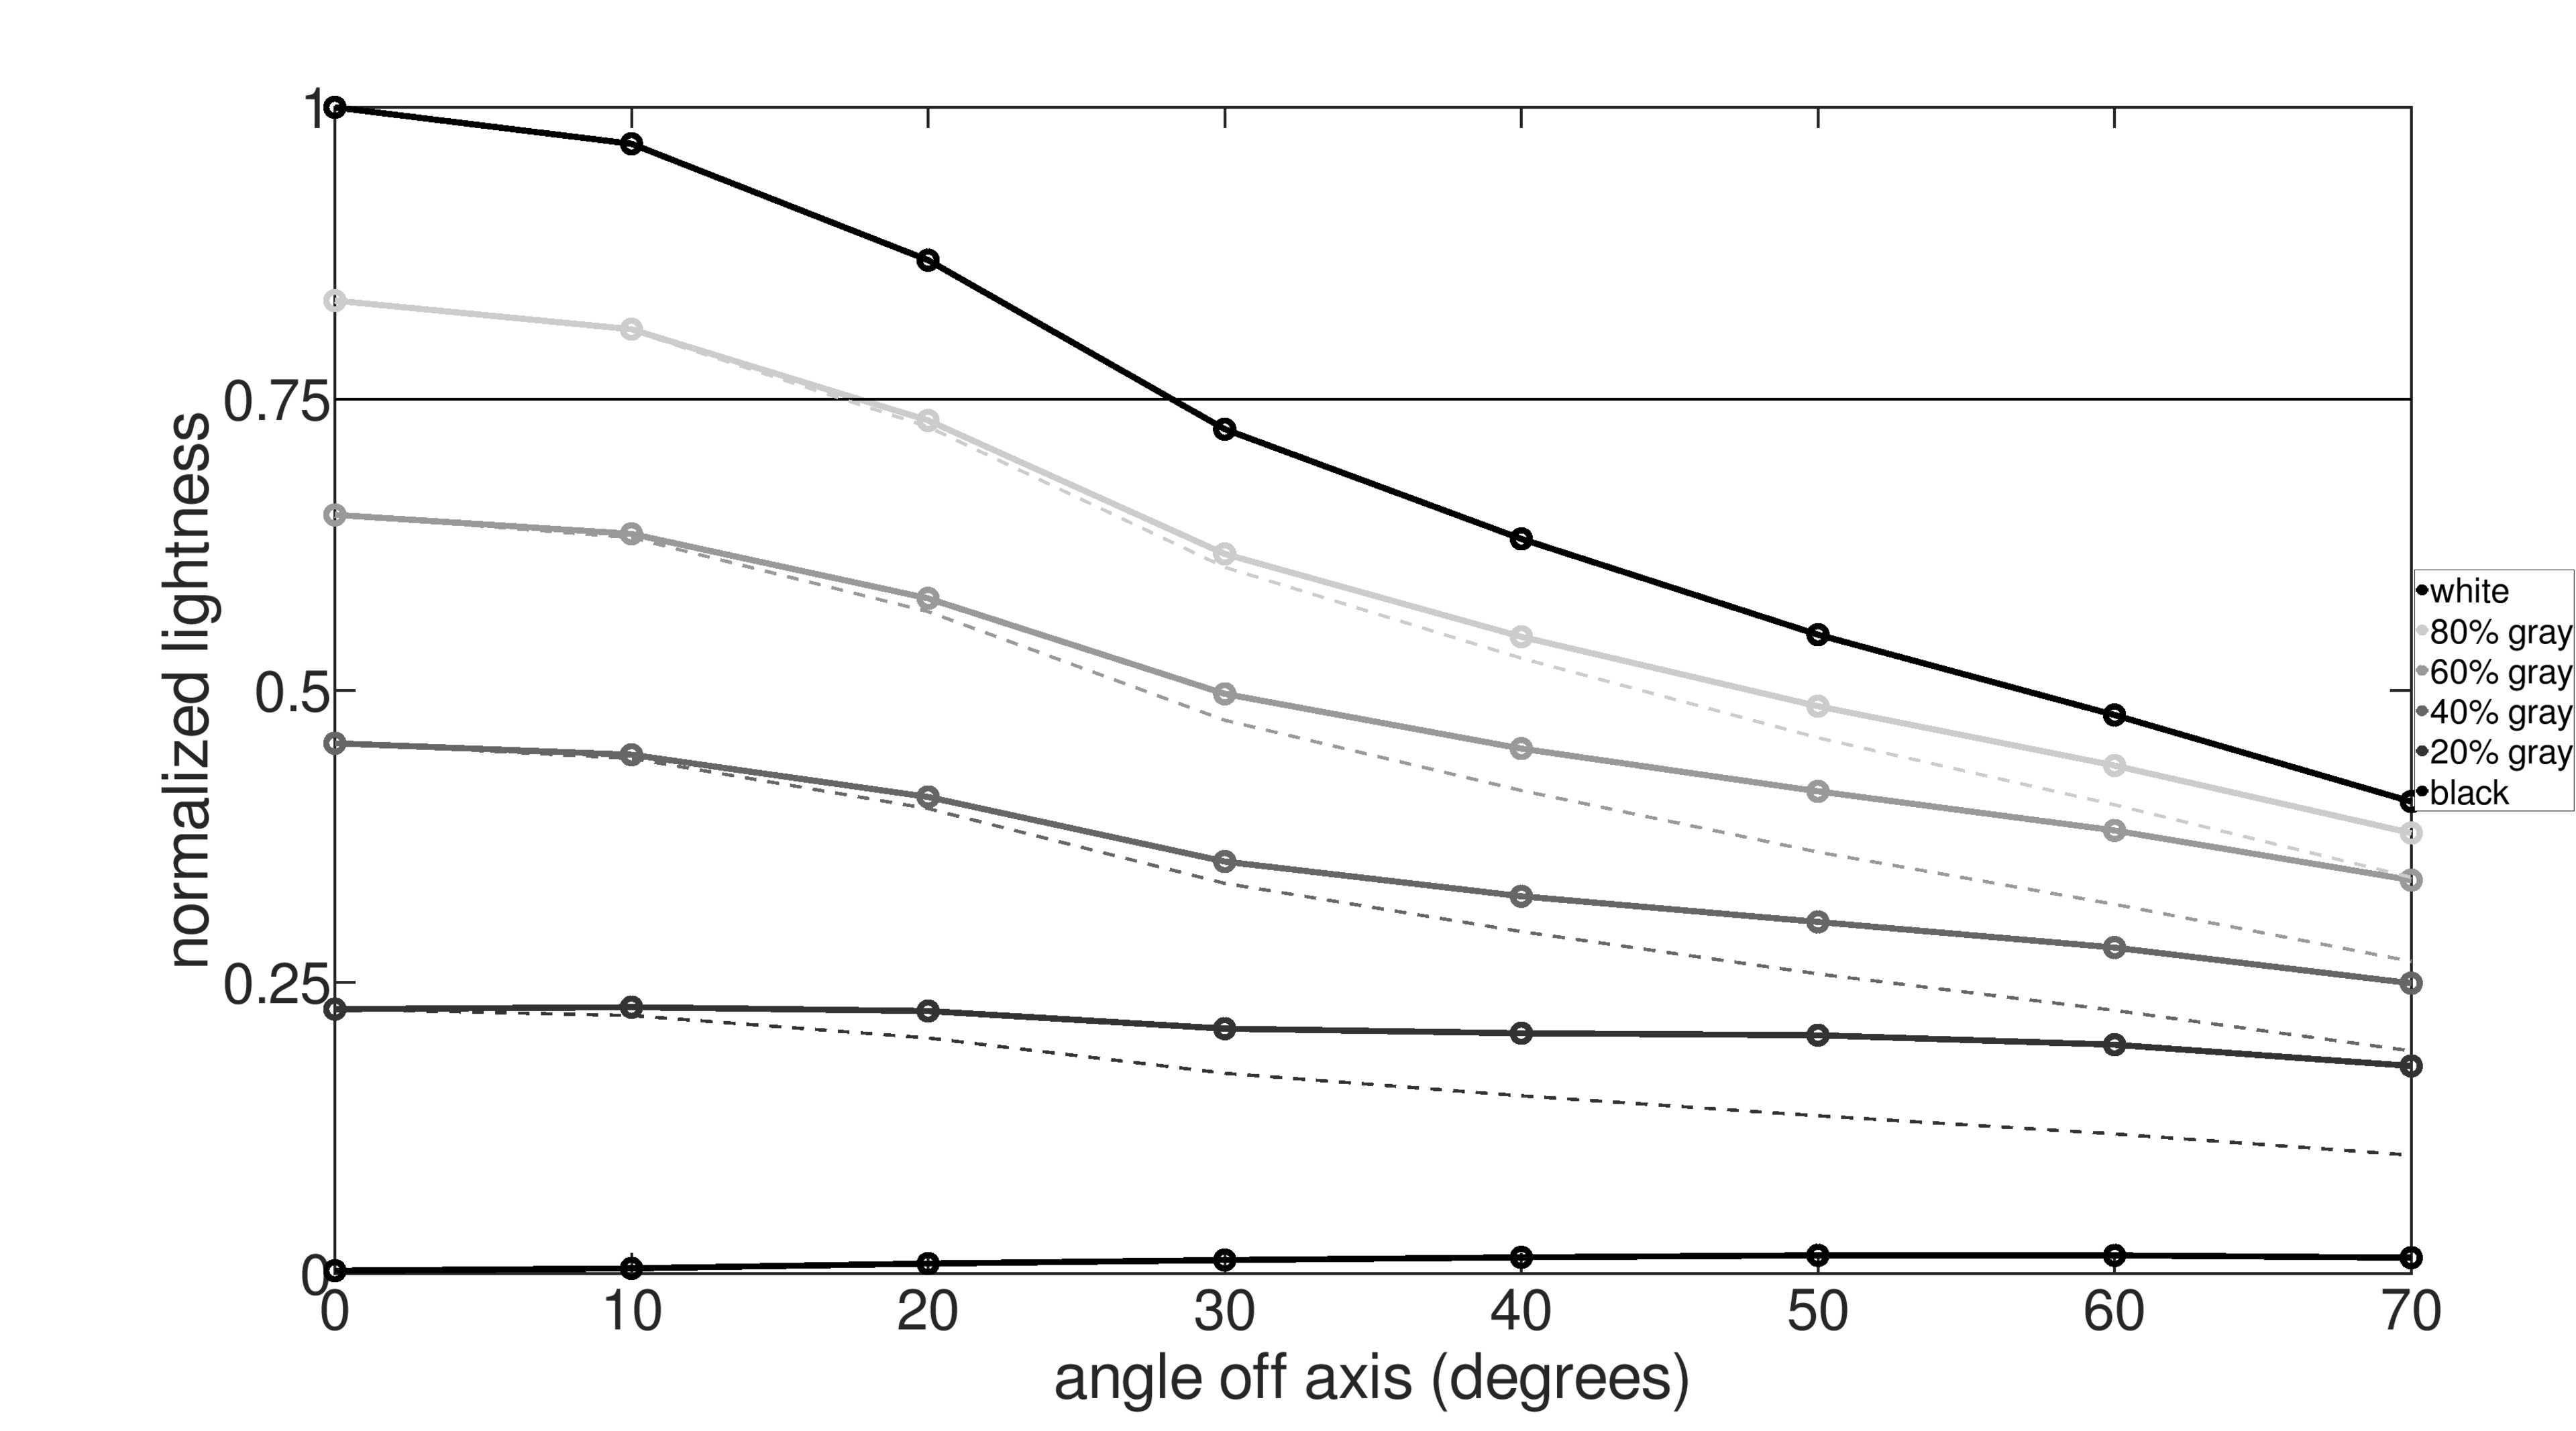
Comparing these two TVs, we were surprised to find that the viewing angle differs considerably between them, although our scoring isn't sensitive enough to capture these differences. Both TVs utilize TCL's CrystGlow WHVA panel, which is designed to enhance viewing angles over traditional HVA panels without compromising contrast. However, the 98QM8K performs noticeably worse in several aspects. Colors wash out much earlier than they do on the 65-inch model, and beyond just crossing our "bad" threshold earlier, they also decrease rapidly after that point. On the 65-inch model, not only do colors cross that threshold later, but the slope of the decrease is much shallower, meaning colors don't desaturate as aggressively when viewed from the sides. Similarly, colors shift sooner on the 98-inch model, but even more importantly, they separate quickly, with reds increasing subtly and greens and blues decreasing.
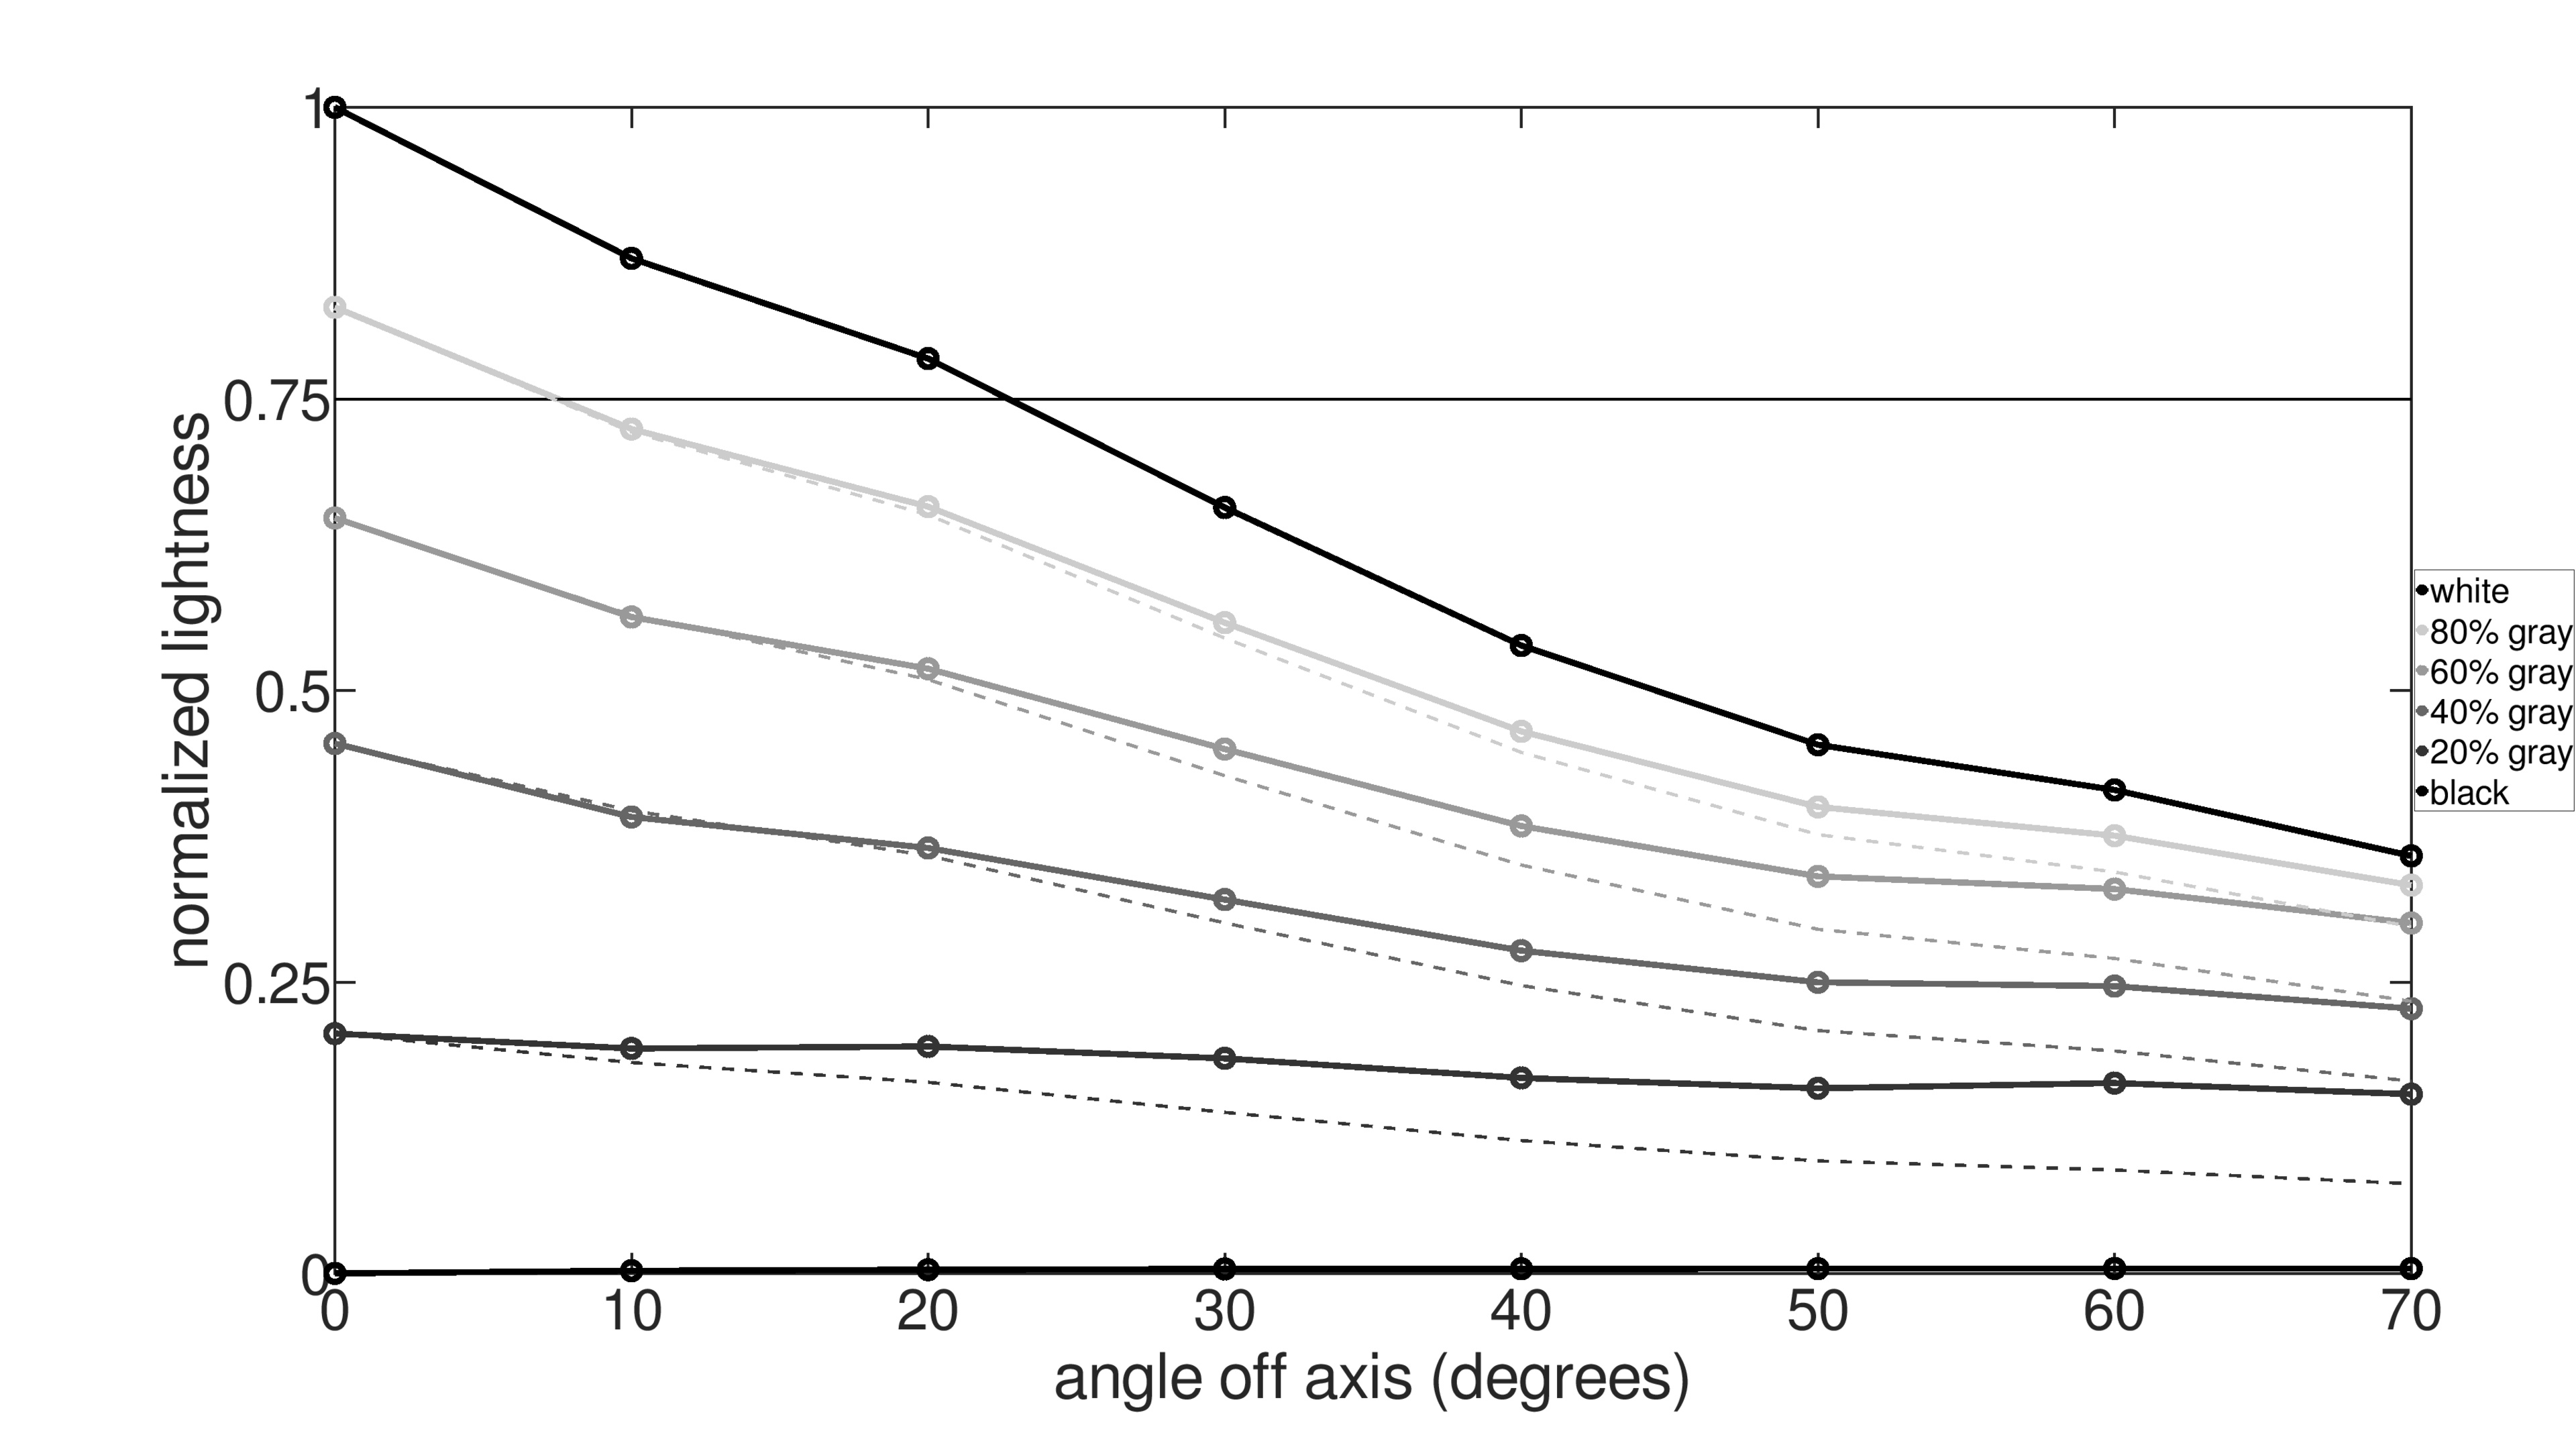
Turning to lightness, the 98-inch actually has a slight advantage over the 65-inch model. While brightness drops off more rapidly, there's very little black level raise, so the image doesn't look washed out when viewed from the sides. All of this together indicates that the 98-inch model loses color saturation and accuracy when viewed from the sides, which can be a significant issue with a TV of this size. This can be a noticeable issue even if you're sitting directly in front of the TV, as, depending on your viewing distance, the sides of the screen might already start to lose color saturation.
Size-To-Distance
| TCL 98QM8K | TCL 65QM8K | |
|---|---|---|
| Width | 85.4" (217 cm) | 56.7" (144cm) |
| Height | 48" (121.9 cm) | 31.9" (81 cm) |
| Area | 4,099 in² ( 2.64 m²) | 1,809 in² (1.17 m²) |
| Recommended Mixed Usage Distance (30°) |
13'3" (4.05m) | 8'10" (2.69m) |
| Recommended Cinema Distance (40°) |
9'9" (2.98m) | 6'6" (1.98m) |
Going from 65 inches to 98 inches is a fairly significant increase in size. The 98-inch TV has roughly 127% more screen area. Using our size-to-distance calculator, we can see that this results in a fairly significant increase in the recommended viewing distance for the 98-inch model, so it's not well-suited for smaller rooms.
Conclusion
Overall, TCL has done a great job of keeping things consistent across the different sizes of the TCL QM8K. There's very little difference in performance between the 65-inch and 98-inch models. Ultimately, your budget and room size should be the deciding factors when choosing between them.