Graphical performance is an important aspect to consider when choosing a laptop. While it's true that even the weakest integrated graphics on the market can easily handle light productivity tasks like web browsing and video playback, having more power under the hood can help provide a more responsive desktop experience. Better performance also means you can do more things, like 3D graphics and gaming, and it lets you use the device for longer before needing an upgrade, saving you money in the long run. Choosing a laptop with enough graphics performance for your needs is challenging, though, as there's a lot of competition on the market, and even the same GPU can perform very differently depending on the power draw and the laptop's cooling capacity. To simplify the process, synthetic benchmarks like the ones detailed below provide a quick, easy way to see a laptop's graphical performance and compare it to other models.
This article details the graphics benchmarks used in our laptop testing and the conditions under which we perform them.
Note: This test was updated with Test Bench 0.9. Therefore, this article applies only to any laptop reviews on that test bench. You can learn more by reading our Test Bench 0.9 changelog.
Test results
When It Matters
The Low/High-Tier Graphics and Professional 3D (GPU accelerated) boxes contain synthetic benchmarks designed to assess a system's graphical performance in various workloads, including processes like 2D/3D graphics rendering and machine learning, as well as modern game techniques like ambient occlusion and depth-of-field. These benchmarks provide a quick way to see the system's general graphical performance and compare it to other models and configurations, so you can find the laptop that best suits your needs.
Our Tests
environment, settings, and procedures
We perform the Low-Tier Graphics, High-Tier Graphics, and Professional 3D tests under the same conditions as all other benchmarks. This involves putting the laptop in a temperature-controlled room set to 21 °C (69.8 °F), with at least one foot of space behind the laptop to avoid obstructing the exhaust vent. We power the device using its original power adapter and ensure the battery health is at 100%.
On the software side, we terminate any unnecessary background applications, as they take up system resources and can sometimes impact the benchmark scores. We also put the laptop in its highest performance mode using the system settings or pre-installed third-party software, as we want to know the laptop's maximum performance when pushed to its limits, regardless of heat and fan noise. Depending on the benchmark, we run the test one to three times. Where we conduct the test more than once, we add a break lasting up to two minutes between each run to let the components cool down; the posted results are the averages of the runs.
Low-Tier Graphics
Geekbench 6 - GPU Compute: In addition to the CPU tests, we perform Geekbench 6's GPU compute test, which evaluates how well the graphics processor handles common tasks like image processing, physics simulations, and machine learning. This test works across all three major platforms included in our tests. We perform this test once using the most appropriate API for each platform: OpenCL for Windows, Metal for macOS, and Vulkan for ChromeOS. A higher score is better. See more information about Geekbench 6 on their website.
Basemark Web 3.0: A free online graphics benchmarking tool, Basemark Web 3.0 assesses the system and browser's ability to handle web-based applications and content, including processes like JavaScript and web page rendering/responsiveness. It works across all three major platforms. We perform this test three times with a two-minute break between each run. A higher score is better. You can run the Basemark Web 3.0 test on its site.
PassMark PT 2D Mark: This test (version 11.x) evaluates how well the system handles 2D graphical tasks like web graphics rendering and CAD applications. It only works on Windows and ChromeOS devices, so we skip this test on Apple MacBooks. Regarding Chromebooks, we use the Android version to perform the test. The results from the Android version (10.x) differ greatly from the Windows version, meaning they aren't comparable, which is why we show the result from ChromeOS devices separately as PassMark PT 2D Mark (Android). We perform this test twice with a two-minute break between the runs. A higher score is better. See more information about this benchmarking tool on PassMark's site.
PassMark PT 3D Mark: Like the 2D test above, this evaluates the system's graphics performance but in a 3D environment, using pre-rendered scenes. The same limitations apply, meaning this test only works on Windows and ChromeOS devices, so we skip it on MacBooks and show results obtained on Chromebooks separately as PassMark PT 3D Mark (Android). We perform this test three times with a two-minute break between each run. A higher score is better.
Novabench 5 - GPU: Novabench 5's GPU test evaluates three aspects: 3D graphics, compute, and memory transfer. The 3D graphics test assesses how well the system handles models, textures, and shaders in various workloads, including gaming and CAD. The compute portion tests the GPU's ability to perform mathematical calculations like data analysis and machine learning. Last, we have the memory transfer test, which measures the data transfer rate within the GPU's memory and between the system and the GPU's memory. This benchmark suite only works on Windows devices and Macs, so we skip it on Chromebooks. We perform this test once. A higher score is better. See more information about Novabench 5 on its website.
mprep - Stress My GPU: mprep is a benchmarking tool available on the internet, and you can access it via any web browser. The benchmark function measures the GPU's performance in complex math calculations, which can be indicative of the performance in some real-world workloads, like crypto-mining. This test works across all three platforms we currently test. We perform this test once. A higher score is better. Run the mprep benchmark.
High-Tier Graphics
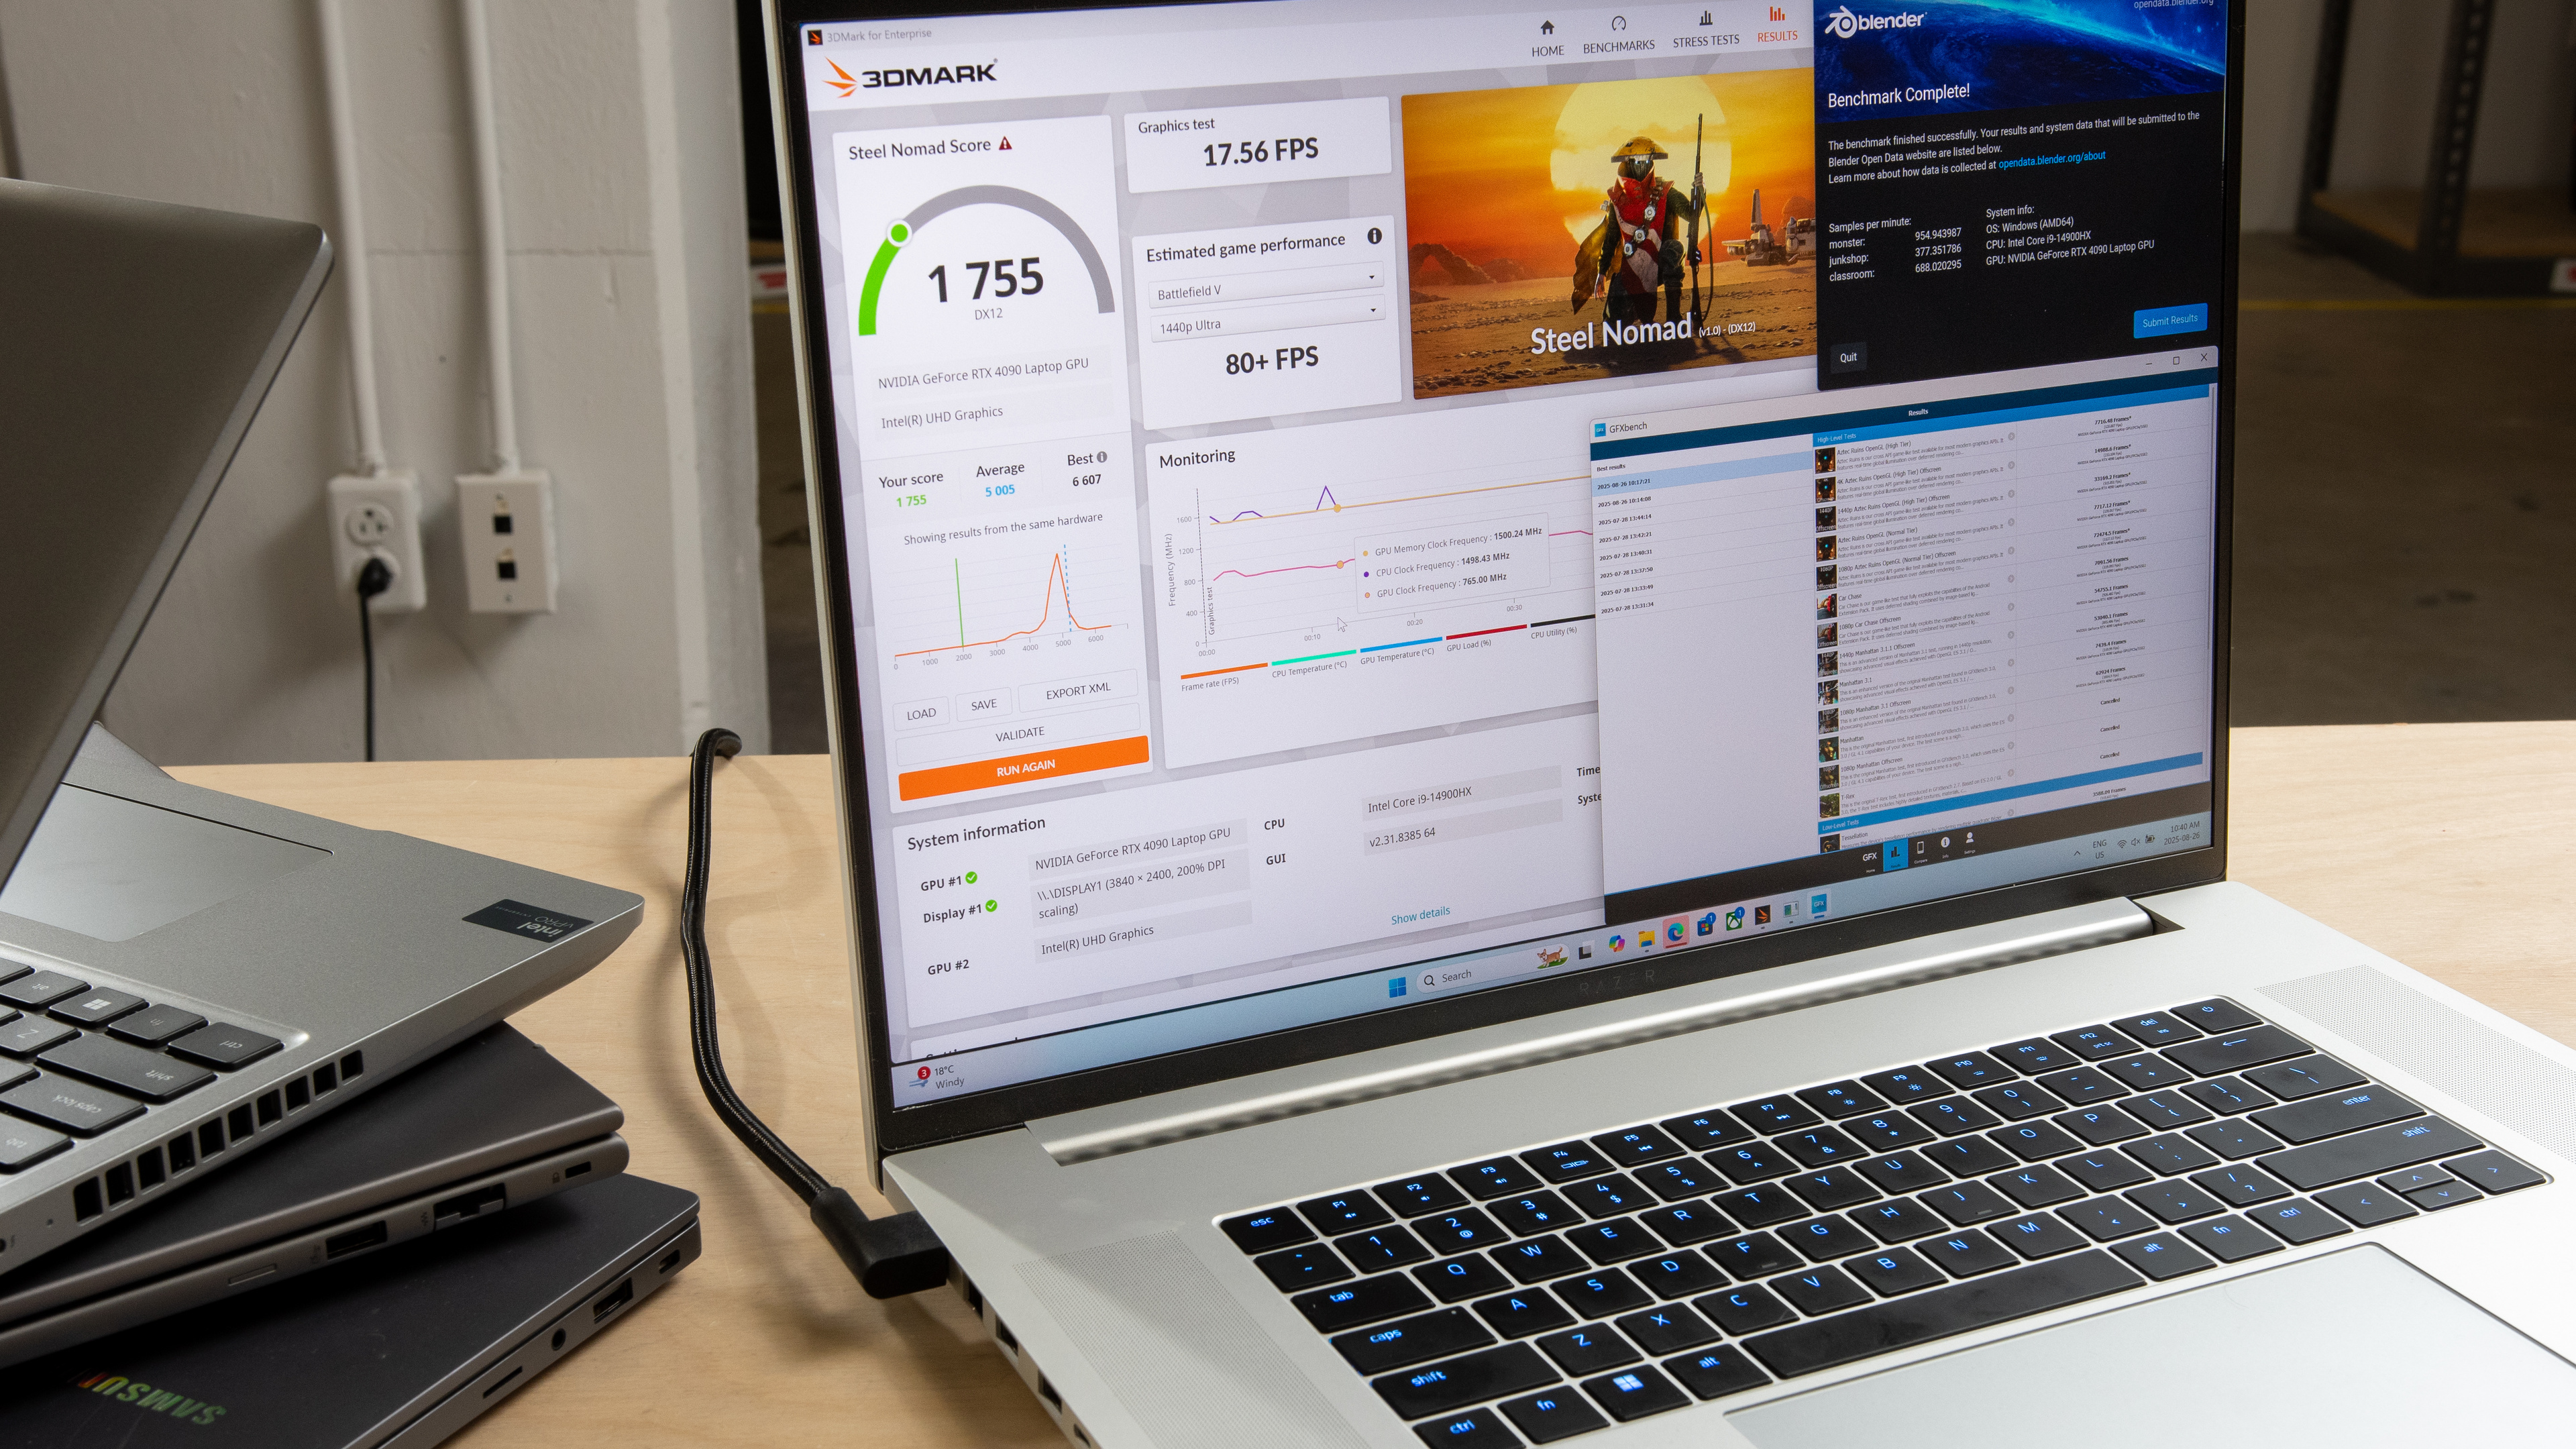
3DMark - Steel Nomad: This benchmark (version 2.3.1.x) tests how well the GPU handles graphically intensive, non-ray-traced games, focusing on processes like procedural grass, ambient occlusion, and depth-of-field. The DX12 result only applies to Windows devices. A separate 3DMark - Steel Nomad (Vulkan/Metal) test follows; this lets you compare the performance of Windows laptops and MacBooks when using the Vulkan or Metal API, respectively. We skip this test on Chromebooks, as the benchmark doesn't run on ChromeOS even though there's an Android version available. We run this test three times with a two-minute break between each run. A higher score is better. See more information about the Steel Nomad test on 3DMark's site.
Basemark GPU (DX12): Basemark GPU is another popular cross-platform benchmarking tool used to evaluate a system's graphics API performance using game-like scenes. Like Steel Nomad, the DX12 mode only applies to Windows devices. For MacBooks and Chromebooks, we use the Metal and Vulkan APIs, respectively. The texture compression setting depends on the operating system; we use bc7 whenever possible, and ASTC for Chromebooks. Results obtained on MacBooks and Chromebooks appear separately as Basemark GPU (Vulkan/Metal). We run this test twice with a one-minute break between the two runs. A higher score means better performance. See more information about this benchmarking tool on Basemark GPU's site.
GFXBench - High Level Test (Vulkan/Metal): This benchmark involves running the '4K Aztek Ruins Vulkan (High Tier) Offscreen' test, which assesses the system's ability to handle low-level APIs and compute shaders. It works on all three platforms included in our current test bench. We do this twice with a one-minute break between the two runs. The result is in the form of frames per second; a higher number indicates better performance. See more information about this benchmarking tool on GFXBench's site.
Professional 3D
Blender GPU (avg): This is the same 3D rendering test as the CPU Blender test in the CPU/RAM Performance section, but instead of the CPU, the application leverages the GPU. The GPU rendering option is only available if support exists for the selected GPU. Also, this test doesn't work on ARM-based Windows laptops and Chromebooks, so we only run it on x86 Windows devices and Macs. We perform this benchmark once. The result is the number of samples rendered in a minute; a higher number of samples means better performance. See more information about this benchmarking tool on Blender's site.
Cinebench 2024 - GPU: The GPU test uses the same render scene as the CPU test in the CPU/RAM Performance section, but it leverages the GPU instead. While this benchmark evaluates performance using real-time rendering tasks, you can still see the score as an indication of the GPU's general performance, especially in sustained workloads that would cause thermal throttling. Again, this test doesn't work on ARM-based Windows laptops and Chromebooks, so we only run it on x86 Windows devices and MacBooks. We run the 10-minute test twice with a two-minute break between the two runs. You can learn more about Cinebench 2024 on Maxon's site.
Additional Information
While synthetic benchmarks are useful for understanding a system's performance and for comparison with other models and configurations, don't get too caught up in the specific numbers because many factors can influence the score, like background processes, firmware version, and other system components. The best use of such benchmark tools is to gauge the system's general performance and see how it stacks up against other models on the market.
If you want to know more about other tests in our laptop reviews, take a look at our How We Test Laptops article, as we give you a quick overview of all the tests we perform when reviewing a laptop.
Conclusion
If you want to see how your system stacks up and whether you need an upgrade, many of the benchmark suites detailed above are available free of charge from the creators' websites. Most of these companies also post benchmark results from users, allowing you to see the performance of other GPUs and systems on the market.