Last year, we published an article titled Our Plan To Solve The Motion Mystery On TVs, which addressed cadence, flicker, motion blur, and motion artifacts. Since then, we received a lot of feedback from the community, which can be summarized in these four aspects:
- Stutter: People complain that the movement looks jaggy, mainly on OLED displays.
- Motion interpolation: How does it work, and what settings should users choose to reduce stutter without introducing the soap opera effect?
- Judder: Uneven display of frames when watching 24p through 60p
- Motion blur: Blur around objects in fast-moving scenes.
Our latest test bench update mainly addressed judder with a small emphasis on stutter. For our newest TV TBU, we decided to diverge from our original plan and postpone work on flicker, as most televisions today use flicker frequencies above the perceptual threshold. Instead, this article focuses on three key pillars: cadence, motion blur, and artifacts, to address the concerns most often raised by the community and introduce an updated motion handling performance score that better reflects what matters to users.
The article mainly focuses on cinematic content, which includes motion in movies and TV shows. The reason is that low-frame-rate content (24p/25p) behaves very differently across the four aspects mentioned above, but some hints will be given throughout on the impact on higher-frame-rate content, such as sports (60 fps) or gaming (>60 fps).
How Display Technology Shapes Motion
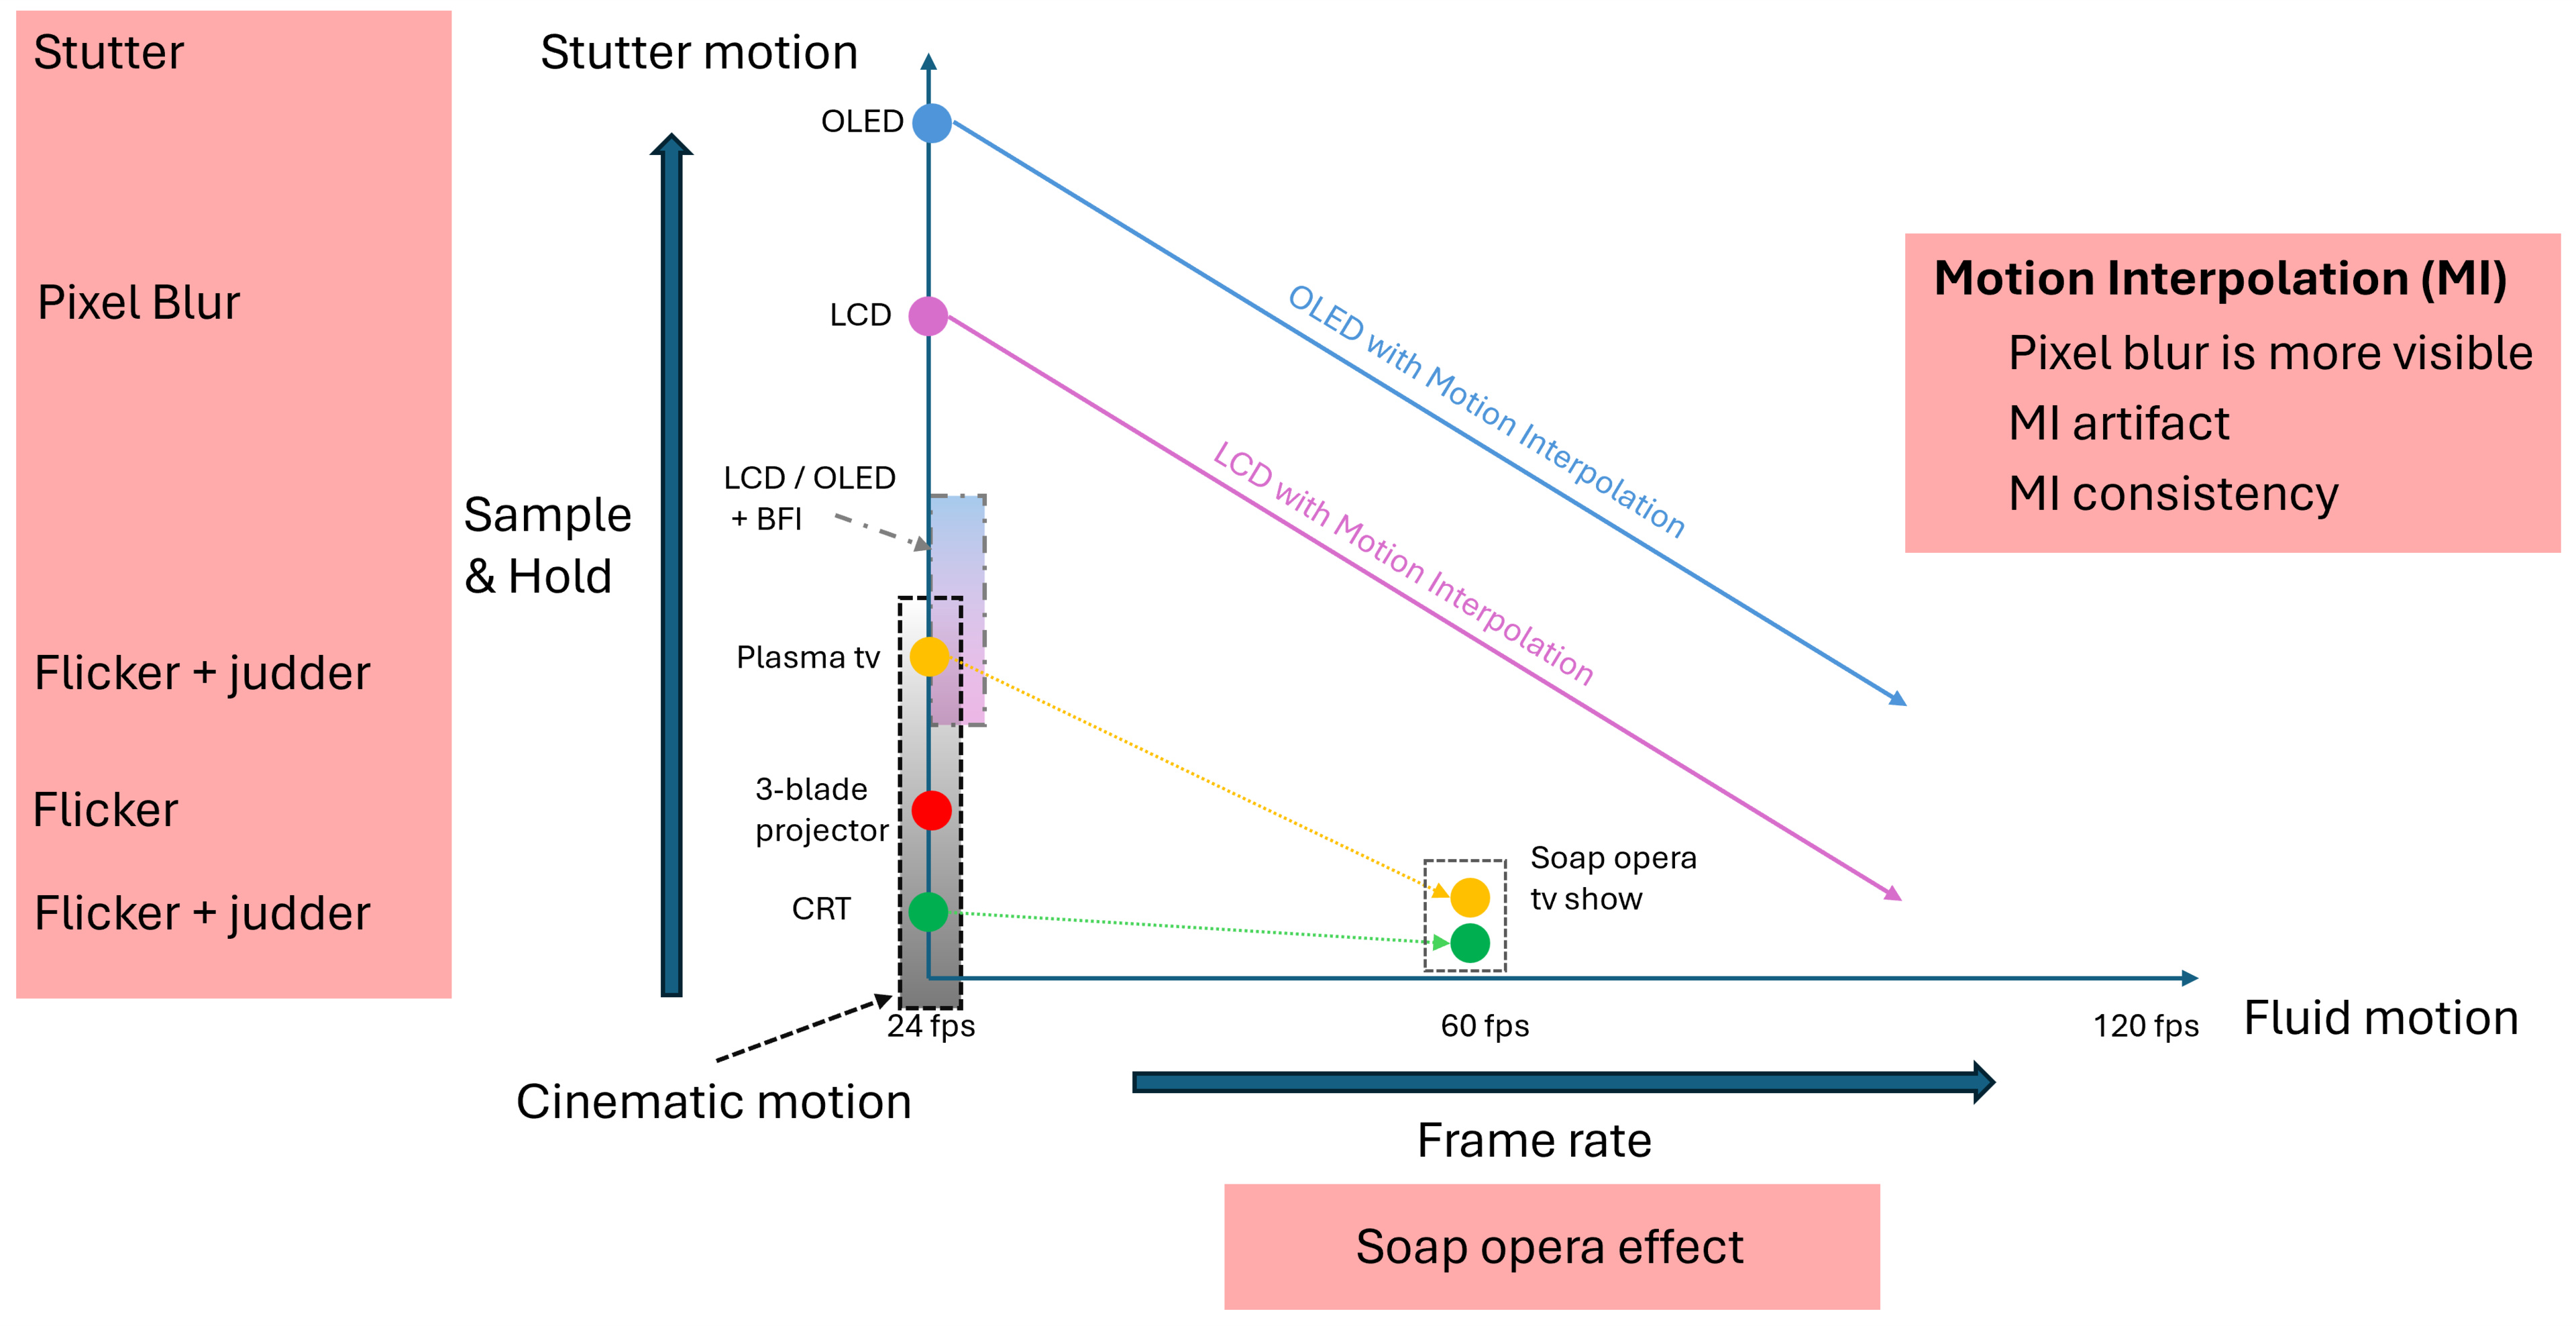
When discussing motion on a television, users generally look for the television that delivers the best cinematic motion without stuttering or the soap opera effect. These three concepts are introduced in the motion map graph above, which we'll use to walk you through the history of display technology and how it shaped motion perception. The motion map graph shows the content frame rate on the x-axis and the "sample and hold" amount on the y-axis.
The cinematic look of the film projector
Any display simply gives the impression of movement by tricking our eyes into seeing an object move by quickly displaying a series of still images. The first projector achieved this by unrolling a series of still images assembled into a film strip in front of a light source, which projected the images sequentially onto a wall. To avoid a messy blur between image transitions during film unrolling, a two-sided rotating disk was placed in front of the light beam, blocking the light on one side during unrolling and allowing it to pass through on the other. The first projector produced an unbearable amount of flicker, with every frame followed by a black screen, resulting in a ~24 Hz flicker.
These projectors were gradually replaced by either two or three-blade projectors early in the 20th century, which respectively doubled (48Hz) or tripled (72Hz) the flicker frequency, making it less perceptible. The content stayed at 24 frames per second, since the film moved only once per full rotation of the blade, but it created a completely different look. These projectors were used for more than half a century, until the emergence of digital projectors in the early 21st century. Their widespread use over that long period of time established what we often refer to as the cinematic look.
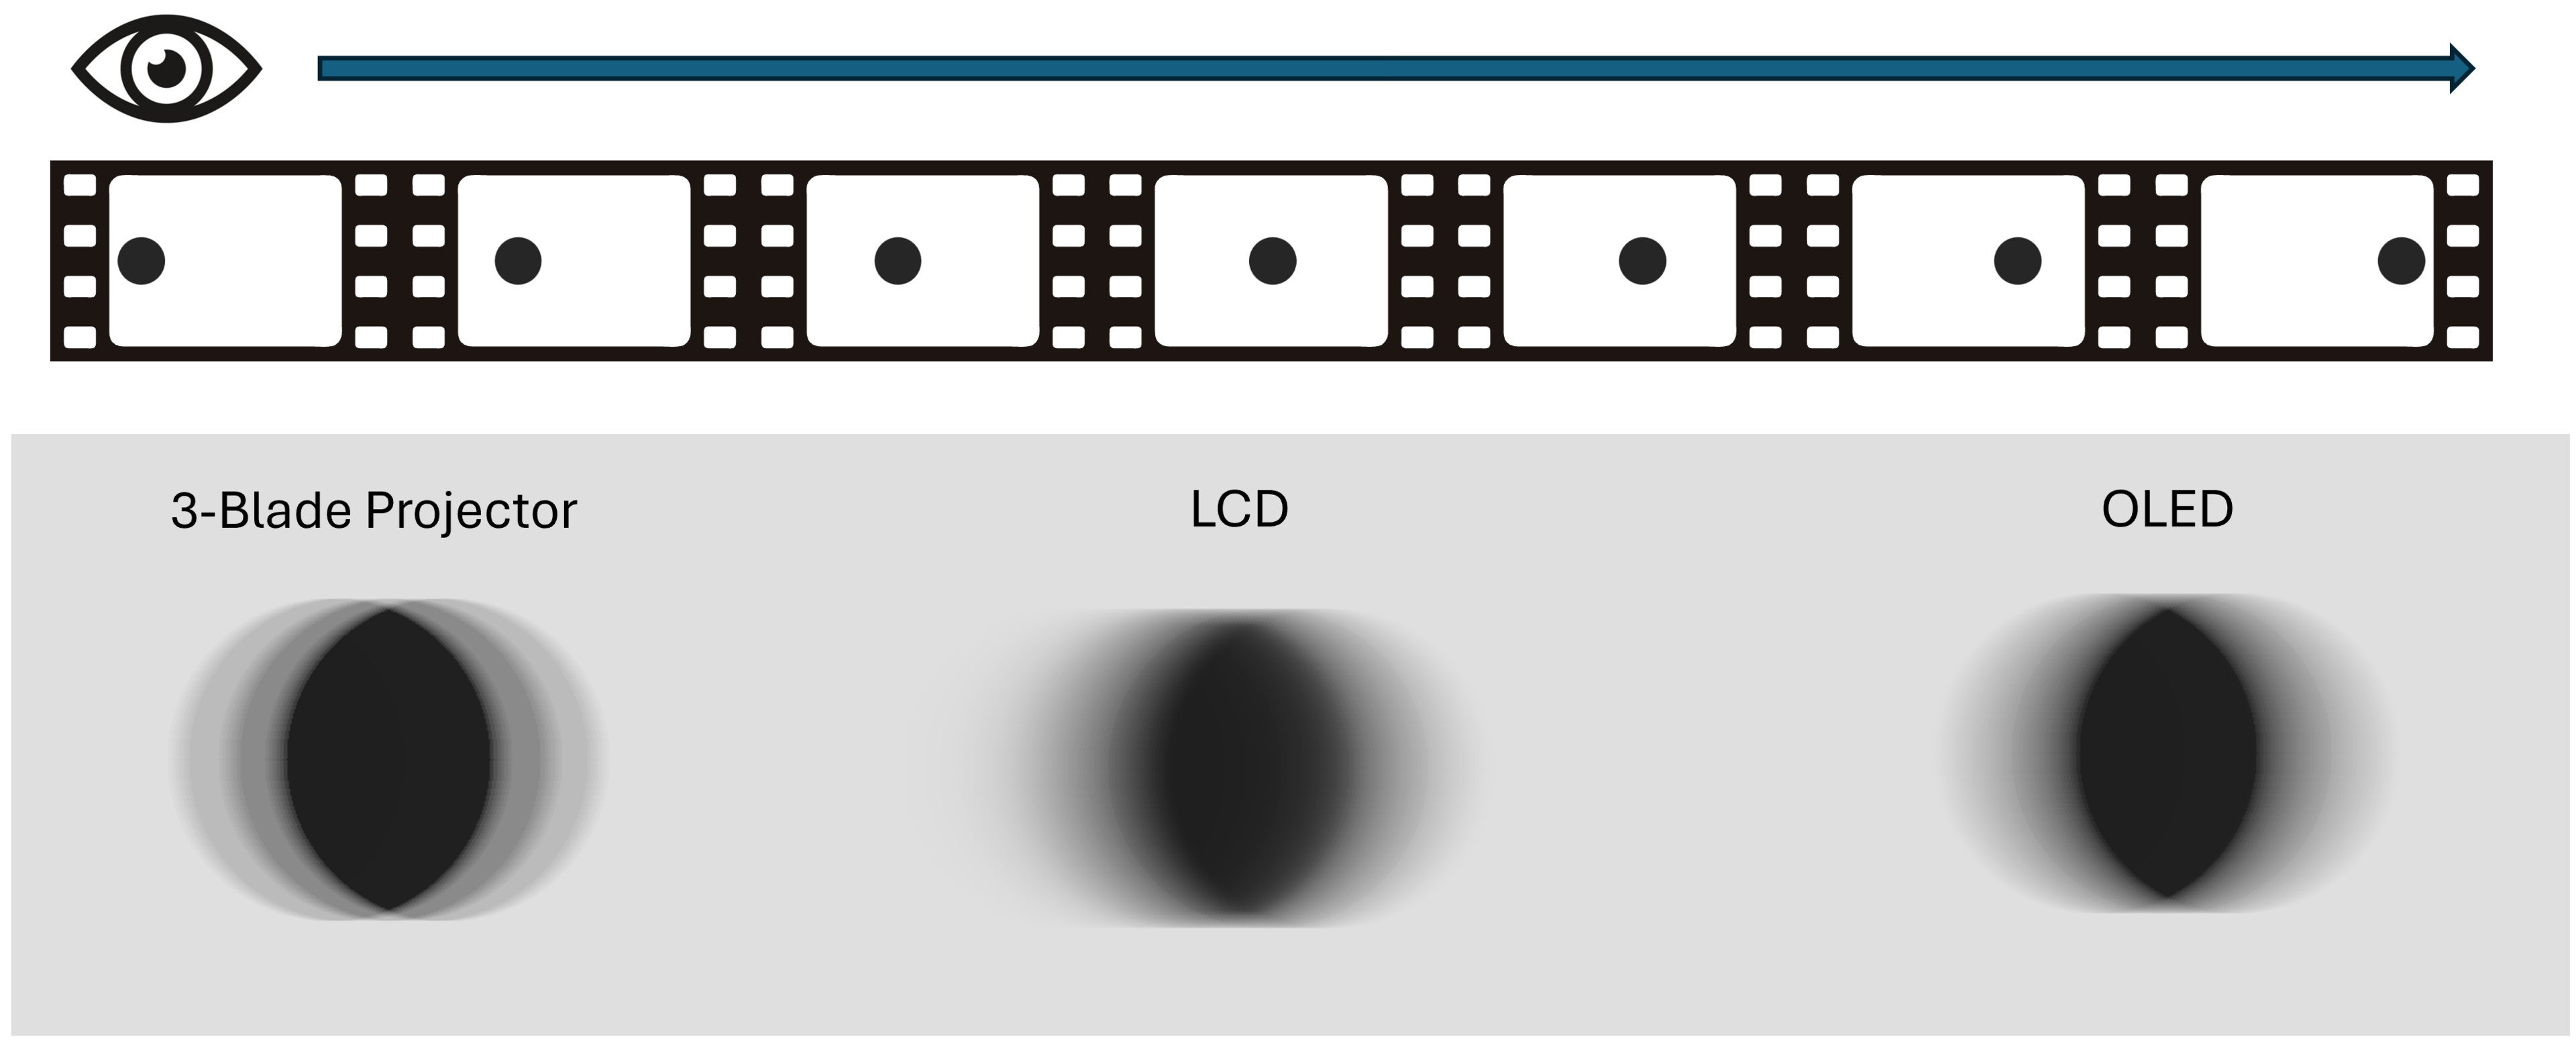
The look is achieved by inserting a black frame between frames, which gives your brain time to fill the gap and results in a clean duplication of the object under observation in its direction of movement, as shown on the left in the picture below. Beyond the technology standpoint, the cinema industry evolves around this, creating artistic content designed to be seen this way. The same approach was used in early commercial displays, such as CRT and plasma televisions, which use 60Hz due to limitations of the power grid. Since 60Hz is not a multiple of 24p, there is no way to evenly divide the number of original images in the content into the refresh rate, which causes judder. CRT had the least "sample and hold" of all technologies because it scanned with an electron beam that illuminated each pixel for only a fraction of a second.
The use of a black frame to separate the static frame is really at the origin of the cinematic look. Even today, televisions try to imitate this look with the Black Frame Insertion. Not all technologies implement it the same way, but this always results in some perceptible flicker and judder when the flicker frequency doesn't match the content frame rate.
Soap opera shows were introduced on the radio in 1930, featuring dramatic stories. The term soap opera originated from the soap company that sponsors most of those shows and from the dramatic nature of the storyline, which was associated with opera. In 1960, TV shows began reusing the same storylines. These shows were recorded at 60 frames per second, interlaced. The result created a completely different look from a motion perspective, which was dubbed the "soap opera effect". Unfortunately, this is a bit derogatory, since those sensational TV shows were once made on a low budget. A better, neutral term to describe the look of higher-frame-rate content is "fluid motion."
The stutter of OLED
As television technology evolves, the black-frame frequency increases beyond the perceptible threshold, reducing flicker perception for most users and increasing display brightness by keeping the image on for longer. However, by keeping the same low frame rate, each frame is now held static for a longer period. Your eye's movement over the static frame creates a persistence blur that produces a trail in the direction of the object's motion, changing the original circle into an ellipse in the picture above for LCD and OLED. In addition to this persistence blur, a dynamic effect shown in the video below makes it appear as if both the left and right sides of the object are flickering. This evolution of the technology, while maintaining low frame rate content of the cinematic era, led to higher "sample and hold," creating the persistence blur and perceptual object flicker that is now referred to as stutter.
Early LCDs had quite a long response time, so whenever they changed frames, the pixel transition helped blend the frames together, reducing "sample and hold" and smoothing the persistence blur, thereby reducing the stutter's aggressiveness. However, the very long response time created very blurry motion. With improvements in LCD technology, response time decreased, and stutter became more visible. Today, OLEDs have almost instantaneous response times, making stuttering as bad as it can be and a real problem for some people who can't tolerate it.
The Fluidity of Motion Interpolation
As the content's frame rate increases, the motion looks more fluid and cleaner. This look is often favoured for sports content, as the ball in a tennis game moves across the screen very sharply. Analogously, in gaming, the enemy will appear very sharply when the avatar moves left to right in a shooting game. However, for movies and TV shows, many argue that increasing the frame rate disrupts the artistic aesthetic associated with lower frame rates.
The first high-frame-rate content widely available on television was the soap opera shows mentioned earlier. Unfortunately, high-quality content at higher frame rates, such as The Hobbit and Gemini Man, has been associated with the look of those shows dubbed with the soap opera effect.
Today, the soap opera effect is often associated with motion interpolation on televisions. Indeed, motion interpolation will increase the frame rate of the content, thereby enhancing the perception of motion fluidity. However, it can also be tuned to an intermediate frame rate that reduces stutter without adding too much fluidity, bringing you closer to the original cinematic look.
Key Factors That Affect Motion On TVs
Our first motion handling score for motion was introduced in Test Bench 2.0, with a mention of "broken," using mainly the stutter and response time metrics. Since stutter was calculated as an inverse measure of response time to infer frame hold time, this led to an overall motion score that favoured mid-tier televisions, which had average response times.
In this test bench update, we decided to focus on two new metrics to resolve these issues:
- Can we find a stutter metric that is not as tied to response time and can be used to measure stutter mitigation techniques such as motion interpolation?
- Can we measure whether a television with a slow response time mitigates stutter without causing adverse side effects?
How The "Sample And Hold" Contributes To Stutter
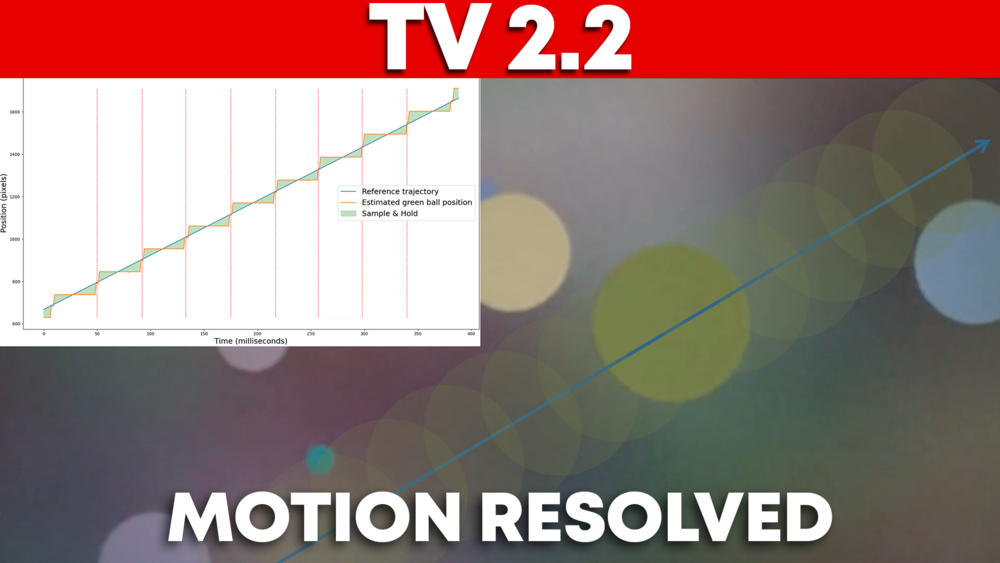
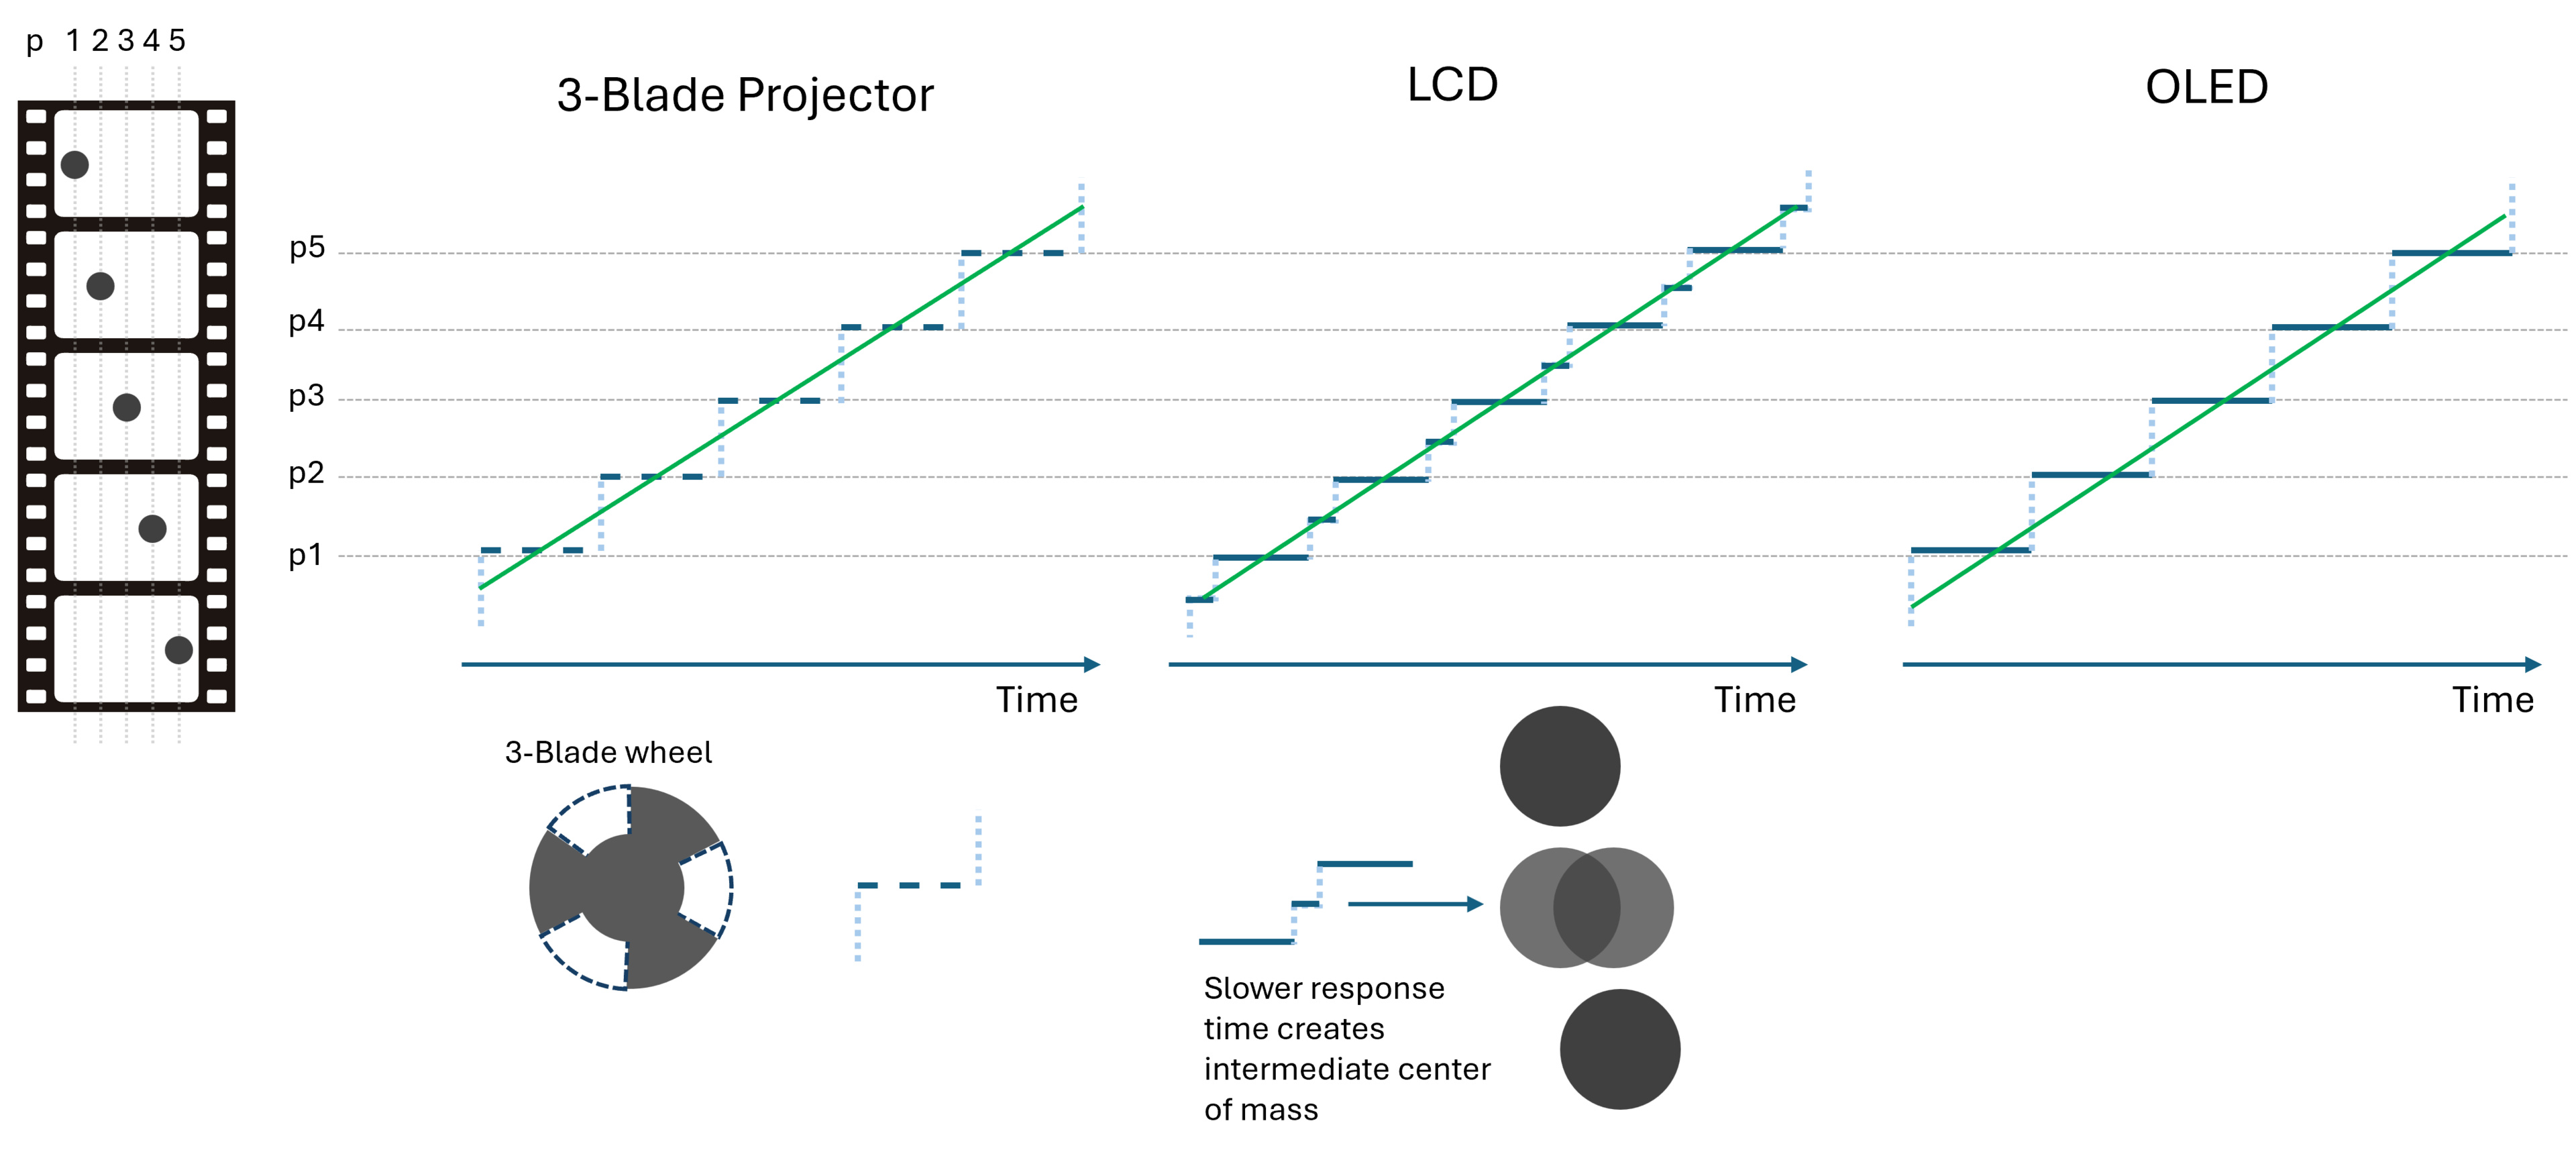
Our new stutter metric is based on the evaluation of the "sample and hold" characteristic of the television, which is often associated with stutter. The metric estimates the position of a moving object (e.g., a ball) over time, as shown in the picture below, which depicts five frames of the ball's position evolution. Each graph represents a different display technology and shows, in blue, the estimated ball position and, in green, the ideal ball motion if it were captured at an infinite frame rate. For the three-blade projector, each frame consists of three flashes, with one overlapping the expected position. For LCD, the frame is out of phase with its expected position for a longer period, but the lower response time helps create an intermediate frame that follows the ball's expected movement. The OLED "sample and hold" creates a staircase effect that appears much more jagged than the reference trajectory.
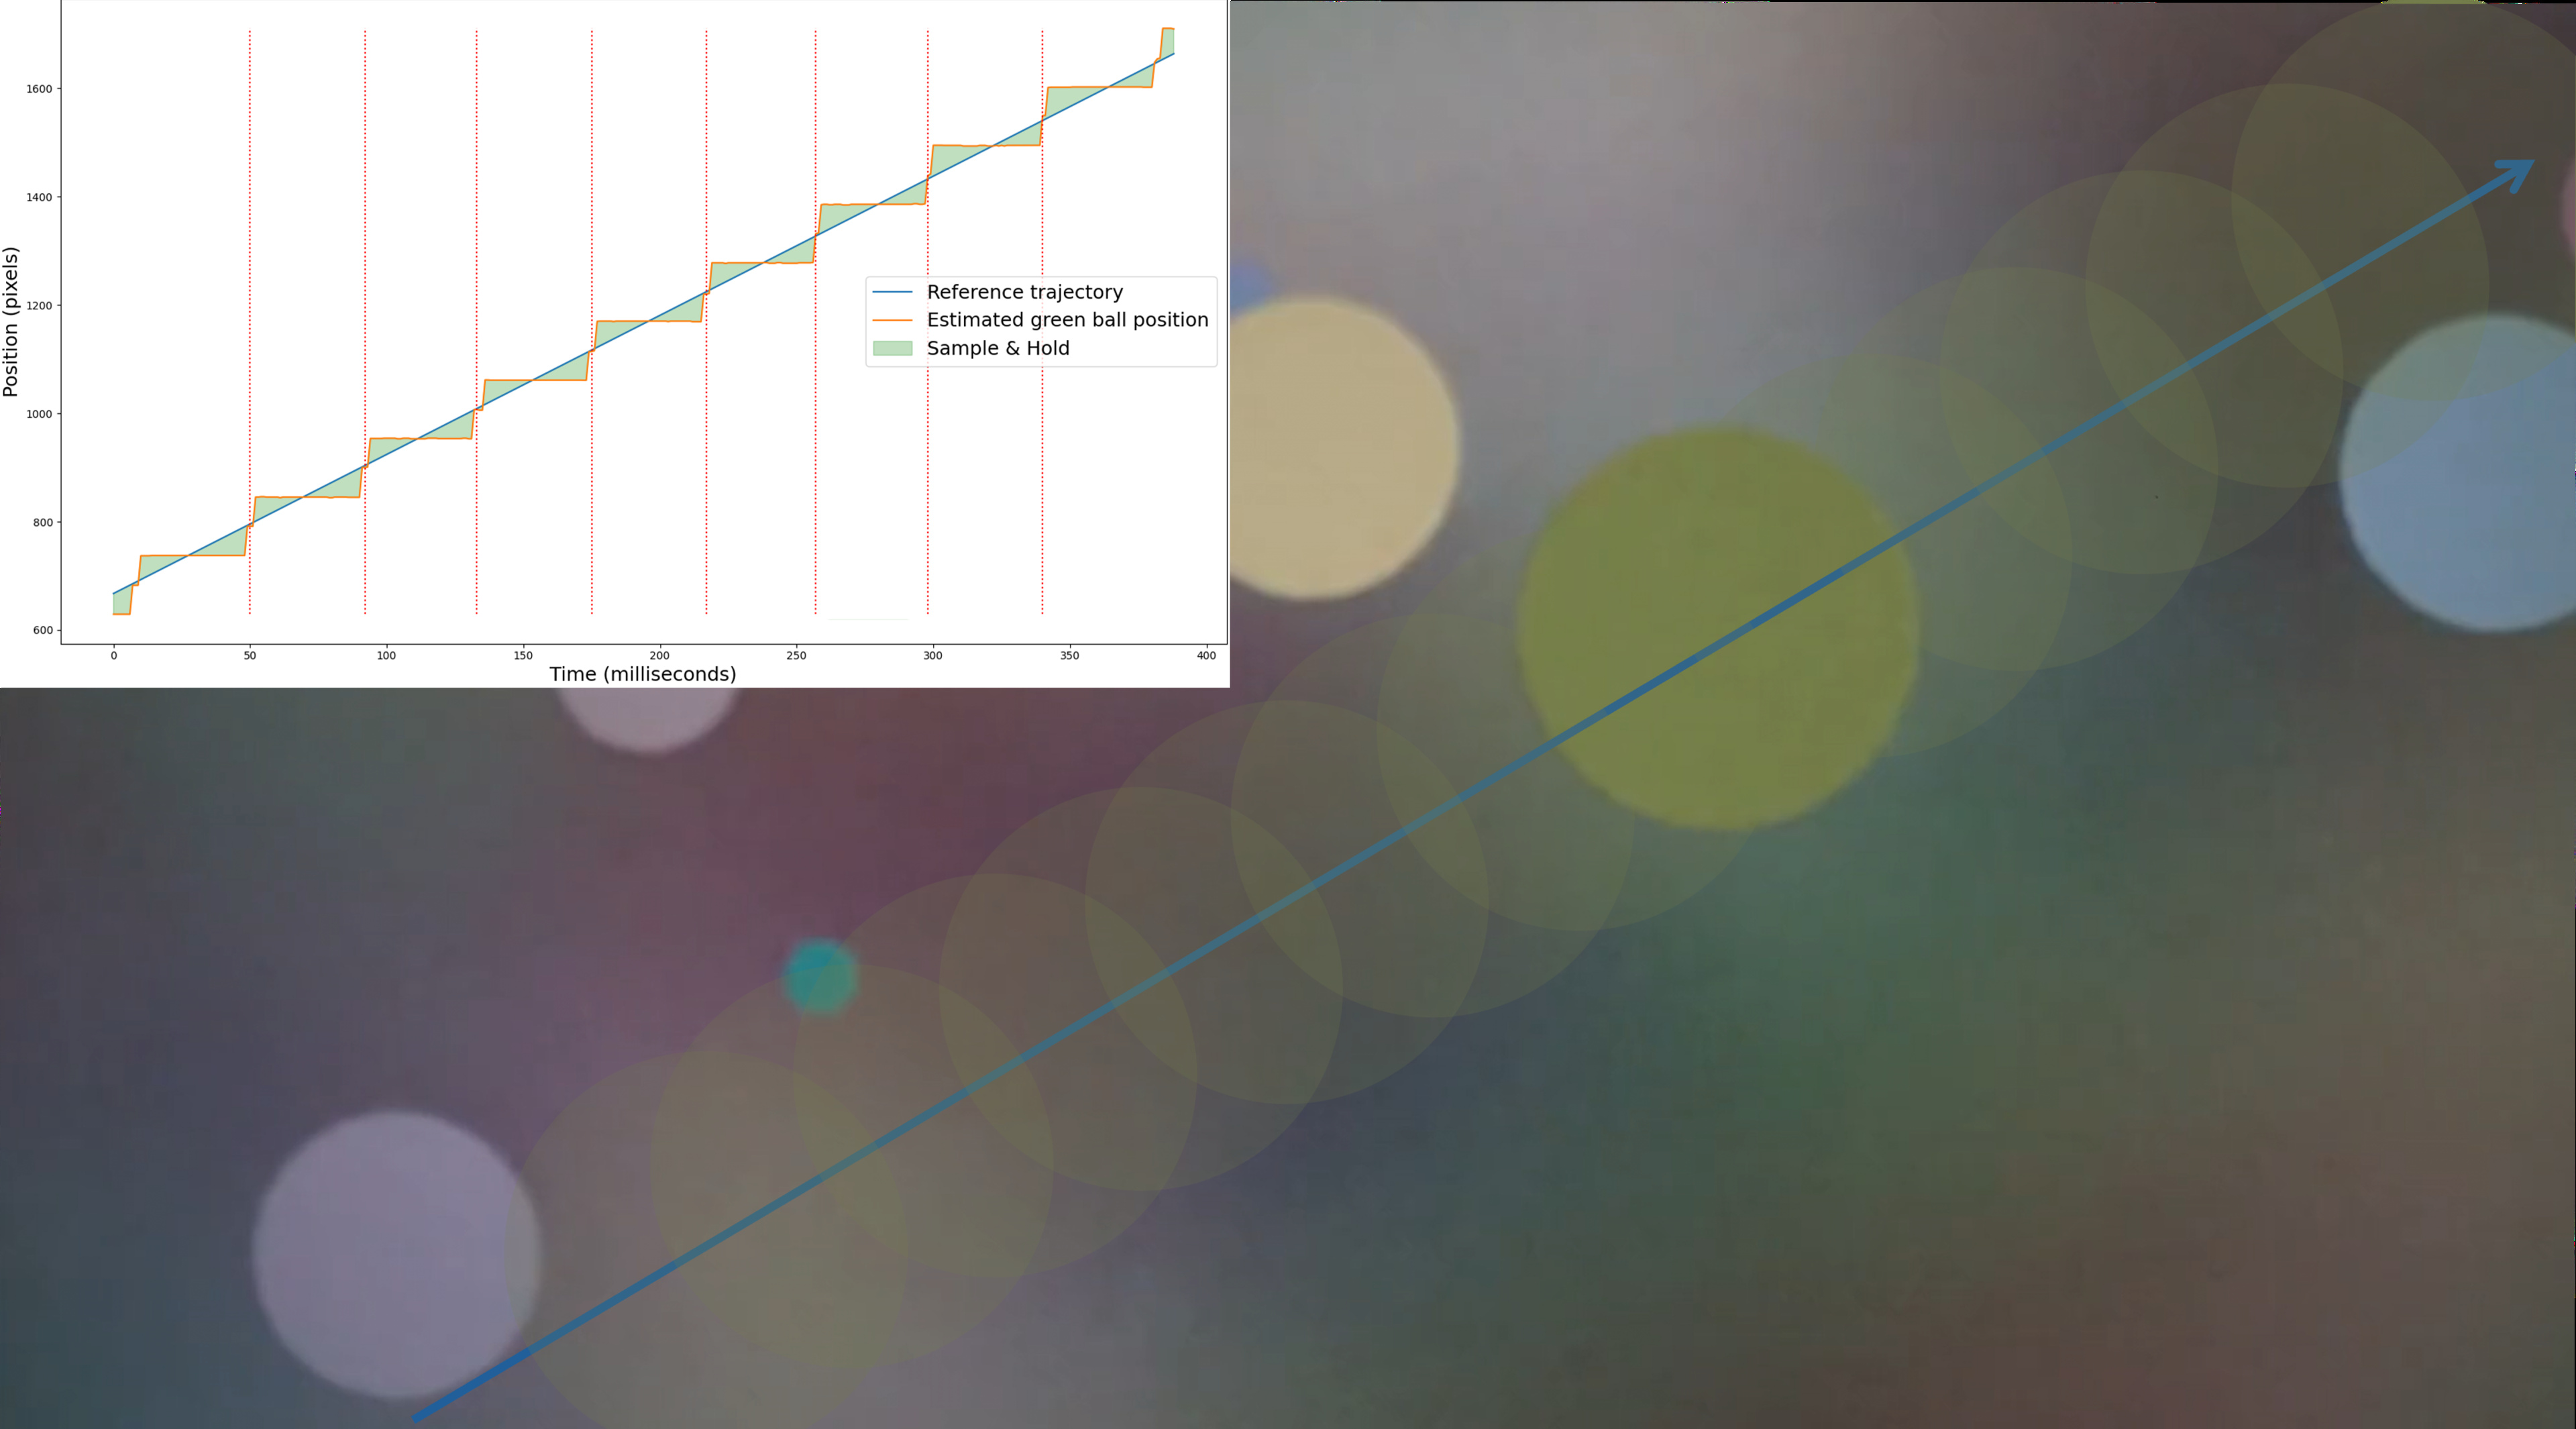
Our new metric measures the position of a moving green ball against a non-uniform background, as shown in the picture below. The non-uniform background allows the measurement of "sample and hold: on different types of RGB transitions. A longer response time LCD creates quick intermediate frames, helping reduce the effect of stutter on LCD televisions. Most of today's LCDs, though, have quite short response times, so the impact on "sample and hold" is very limited, which better reflects reality, where today's displays still exhibit significant stutter.
The granularity of the green ball's position estimation is still somewhat limited by how its center is evaluated. Our current approach uses edge detection; a center-of-mass method could allow greater granularity, but it wasn't technically feasible while maintaining the non-uniform background. To preserve some of the granularity, we kept part of the old frame-hold-time @ 24fps stutter metric in our new global stutter metric.
Response Time vs. Persistence Blur
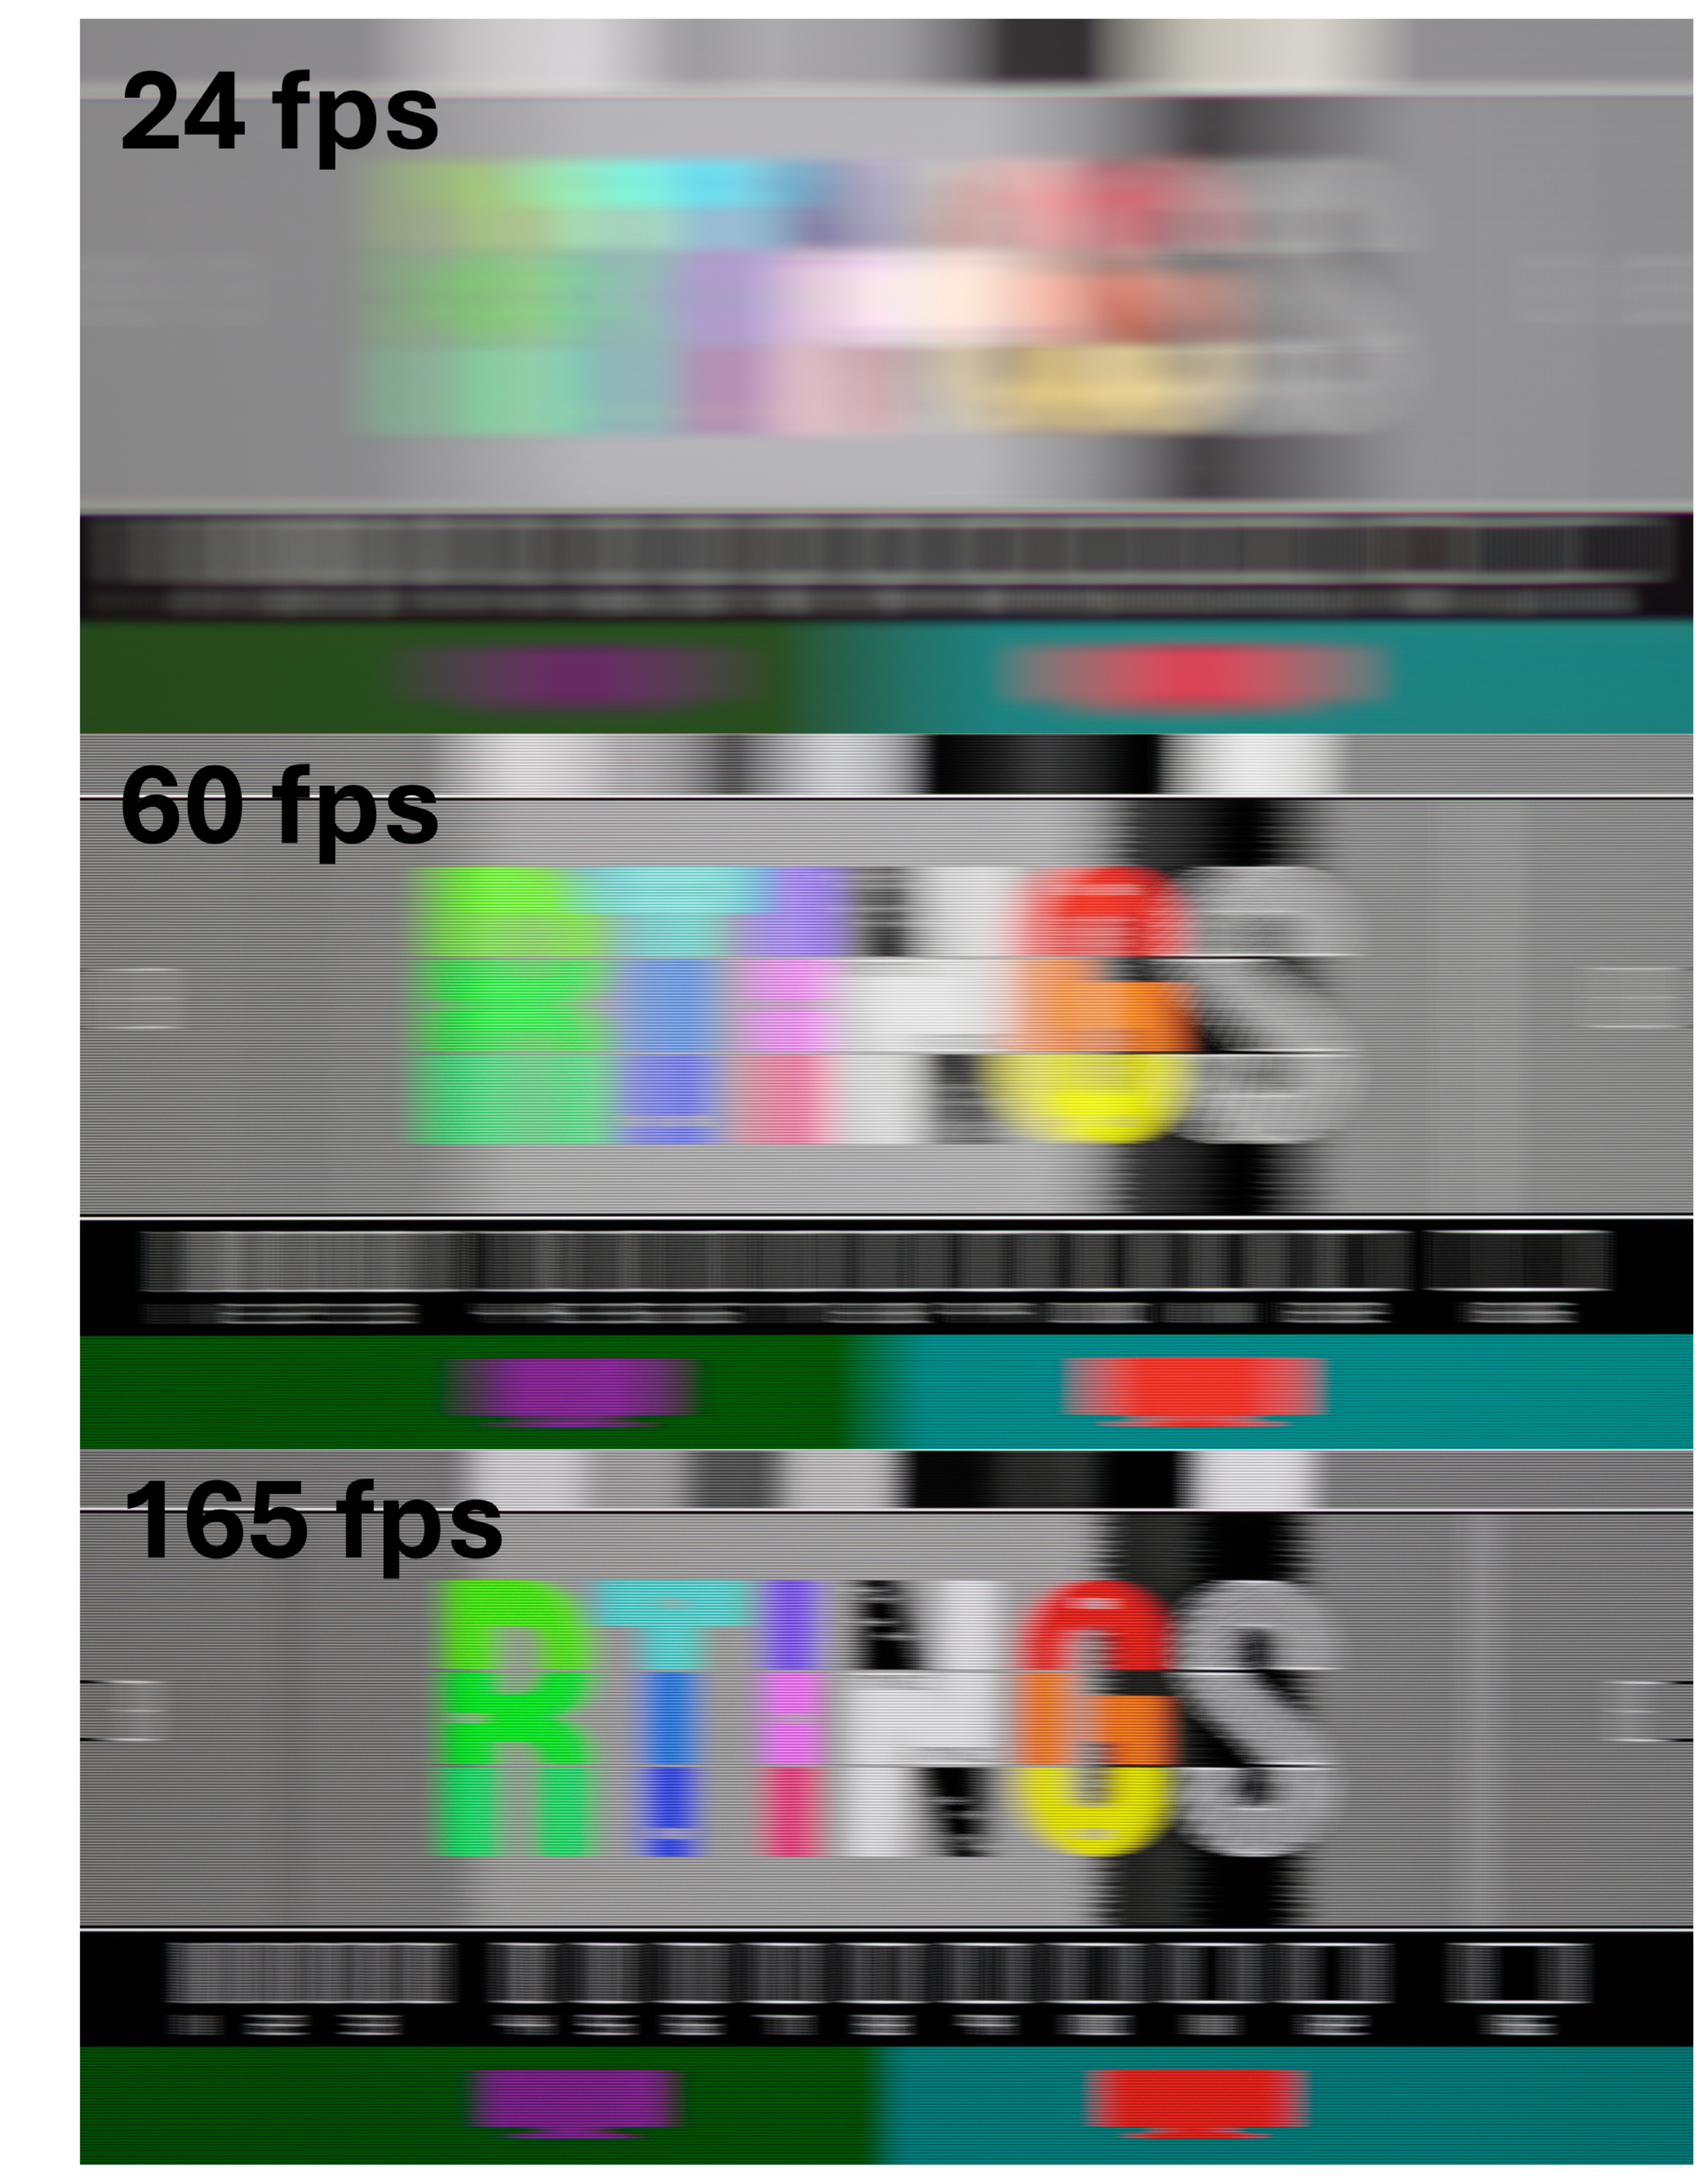
A good analogy for understanding persistence blur is the blurry picture you get when taking a picture of a static object while moving your camera. For movies and TV shows, content recorded at 24 fps shows a static frame for 41.66ms. However, when the object is in motion, your eyes track its movement, creating a blur similar to the one you saw on your camera previously. The persistence blur becomes more prominent as you decrease the frame rate because the moving object remains static for a longer period. One good way to understand the impact of persistence blur and frame rate is to compare the pursuit shot of an OLED at different frame rates, as shown below for the LG G5 OLED. Because the response time is almost instantaneous, most of the blur visible in those captures is due to the persistence blur.
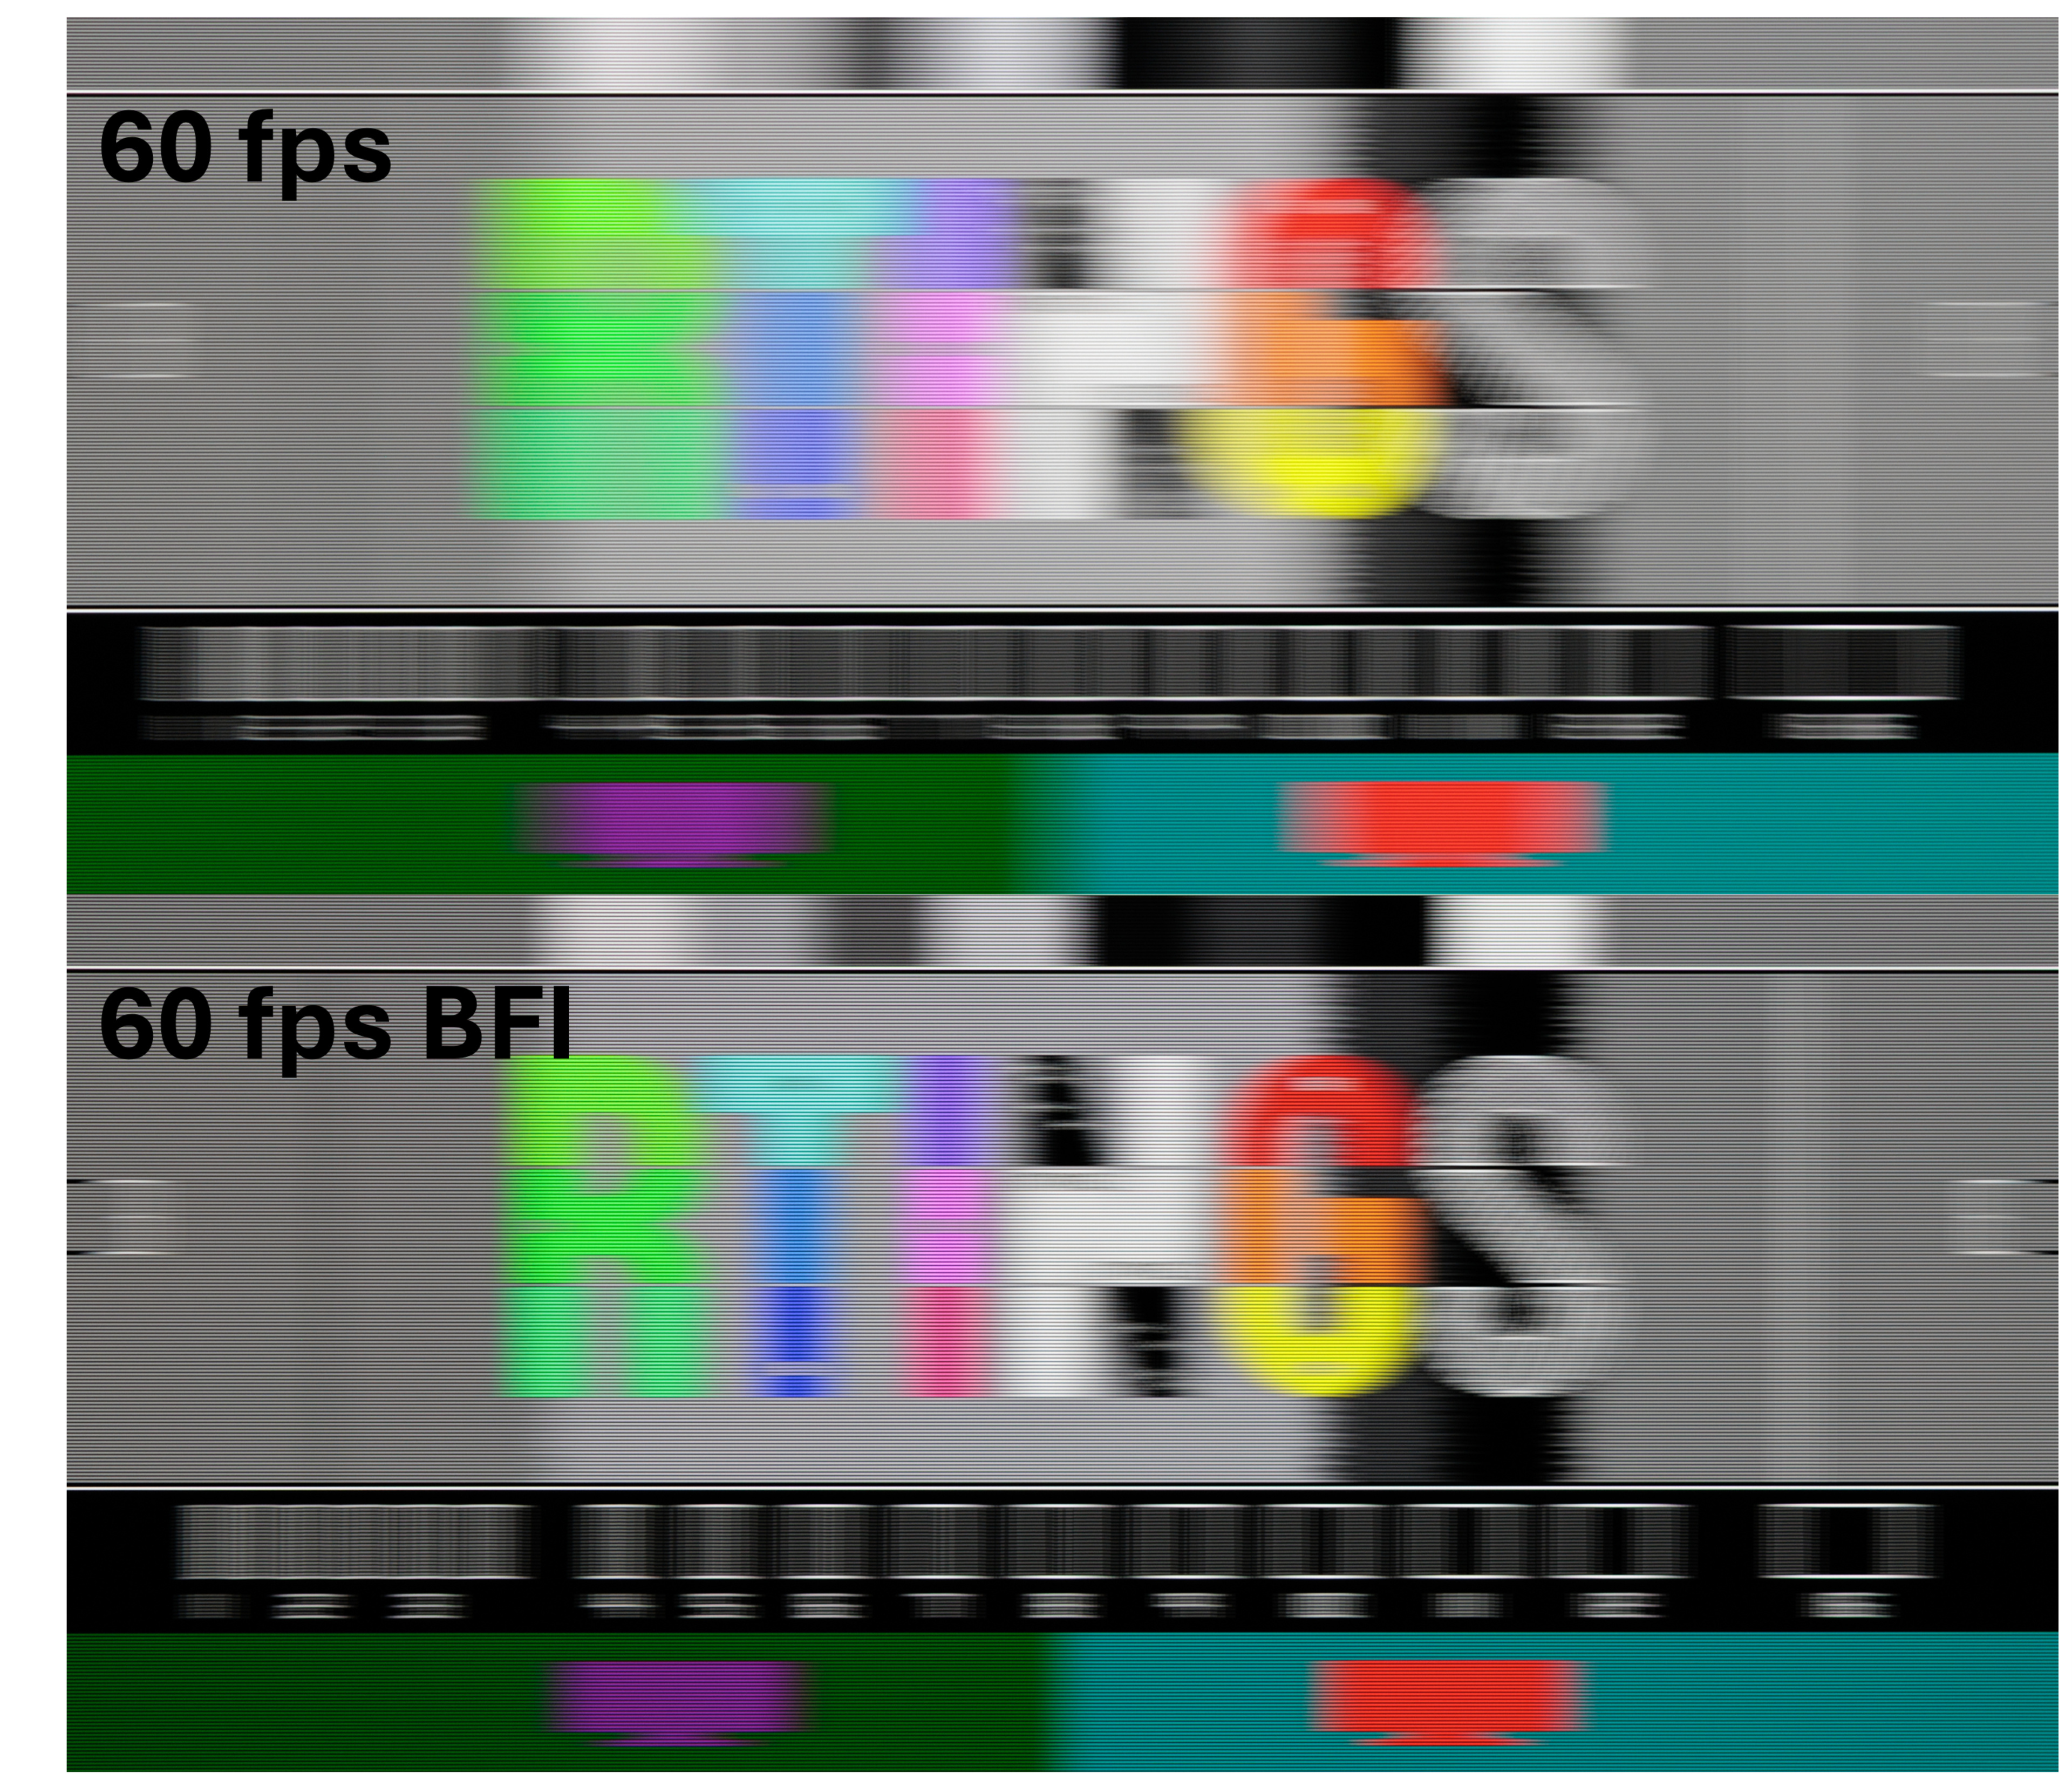
An old three-blade projector or CRT television didn't suffer as much from this persistence blur because, instead of keeping the frame static, it was replaced with a black frame. The figure below highlights this effect by comparing the pursuit capture at 60 fps with and without BFI. There is much more nuance in BFI's use of cinematic content, but it's outside the scope of this article. Let us know in the comments if you want to know more.
In the end, when watching low-frame-rate content, most of the blur you see will result from persistence blur, which will hide most of the pixel-transition blur.
Response Time to Reduce Stutter Perception
A longer response time can help mask part of the stutter, as mentioned earlier, by smoothing the perception blur profile in the direction of movement. As mentioned in the circle example before, both sides of the object, in the direction of motion, will appear to flicker. A longer response time helps modulate the persistence profile, making the overall flicker less intense. However, a too-long response time might start to bleed beyond the persistence blur, so stutter needs to be balanced with the response time metric.
Transition artifact
When the pixel response time is longer, artifacts that occur during the transition persist for more frames, increasing the chance they might be noticed. Tuning the RGB transition profile is therefore very important to ensure the transitions are as clean as possible.
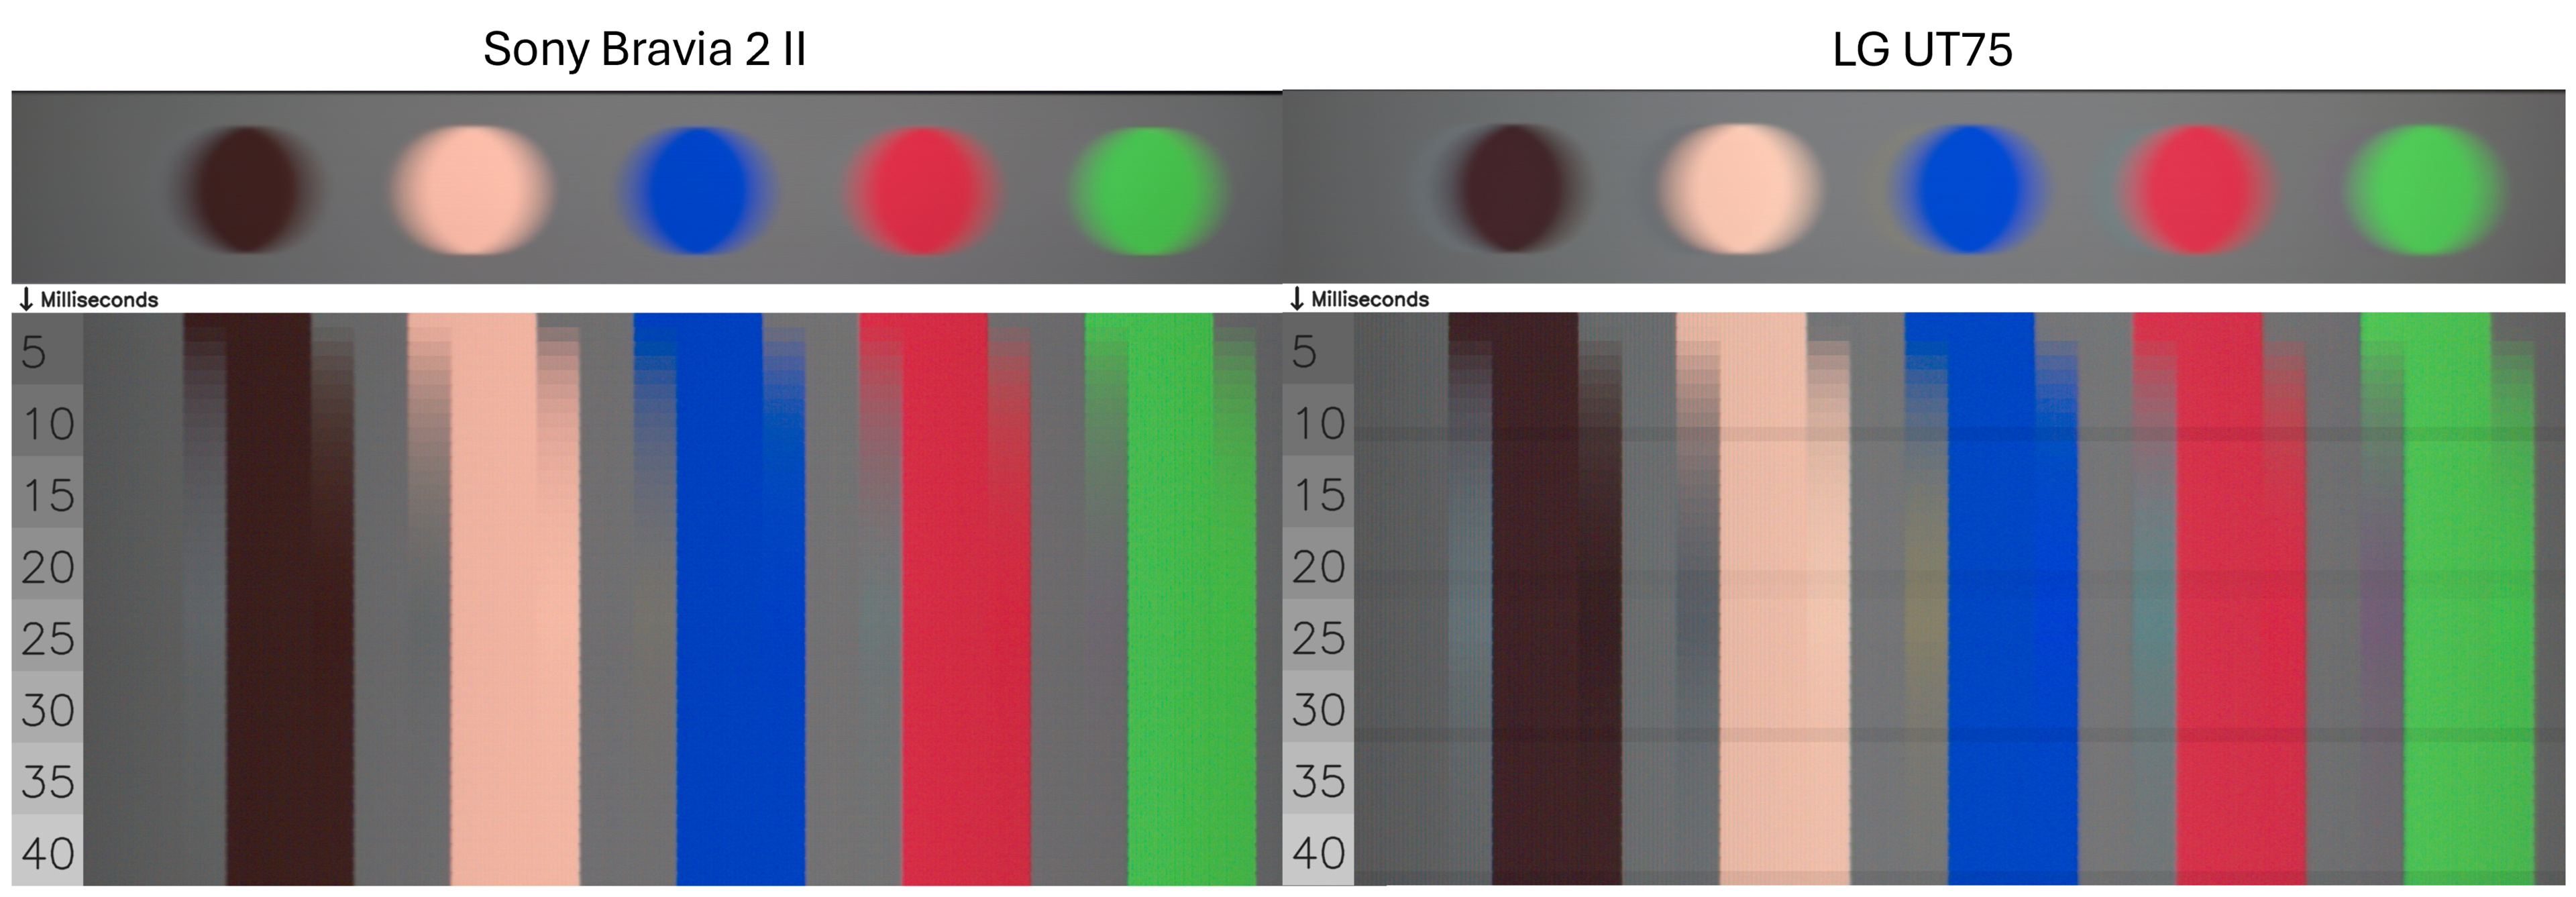
The first type of artifact that results from bad tuning is shown in the image below, which exhibits colour artifacts at pixel transitions. The top of the image presents a perceptual view of five coloured balls moving left to right at 960 pixels per second on two televisions with similar response times. While both televisions exhibit a similar persistence blur, the LG UT75 shows obvious colour ghosting behind each moving ball. When we decompose the transition over time, the RGB transition profile clearly shows the intermediate colors generated by the television on the right; the Sony BRAVIA 2 II on the left has a much cleaner RGB transition profile.
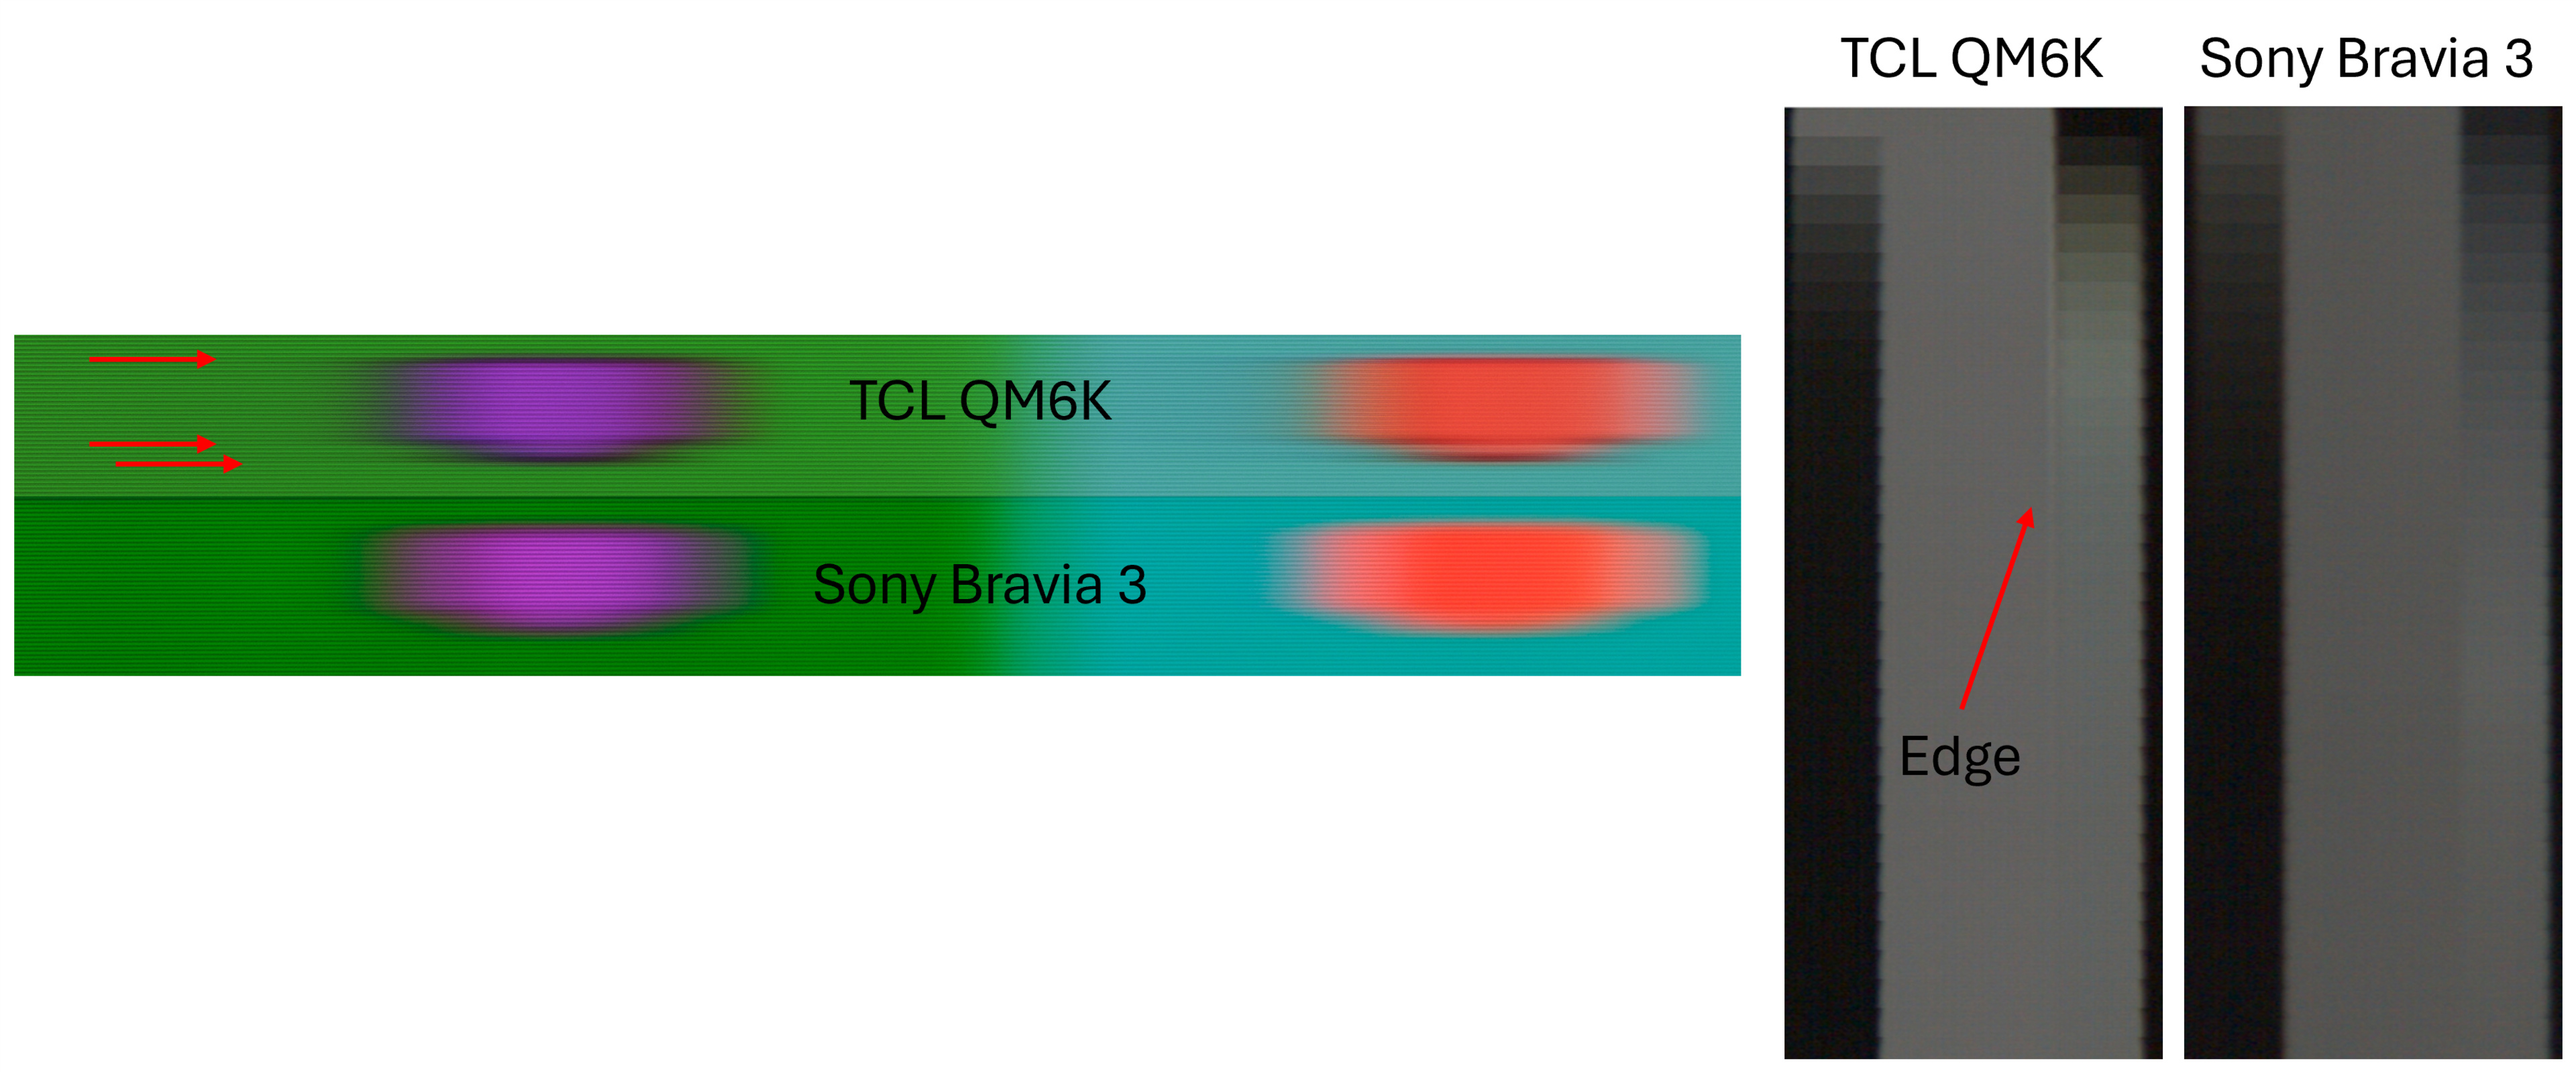
The second type of artifact we noticed and documented last year was the deformation of the persistence blur of some objects. Some televisions have limited processor capabilities, which can affect the pixel transitions around the edges. The impact becomes more noticeable when there is a large disparity in the transition lookup table. The impact is shown in the figure below, where the TCL QM6K appears as a much longer trail near the edge of the moving object compared with the Sony BRAVIA 3. While it's visible in the pursuit shot, we measure it at the moment when the moving ball pattern crosses the line, which also shows the artifact as a spatial overshoot in the transition when it's present.
The addition of the transition artifact metric is essential for our motion-handling use case. As we introduce some tolerance for longer response times to mitigate stutter, we want to ensure this is done cleanly without introducing side effects.
Response time at a higher frame rate
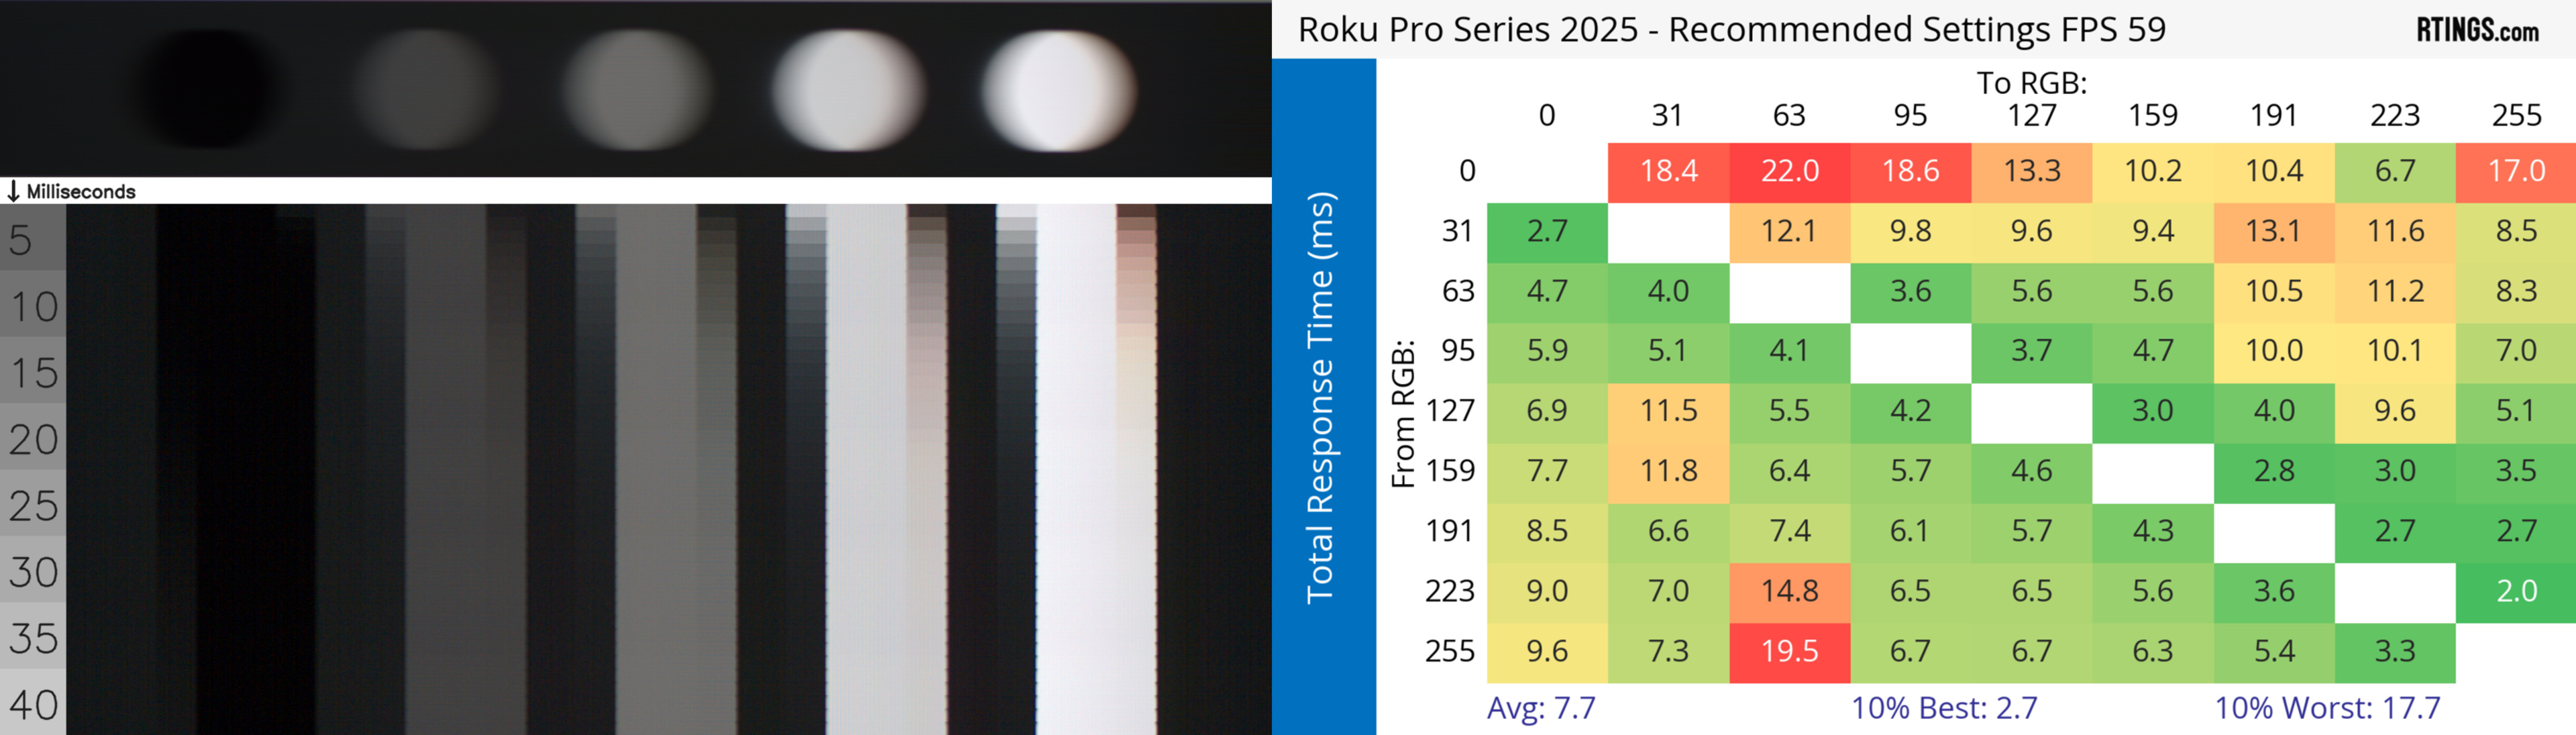
This new pattern also highlights the impact of switching from 24 fps to 60 fps. The chart is displayed at 24 fps, matching the frame rate, while the regular pursuit shot is displayed at 60 fps. Measuring the ball's trailing on 24 fps content has shown a quite large difference compared to 60 fps content on some televisions, as shown below for the Roku Pro Series 2025, which shows a long trail on the artifact chart and quite good response time at 60 fps.
Much of what is presented here assumes that persistence blur is hiding the pixel transition response time, but as frame rates increase to 60 fps for sports and beyond for gaming, the assumption no longer holds. For sports and gaming, response time is a crucial metric to consider. We evaluate the transition artifact only for the 24p handshake; the one that also appears on 60p might be more noticeable in sports and gaming.
Motion Interpolation: Reducing Stutter Or Embracing The Soap Opera Effect
Based on a small survey we conducted on AVS Forum, most users enable motion interpolation at the lowest settings to reduce stutter. However, the minimum settings to use remain highly subjective and not well established within the community. As shown in the motion map graph, enabling motion interpolation settings reduces stutter but inevitably creates more fluid motion, often seen as the soap opera effect. We conducted extensive research on motion interpolation and will present a follow-up article with more results in the coming weeks. In this article, we'll focus on some basic principles of motion interpolation and how you can use the new stutter reduction via interpolation metric to choose your next television and tune motion interpolation to your preference.
Understanding and Tuning Motion Interpolation to Your Preferences
On most televisions, the two settings that often control motion interpolation are named de-judder and de-blur. Most of our research has shown that the de-judder setting is the main contributor to reducing the perception of stutter at 24 fps, while the de-blur settings have more impact on 60 fps content, such as sports. Hence, our new metric concentrates on how the de-judder helps reduce stutter.
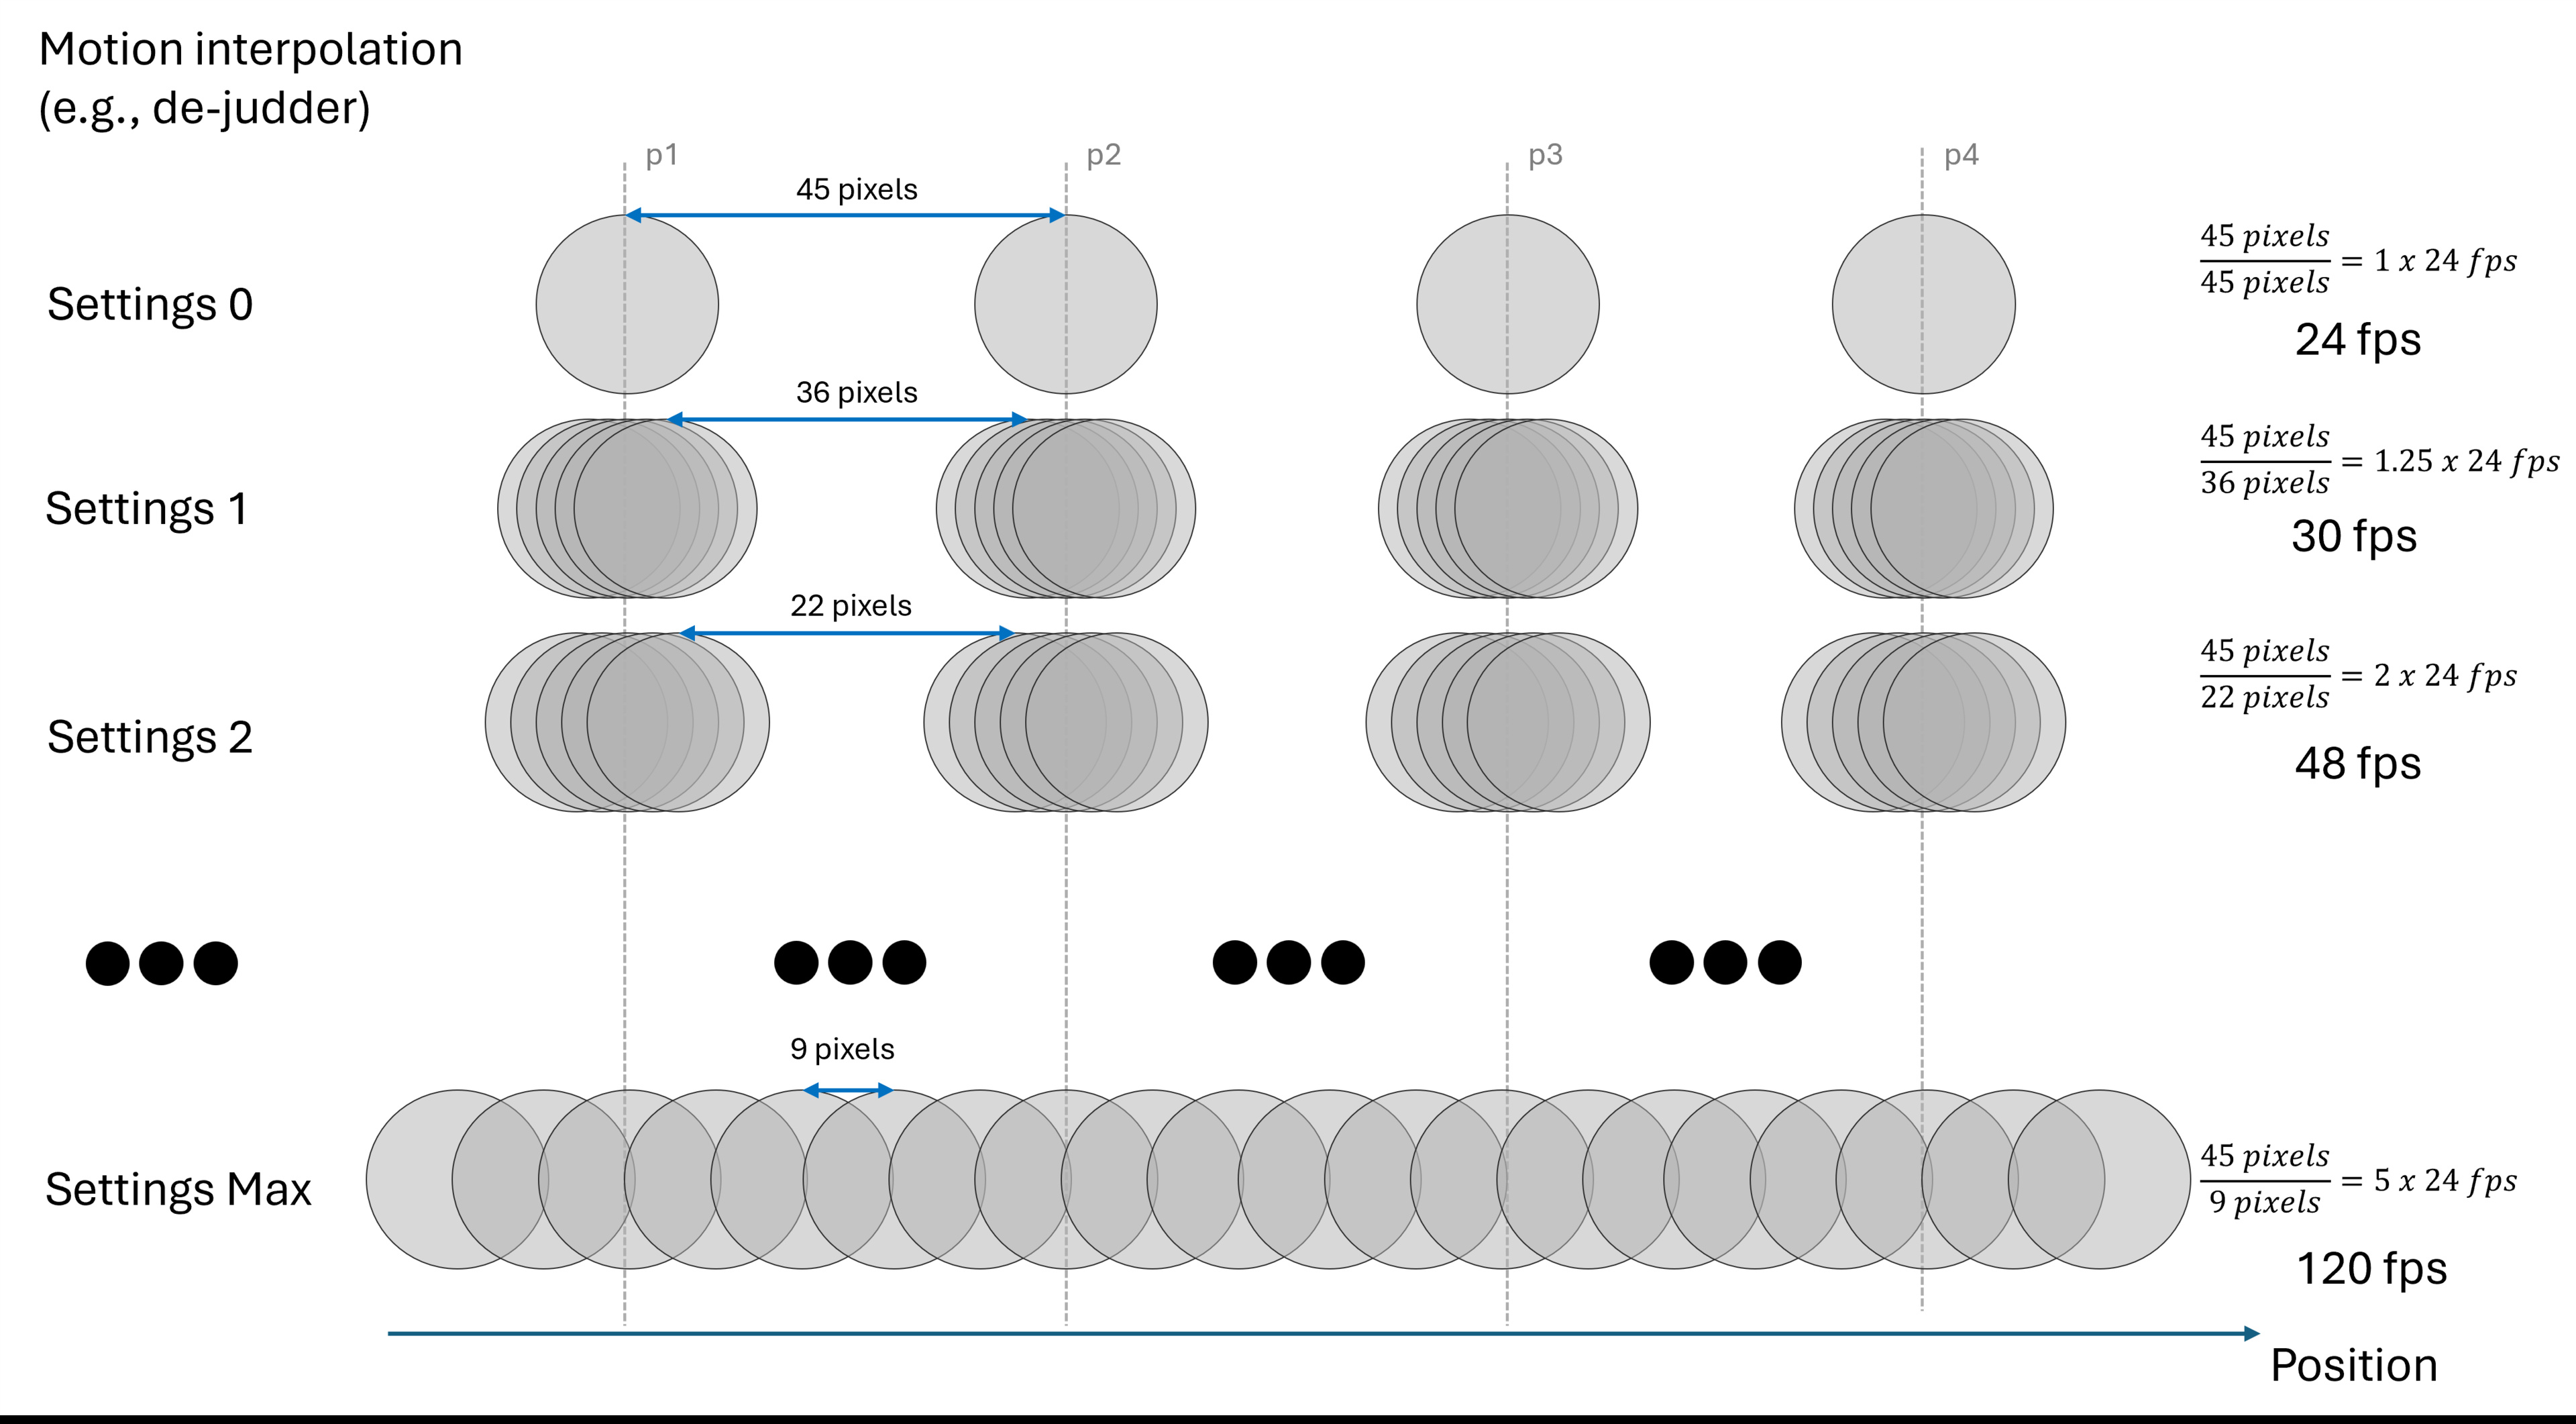
Our first hypothesis was that motion interpolation would add a new frame over a shorter period than the regular 41.66ms of 24 fps, resulting in a gradually increasing frame rate as the de-judder setting increases. Our measurements show that when enabled (de-judder > 0), the television produces a constant number of frames regardless of the motion interpolation settings. The de-judder settings control the spacing between the newly generated frames, as shown in the figure above. Doing it this way, a television can preserve the original frame every 41.66 ms and add frames in between to incrementally reduce stutter. At the maximum setting, every frame is equally spaced.
Each television was evaluated using 24 fps content played via a 24Hz signal. That setting was used because it's often judder and micro-judder-free. Using a different handshake will change how the motion interpolation behaves. For example, on the Sony BRAVIA 9, 24Hz signals cap out at 96 frames per second, while handshaking with a 60Hz signal for 24fps content delivers 120 frames per second. Another important setting interaction we noticed was that the picture clarity settings on the Samsung QN90F changed the flicker behaviour of the backlight. As soon as you enable the picture clarity settings (even if the sliders are set to 0), the backlight flickers at 120Hz instead of 960Hz, making it much more noticeable to people who are sensitive to flicker.
Measuring How Motion Interpolation Reduces Stutter
All televisions use slightly different strategies to generate and separate their newly generated frames. To benchmark the televisions against each other, we used effective fps, which corresponds to the fps increase achieved by reducing the larger frame gap. We ended up choosing a setting corresponding to an equivalent of 30 fps, as depicted in the figure above. This corresponds to the minimum settings of 1/3 on Sony televisions, the Cinematic Movement preset on LG televisions, and, generally, a 3/10 de-judder setting on all other televisions that offer a 10-level discretization.
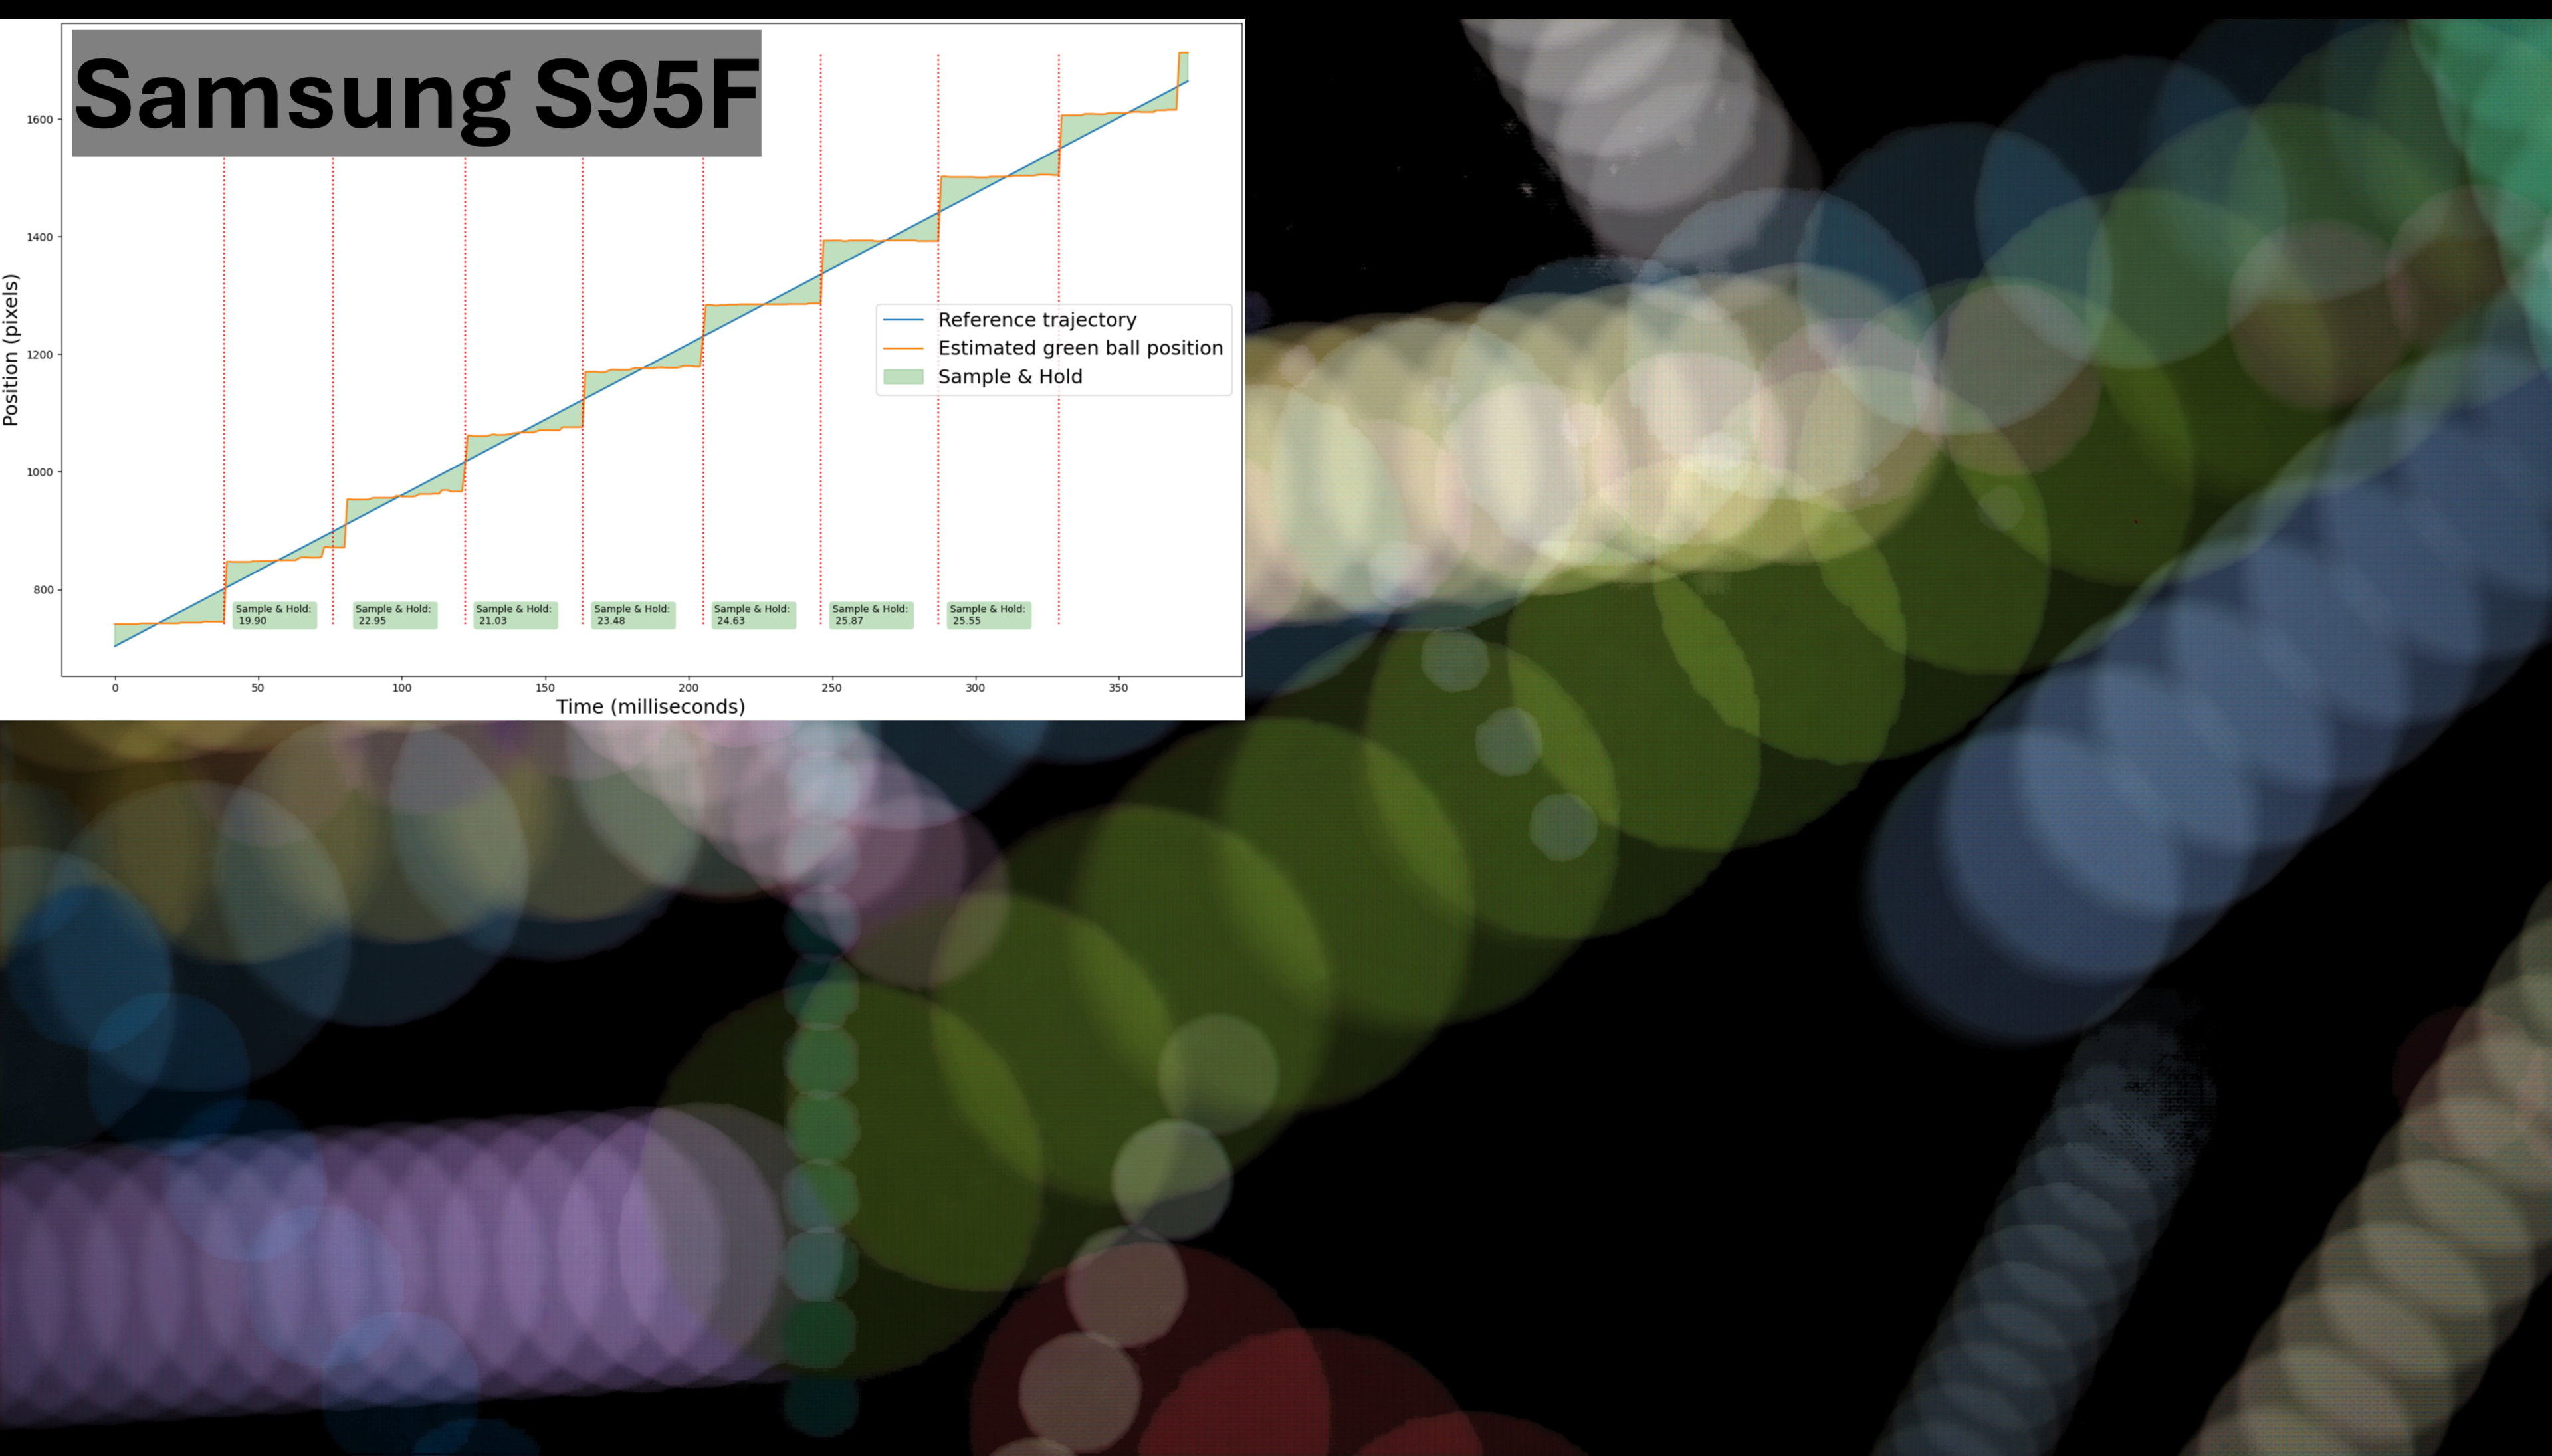
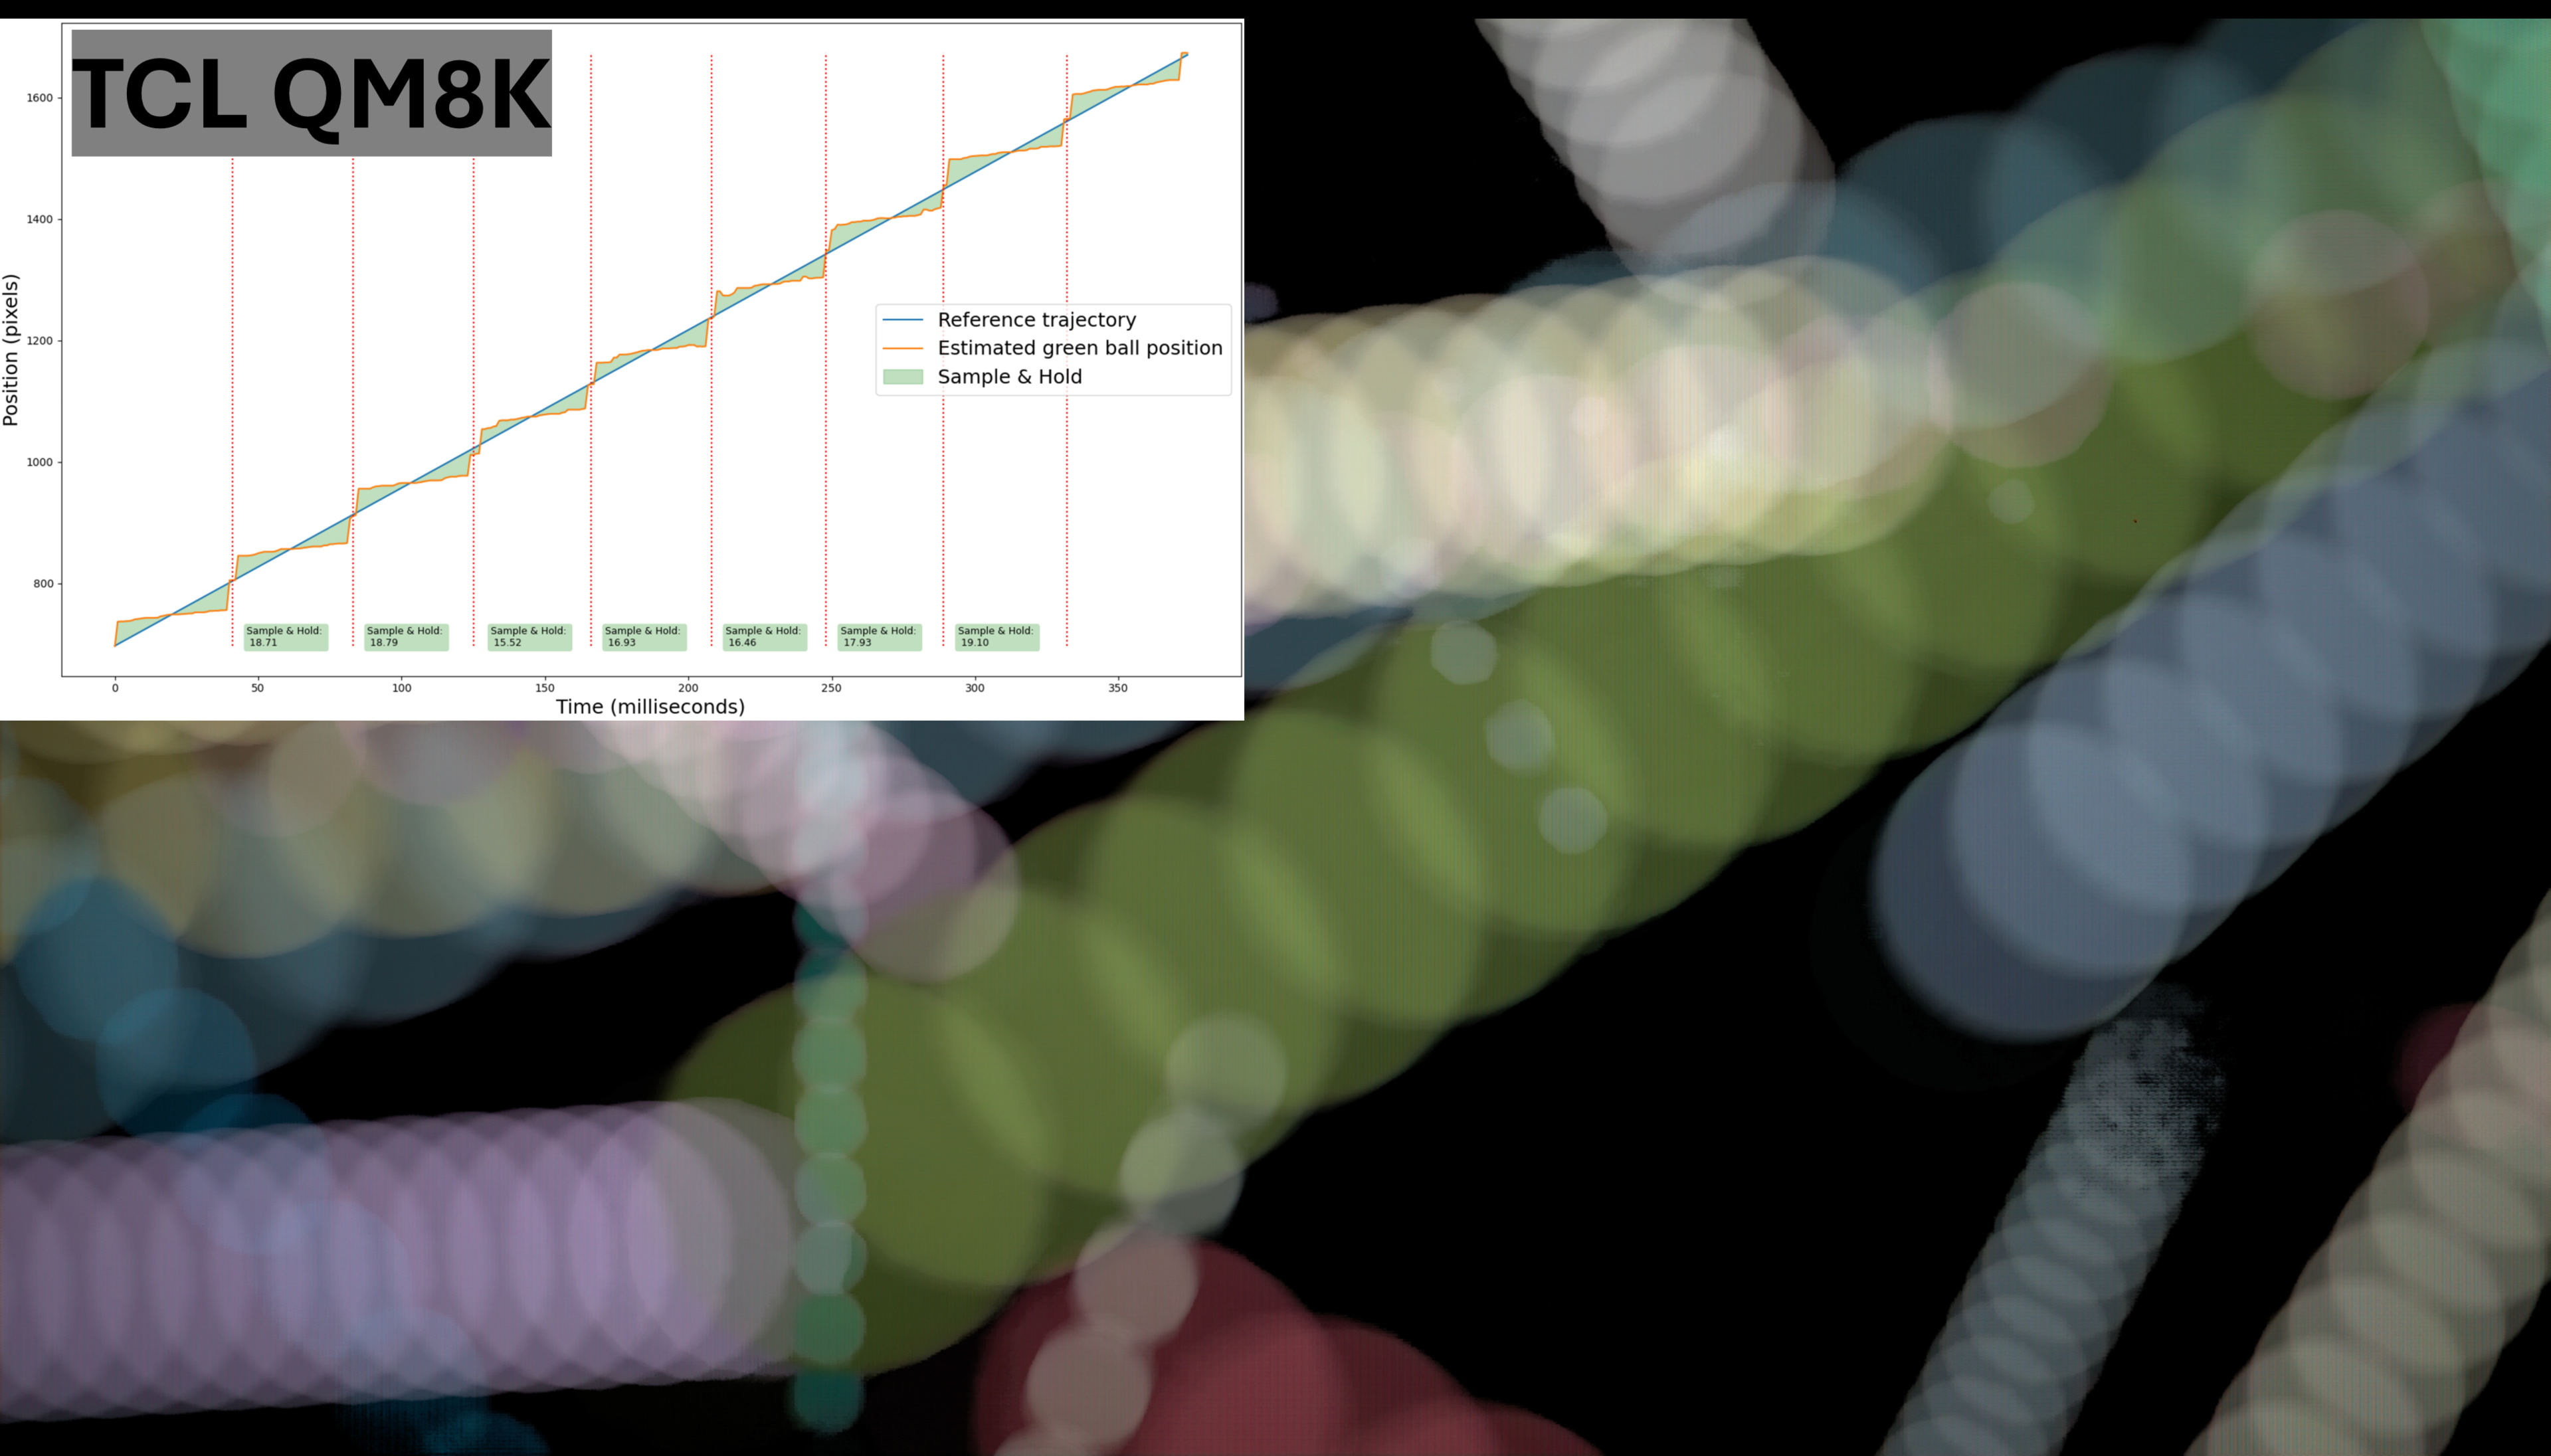
Our new metric uses the same methodology as for stutter and measures the "sample and hold" of the green ball against its reference trajectory. The green ball moves very fast and across different shades, making it difficult to interpolate. On televisions like Samsung's, we often measure a drop in the interpolation when the ball moves across the green part of the background. As shown below, the time-position graph for the Samsung S95F shows a slight upward slope in the first few frames, then levels off. Another way to visualize it is with an aggregated image that shows a blur around the ball during the first few movements and none during the later ones. We therefore introduced the interpolation consistency metric, which measures the variation in "sample and hold" across interpolated segments.
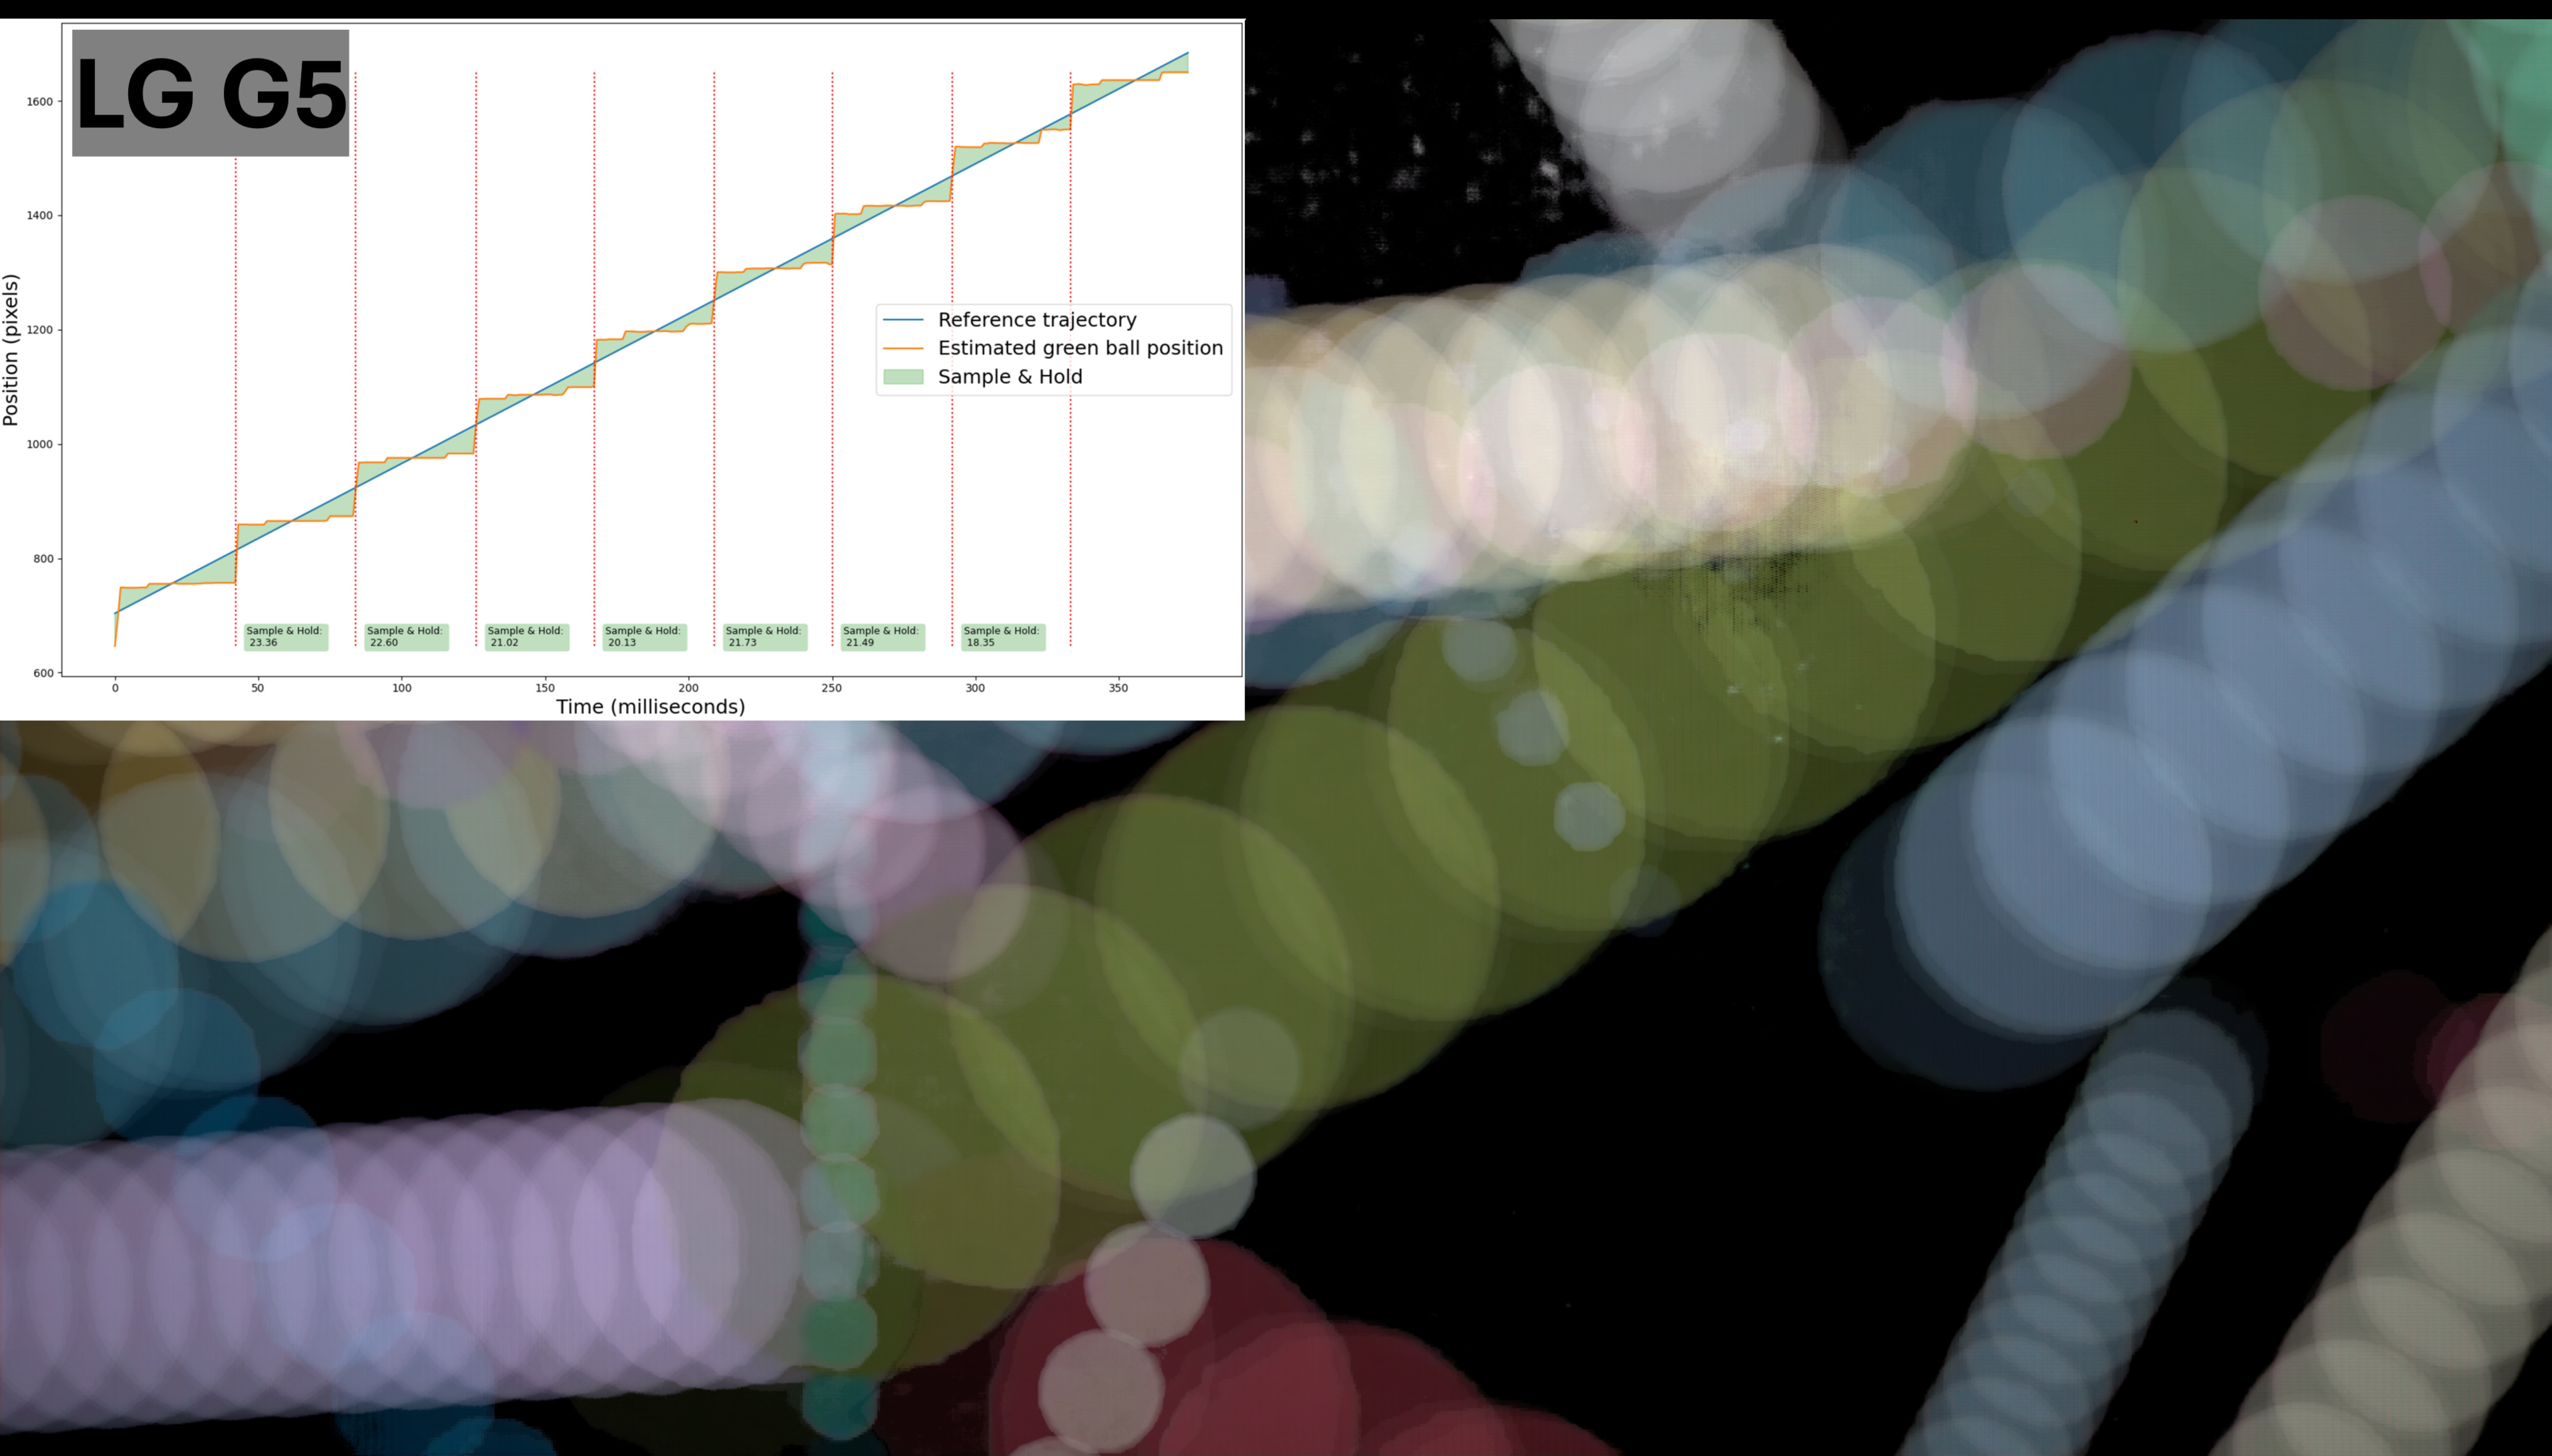
The aggregated ball image shows the aggregated positions of all balls, with the background removed. This visualization shows how motion interpolation adds frames and reduces stutter. A television, such as the TCL QM8K, exhibits a very smooth addition of a new frame near its original frame. This result is an aggregated image in which the green ball's path appears very fluid, which will help reduce the perception of stutter. On the other hand, the LG G5 uses a different strategy by adding two additional frames on each side of its original frame. The resulting aggregated image shows less fluidity in the direction of the green ball's motion. It will have less impact on stutter reduction, so motion can still look a bit choppy, but it helps to avoid the soap-opera effect.
How To Choose The Right TV Based On Your Motion Preference
Technology has advanced significantly since the first projector was released more than a century ago. Today, OLED technology is a remarkable innovation. On multiple points, that technology is an absolute king from a motion perspective, with its fast response, low transition artifacts, and mostly judder-free performance. On the other hand, that technology introduces a level of stutter that is as high as it can be. Our goal in this test bench update was to introduce tools to help people who find OLED stutter unbearable to choose their next televisions.
Our first new tool is our updated motion handling performance usage, which combines our updated stutter metric with our new transition artifact metric to help users choose the television that reduces stutter without introducing too many negative side effects. The usage also leverages the work we did in our first motion-related update, using the judder metric, because if a television can't de-judder properly, then stutter should be the least of your concerns. In the end, aside from stutter, OLEDs still perform very well across multiple motion aspects, so you will probably not see any OLEDs scoring poorly. However, you will find multiple LCDs that score highly, with limited stutter and good motion handling in low-frame content.
The second tool we provide in this update is our new metric for stutter reduction via interpolation, one of the few ways to reduce stutter on OLEDs. Many TV owners and reviewers suggest using the minimum setting. In this test bench update, we now offer a metric indicating the degree of improvement in stuttering across all televisions with the motion interpolation setting that's equivalent to 30fps.
The work we presented here primarily focuses on motion handling for low-frame-rate content, such as movies and TV shows. For gaming, we already have our game responsiveness performance usage, which highlights the motion characteristics important for gaming. For sports, we updated our usage to include a few of the metrics we presented in this article, but in reality, stutter is less of an issue at 60 fps. In addition, de-judder, which is essential for cinematic content, should be turned off for most sports content. We'll soon release a video on that effect. Stay tuned!
What's Next
A lot of work and effort have gone into the motion topic since we introduced it last year. We still have an article and a video coming out soon on our research into motion interpolation and de-judder for sports, and you should look forward to them. Overall, the status of our usage and performance should now help you choose the right television for you based on motion.
As we release our final piece of knowledge on motion, we want to hear from you. What would you like to see next for our TV testing? Would you like us to explore the motion interpolation settings in more depth? What happens at maximum settings, and what happens when we interpolate sports content? Maybe you think we need a break from motion to tackle other issues, such as dark crush in details or more HDR-real scene measurements. Let us know in the comments!