- 80.0%50% Std. Dev.
- 80.0%50% DSE
Gray uniformity defines how evenly a monitor displays colors across the screen. This is important for content that has solid, full-screen colors, like with general web browsing, working on documents, editing videos, or even watching some content, like sports. It's easy to notice when a monitor has bad uniformity because there can be backlight bleed, banding, and clouding throughout, or dirty screen effect (DSE) in the center.
We measure uniformity by taking a photo of the screen and calculating the average deviation from the original color. While we only test with a gray image, this test applies to all colors, not just gray. That said, gray uniformity varies from unit to unit, even if they're the same model, so it's not guaranteed that your monitor will look exactly like ours.
You can also learn about how we test gray uniformity on TVs and about our philosophy on how we test monitors and transform data into objective scores.
Test results
Test Methodology Coverage
The gray uniformity test is part of all monitor test benches but was slightly revamped as of Test Bench 1.2. This means that scores aren't comparable with monitors on older test benches, but the 50% Standard Deviation and 50% DSE results are still valid on all test benches. You can learn about how our test benches and scoring systems work.
| Test | 1.0 | 1.1 | 1.2 | 2.0.1 and newer |
|---|---|---|---|---|
| 50% Std. Dev. | ✅ | ✅ | ✅ | ✅ |
| 50% DSE | ✅ | ✅ | ✅ | ✅ |
| 5% Std. Dev. | ✅ | ✅ | ❌ | ❌ |
| 5% DSE | ✅ | ✅ | ❌ | ❌ |
When It Matters
The gray uniformity test aims to show how well a screen displays a single, uniform color. This matters when viewing large areas of uniform color, such as web pages and documents. Uniformity issues also affect content creators because the same color may look different depending on where it is on the screen. It also matters when viewing certain content, like panning shots or sports.
Although most monitors have good enough gray uniformity to not be distracting, a monitor with bad uniformity can be really distracting. You may see brighter or darker spots throughout or even backlight bleed at the edges of the display. So, having good uniformity helps avoid these issues.
Our Tests
To test a monitor's gray uniformity, we display a full-screen image of 50% gray and take a picture using a Nikon D750 camera with an f/4.0 aperture lens, a 1/15 sec. shutter time, and an ISO of 200.
50% Standard Deviation
The 50% standard deviation test result lets us see how evenly a monitor displays a color across the screen. Although it's done with a specific shade of gray, it applies to any color shown on the entire screen. We take a picture of the screen displaying 50% gray, and the picture is then processed using a low pass filter to remove noise and artifacts created by the camera.
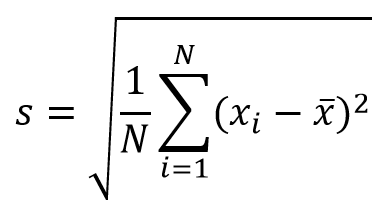
The included photo shows uniformity issues around the edges of the screen and whether there's any clouding or banding. Low-quality displays often have dark corners, which is known as vignetting. We use the picture to calculate the standard deviation of gray compared to an ideal display with the formula below. The average deviation from the color that it's supposed to show is expressed in a percentage; the lower, the better.

You can see three examples of gray uniformity photos below. The monitor on the left, the BenQ, has bad uniformity with vignetting at the edges, while the MSI on the right has clouding and banding. However, the Gigabyte monitor in the middle has near-perfect uniformity, so you can really see the differences between the two other monitors.
| 50% Std. Dev.: 7.778% | 50% Std. Dev.: 0.566% | 50% Std. Dev.: 4.593% |
|---|---|---|
 |
 |
 |
50% Dirty Screen Effect (DSE)
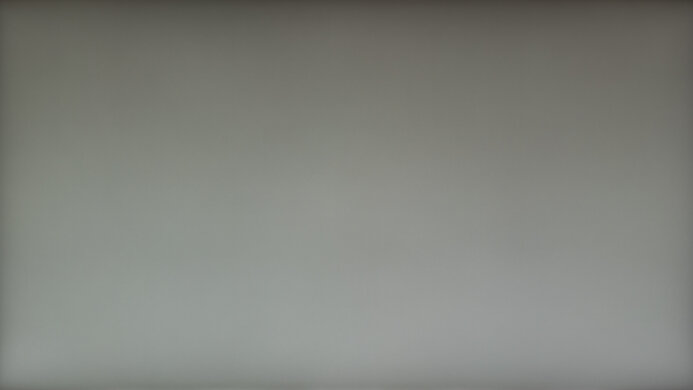
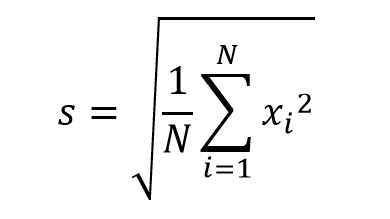
The 50% dirty screen effect, or DSE, test result is more focused on the center of the screen. We use the same picture as the 50% standard deviation test, but we process it through a high pass filter to remove the low frequencies from the image, isolating the dirty screen effect for the entire screen. Using this image, we calculate the root of the average of the squared values. It's expressed as a percentage, with lower being better.

Having dirty screen effect in the center is noticeable when you're doing anything that involves large areas of uniform color, but it's more important than the standard deviation test for video content like sports or atmospheric scenes with slow panning shots.
Below, you can see an example of two super ultrawide monitors with good and bad DSE. The monitor on the left has noticeable banding, and you can see that the center looks darker than the rest of the screen. That said, monitors with bad DSE often have high standard deviation, too, so you also see bad uniformity at the edges. On the other hand, the monitor on the right displays a uniform color across the screen.
| 50% DSE: 0.213% | 50% DSE: 0.109% |
|---|---|
 |
 |
Additional Information
Black Uniformity VS Gray Uniformity
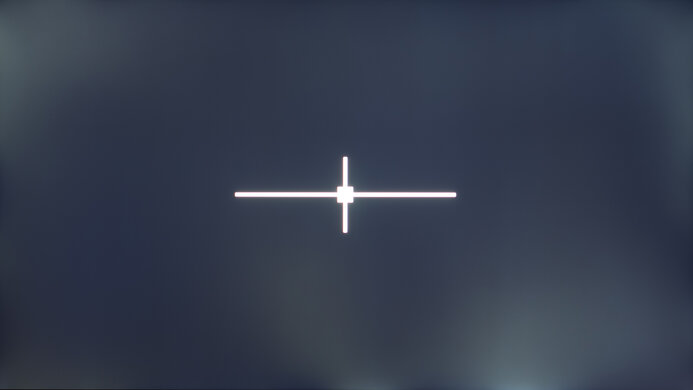
The gray uniformity test is one of two uniformity tests we complete on monitors, with the other being black uniformity. The concept for the black uniformity test is the same, except it's about how evenly it displays black across the screen. However, our test image includes a white cross, so it also shows issues like blooming. That said, the black and gray uniformity tests aren't related to each other, and a monitor can have good gray uniformity and bad black uniformity, and vice versa.
Below is an example of the MSI G274QPF-QD, which has good gray uniformity but terrible black uniformity. Even though we calculate the standard deviation on both, the percentages aren't comparable.
Learn more about our black uniformity testing.
OLED Vertical Banding
It's common for OLED monitors to have very faint vertical lines in near-dark scenes. As we don't measure 5% gray like we do with TVs, we don't record when this happens on monitors. That said, although most OLEDs have this problem, these vertical lines are very hard to see, and because they only appear with near-black full screens, you likely won't notice them with most content.
We looked into this with the Dell Alienware AW3423DW and took photos of gray levels below 50%. Although these vertical lines are there and some people find them distracting, most people don't notice them, so whether or not they bother you changes from person to person.
How To Get The Best Results
Most monitors don't have settings to improve a screen's uniformity, and it varies between individual units due to manufacturing tolerances. Different factors can impact uniformity, though, and these factors are out of your control. It can get worse with pressure from other components in the monitor or mishandling during manufacturing and shipping.
The backlight type can also affect uniformity, as there are issues inherent to both edge-lit and full-array displays. Edge-lit monitors can have more backlight bleed around the edges, and full-array backlighting can cause a grid-like effect on the screen. Even the panel type may have an impact on uniformity, as OLEDs are the best for this, and TN panels generally have the worst uniformity, but there's more of a variation between VA and IPS monitors.
Conclusion
The gray uniformity defines how evenly a monitor displays a solid color across the screen. This is important for different types of content, like web browsing, working on documents, content creation, and watching sports. We test for gray uniformity using a full-screen image of 50% gray and calculate the standard deviation and dirty screen effect compared to an ideal display. Even though we use gray for testing, this test applies to any color. While most monitors have good enough uniformity, those with bad uniformity can have distracting backlight bleed, clouding, banding, and/or vignetting.


