- 0.7%Avg. CAD
- 0.1%Best 10% CAD
- 0.3%Worst 10% CAD
Cumulative Absolute Deviation (CAD) is a way to measure how much motion blur there is on a monitor, which greatly impacts your gaming experience. The last thing you want when playing fast-paced games is a blurry mess where you lose details and can't even properly see objects. CAD is a measurement to encompass the monitor's response time and overshoot into one metric. A monitor with low CAD means fast-moving objects are sharp without any added blur.
We calculate the CAD by measuring the monitor's first response time, total response time, and overshoot with 72 different gray-to-gray transitions. We do this at its max refresh rate, at 120Hz, and at 60Hz. We repeat the process with different overdrive settings that the monitor may have, and determine which performs the best. We also calculate the monitor's CAD across its VRR range.
Learn more about our CAD testing on TVs.
Test results
Test Methodology Coverage
Our CAD tests were added as of Test Bench 2.0 as part of a big overhaul of our motion testing. Although we tested for a monitor's response time on older test benches, including at its max refresh rate, at 120Hz, and at 60Hz, the test methodology was different, and the results aren't comparable to newer reviews. Learn more about how our test benches and scoring system work.
| Tests | 1.0 | 1.1 | 1.2 | 2.0 and newer |
|---|---|---|
| Response Time @ Max, 120Hz, 60Hz | ❌ | ✅ |
| CAD @ Max, 120Hz, 60Hz | ❌ | ✅ |
| VRR Motion Performance | ❌ | ✅ |
When It Matters
How well a monitor handles motion is important anytime you have fast-moving objects on the screen. This can be anything from watching content to battling against your friends in the latest FPS game. Although different factors impact motion handling in general, a monitor with a slow response time results in a distracting, blurry mess. If you have fewer fast-moving objects, like if there are static elements while you're working on documents or watching a sitcom, the response time is less important to you. That said, even scrolling fast through a document or watching action movies can lead to distracting blur if the monitor has a slow response time.
One of the main measurements of motion handling is a monitor's response time, which defines how fast each pixel on your monitor transitions colors. For example, if you're playing a game with a red object moving against a black background, the response time tells us how fast the black pixels are transitioning into red and, inversely, how fast the red pixels go back to black. In cases with such a slow response time, pixels might not even fully transition to red before they have to change back to black, so you aren't even seeing the image as intended.
The response time isn't the only factor to consider when it comes to motion handling, as the refresh rate also impacts the amount of persistence blur. While it's easy to get caught up in these numbers and details, having a monitor with a faster response time than one with a slow response time is an advantage for gaming.
 ASUS ROG Swift OLED PG27UCDM |
 AOC 24G15N |
Our Tests
When testing a monitor, we first warm it up by playing a video for 30 minutes; then, we enable VRR. We also use various overdrive settings that a monitor may have, but if a monitor locks out the overdrive settings with VRR enabled, we measure both with and without VRR. We measure the response time at the monitor's max refresh rate, 120Hz, and 60Hz. We also repeat the same testing methods for each refresh rate with all of the available overdrive settings. This means there are a lot of unique measurements for each monitor, which helps create the necessary data to help you make a buying decision.
We measure the response time after calibration and disable local dimming if the monitor has it. Before calculating CAD, we first measure the first response time, total response time, and overshoot, and they're each plotted into heatmaps to show you how well the monitor performs.
Gamma-Corrected Response Time Tool
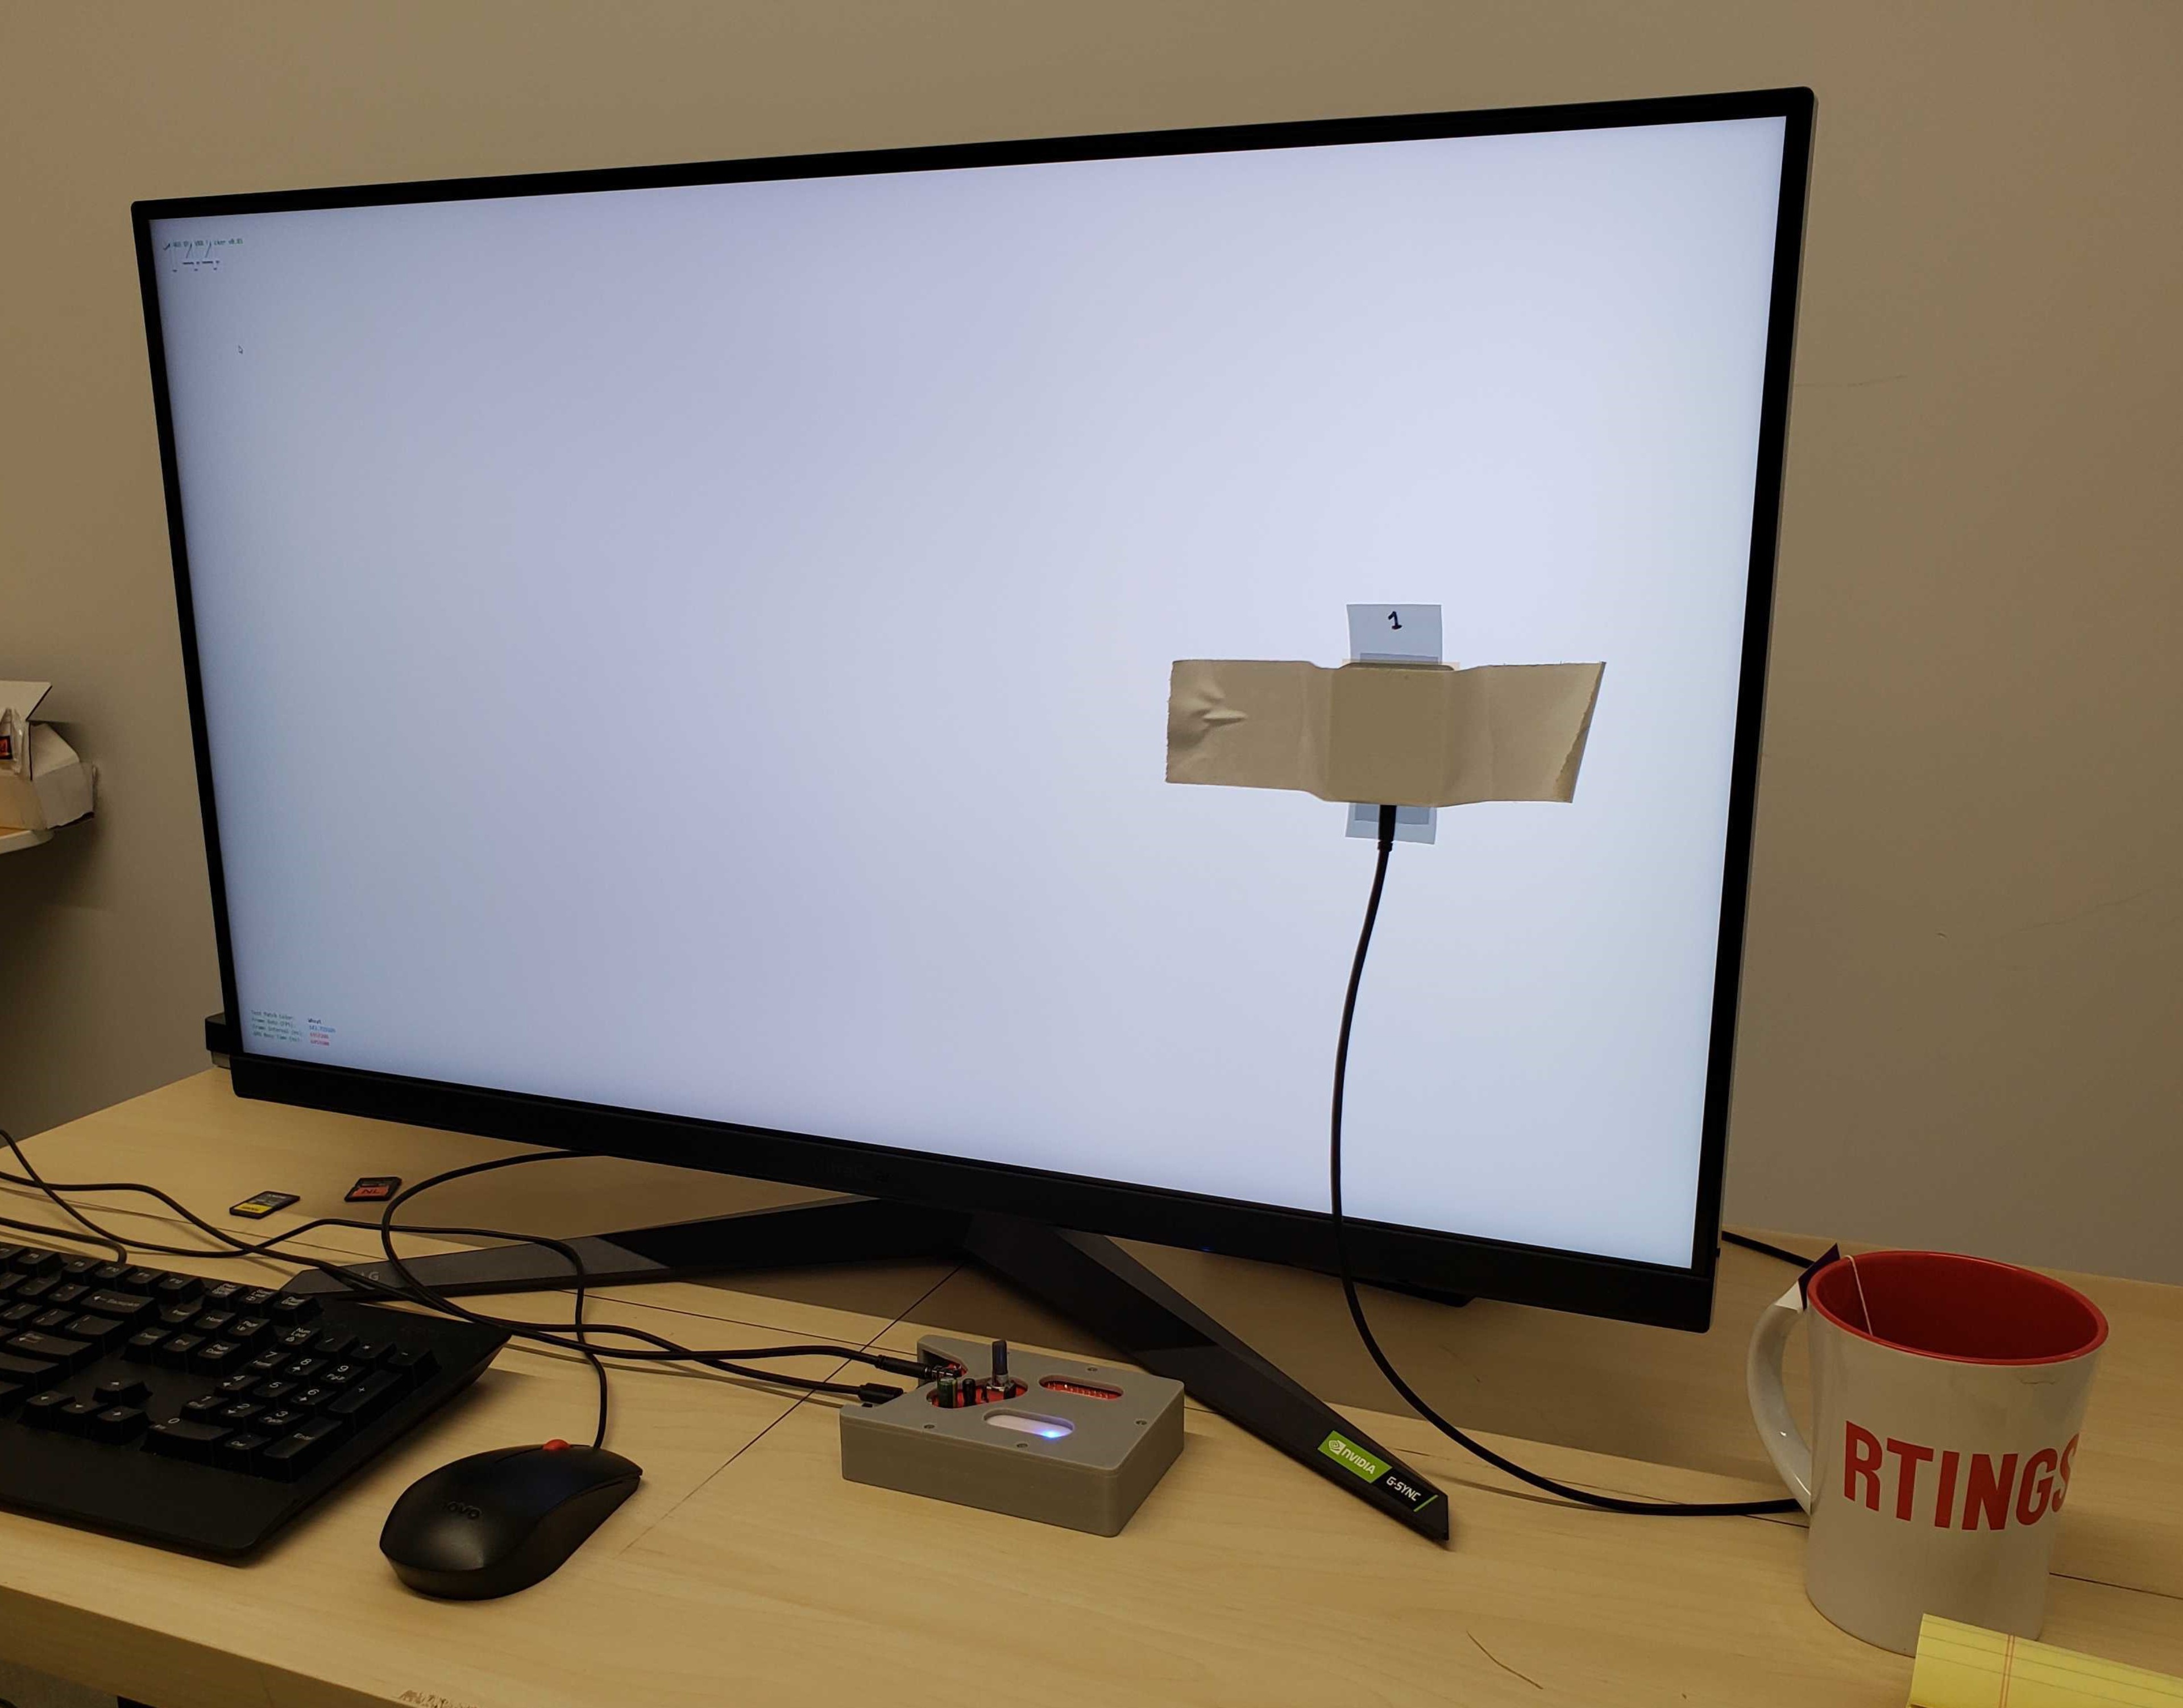
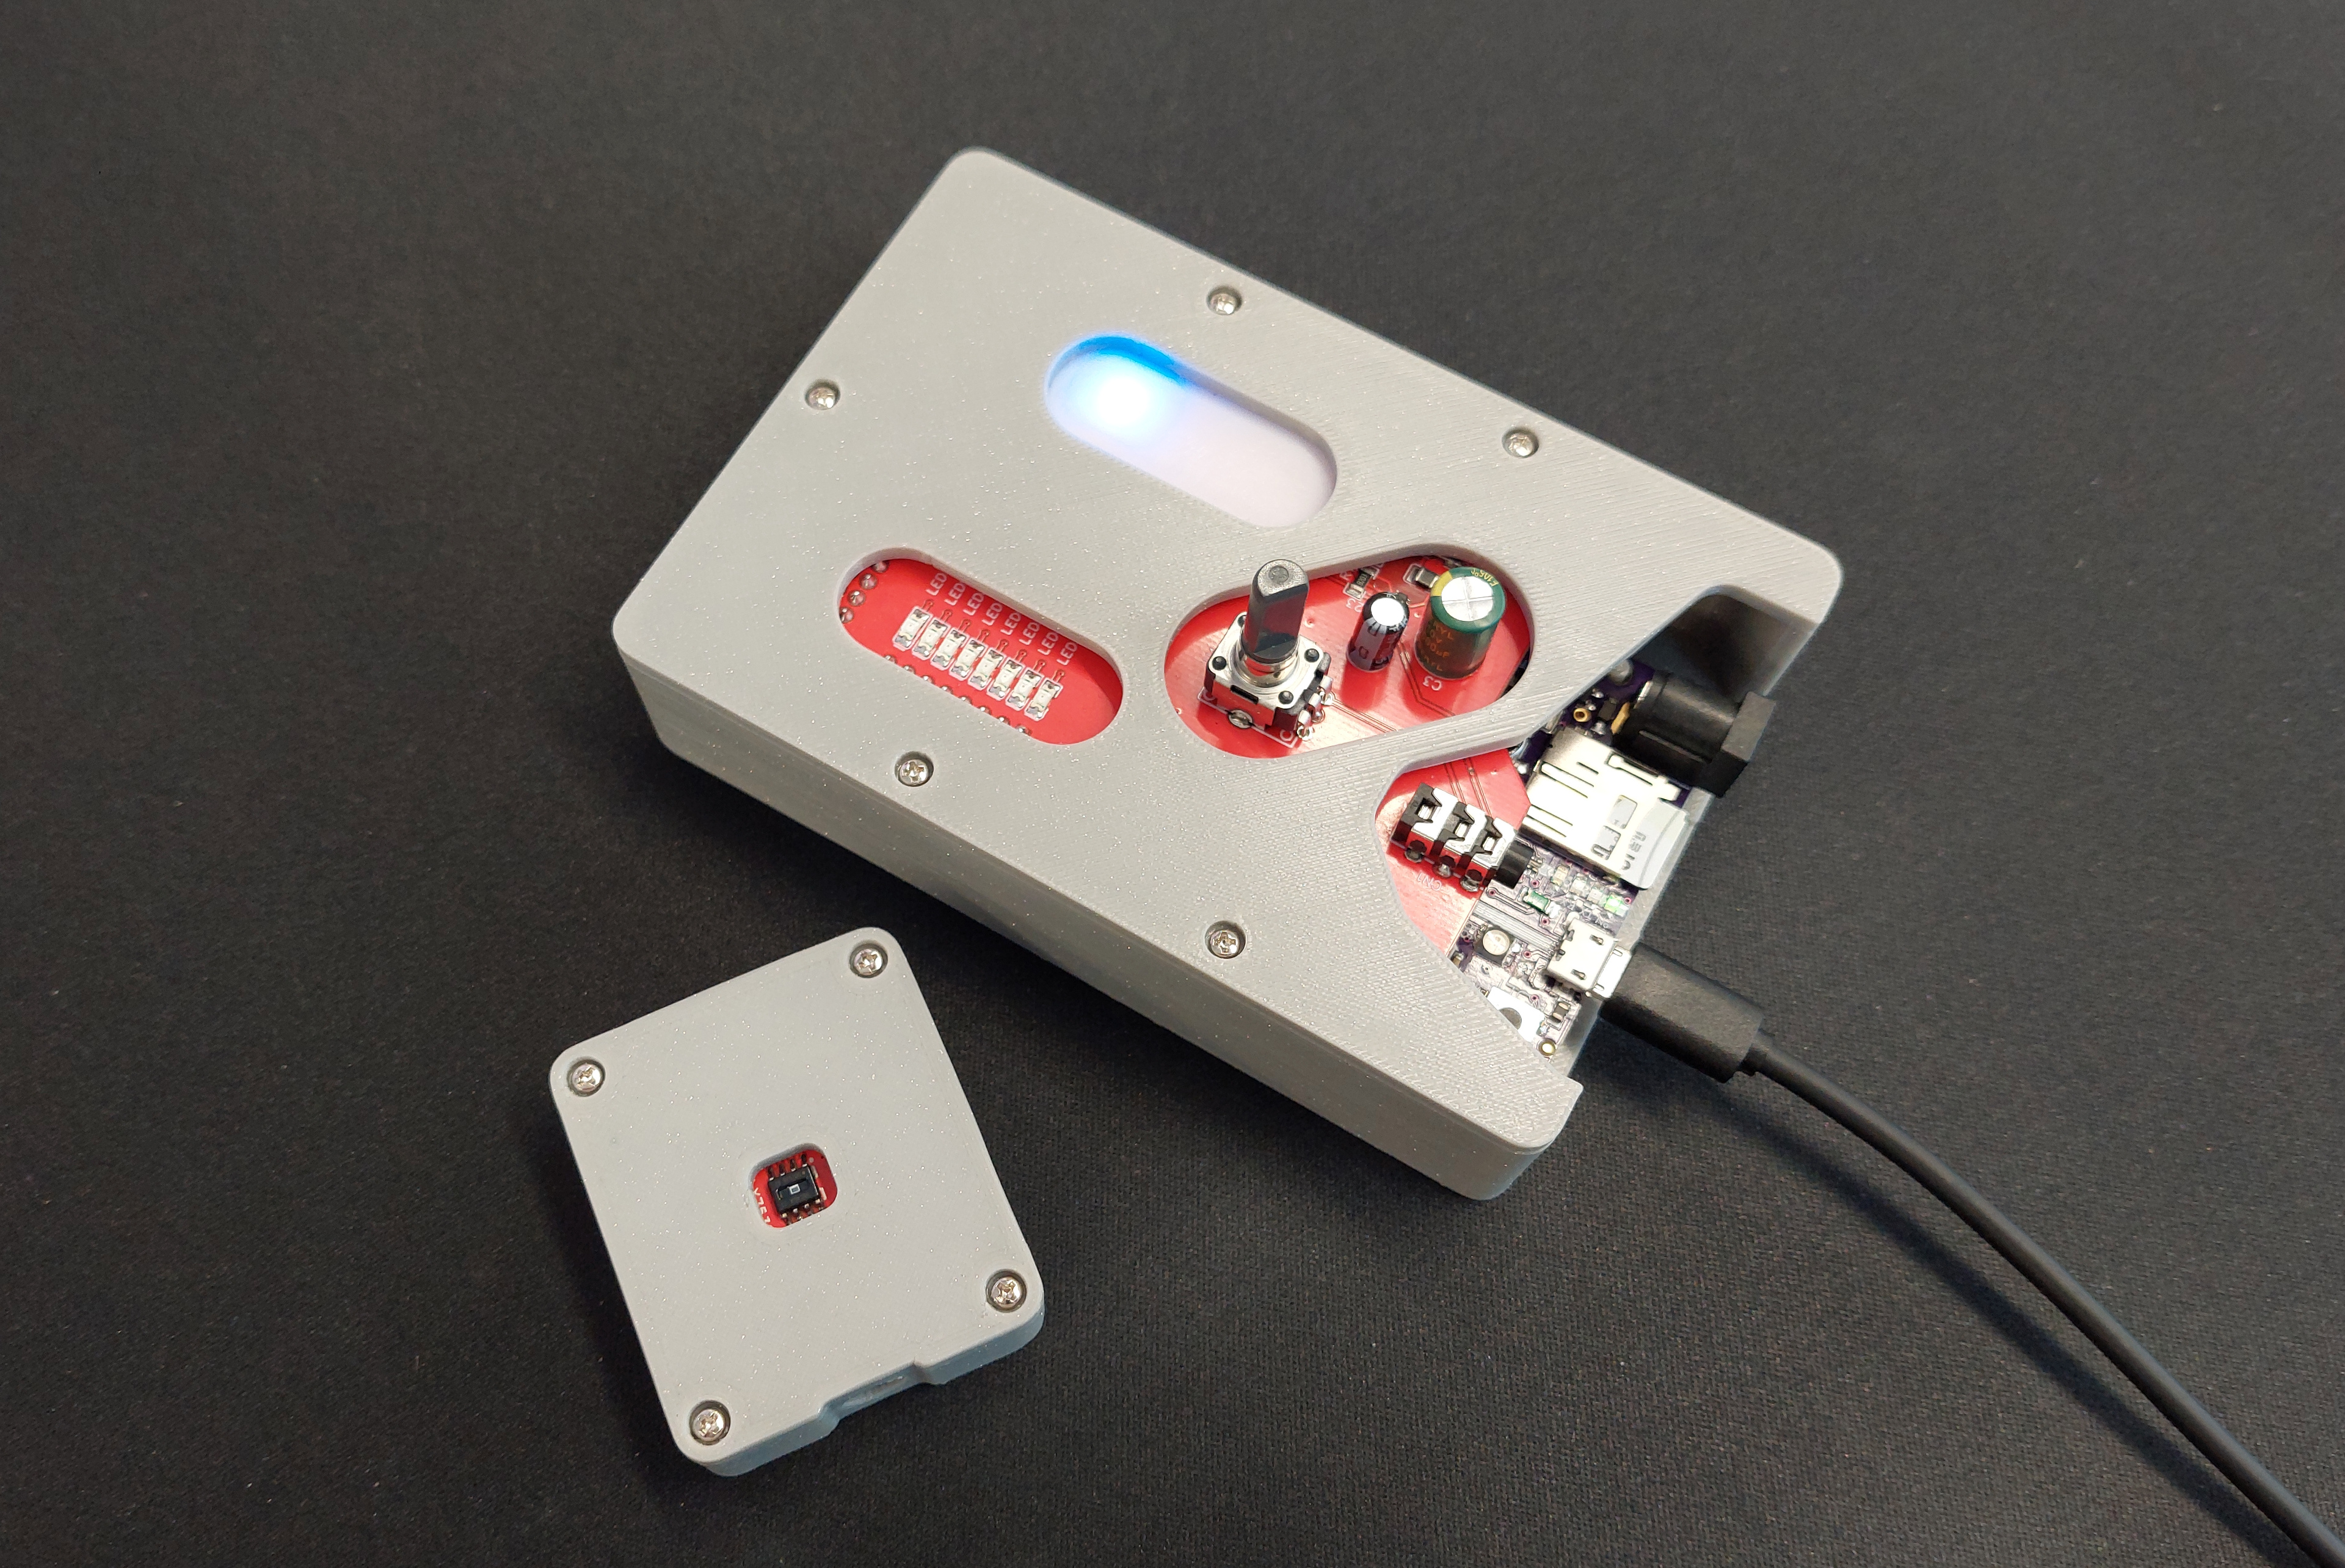
We designed our own specialized tool to measure the response time. It reads light output from a monitor with a photodiode, and the microcontroller reads the voltage from the photodiode and converts it to a 16-bit integer (0-65,535). The photodiode is separate from the microcontroller, as seen in the image below. The testers attach the photodiode to the screen while the microcontroller connects to our test PC via USB. We tend to place the photodiode on the right side of the screen, but we expect performance to be the same even with the sensor in another location.
We calibrate the response time tool with a gamma correction to ensure consistent, accurate measurements across all monitors. This is because every monitor will have a different light output for different colors. For example, an OLED will have a light output of 0 when displaying pure black, while an IPS or VA monitor will have a light output greater than 0 for black, even though they're trying to display the same color.
A solution to this problem is calibrating the tool to the monitor's gamma, otherwise called gamma correction. We do this by displaying every gray level from RGB 0 (pure black) all the way up to RGB 255 (pure white) and measuring the sensor's output voltage for each RGB step. With this, our computer program can correlate light output to its matching RGB value for any brightness. For example, if our sensor reads 690 mV (or 13,397 in 16-bit), it uses the monitor's measured gamma curve to match that to RGB 127, which is RGB (127, 127, 127) on the color wheel.
Instead of measuring light output from a value of 0 to 65,535, we're measuring colors within a range of RGB 0 to 255. This is also more representative of what our eyes see because the light output voltage scale is non-linear, and the difference between 100 and 200 is a lot more noticeable than the difference between 15,000 and 15,100. On the other hand, gamma is perceptually uniform, so the difference between 5 RGB is the same at any point in the scale.
What We Measure
Once gamma-corrected, we use the tool to measure all possible transitions between nine different levels of gray, from RGB 0 to RGB 255, including the same transitions in both directions, like RGB 0-31 and RGB 31-0. We do this to see how the monitor transitions from dark colors to lighter ones and from light objects to dark, which aims to represent all the different transitions you'll see on screen. In total, there are 72 transitions for which we measure the response time and overshoot.
While you may think that measuring only gray isn't representative of colorful content, the response time is the same even with various colors. This is because any of the gray colors uses all three red, green, and blue subpixels equally. For example, RGB 191 is actually just RGB color (191, 191, 191). This means that whenever we measure a gray-to-gray transition, each of the three subpixels is also changing.
| RGB 0 | RGB 31 | RGB 63 | RGB 95 | RGB 127 | RGB 159 | RGB 191 | RGB 223 | RGB 255 |
|---|---|---|---|---|---|---|---|---|
 |
 |
 |
 |
 |
 |
 |
 |
 |
Response Time @ Max Hz, 120Hz, 60Hz
Although the response time box isn't scored like it was on previous test benches, we still include it so you can see raw data for the first response time, total response time, and overshoot. All of this is measured during the 72 different gray-to-gray transitions. We repeat this test at the monitor's max refresh rate, at 120Hz (if applicable), and at 60Hz. While we measure each of the monitors' overdrive settings, the results in the review only include the recommended overdrive setting.
First Response Time
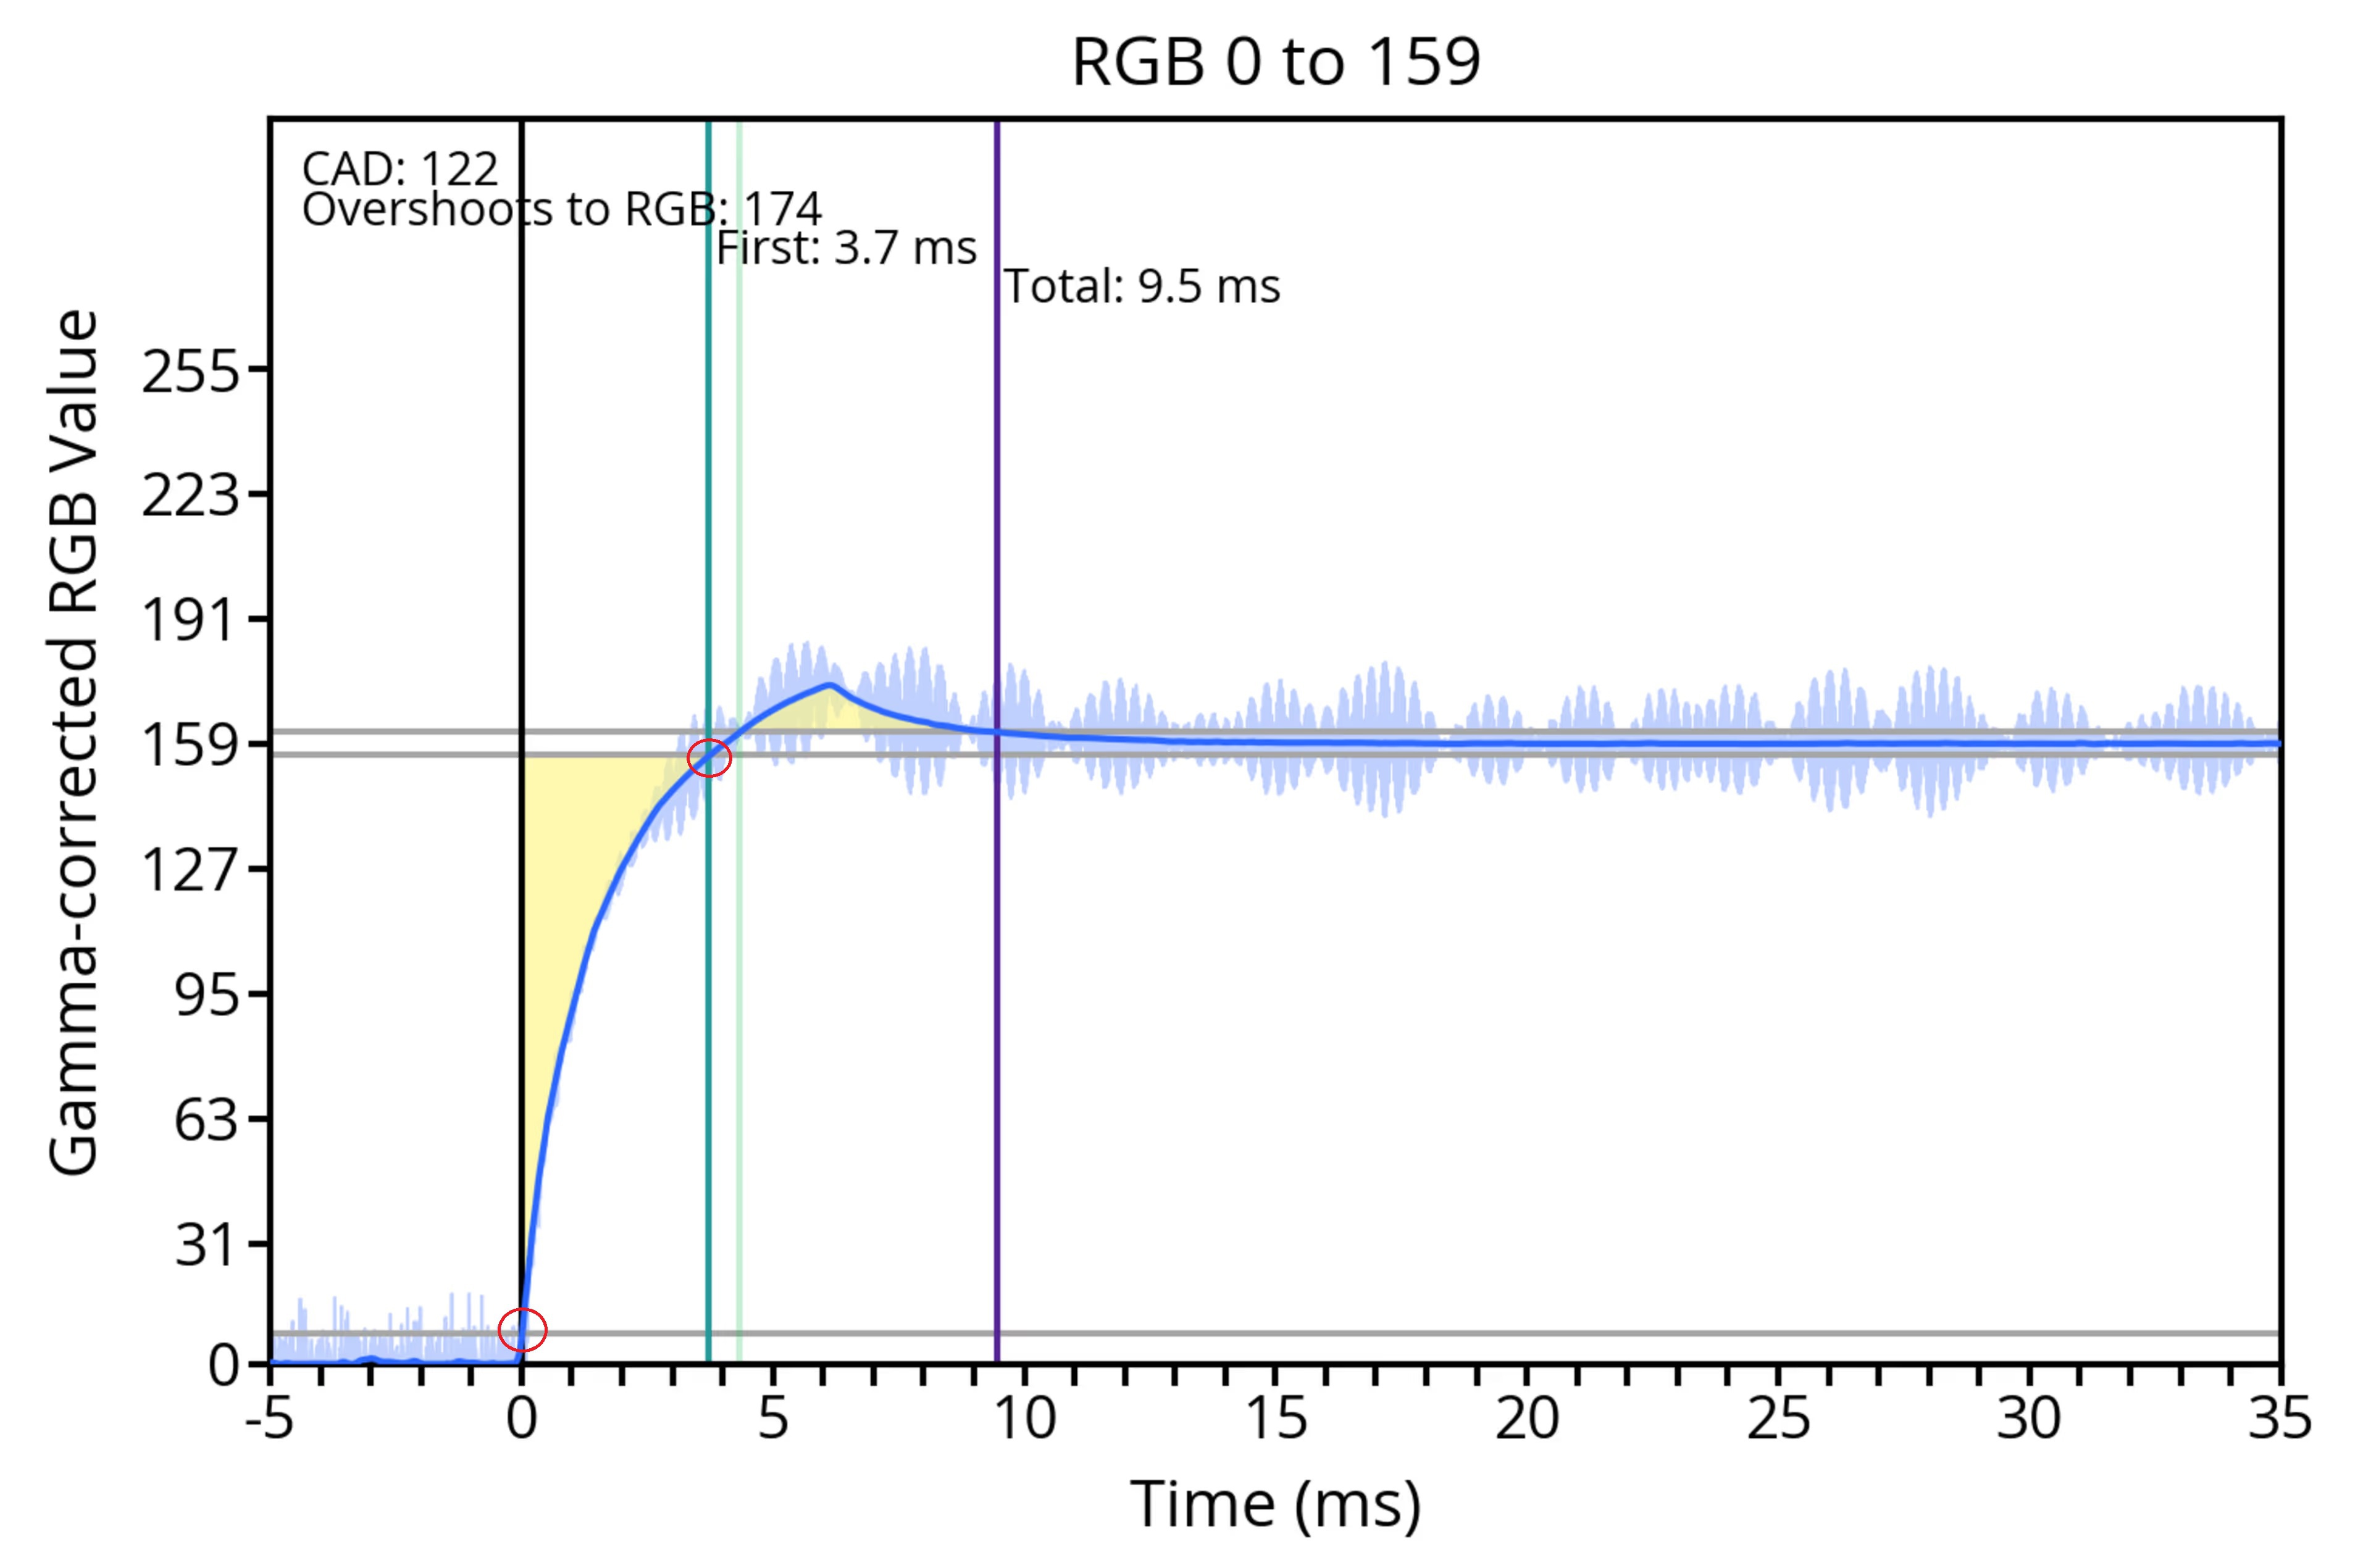
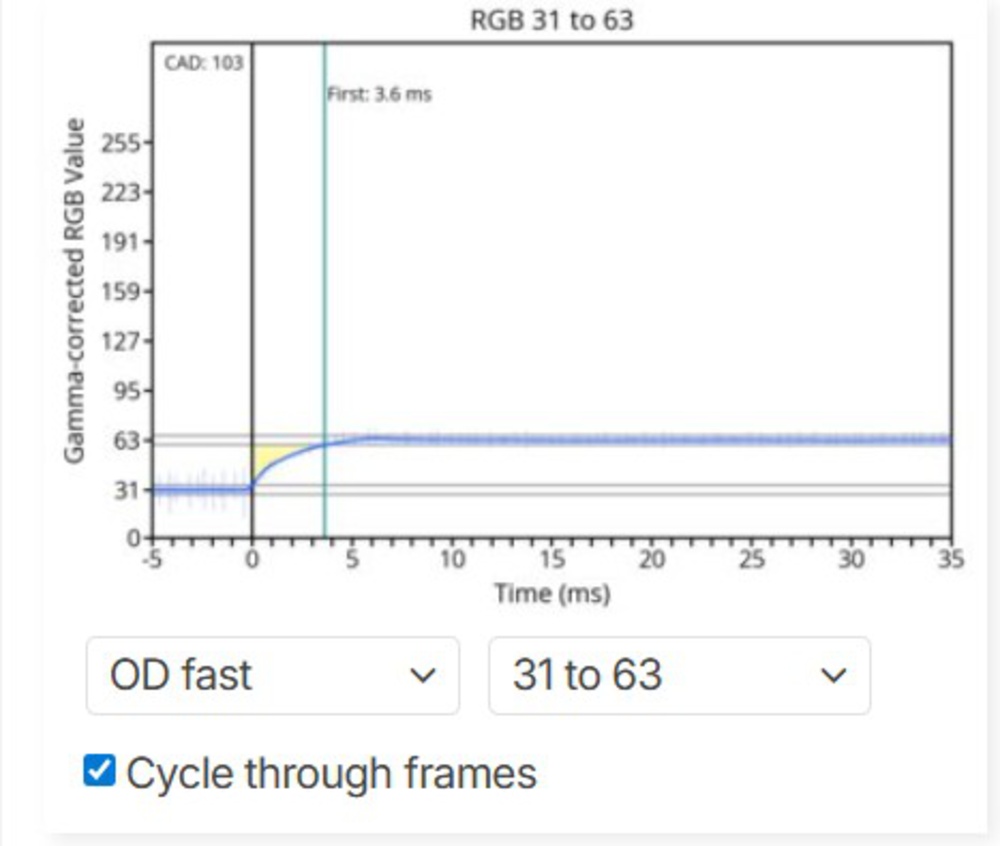
The first response time is the time it takes to get from its initial RGB value to when it initially reaches its target, excluding any overshoot. So in the example below from the Acer Nitro XV275K P3biipruzx, you can see both the raw (light blue) and smoothed (dark blue) response time data as it takes 3.7 ms to go from RGB 0 to 159, which are highlighted with the red circles in the chart, and the green vertical line also marks the first response time. We actually have a threshold of plus/minus 3 RGB, so in this case, this is the time it takes to get to 156 RGB.
This response time chart is from one of the 72 different transitions. Altogether, we compile a heatmap to show the first response time with each transition, and it's color-coded to show how good the results are. Reading the heatmap is straightforward: the left column represents the initial point, and the top row is the RGB target. So, if you want to know the first response time for RGB 63 to 159, you just need to go to the row with 63 and find the time when it reaches the 159 column (4.0 ms).
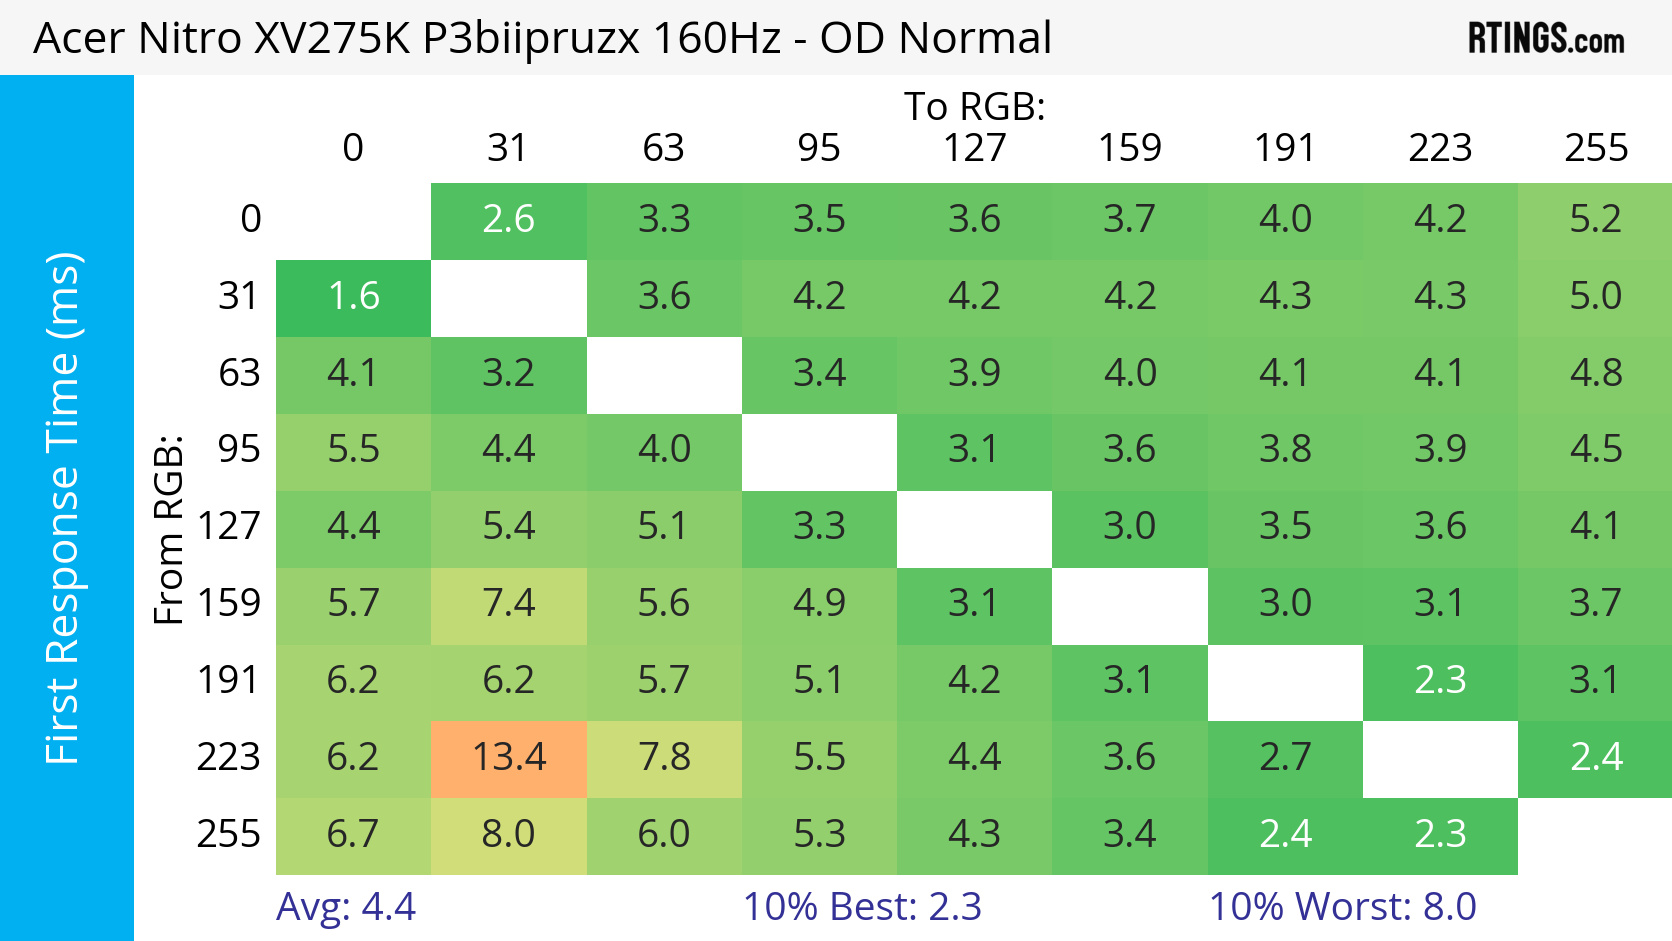
In the review, we include an average of all the first response time measurements for each refresh rate. We also list the 'Worst 10% First Response Time,' which is the average of the worst 10% of transitions. In the case of the Acer, it's 8.0 ms.
Total Response Time
As the name suggests, the total response time is the total time it takes for the monitor to reach its target color and stay there. Using the same example from above, you can see the total response time for the Acer in the RGB 0-159 chart (9.5 ms), as it stabilizes itself after overshooting. It mainly has overshoot in transitions that start at 0 and get brighter, which is why the total response time is different from the first response time in those cases. In most transitions, the total response time is the same as the first response time, meaning there's no overshoot. Reading the heatmap is the same as the first response time heatmap.
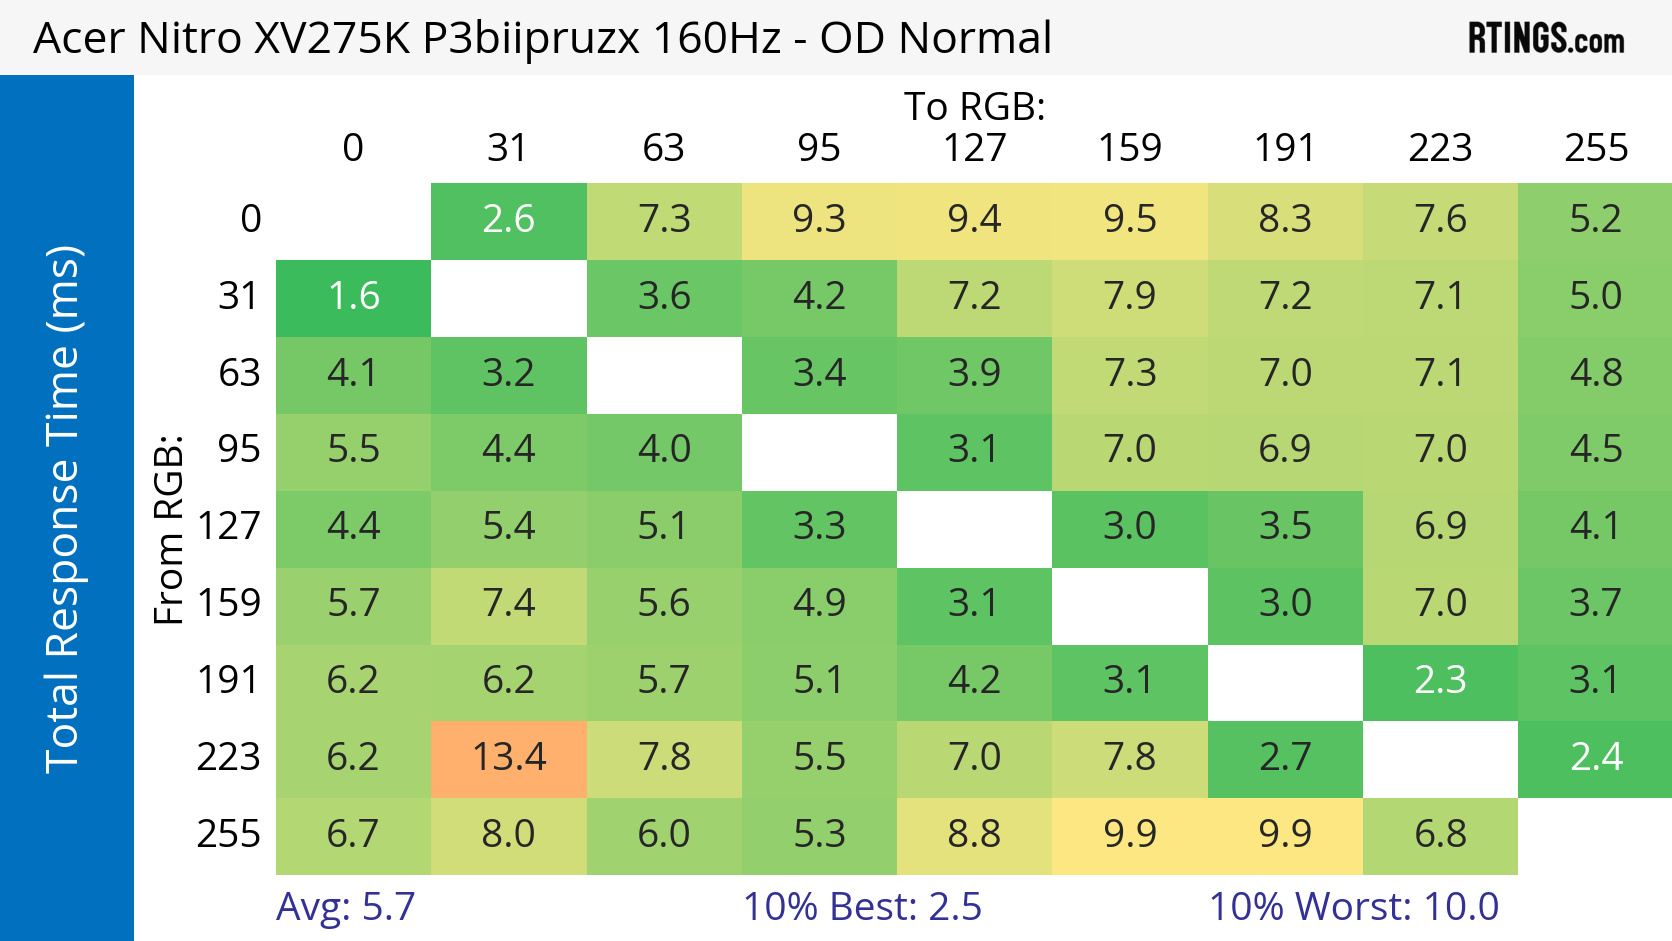
The final total response time is given as an average of all measurements. We also list the 'Worst 10% Total Response Time,' which is the average of the worst 10% of transitions.
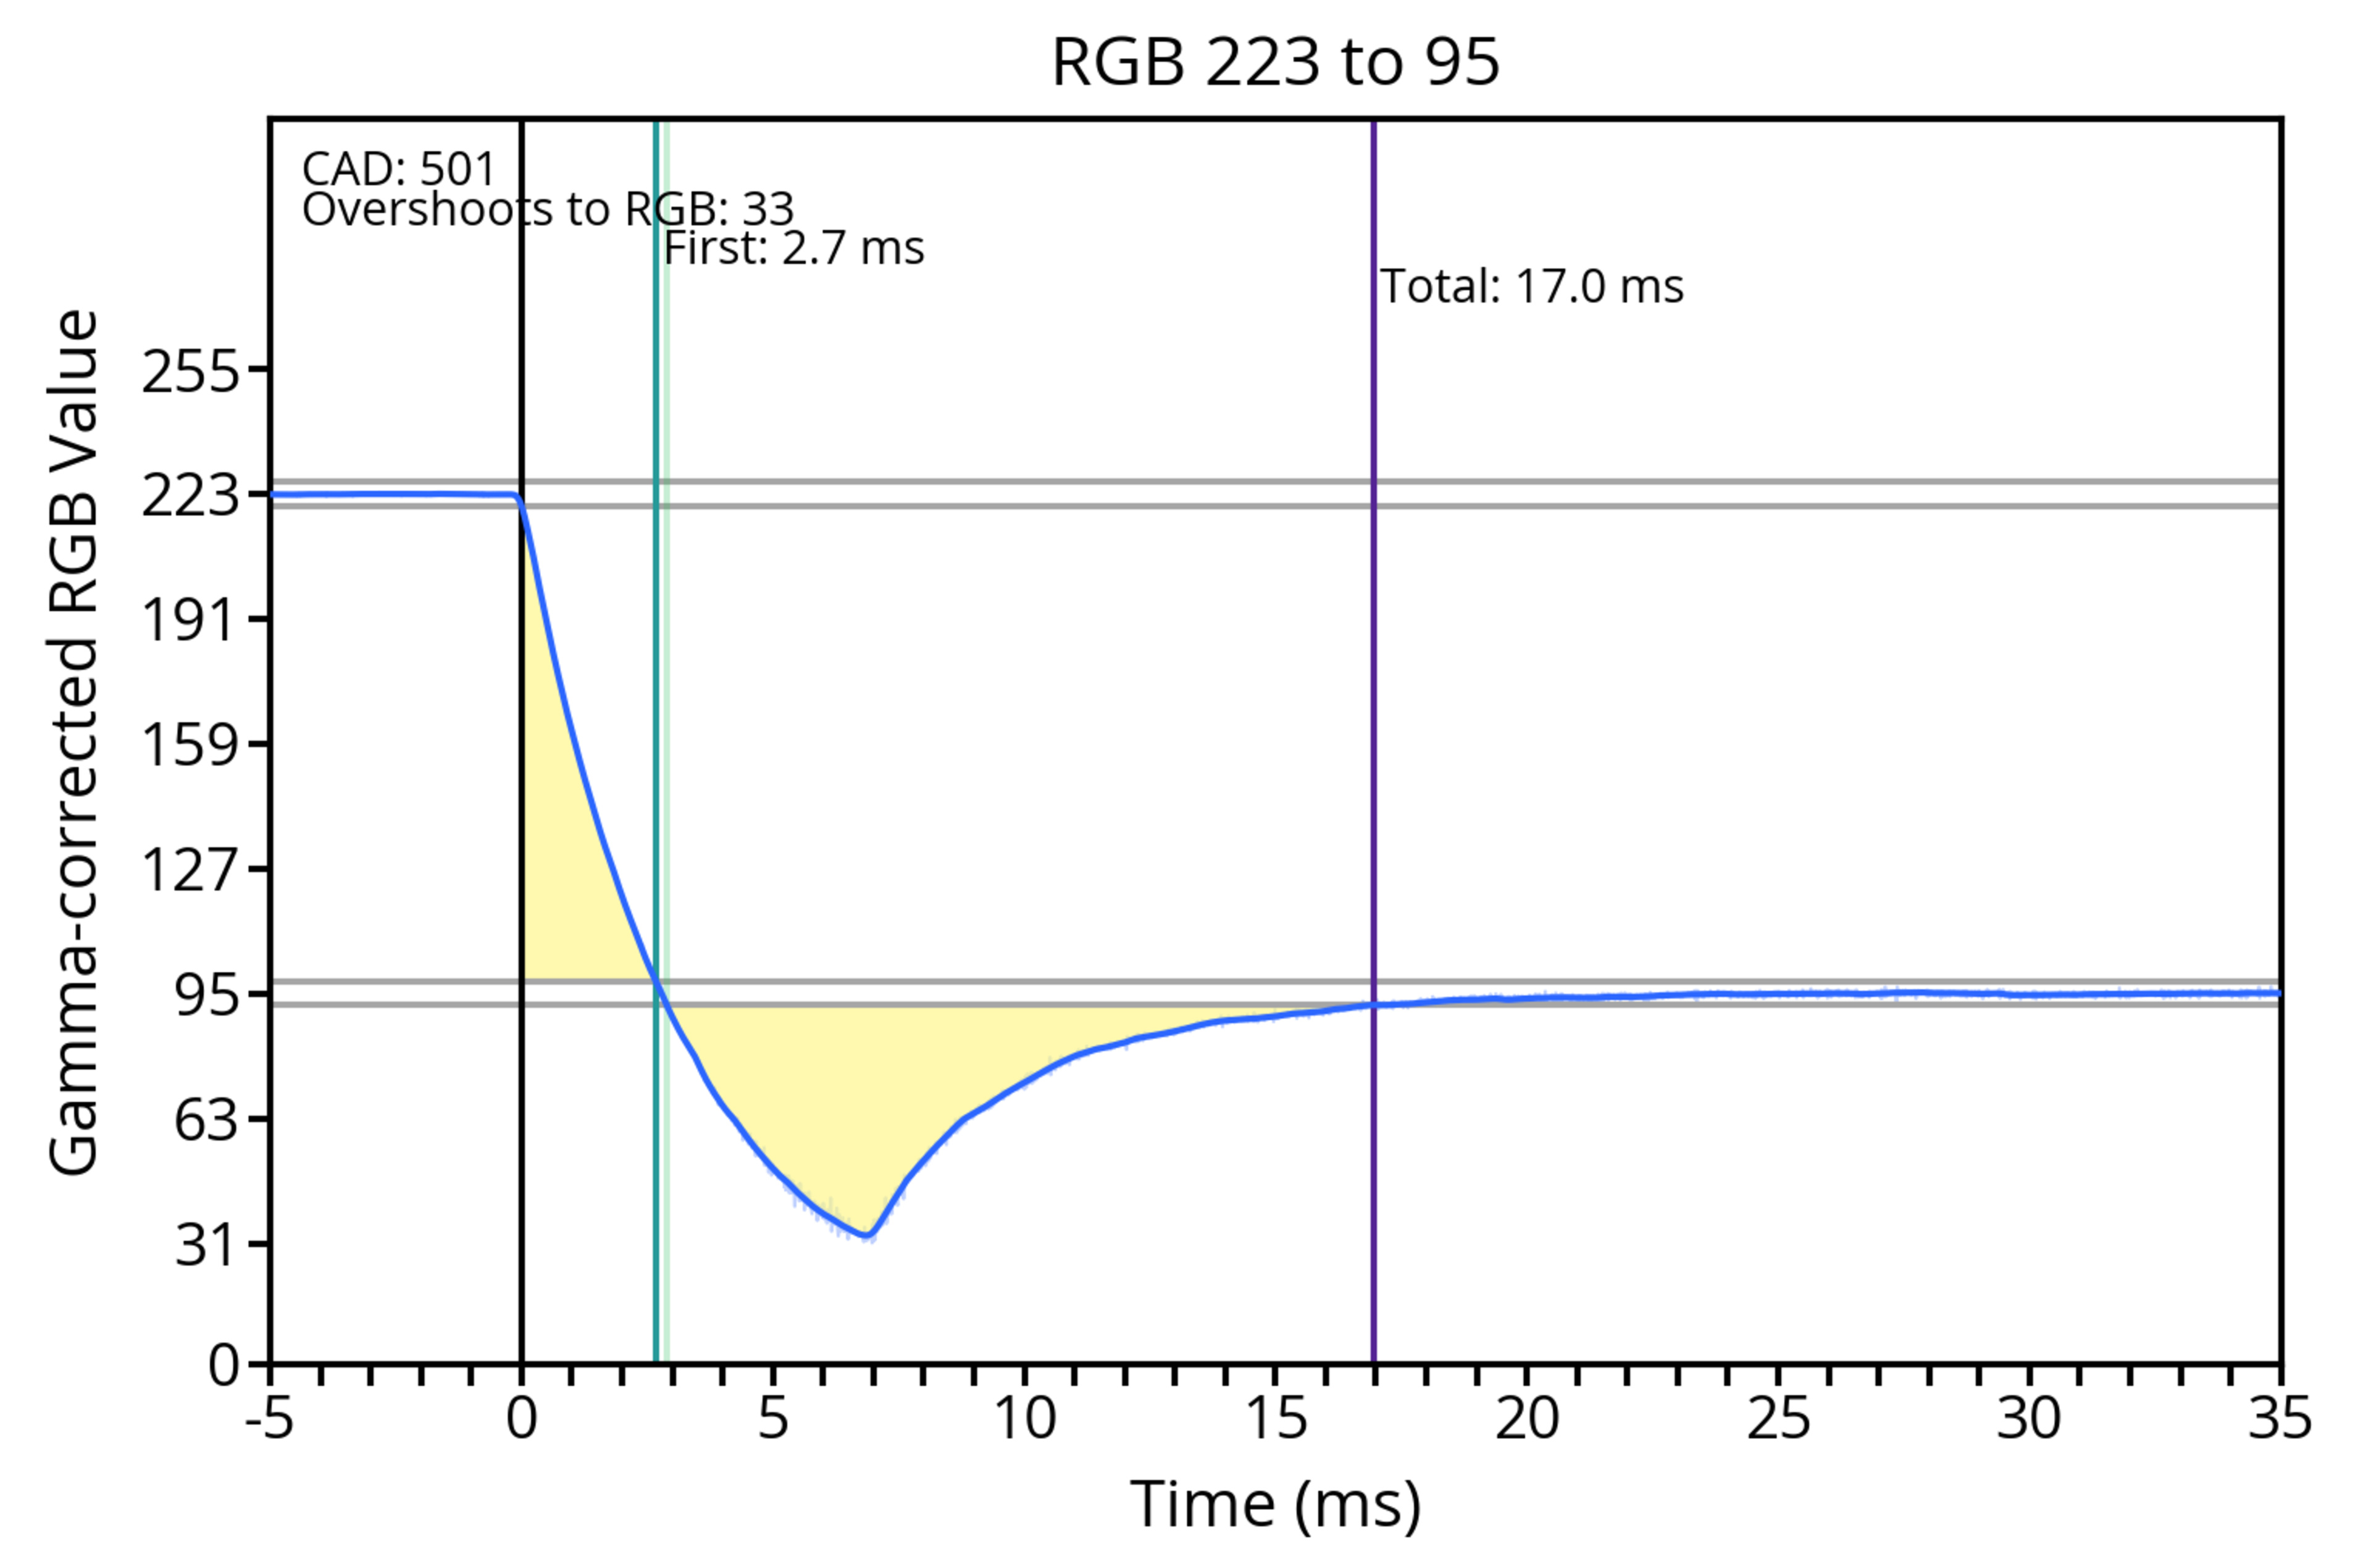
RGB Overshoot
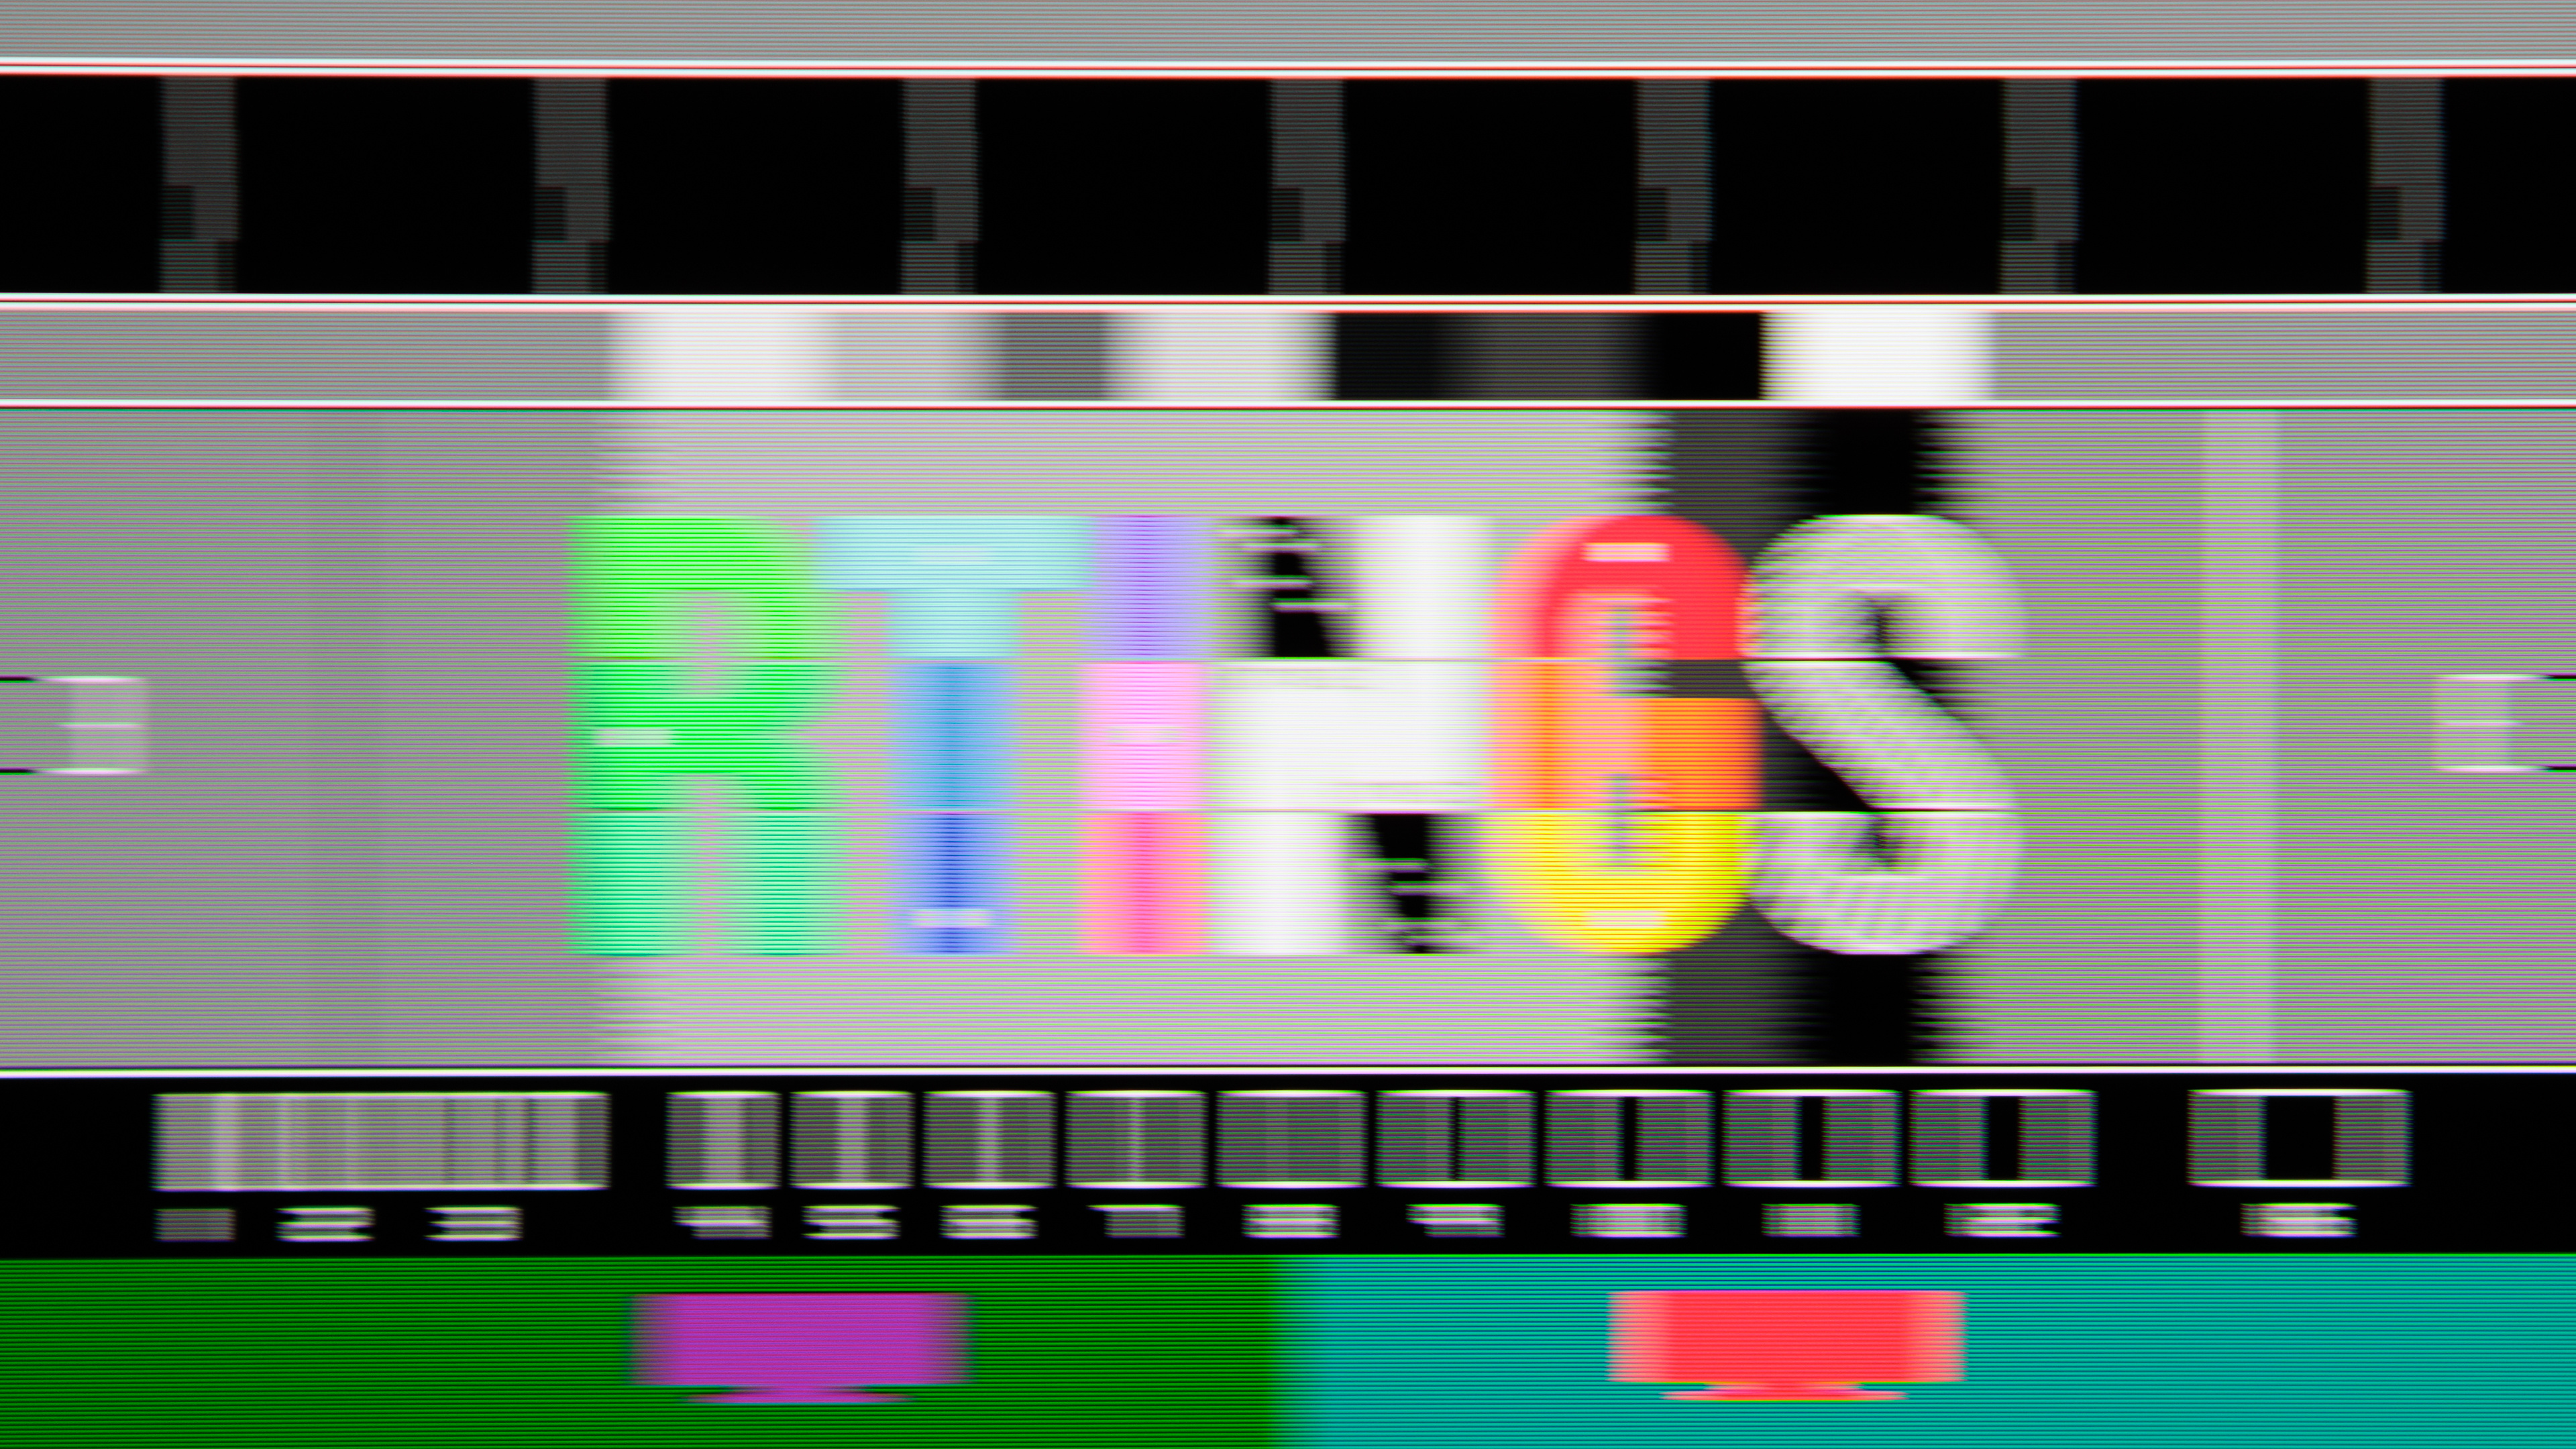
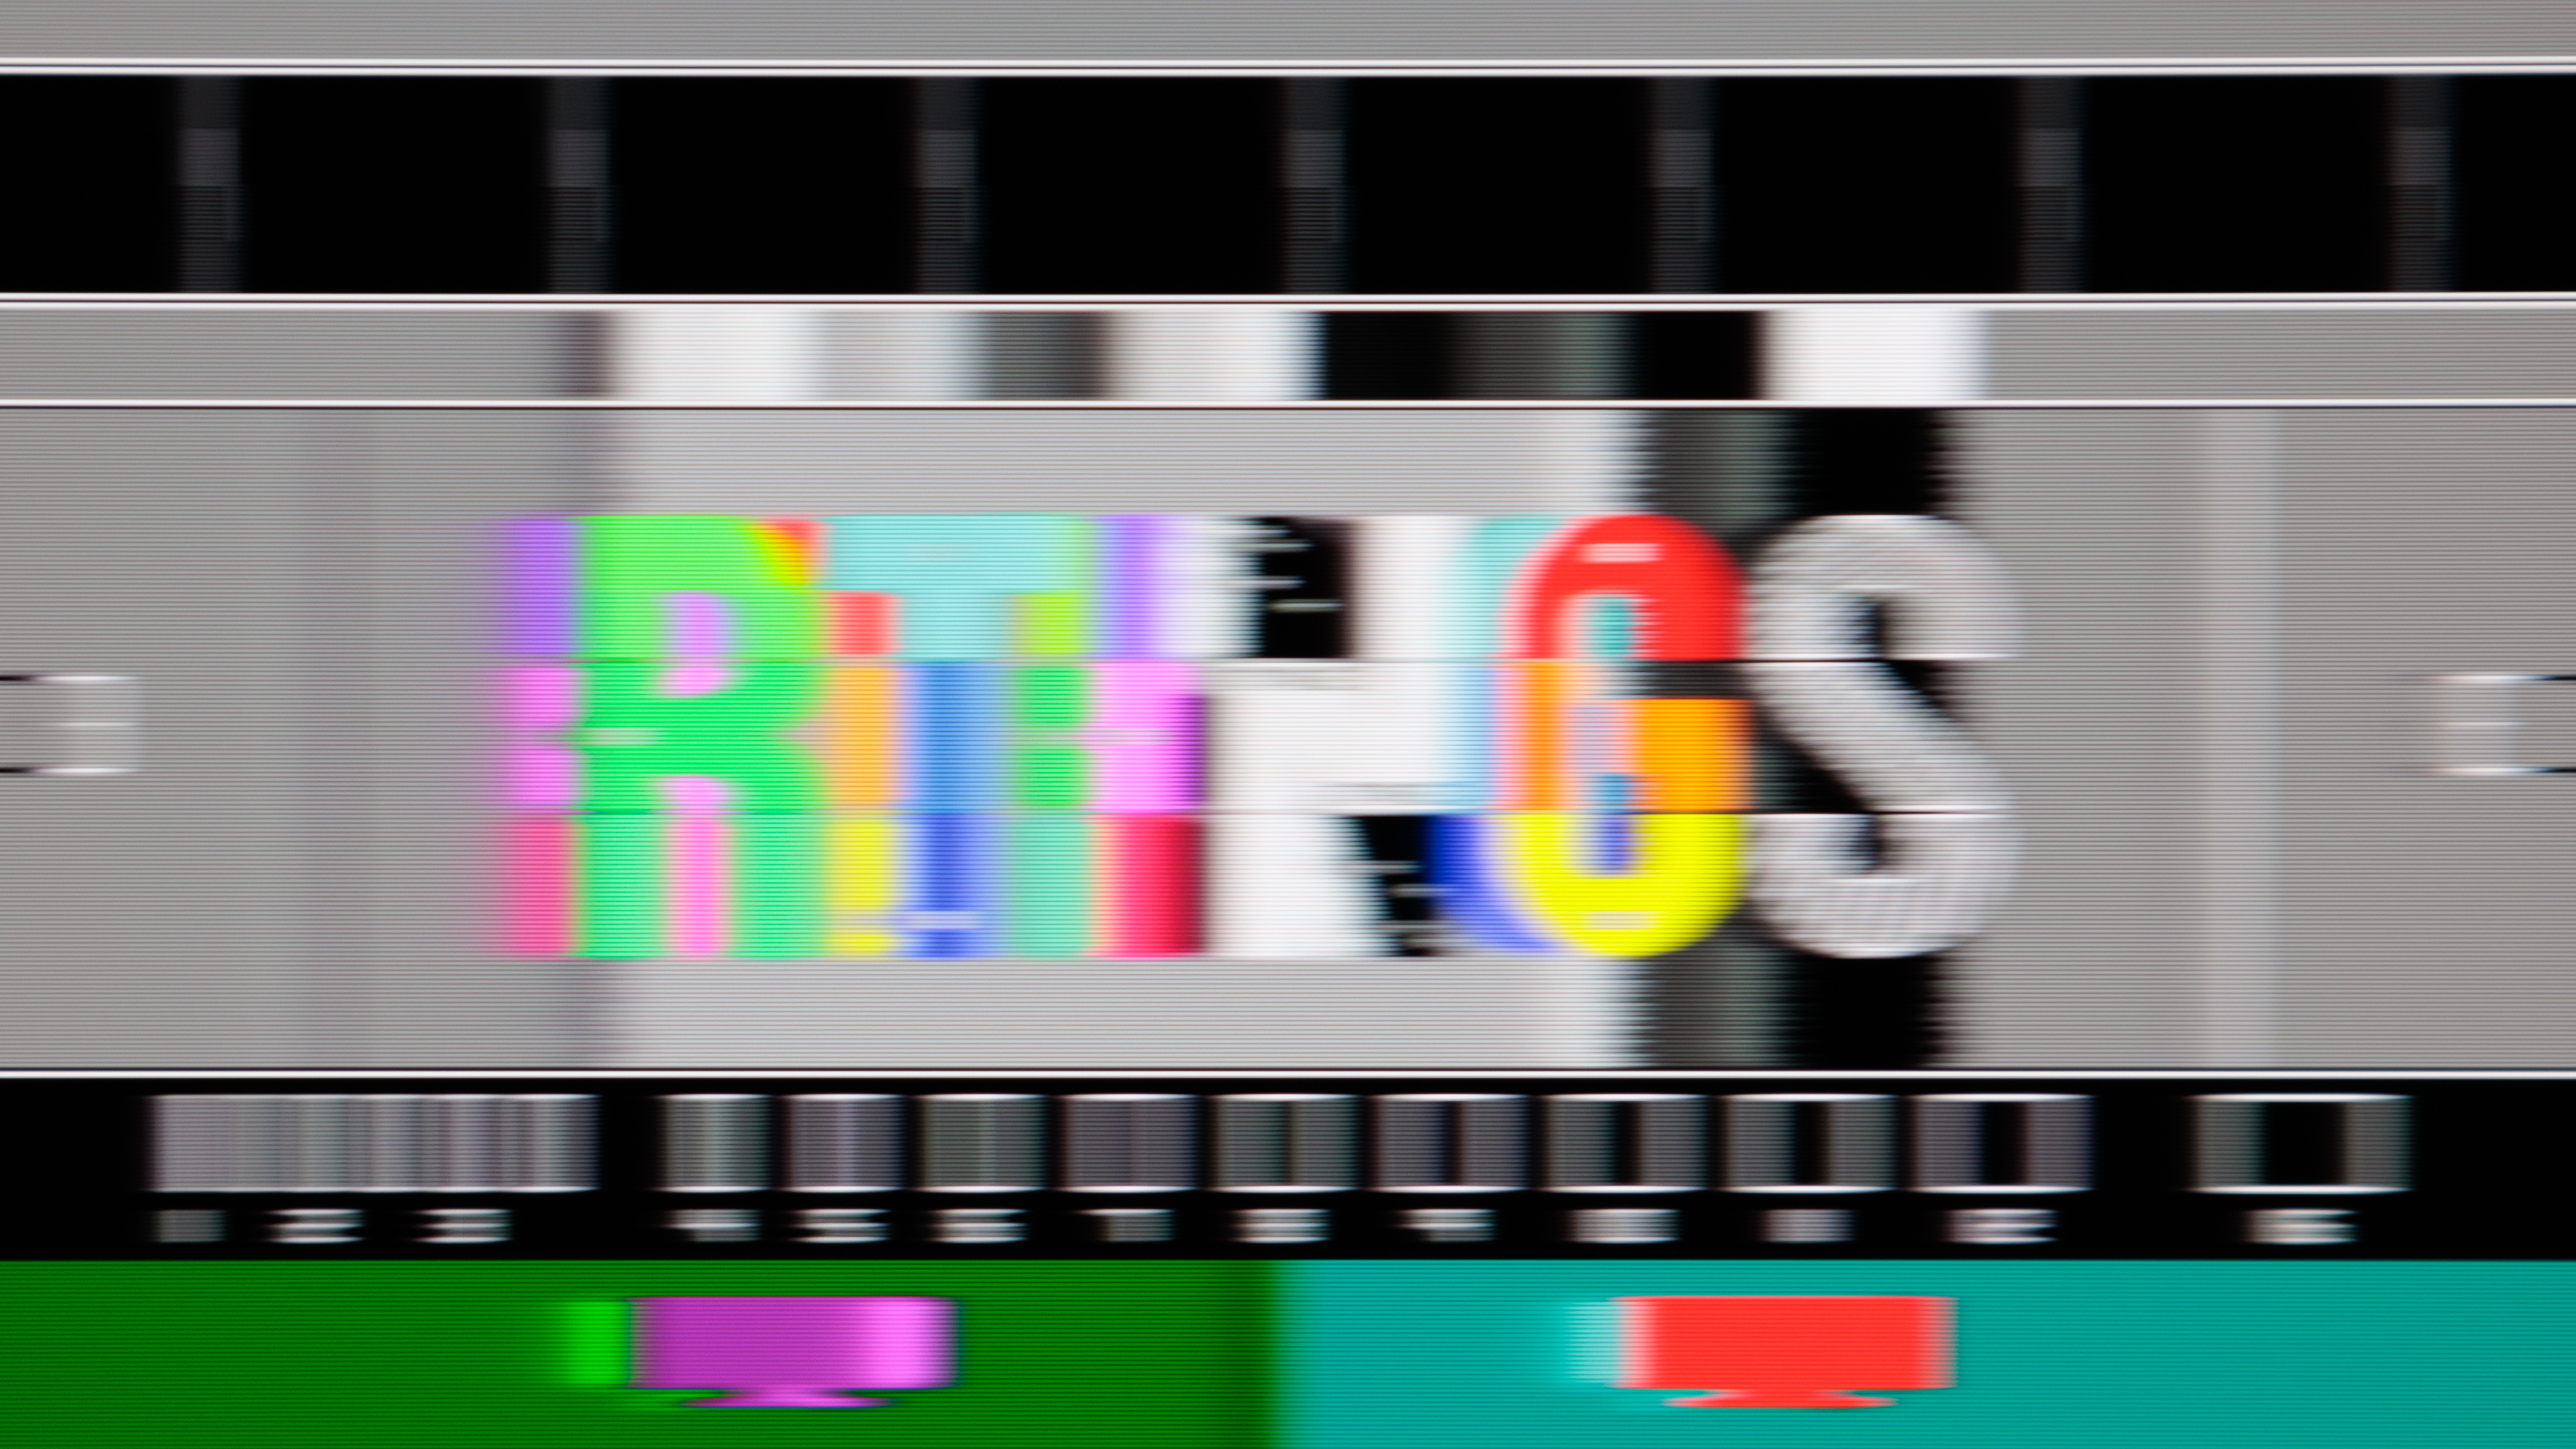
Overshoot is when the monitor transitions past its color target, even for a few milliseconds, before settling back down to its final target. Large amounts of overshoot are distracting and negatively impact the appearance of motion by resulting in inverse ghosting, which you can see below. It's most noticeable with the added colors behind the letters, like the purple and magenta behind the green letter R.
It can happen both when the monitor goes from a dark color to a lighter one (left chart below) and when the monitor transitions from light to dark (right chart below). Not every transition has overshoot, though. If the first response time and total response time are the same, that means there's no overshoot.
 |
 |
The final RGB overshoot is an average overshoot of all transitions. We also list the 'Worst 10% RGB Overshoot,' which is the average of the worst 10% of transitions.
Cumulative Absolute Deviation (CAD) @ Max Hz, 120Hz, 60Hz
- 0.7%Avg. CAD
- 0.1%Best 10% CAD
- 0.3%Worst 10% CAD
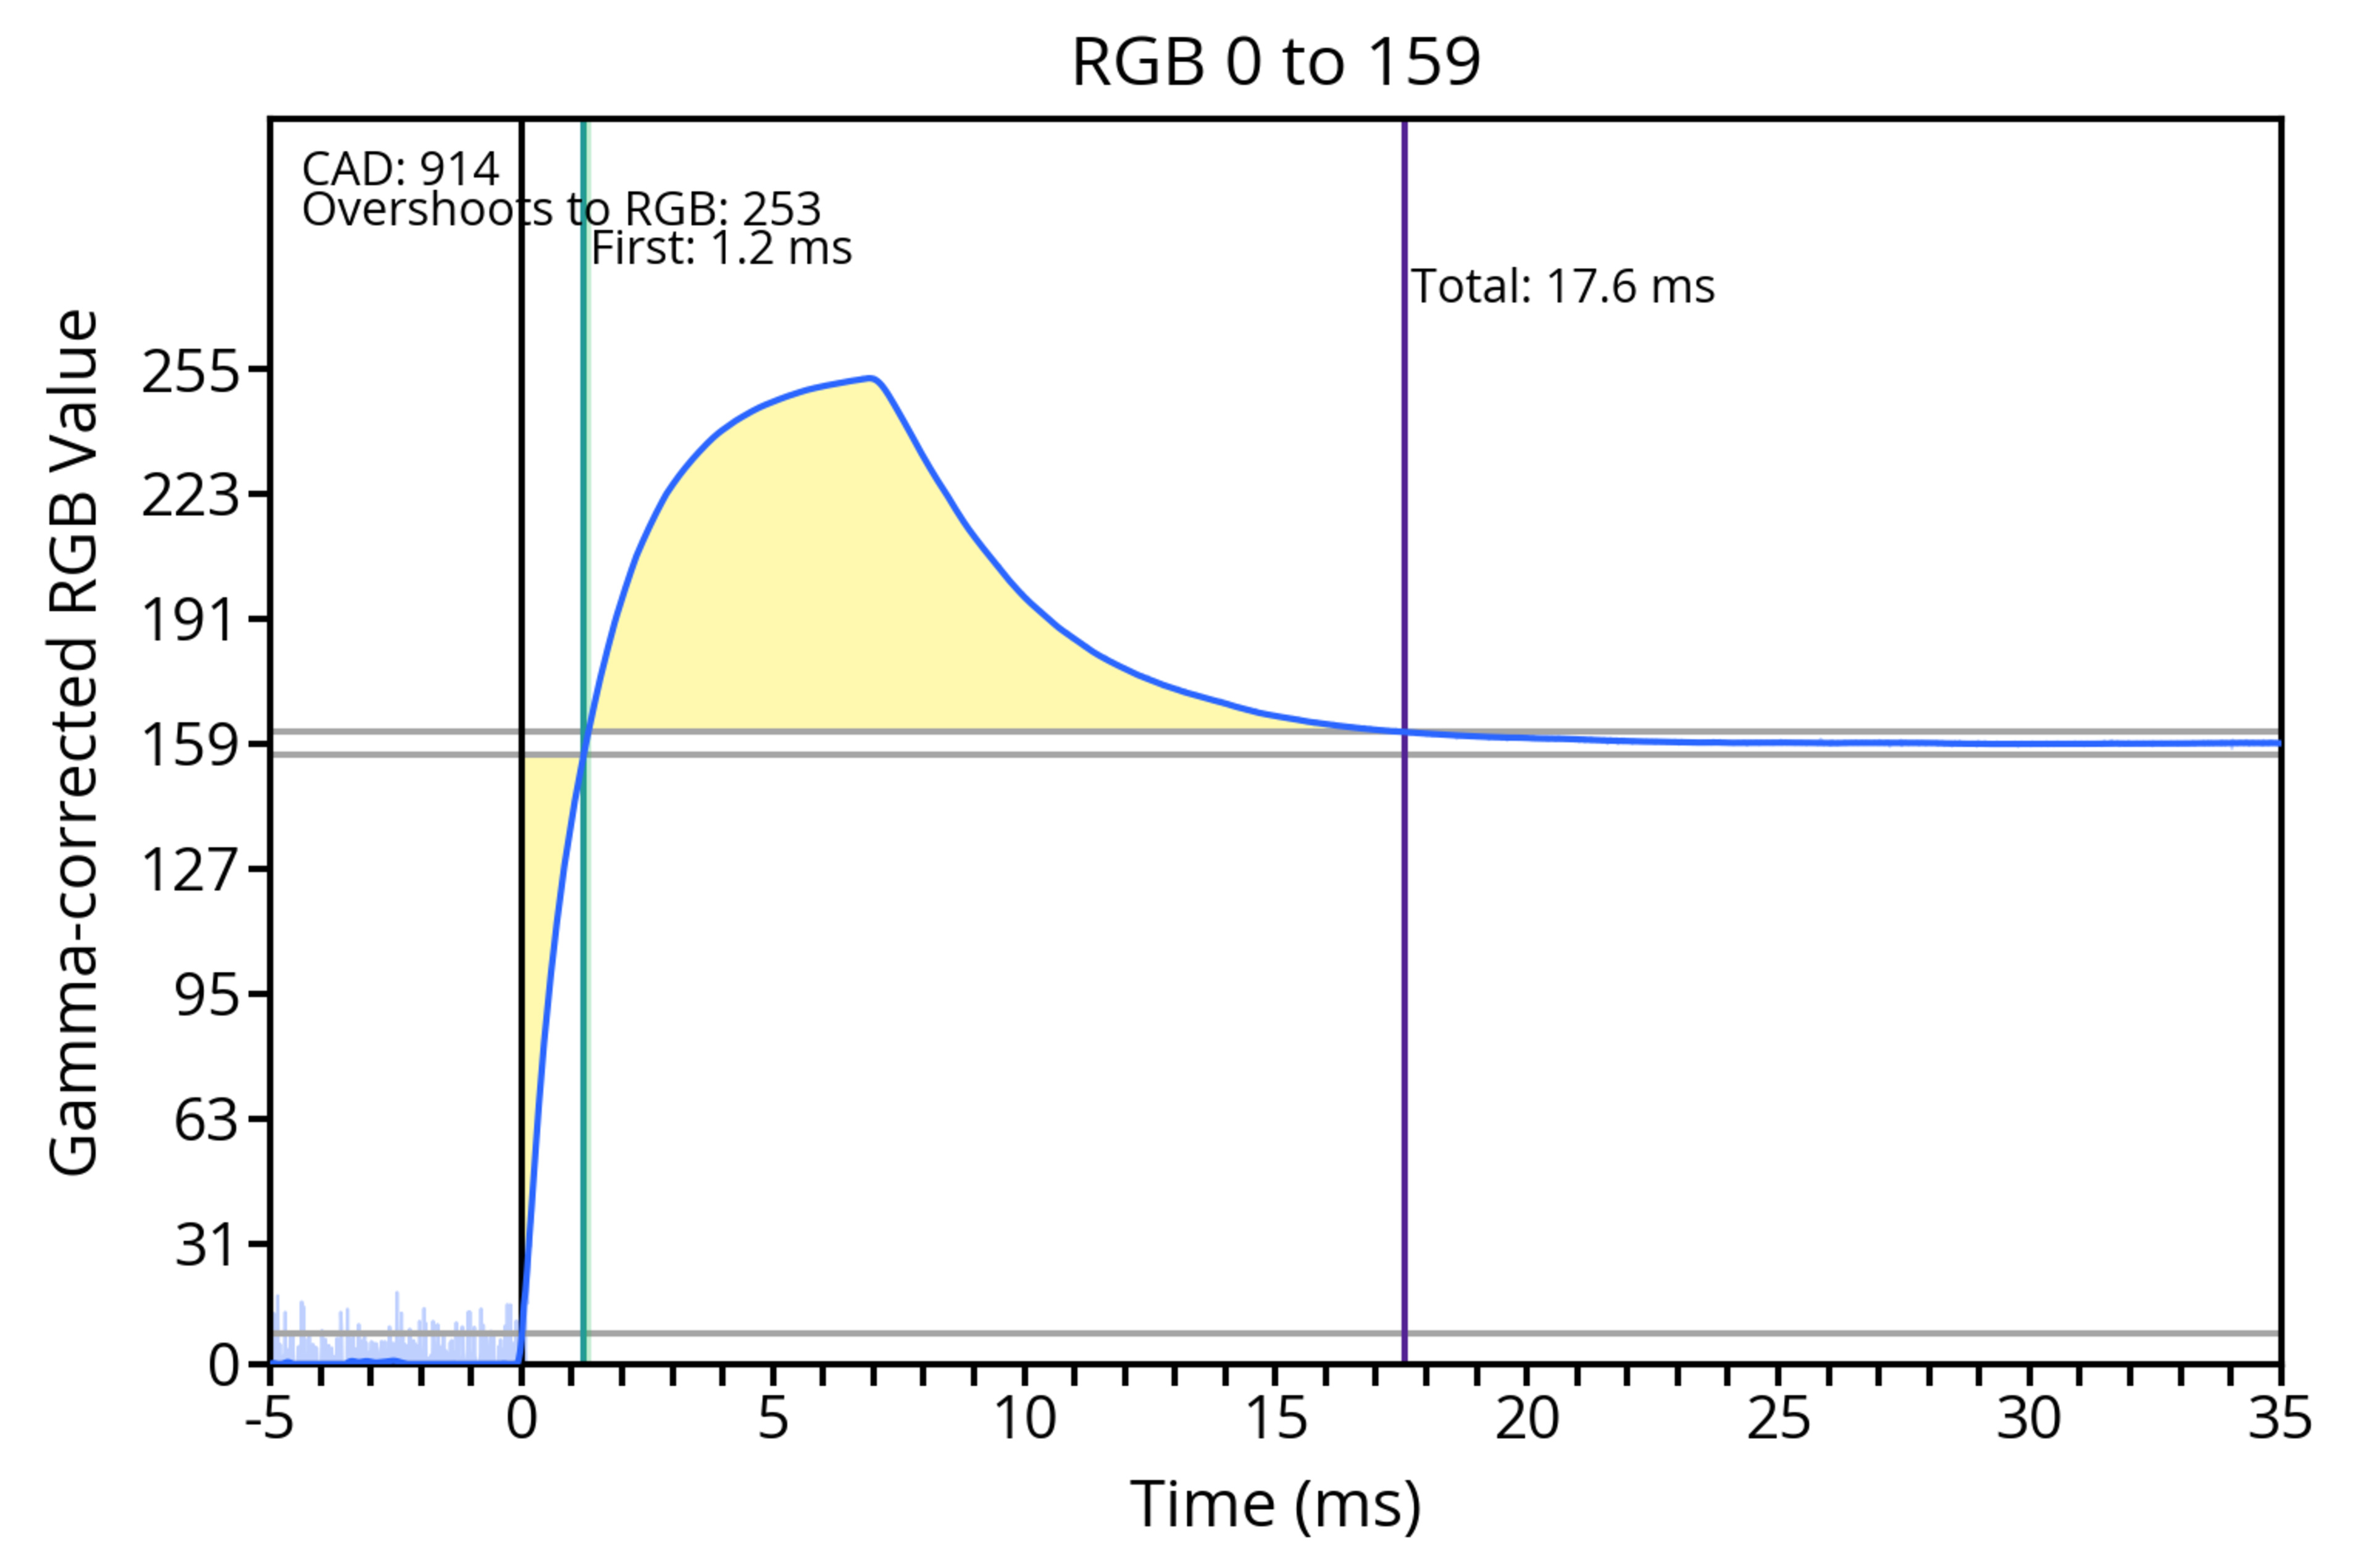
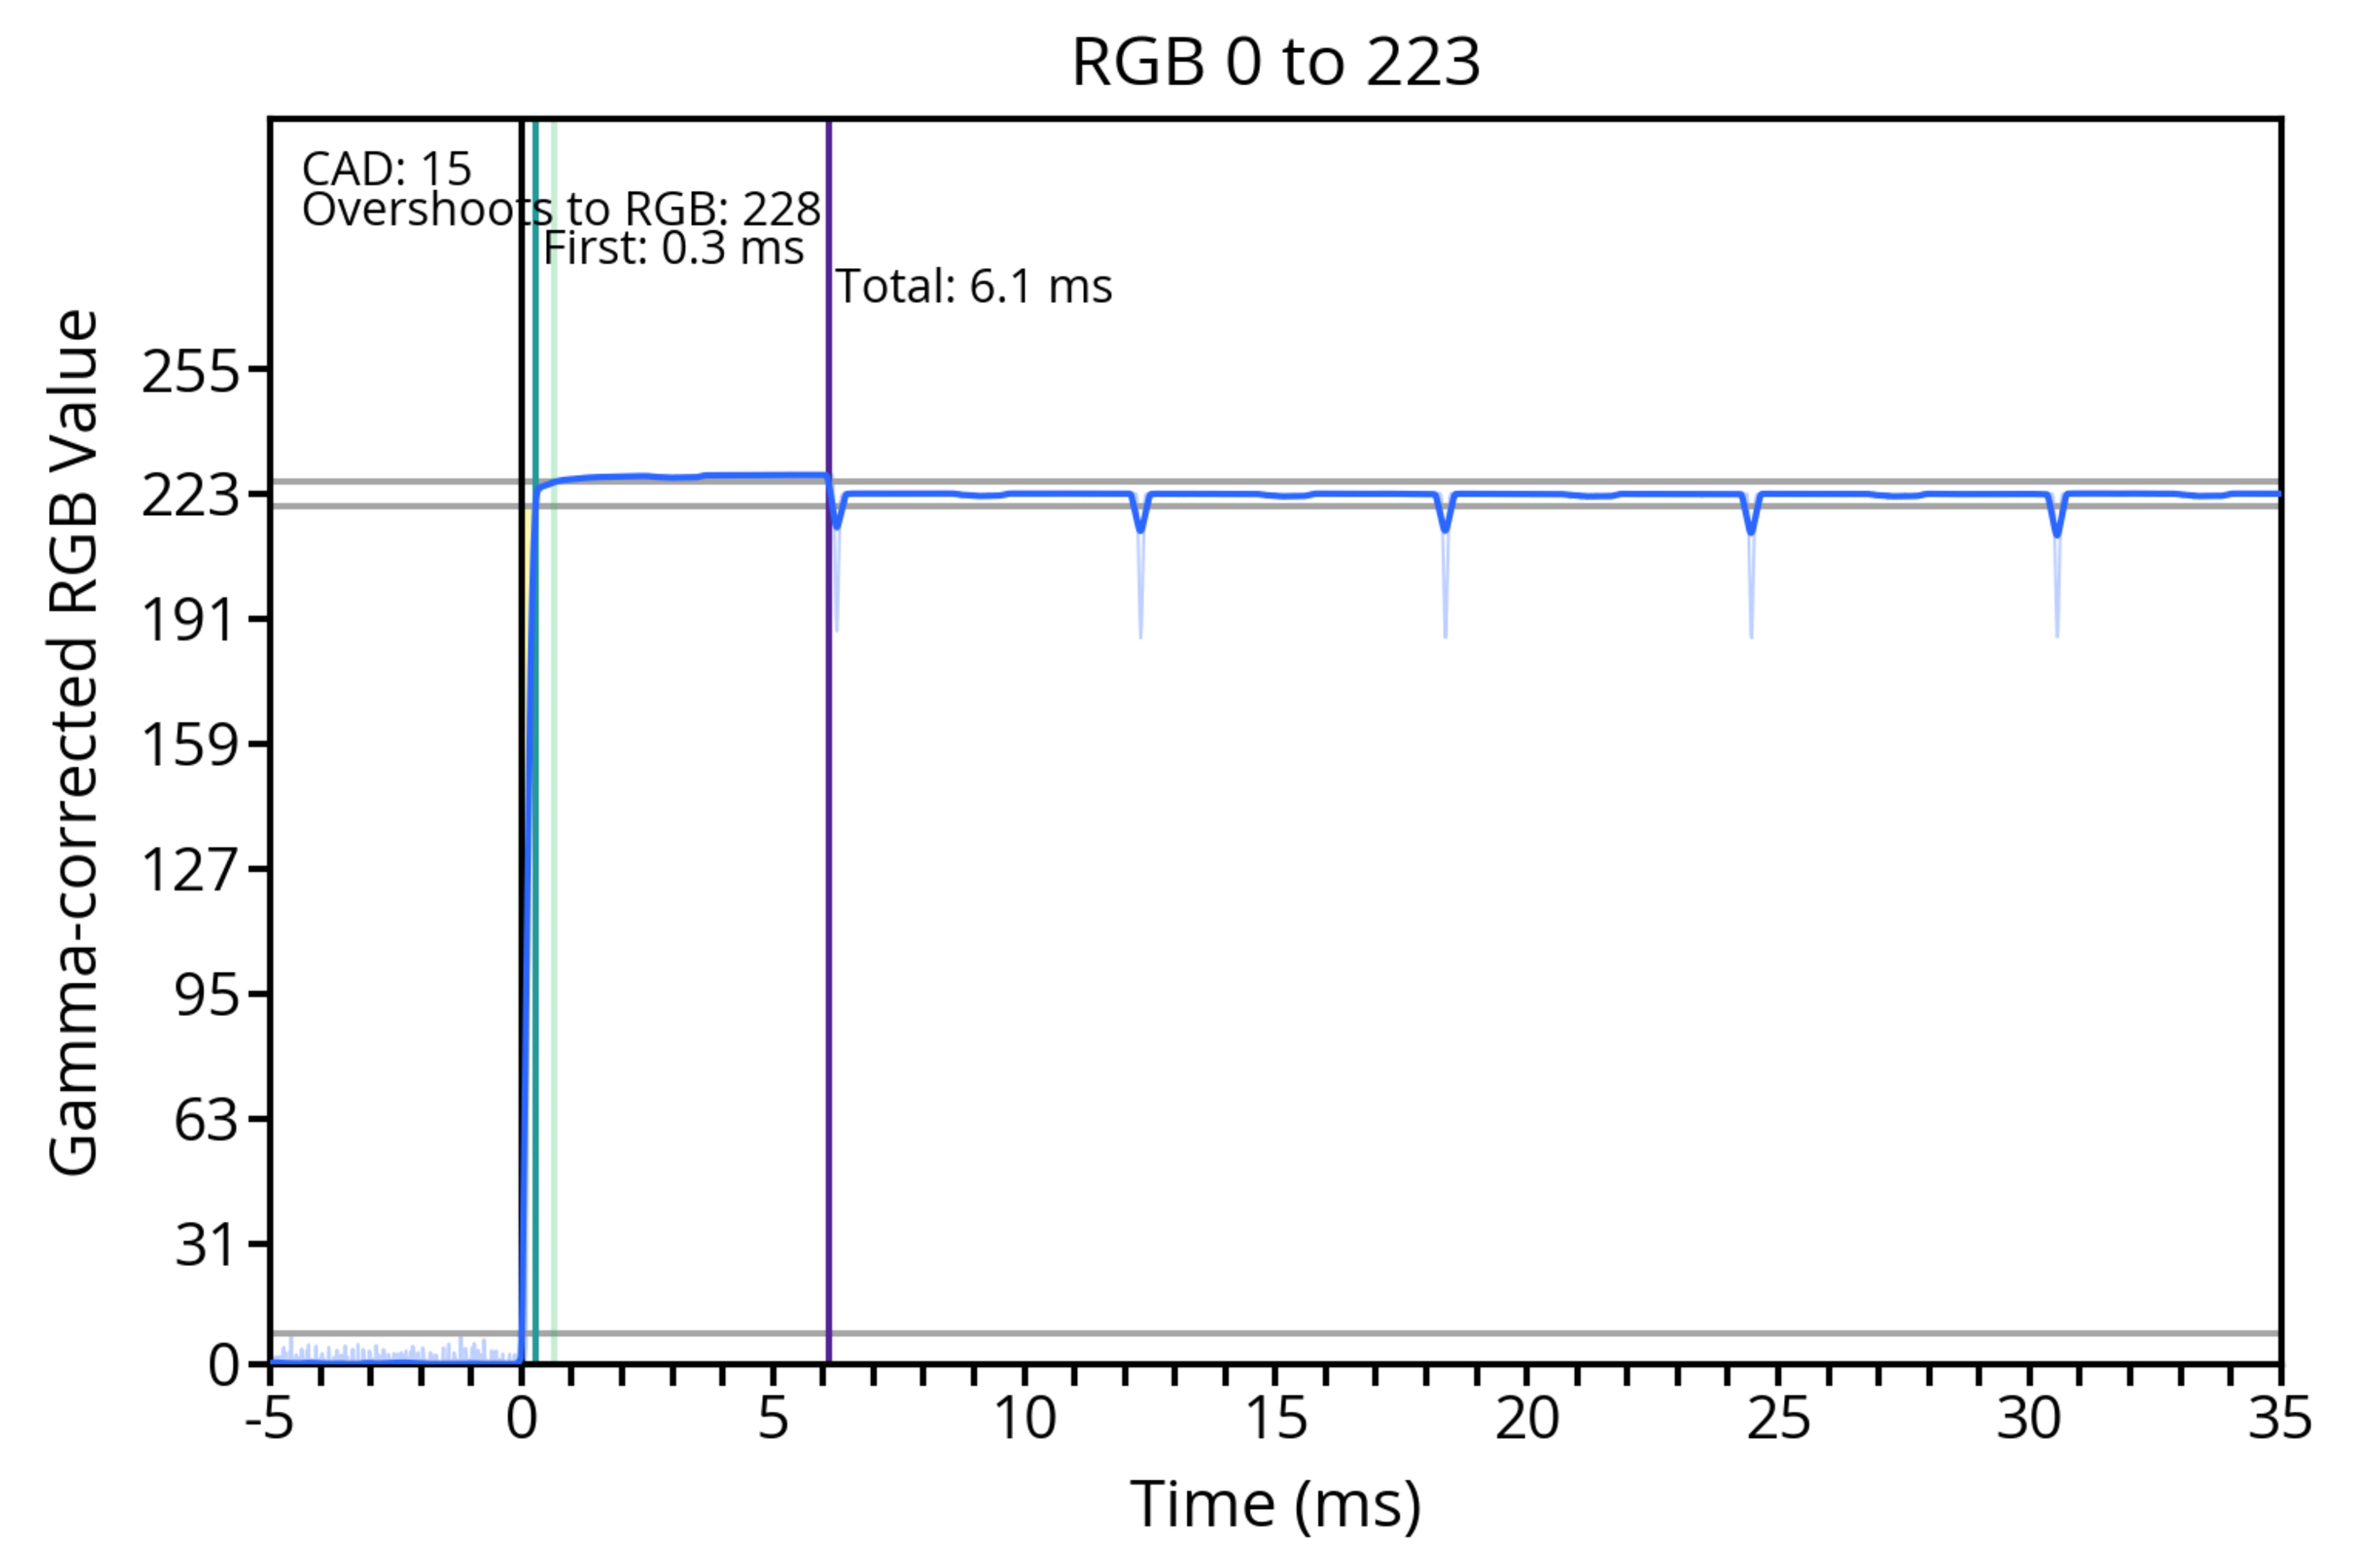
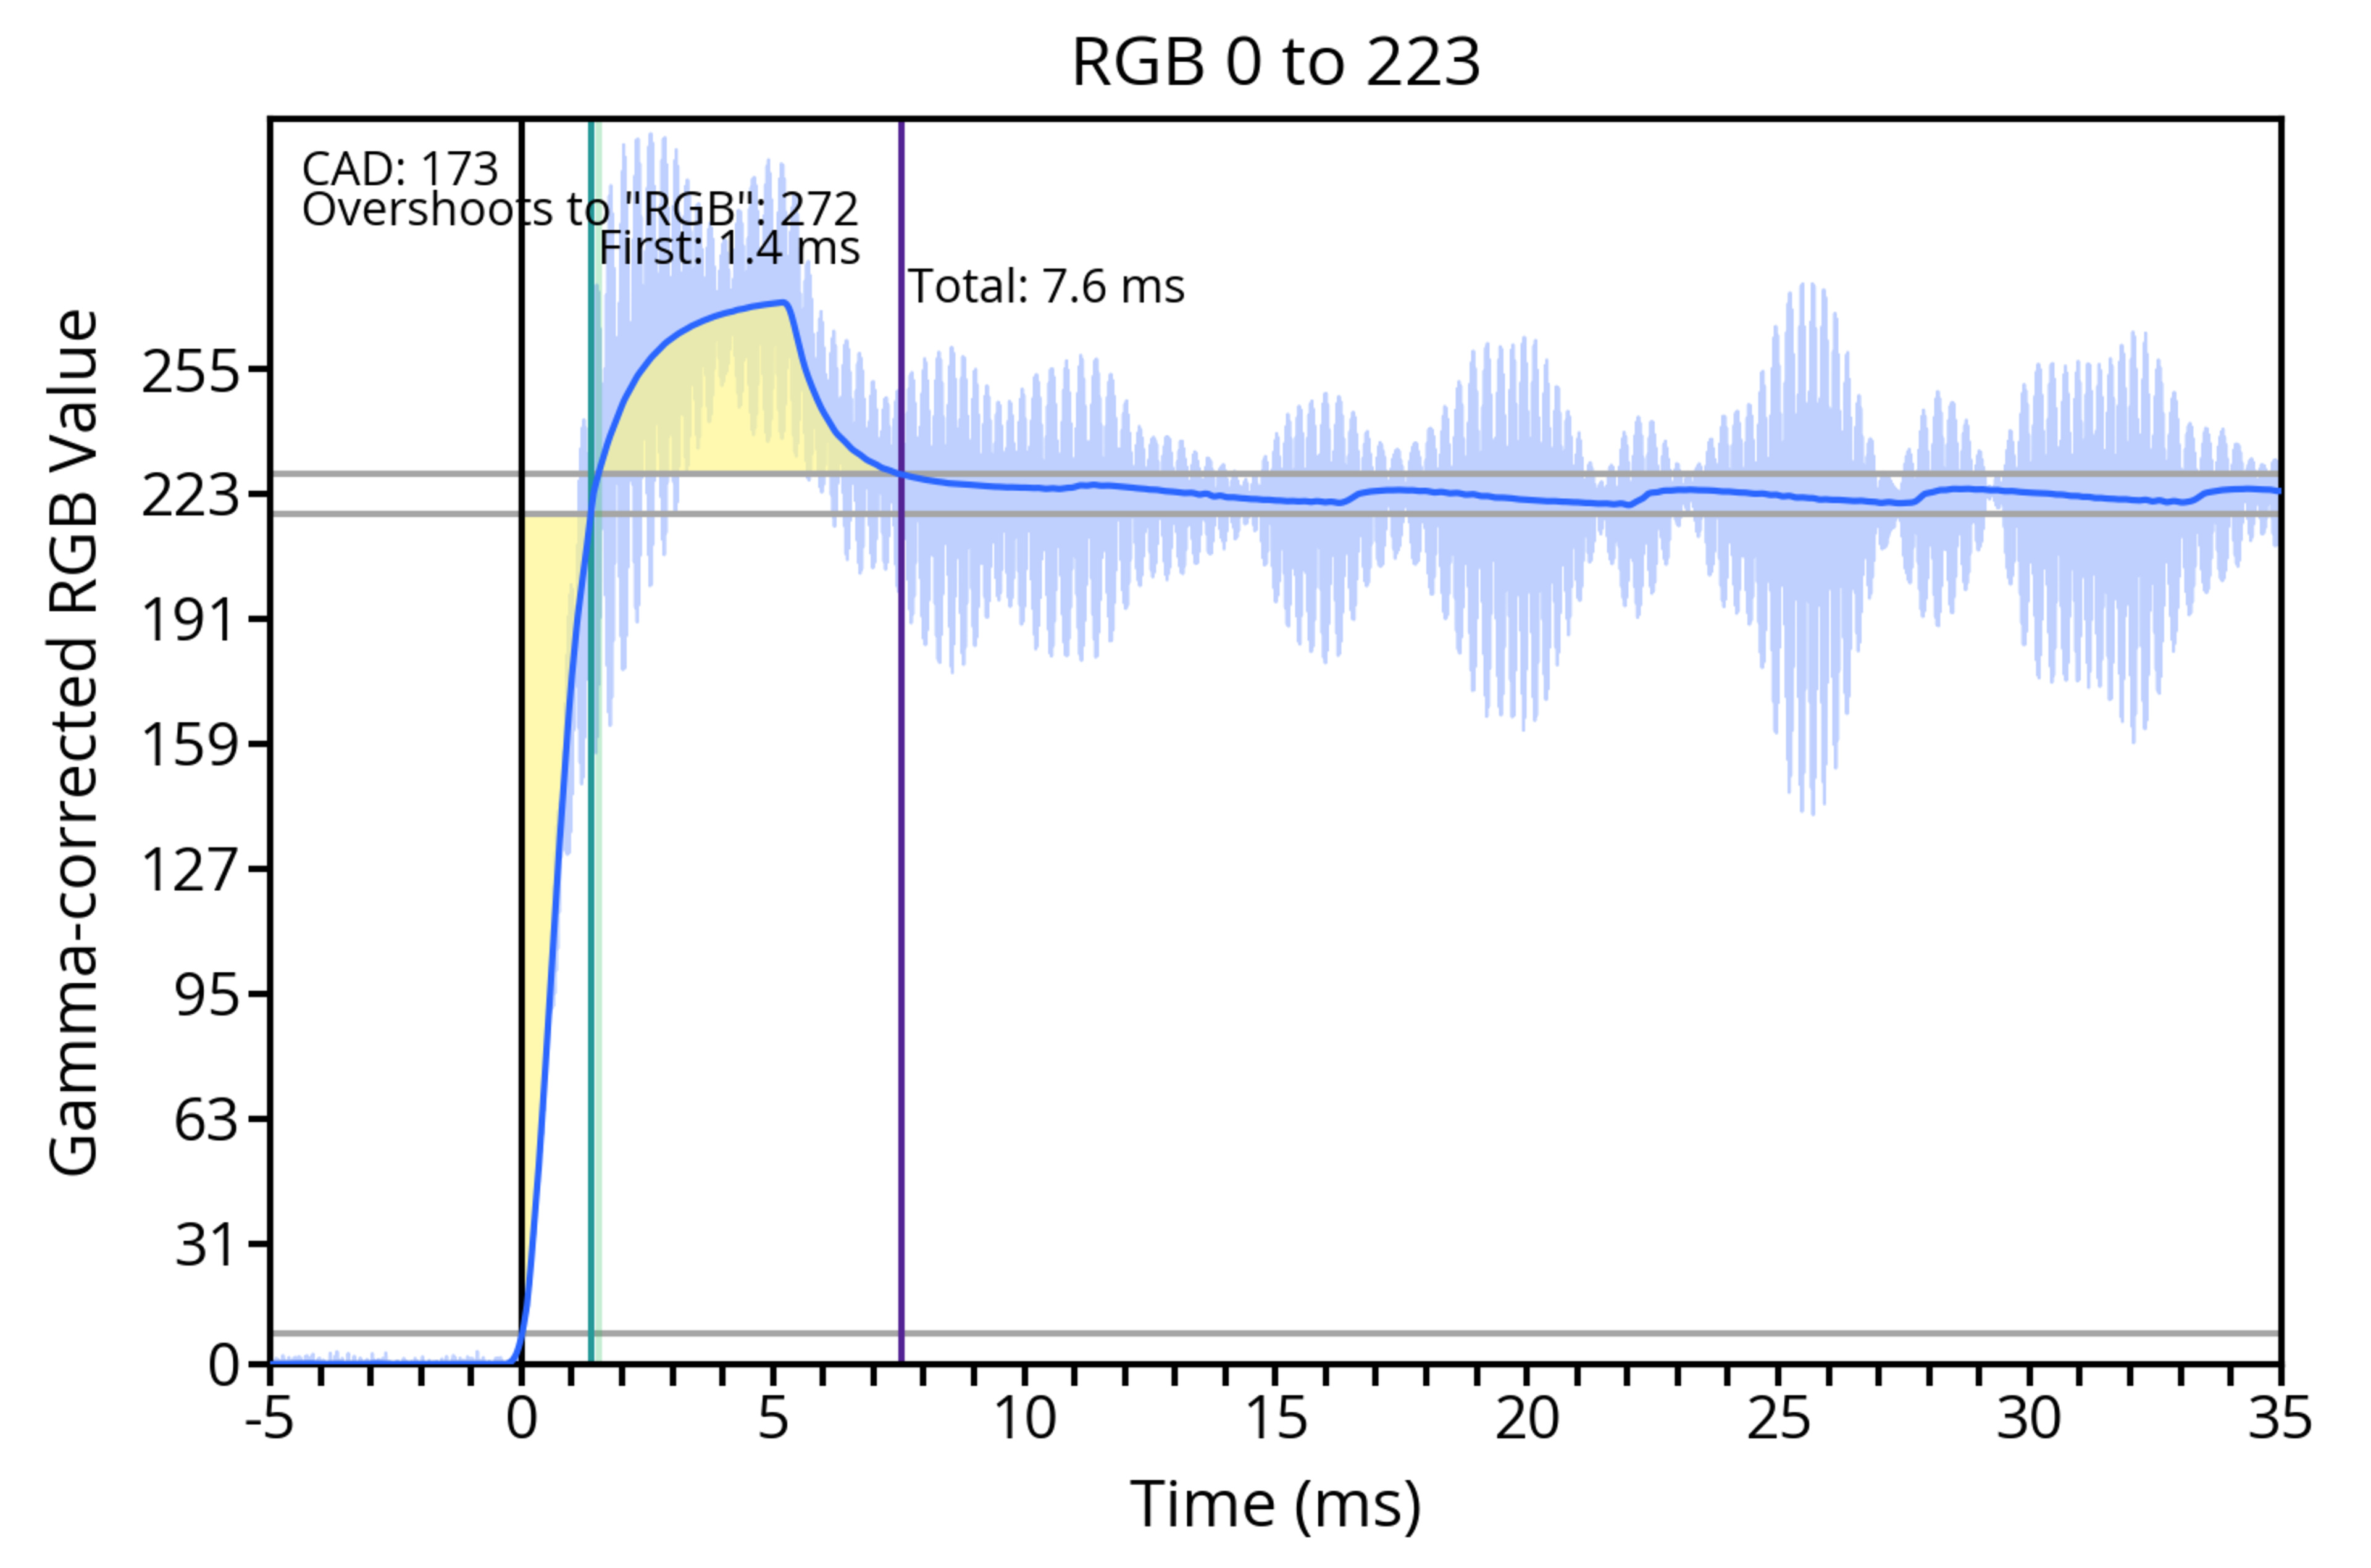
Cumulative Absolute Deviation (CAD) is a single value encompassing total response time and overshoot for each measured transition. In simple terms, it defines how much a pixel color is away from an ideal state and, in turn, how much motion blur there is. In an ideal transition, the pixels change colors instantly, which is almost what happens with OLEDs. However, that isn't the case with LED-backlit LCD monitors, as pixels take time to transition.
CAD is a measurement of the area in the response time charts between the pixel's state at a specific time and its ideal value. The area is measured by adding up the deviation at many different points, and as a visual representation, this is the yellow area highlighted in the chart. There's no actual unit associated with it, but this number is at least comparable between each monitor we've tested. The higher the CAD, the worse the motion is.
The response time charts below show what it looks like for an OLED (on the left) and an LCD monitor (on the right). As OLEDs have a near-instantaneous response time, CAD is nearly perfect, although it's impossible to have a CAD of 0. The example on the right has more CAD. Because of the 3 RGB tolerance we have, which is represented by the gray horizontal lines, CAD is measured up to those lines, and anything in between is acceptable.
 |
 |
CAD is measured at each refresh rate that we test for, which is the monitor's max refresh rate, 120Hz, and 60Hz. We also include measurements for:
- Average CAD: This is the average CAD of all measured transitions.
- Best 10% CAD: Average CAD of 10% of the best transitions.
- Worst 10% CAD: Average CAD of 10% of the worst transitions.
Although it's easy to get caught up in all the data between first response time, total response time, and overshoot, CAD is one single number that helps define how much motion blur there is. If you're interested in more data, you can also use the drop-down menu in the review to see the individual charts for all 72 transitions, with each overdrive setting for every refresh rate.
KOORUI S2741LM
Recommended Overdrive Setting
As we test CAD with the various overdrive settings that a monitor may have, we also have data for what the best overdrive setting is. Most of the time, we recommend the overdrive setting with the lowest CAD. Sometimes, we may recommend an overdrive setting with slightly higher CAD if it has less inverse ghosting. We include the recommended overdrive setting at each refresh rate, even if the setting is different between refresh rates. In cases where a monitor doesn't allow VRR at the same time as the overdrive settings, we'll evaluate whether the CAD is better with VRR or with one of the settings.
It's also important to remember that these are just recommended settings. If you prefer one setting over our recommended one, definitely choose the setting you prefer.
VRR Motion Performance
While the CAD results at each tested refresh rate are useful for playing games at fixed refresh rates, it's good to know which overdrive setting performs the best when you play games with VRR enabled and frame rates constantly fluctuate. This is where our test for VRR Motion Performance comes in handy because it identifies which overdrive setting performs the best across the entire refresh rate range.
We plot the average CAD of each overdrive setting over a refresh rate range from 60Hz up until its max refresh rate. With this, you can see which overdrive settings have the lowest CAD and are the most consistent over the refresh rate range. With the plot below, the recommended setting is 'Medium' because CAD is consistently close to 100 across the refresh rate range.
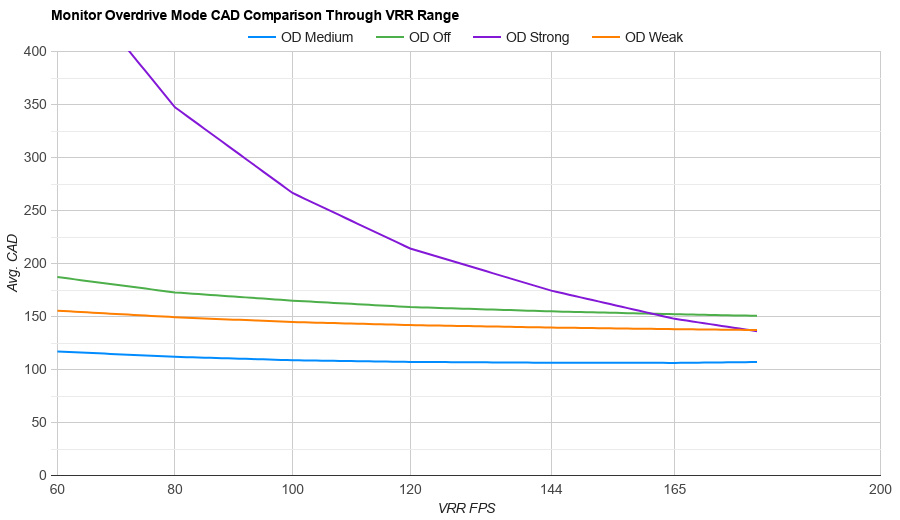
As this test focuses on the recommended overdrive setting with VRR enabled, it's important to remember that not all monitors have overdrive settings that you can change with VRR enabled. In that case, we only plot the graph for CAD with VRR enabled.
Pursuit Pattern
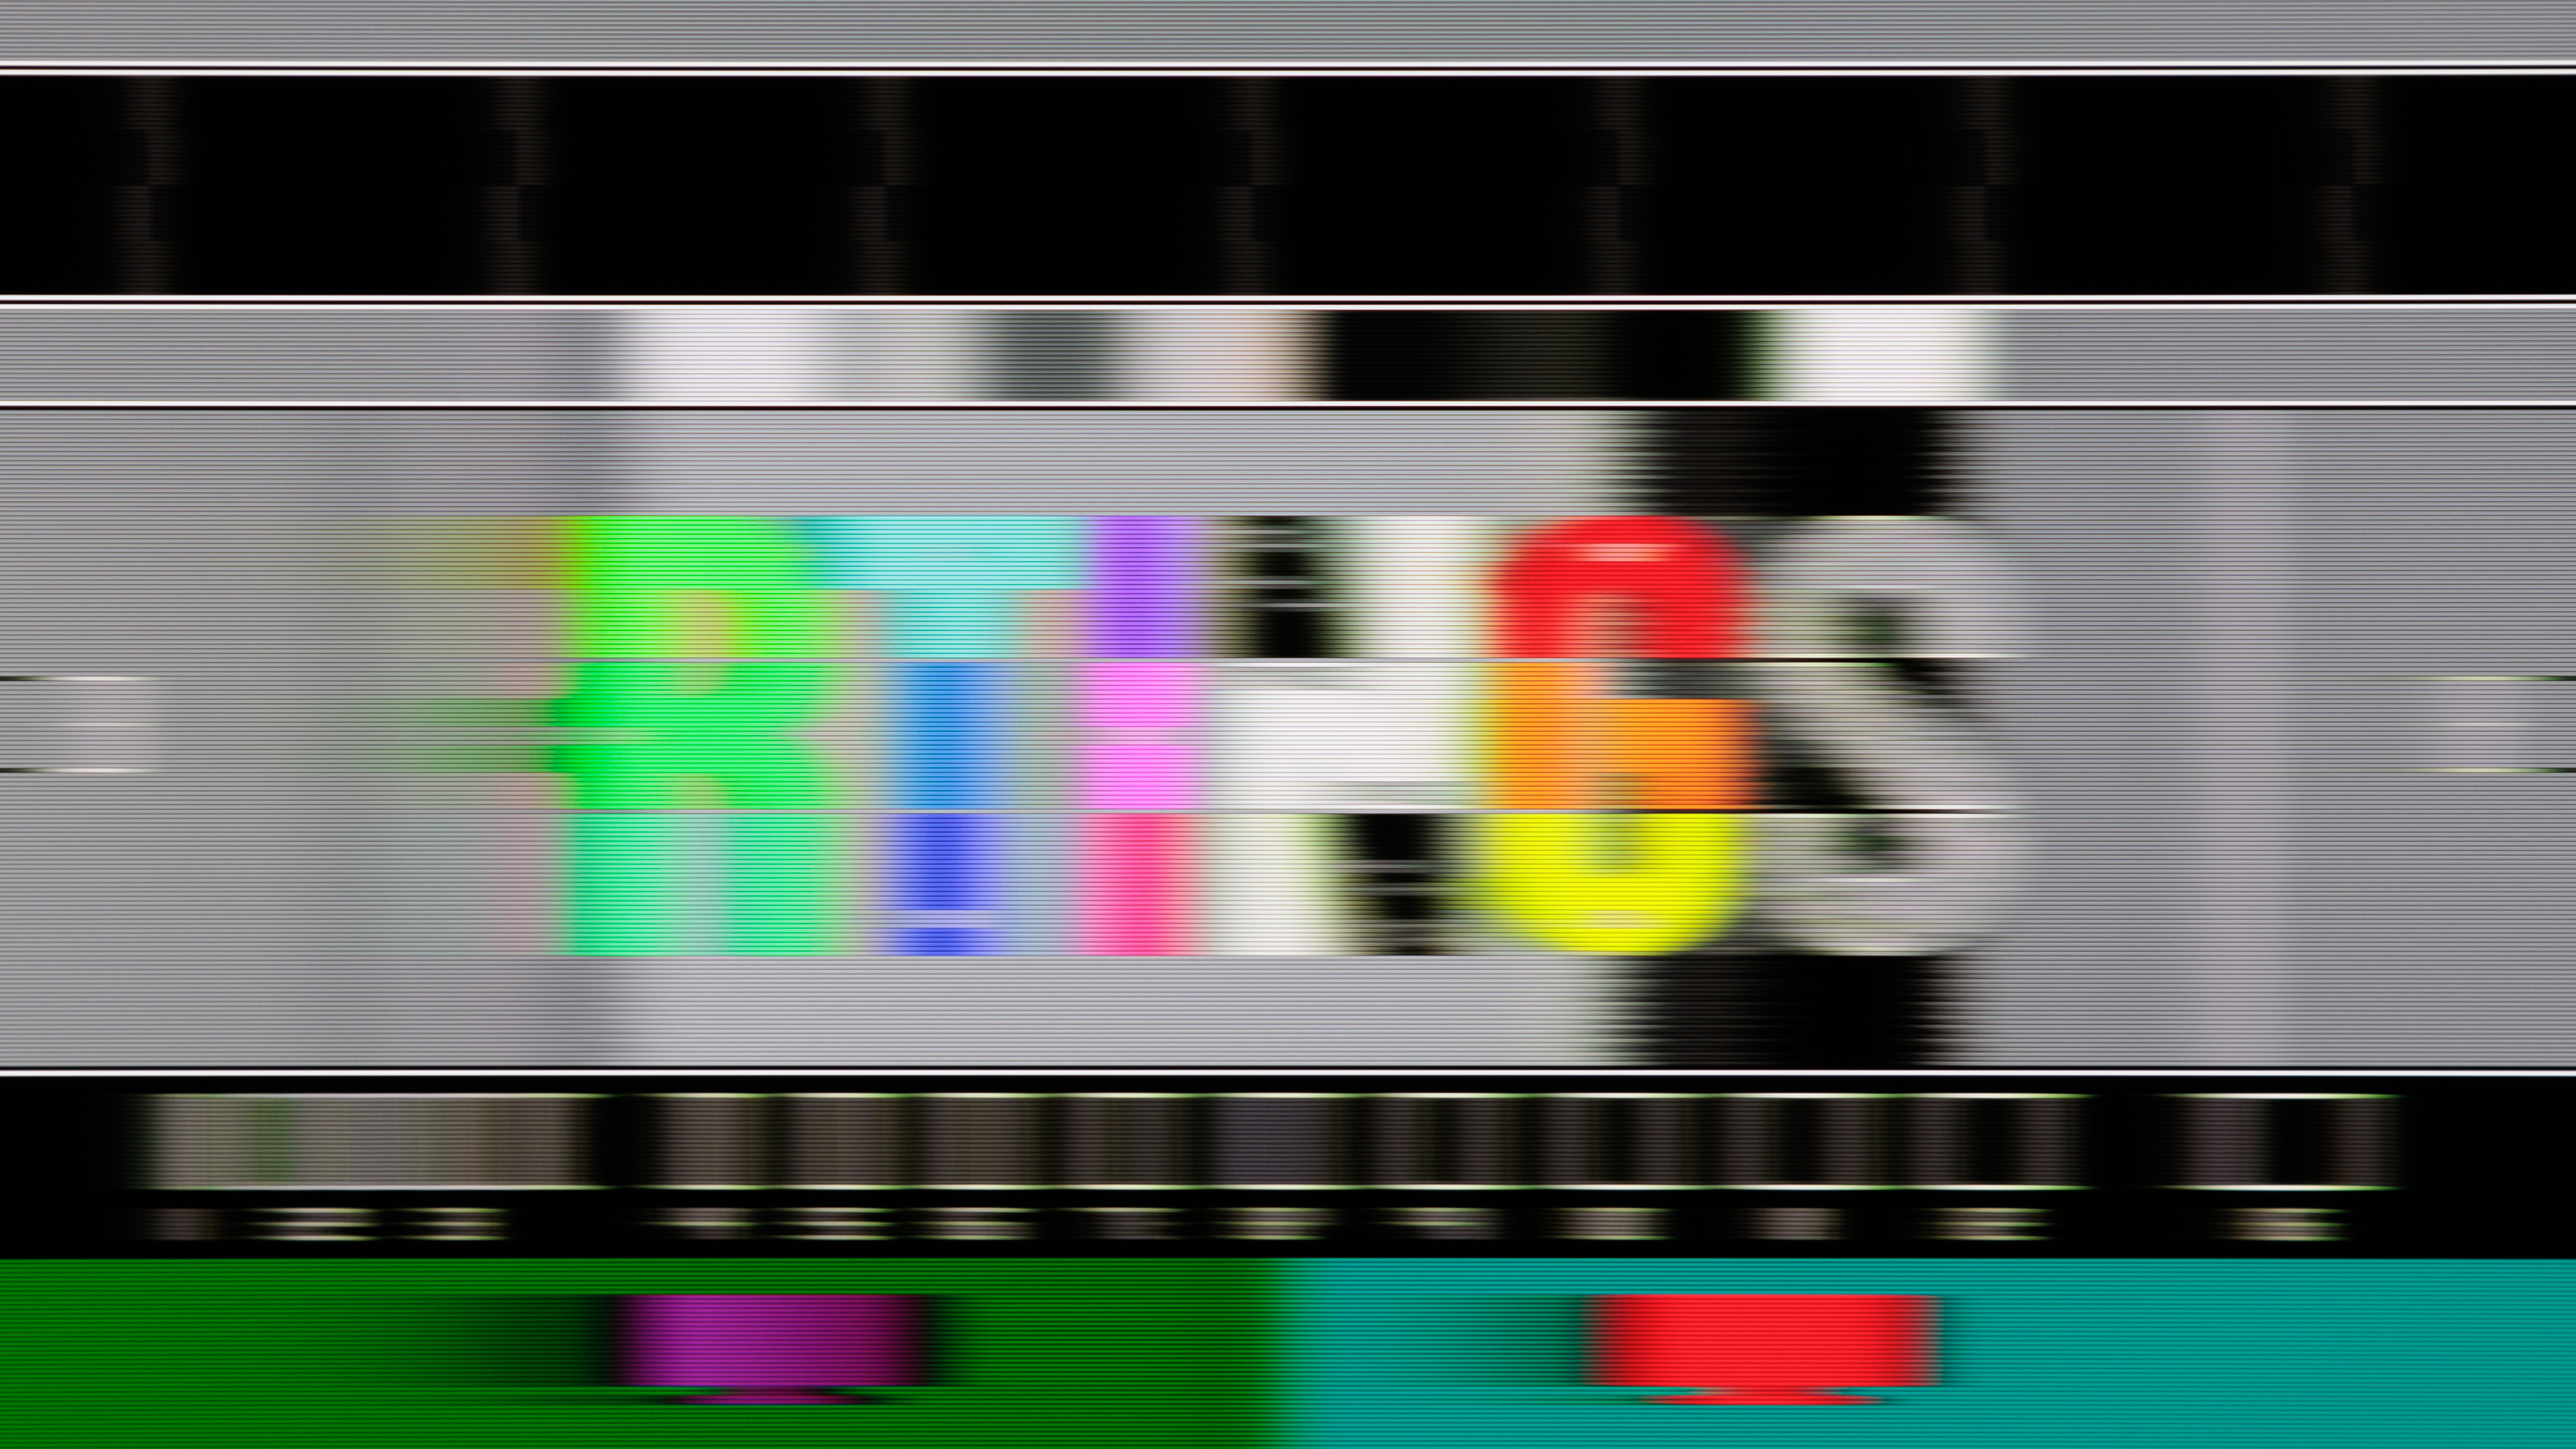
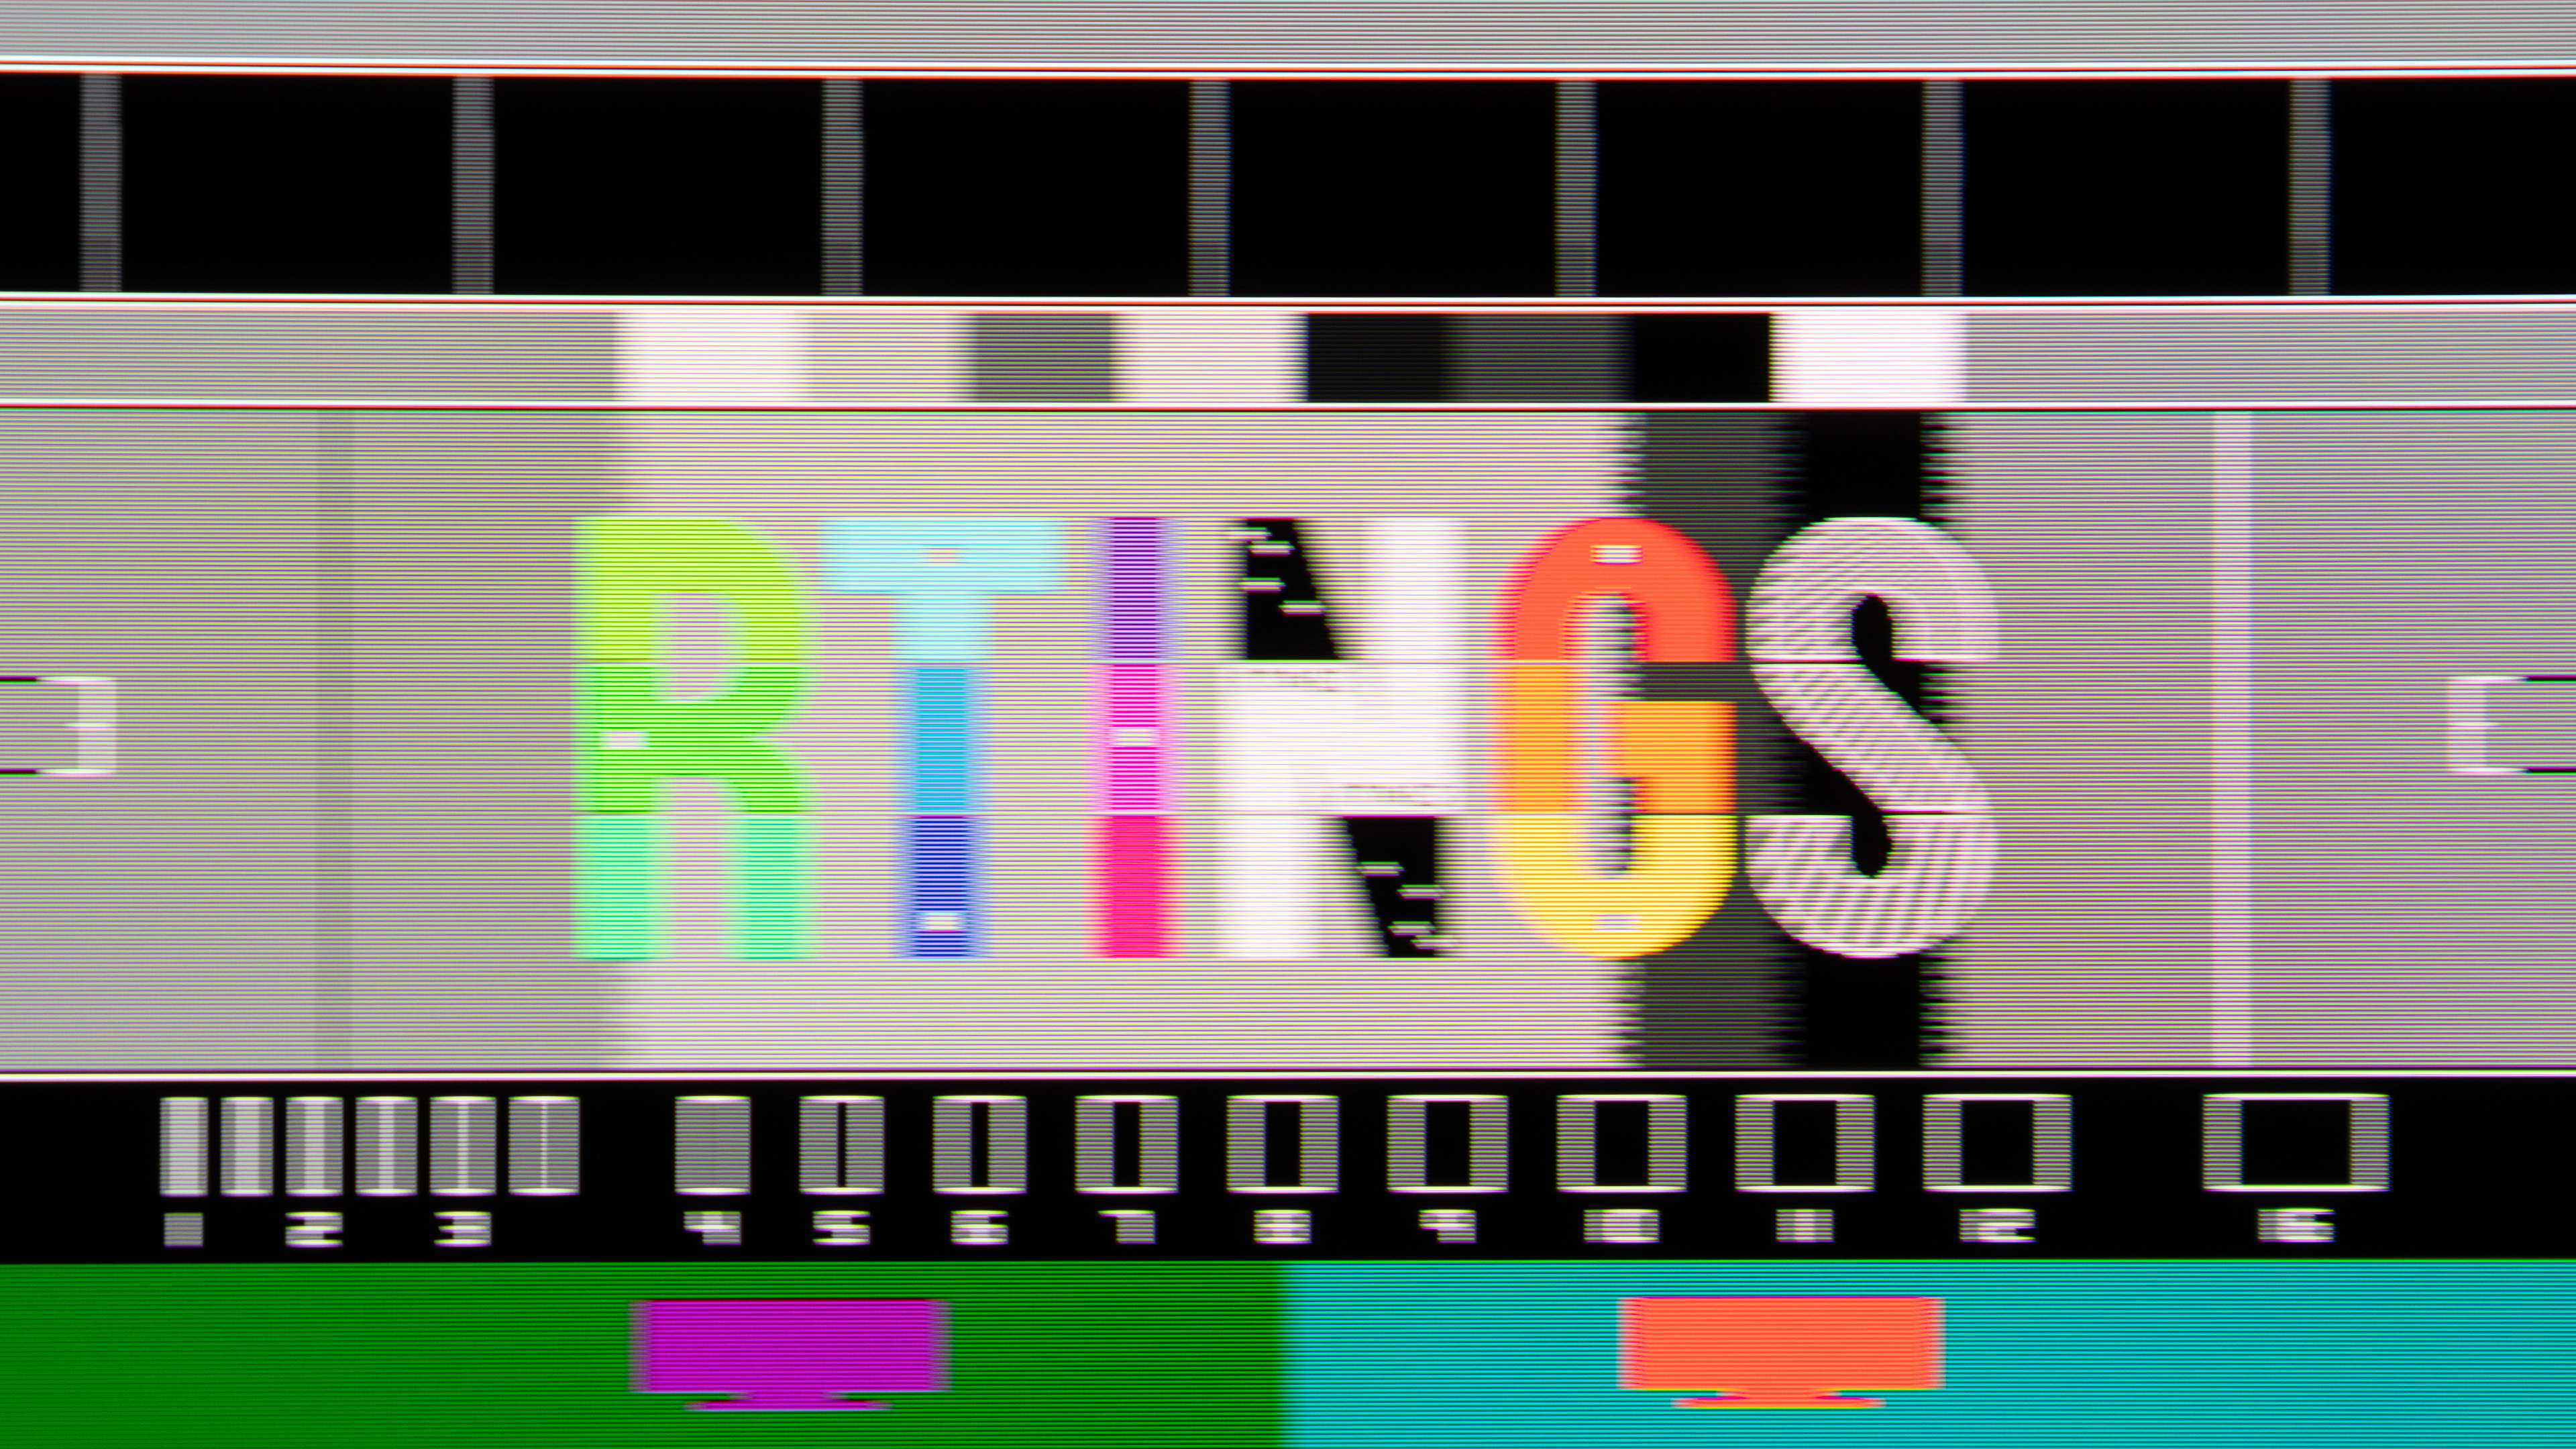
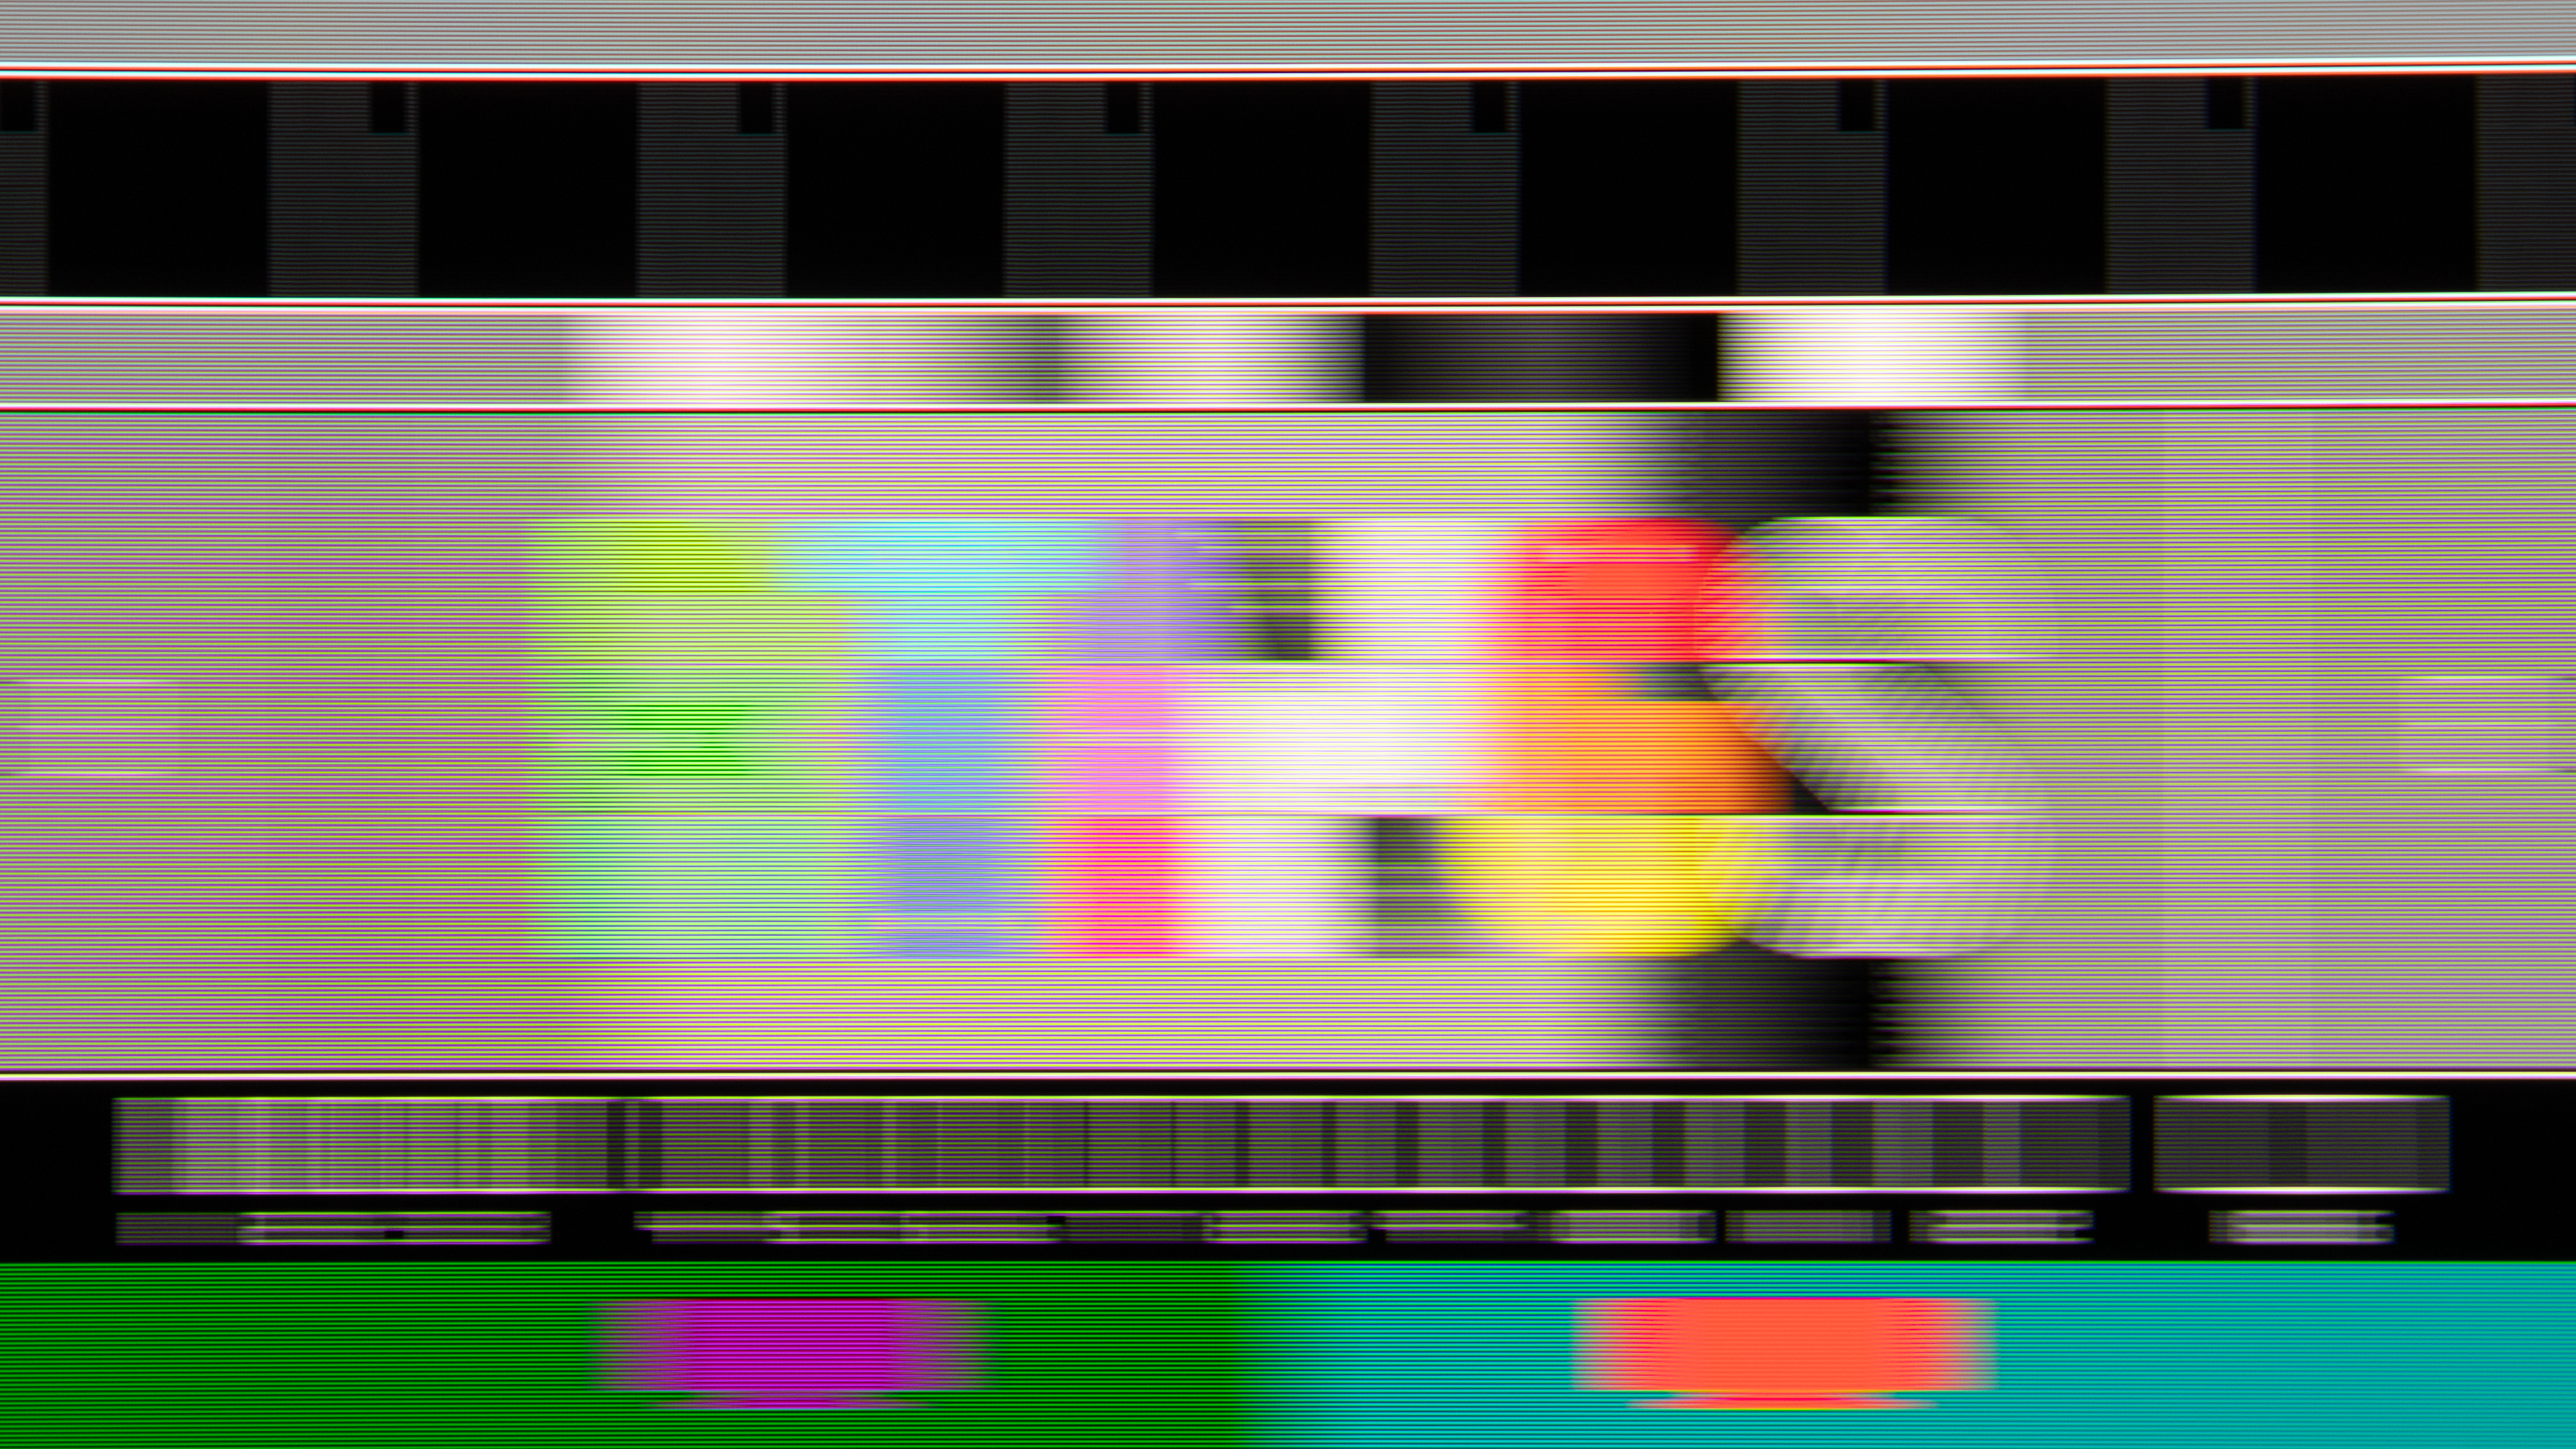
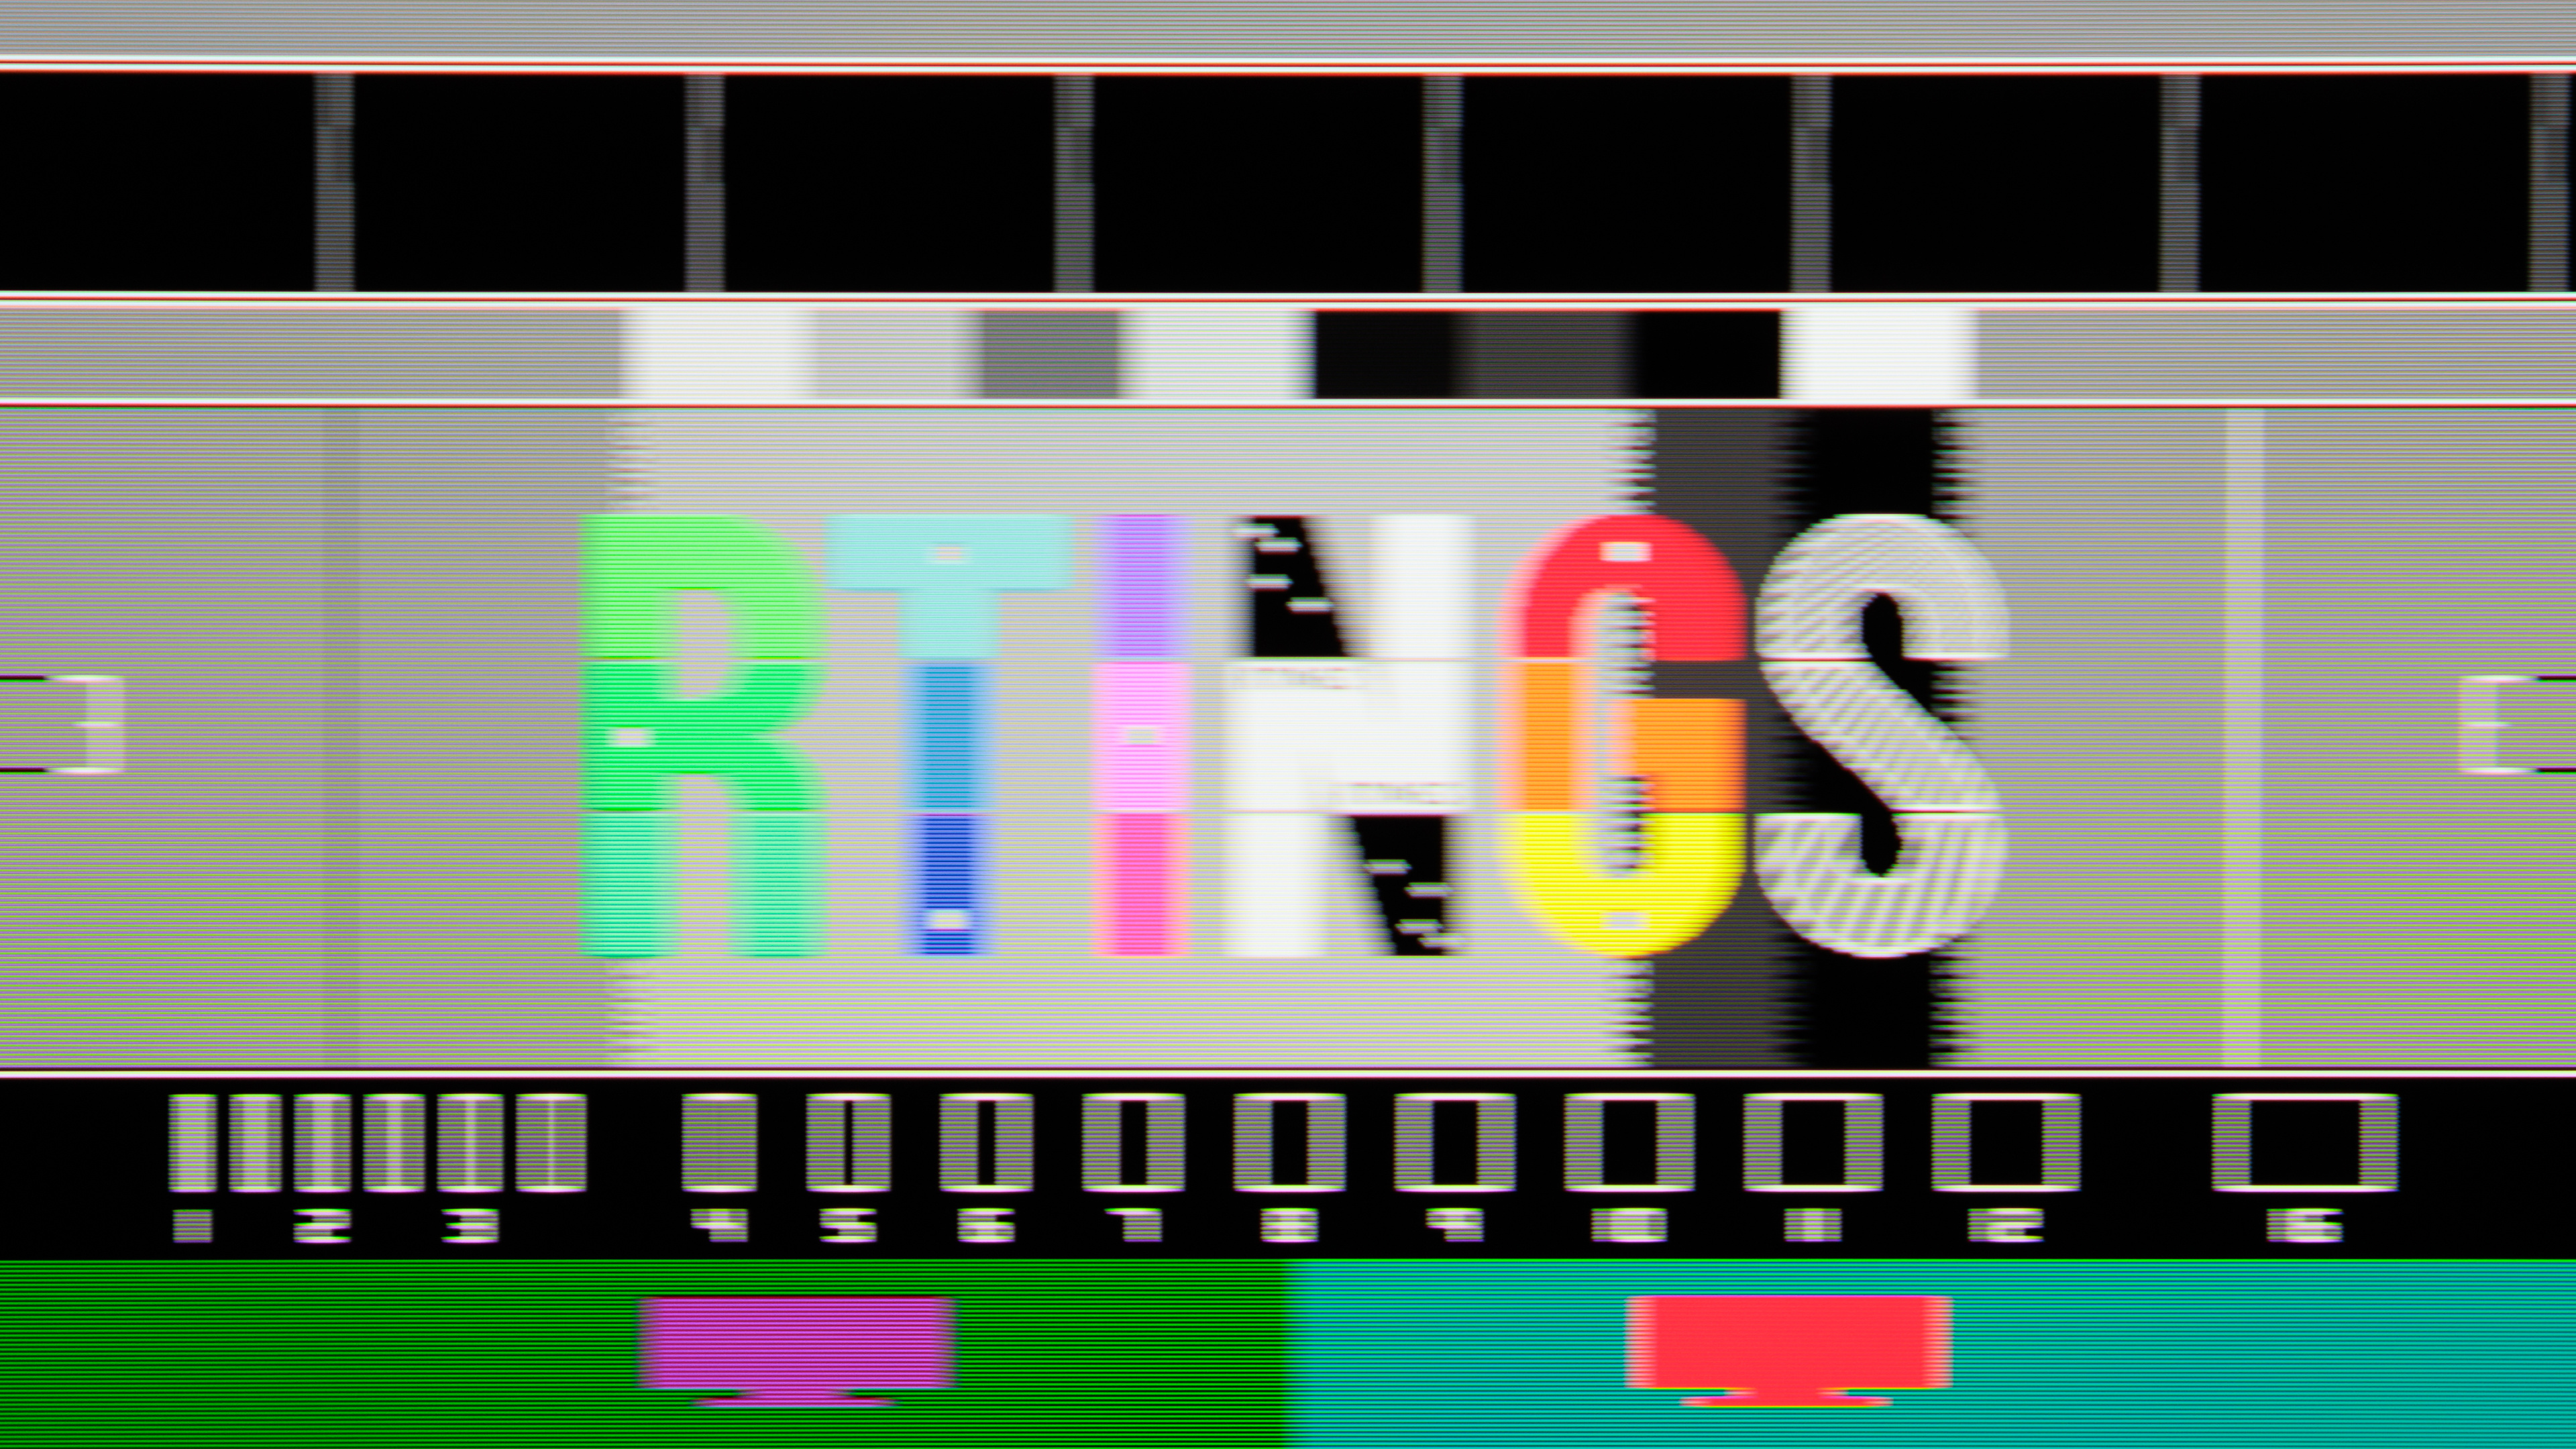
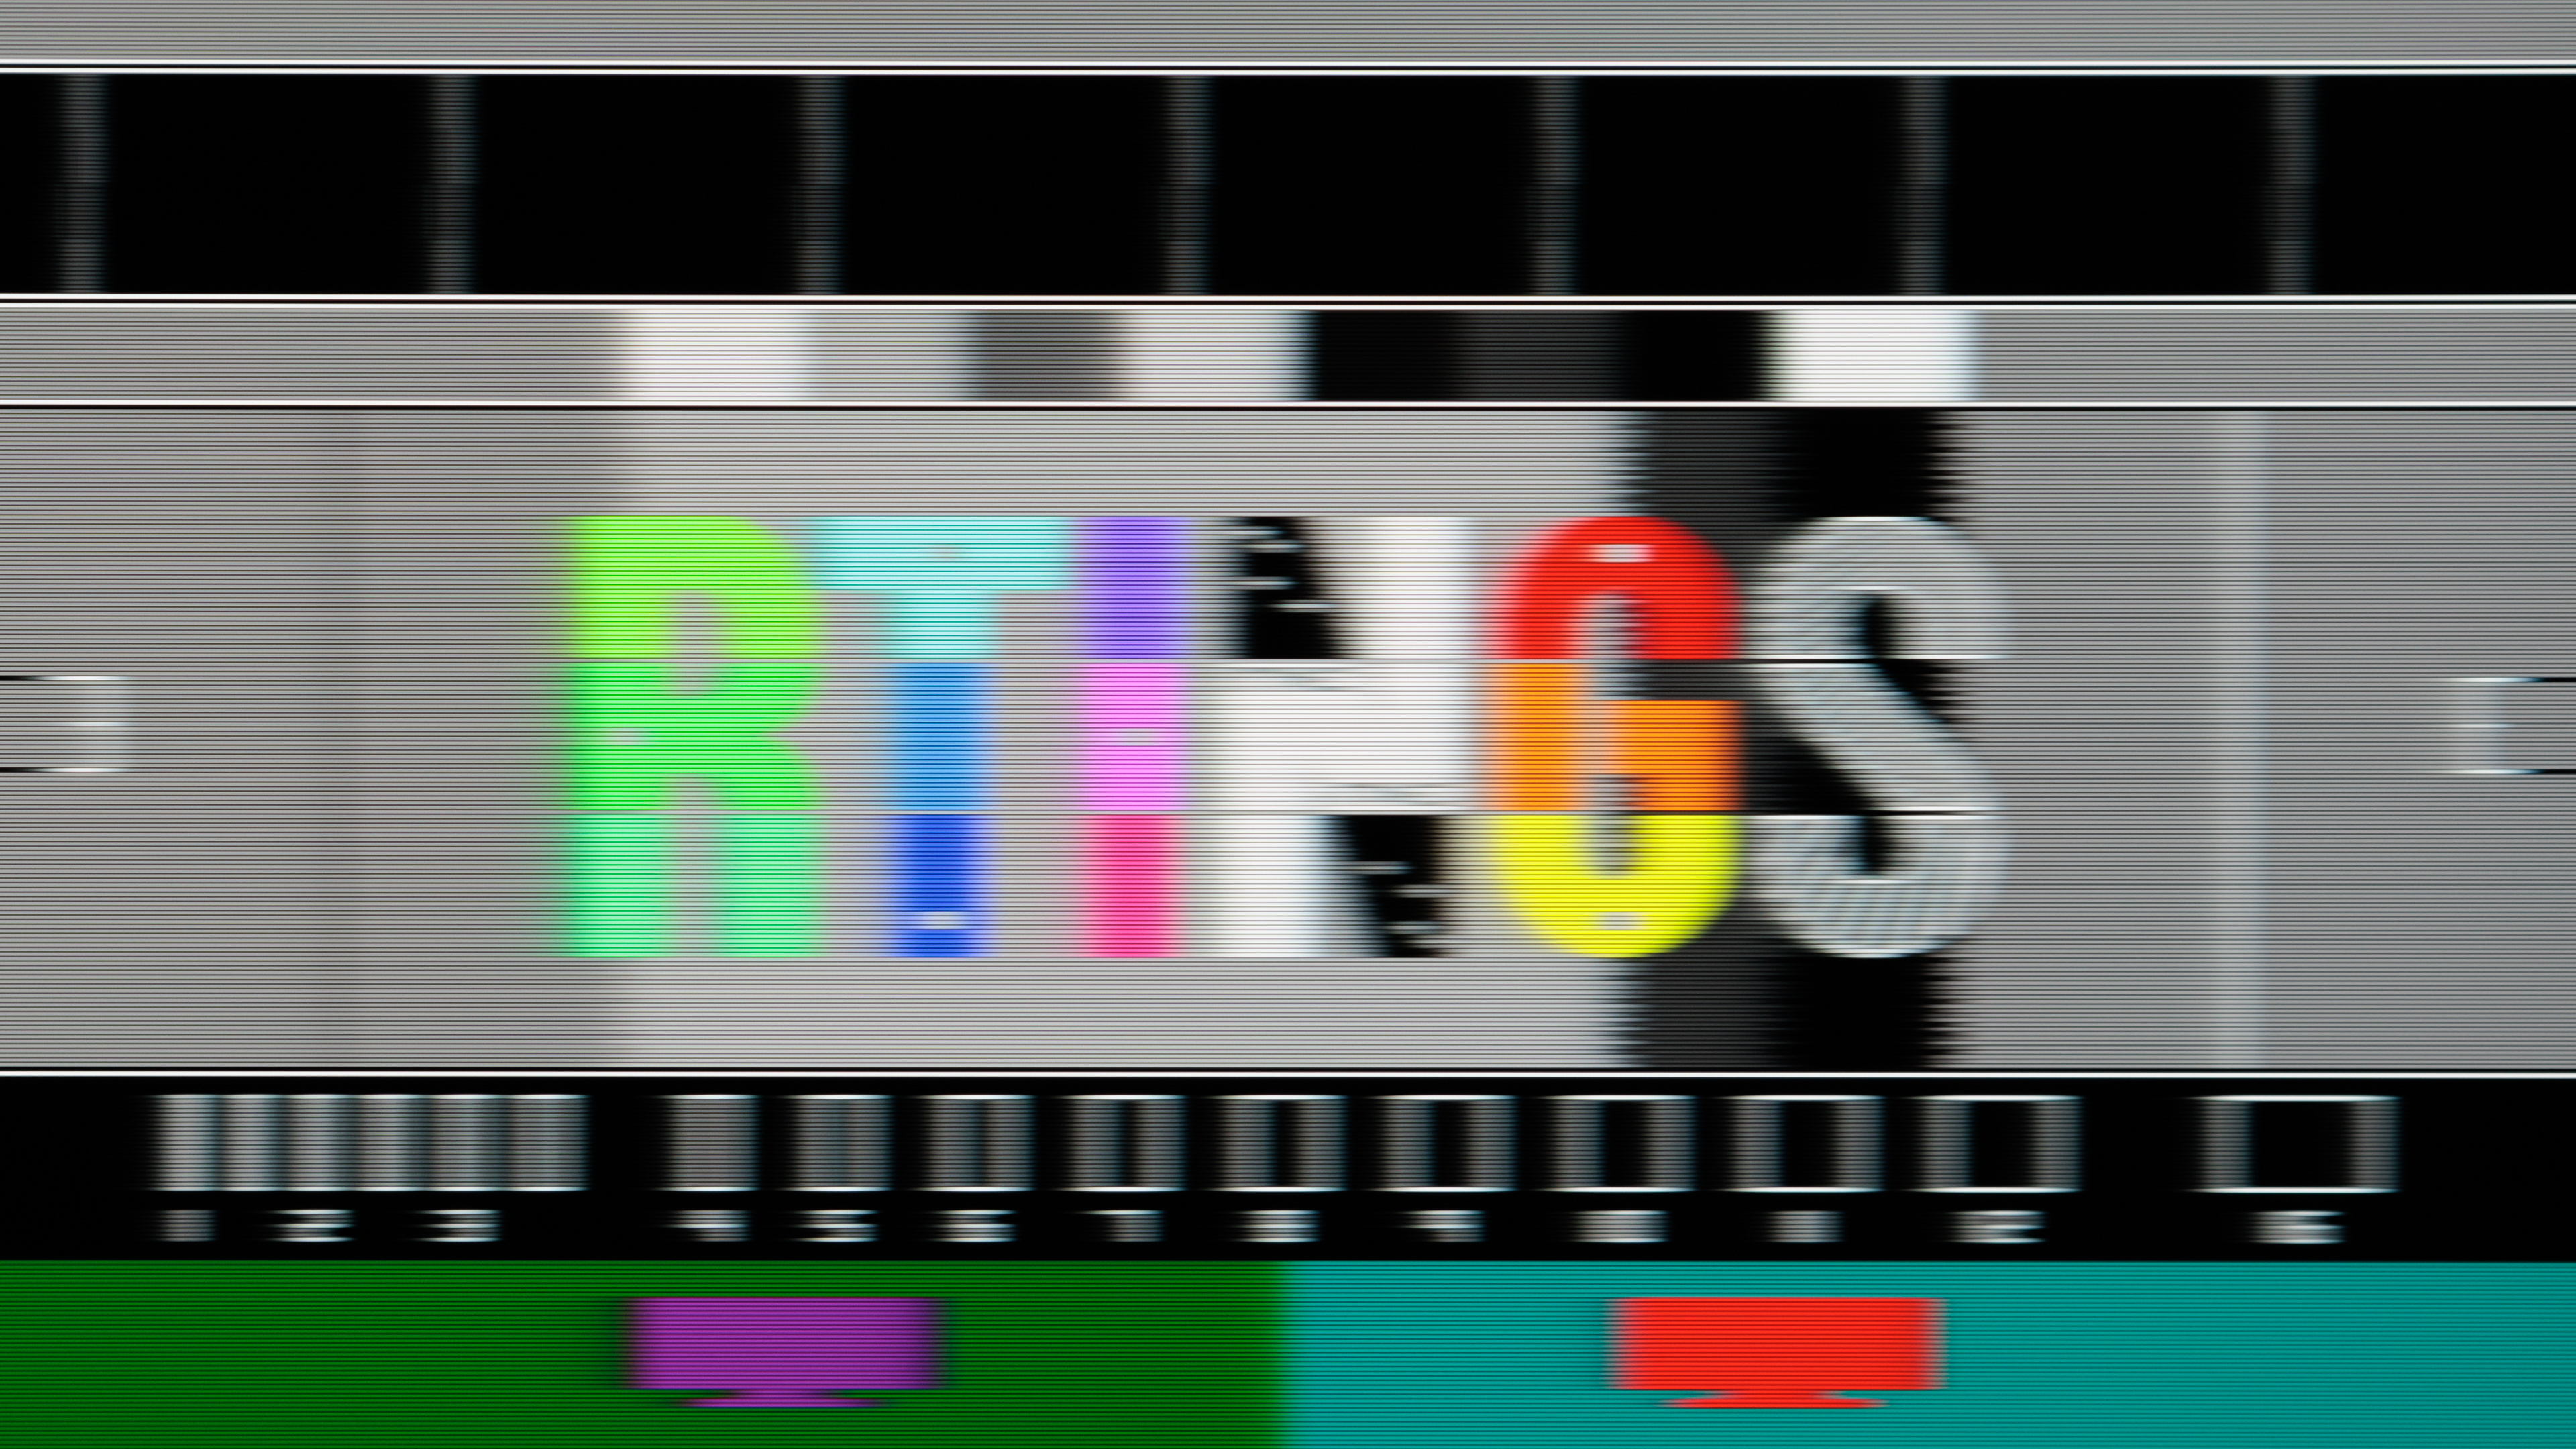
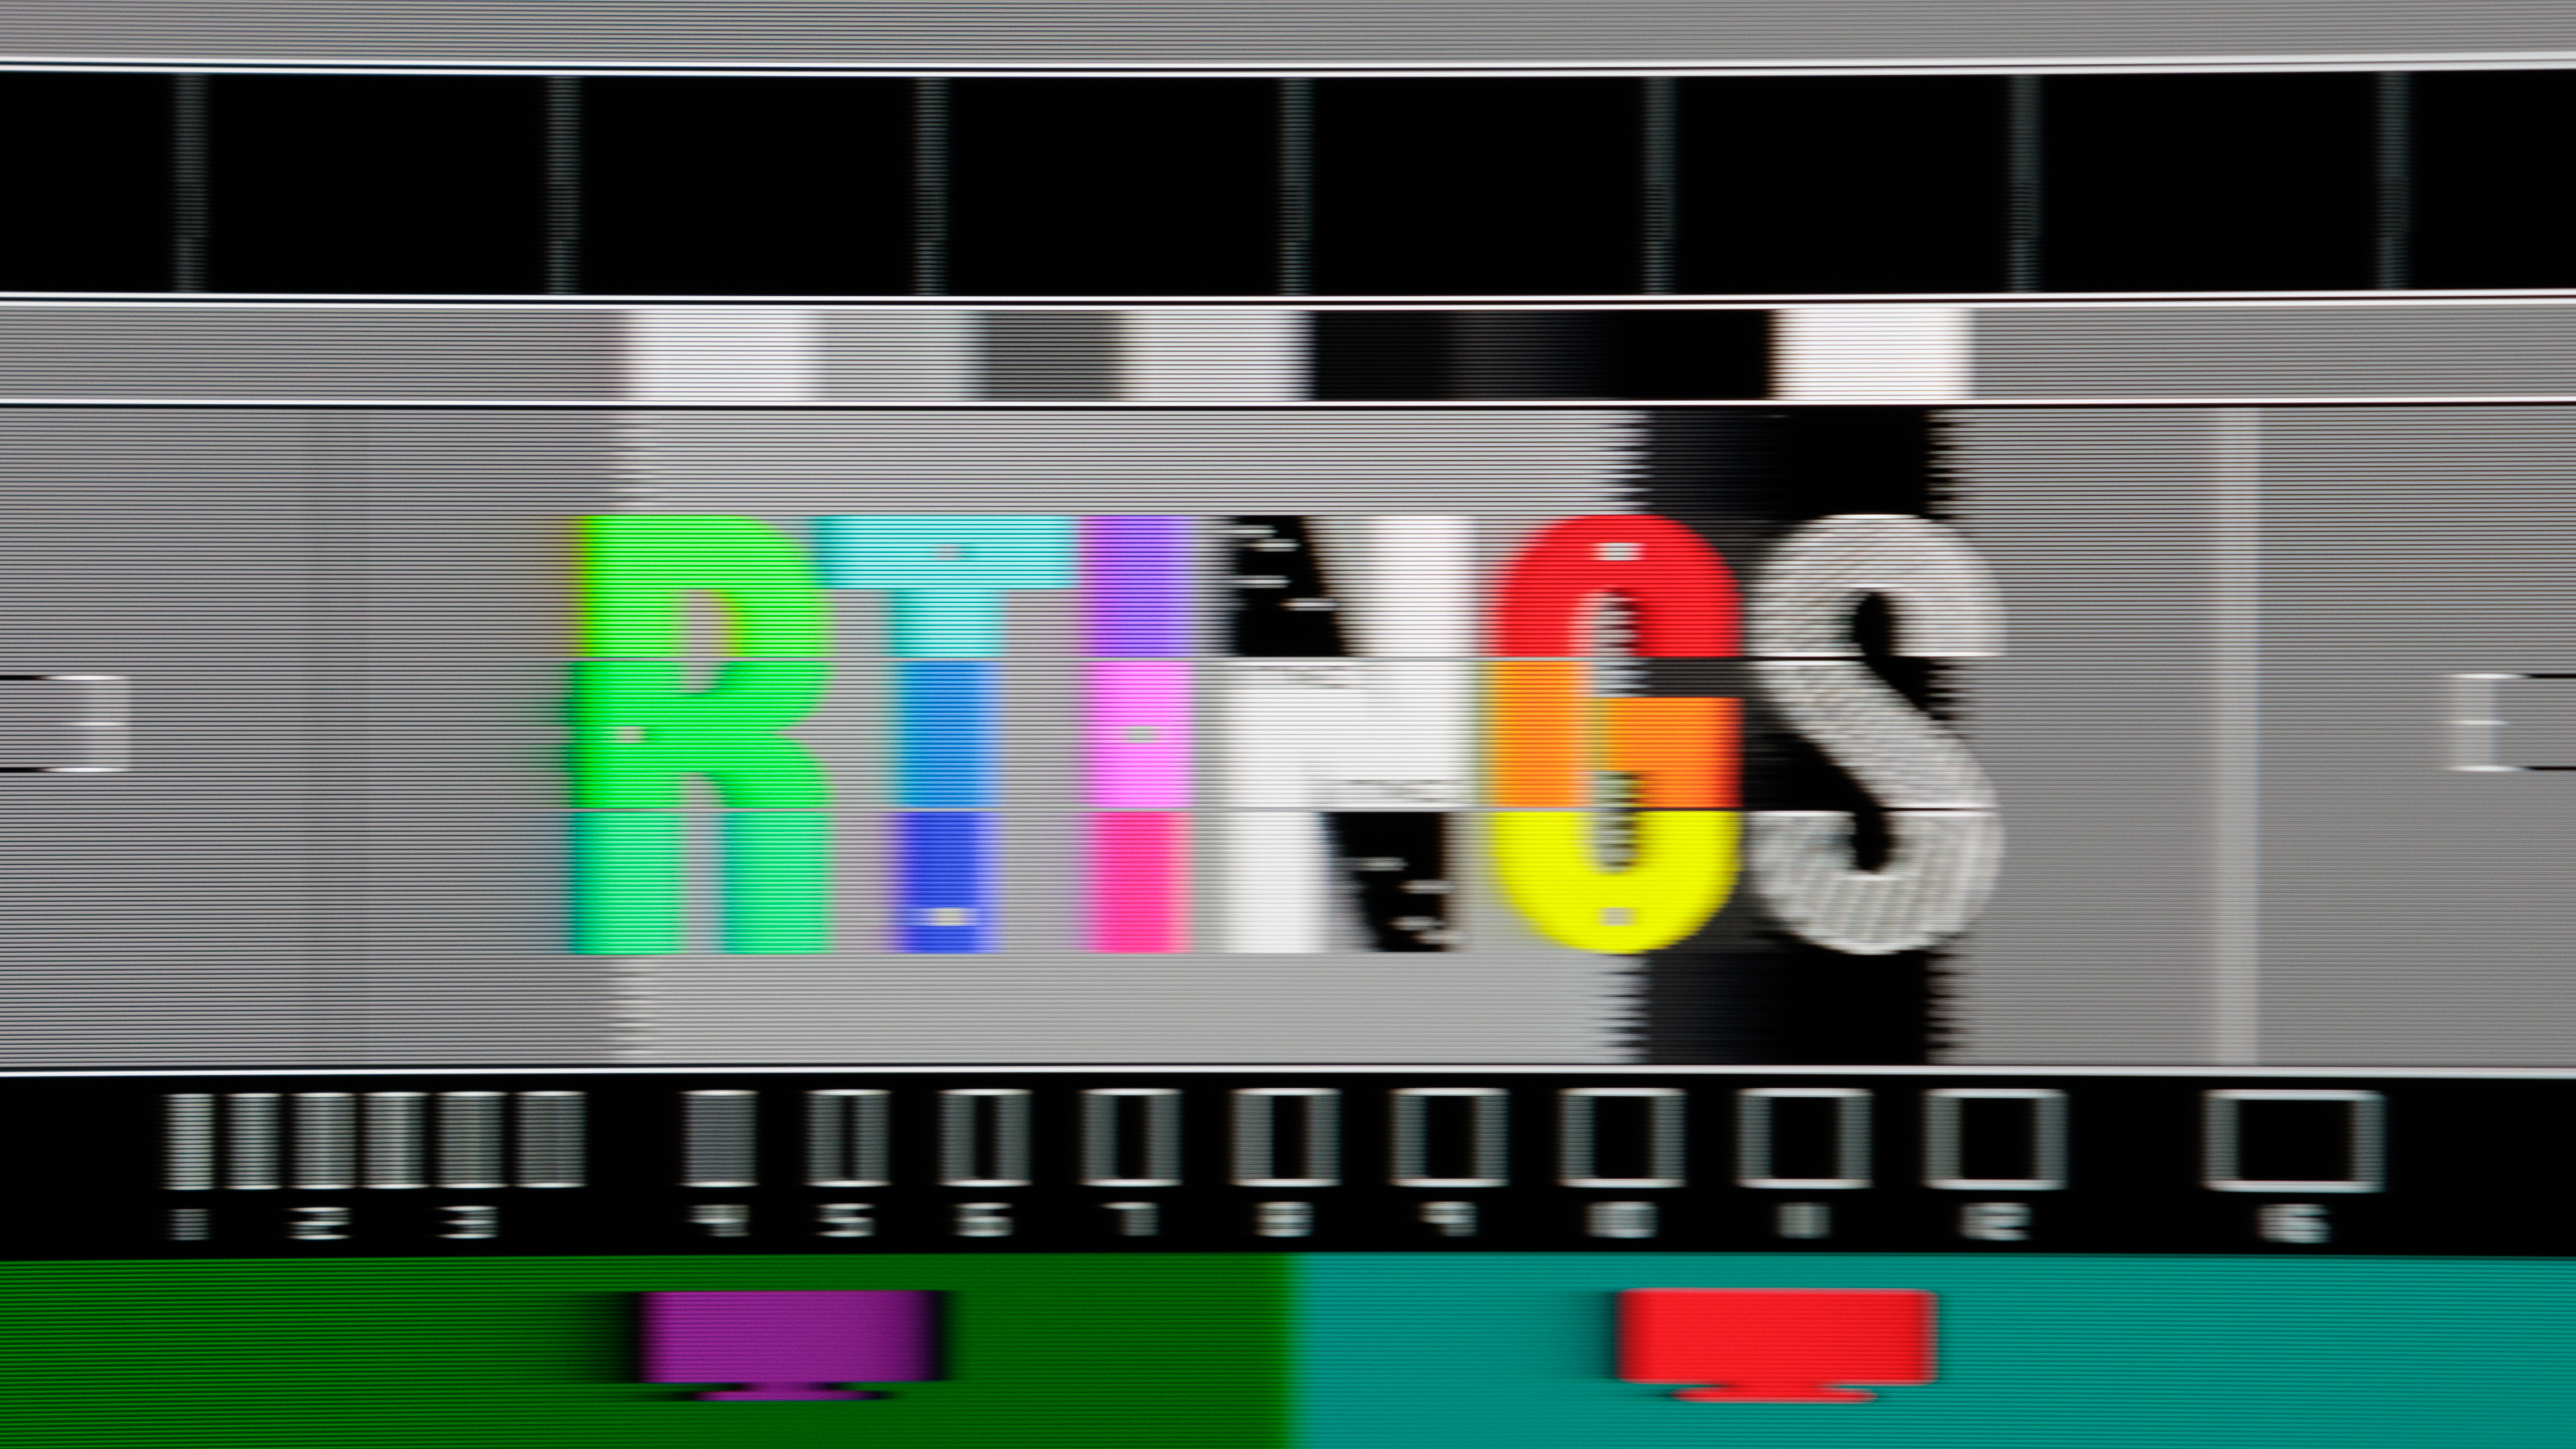
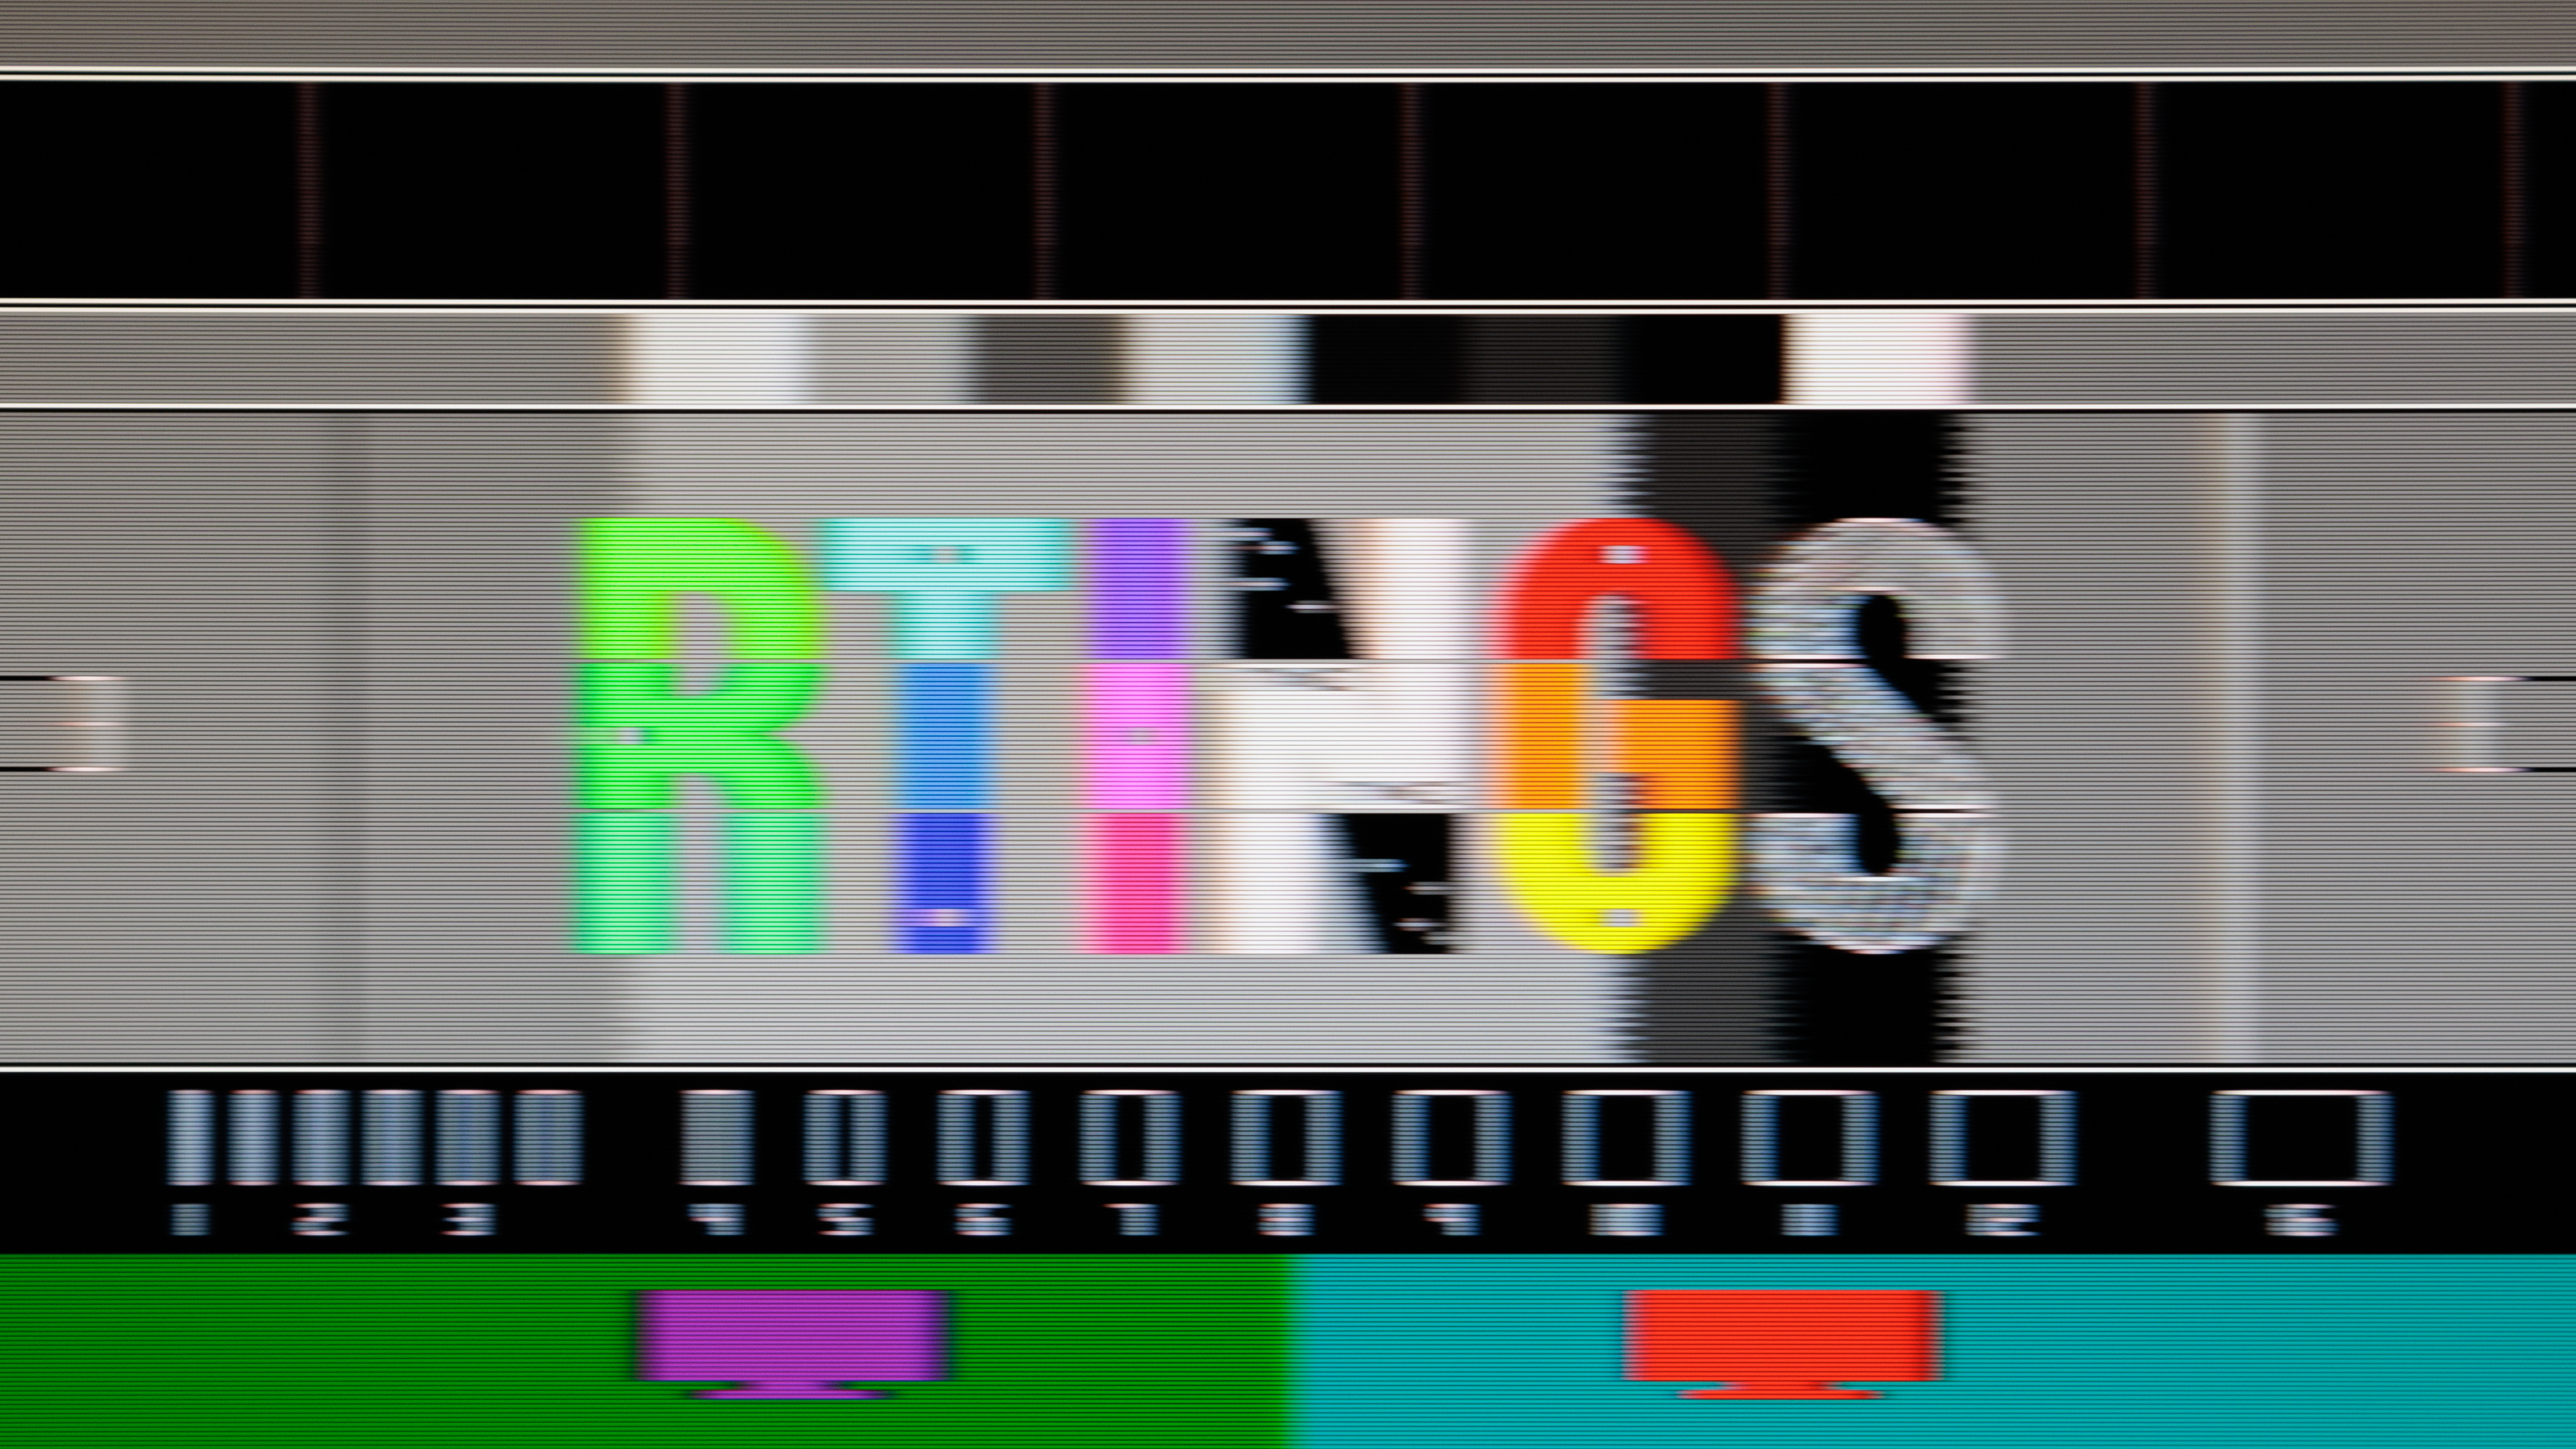
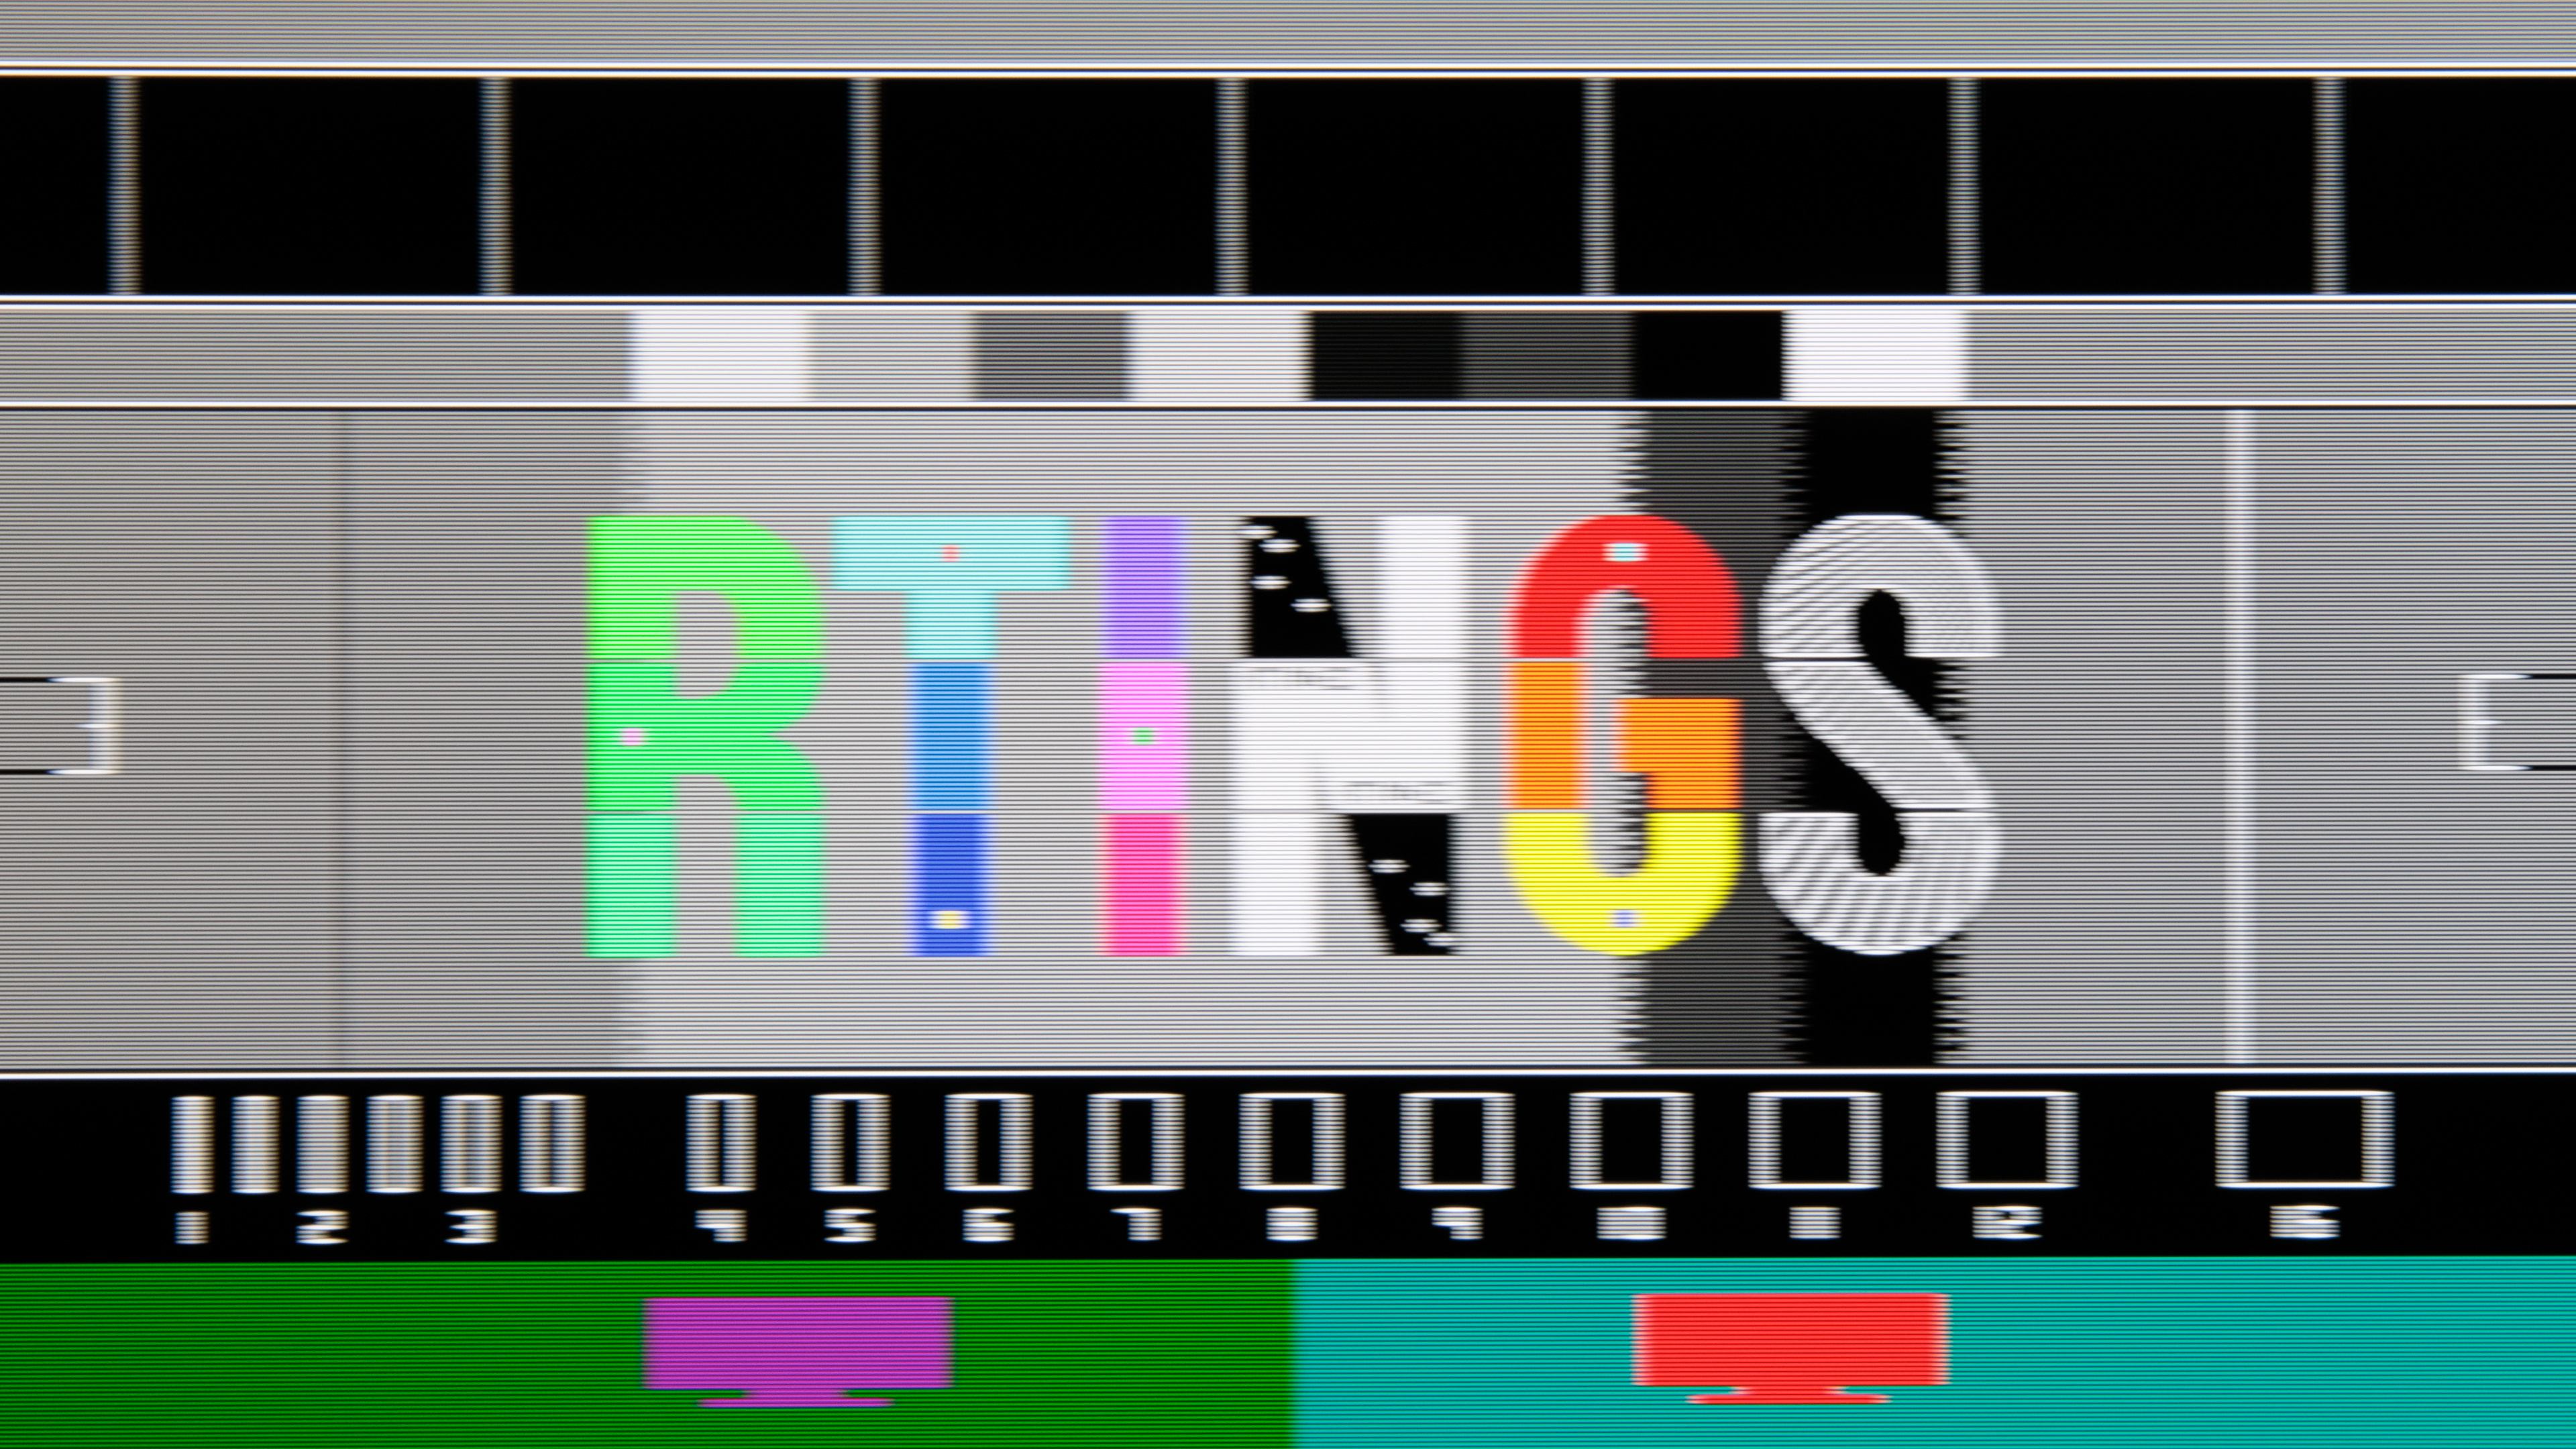
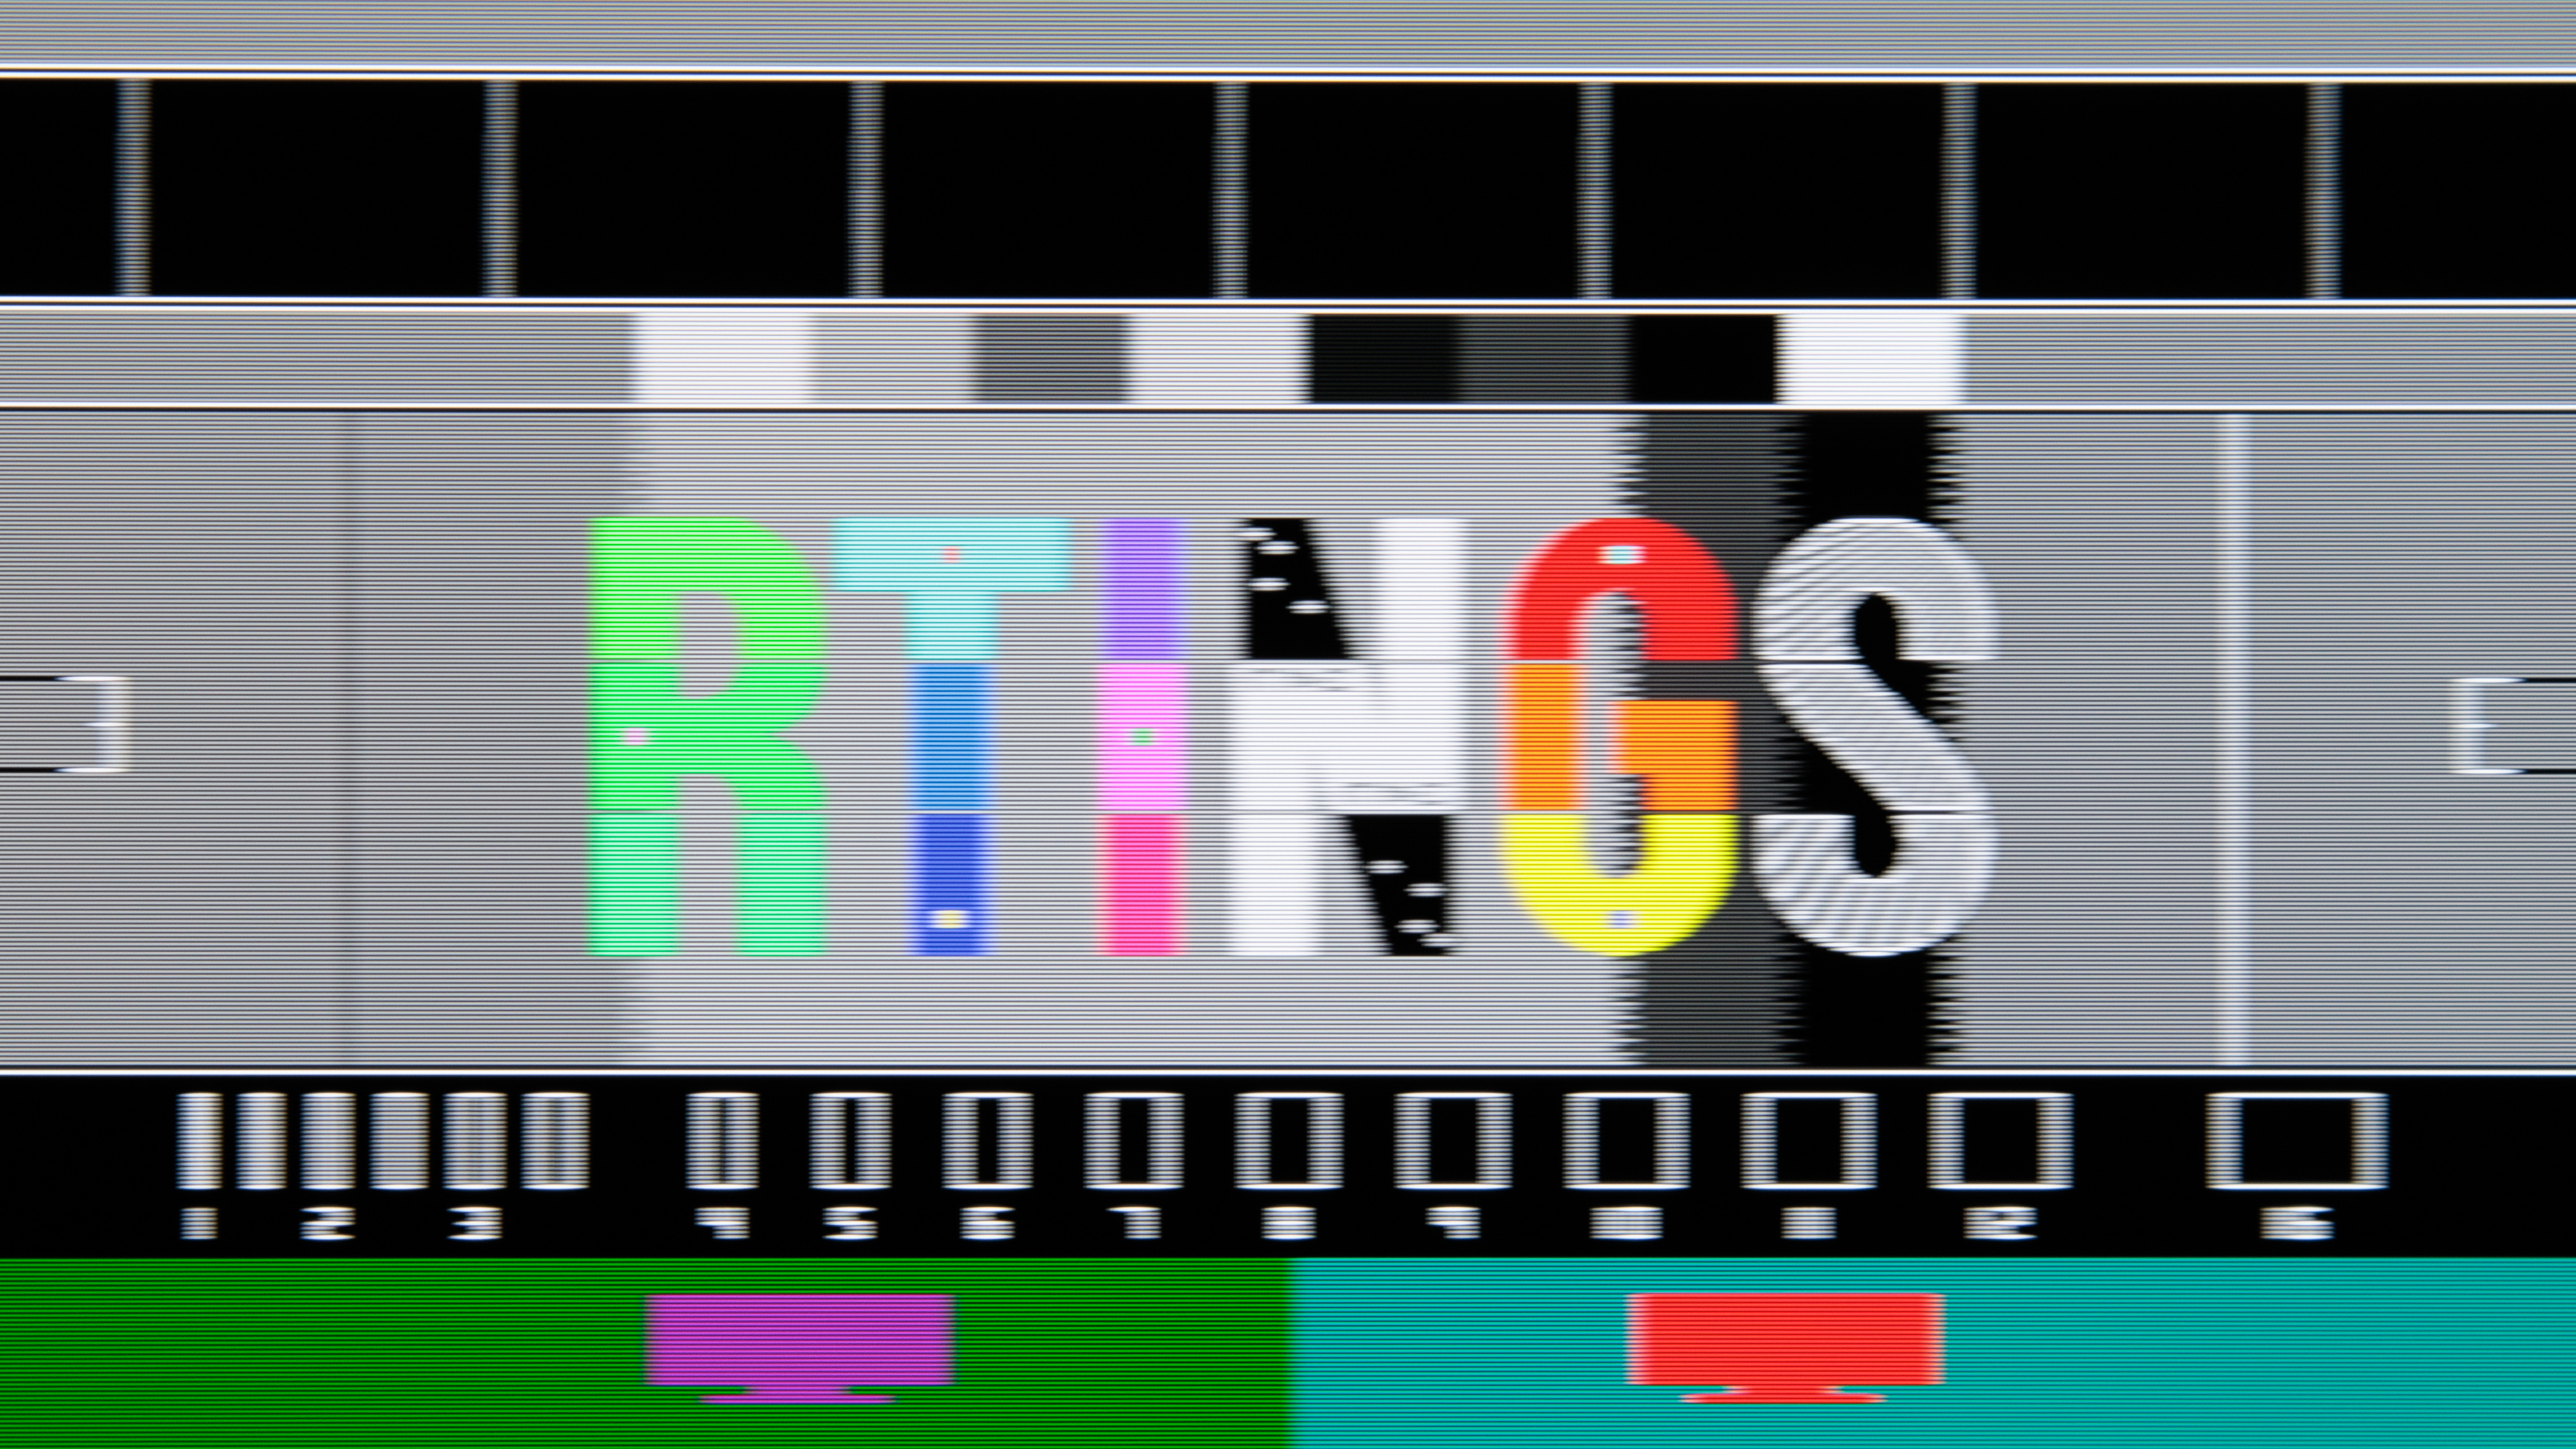
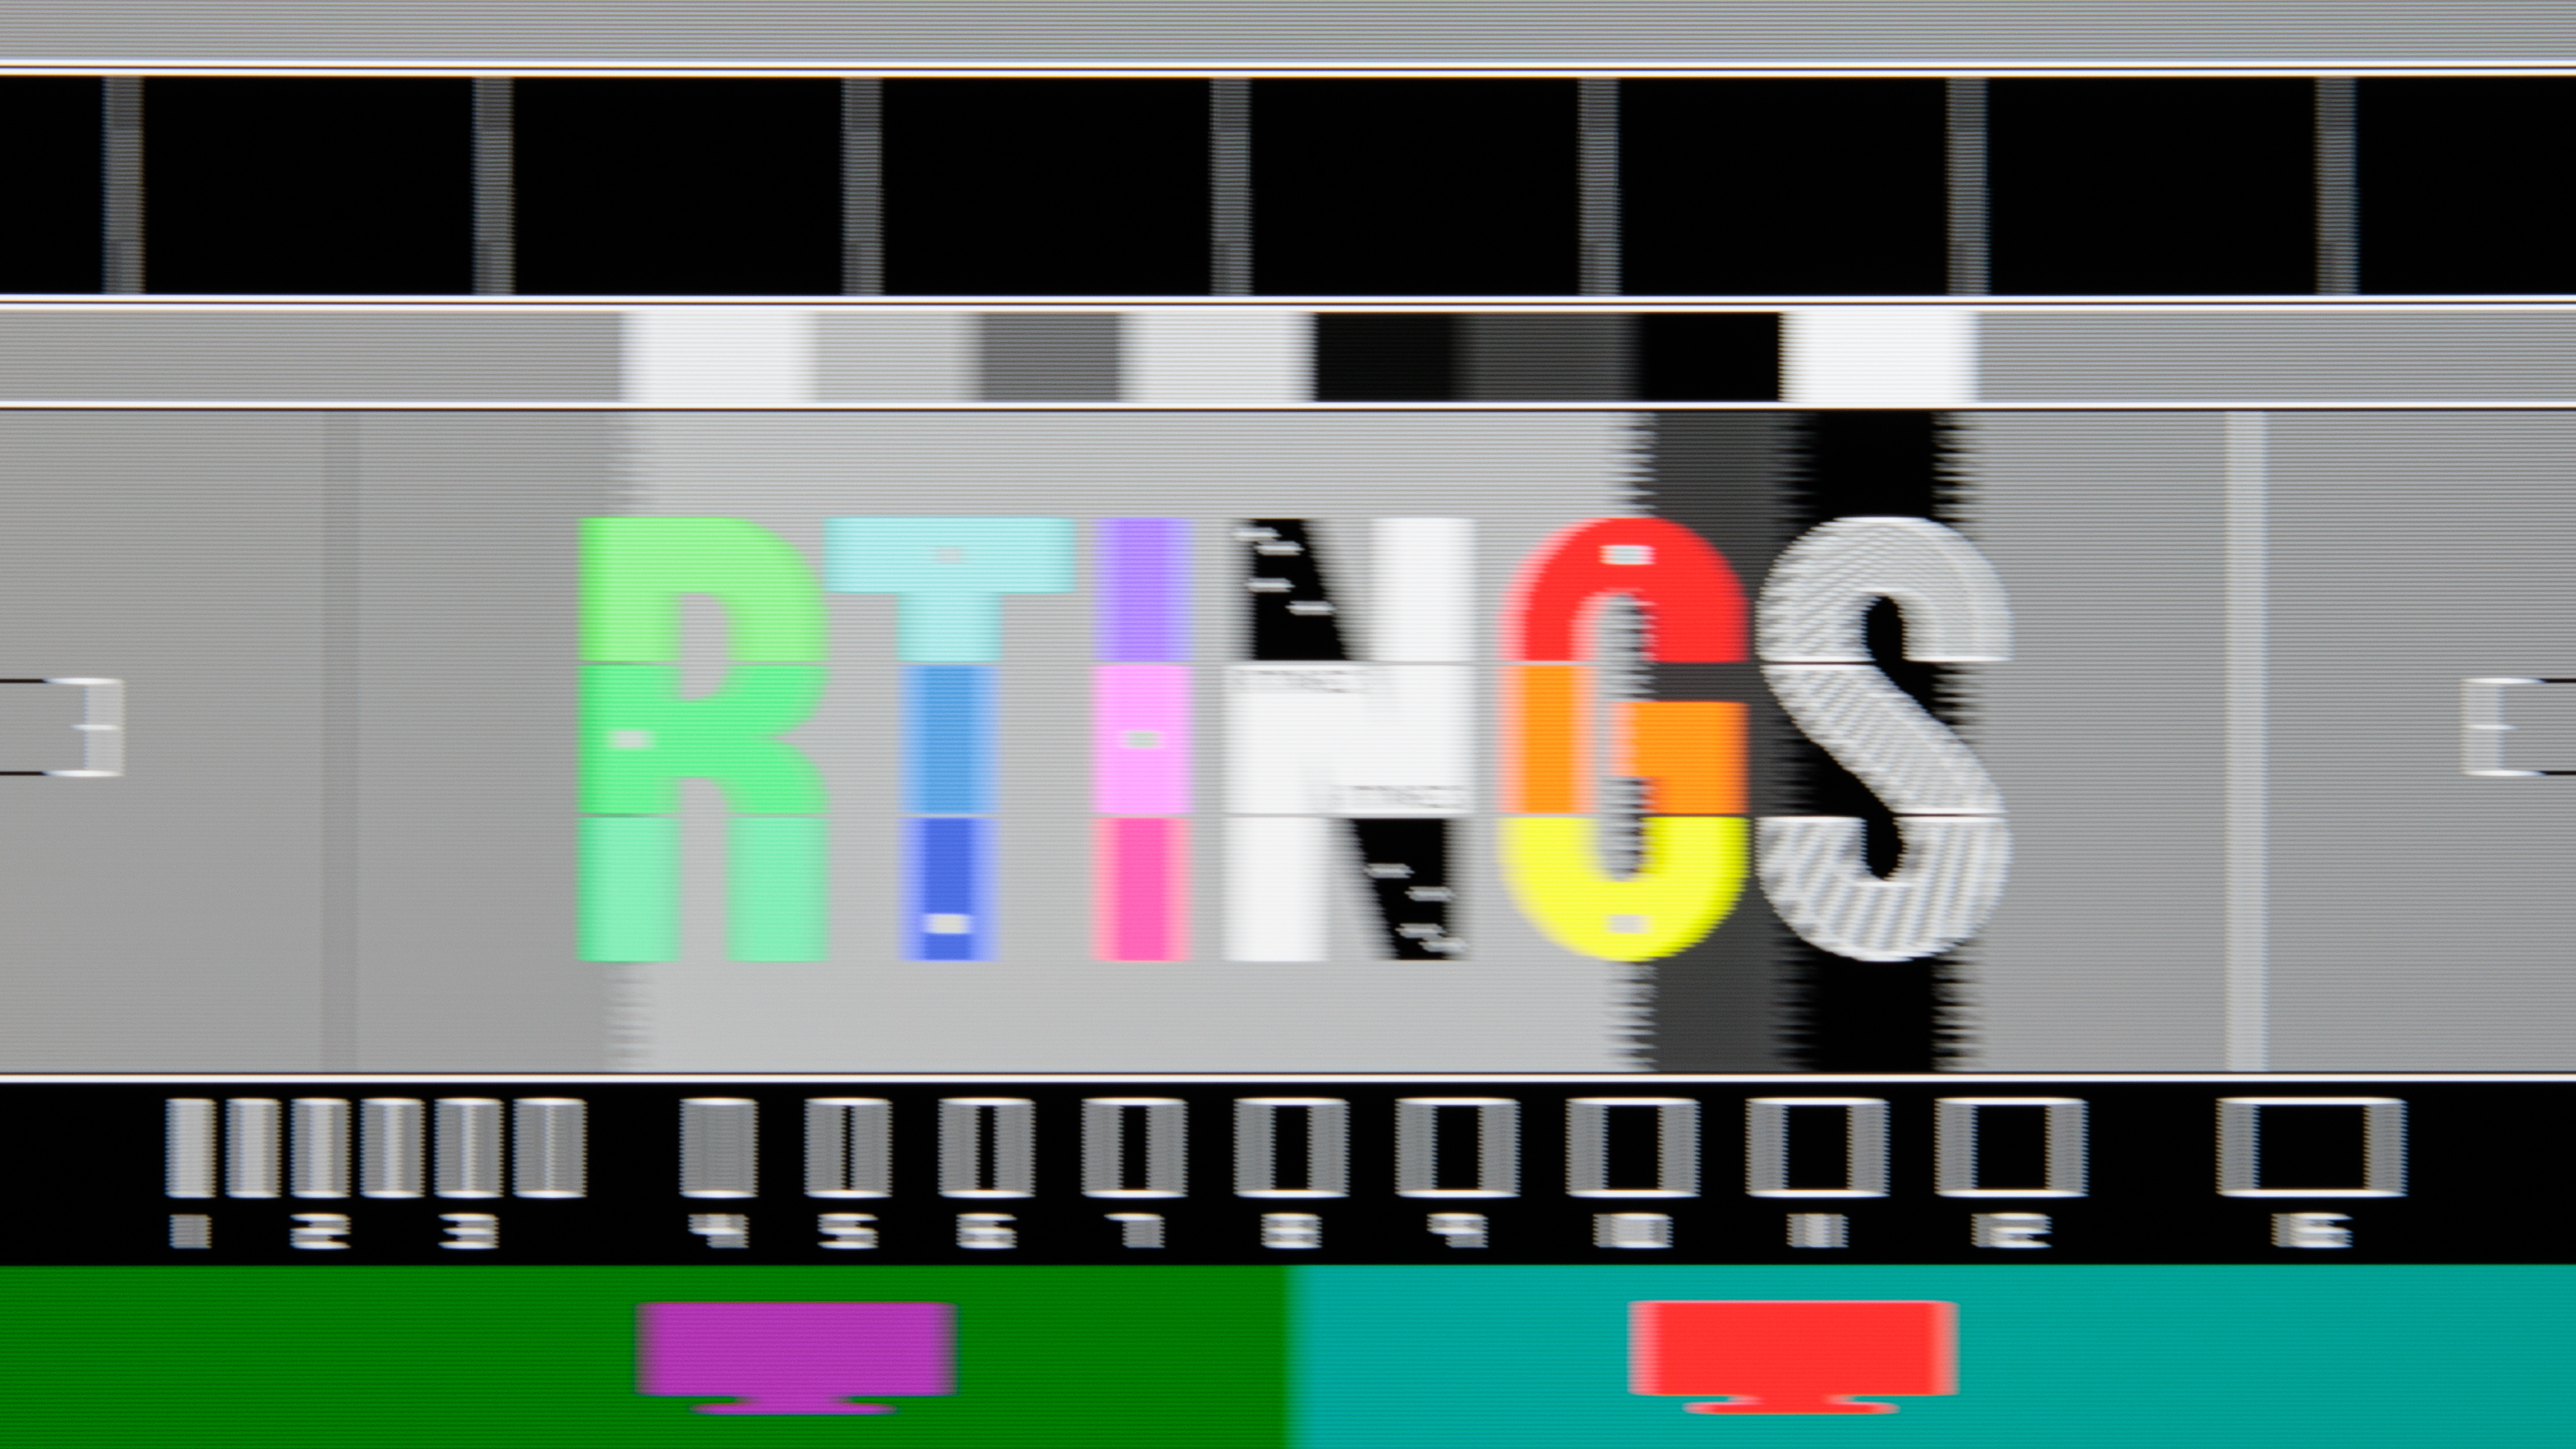
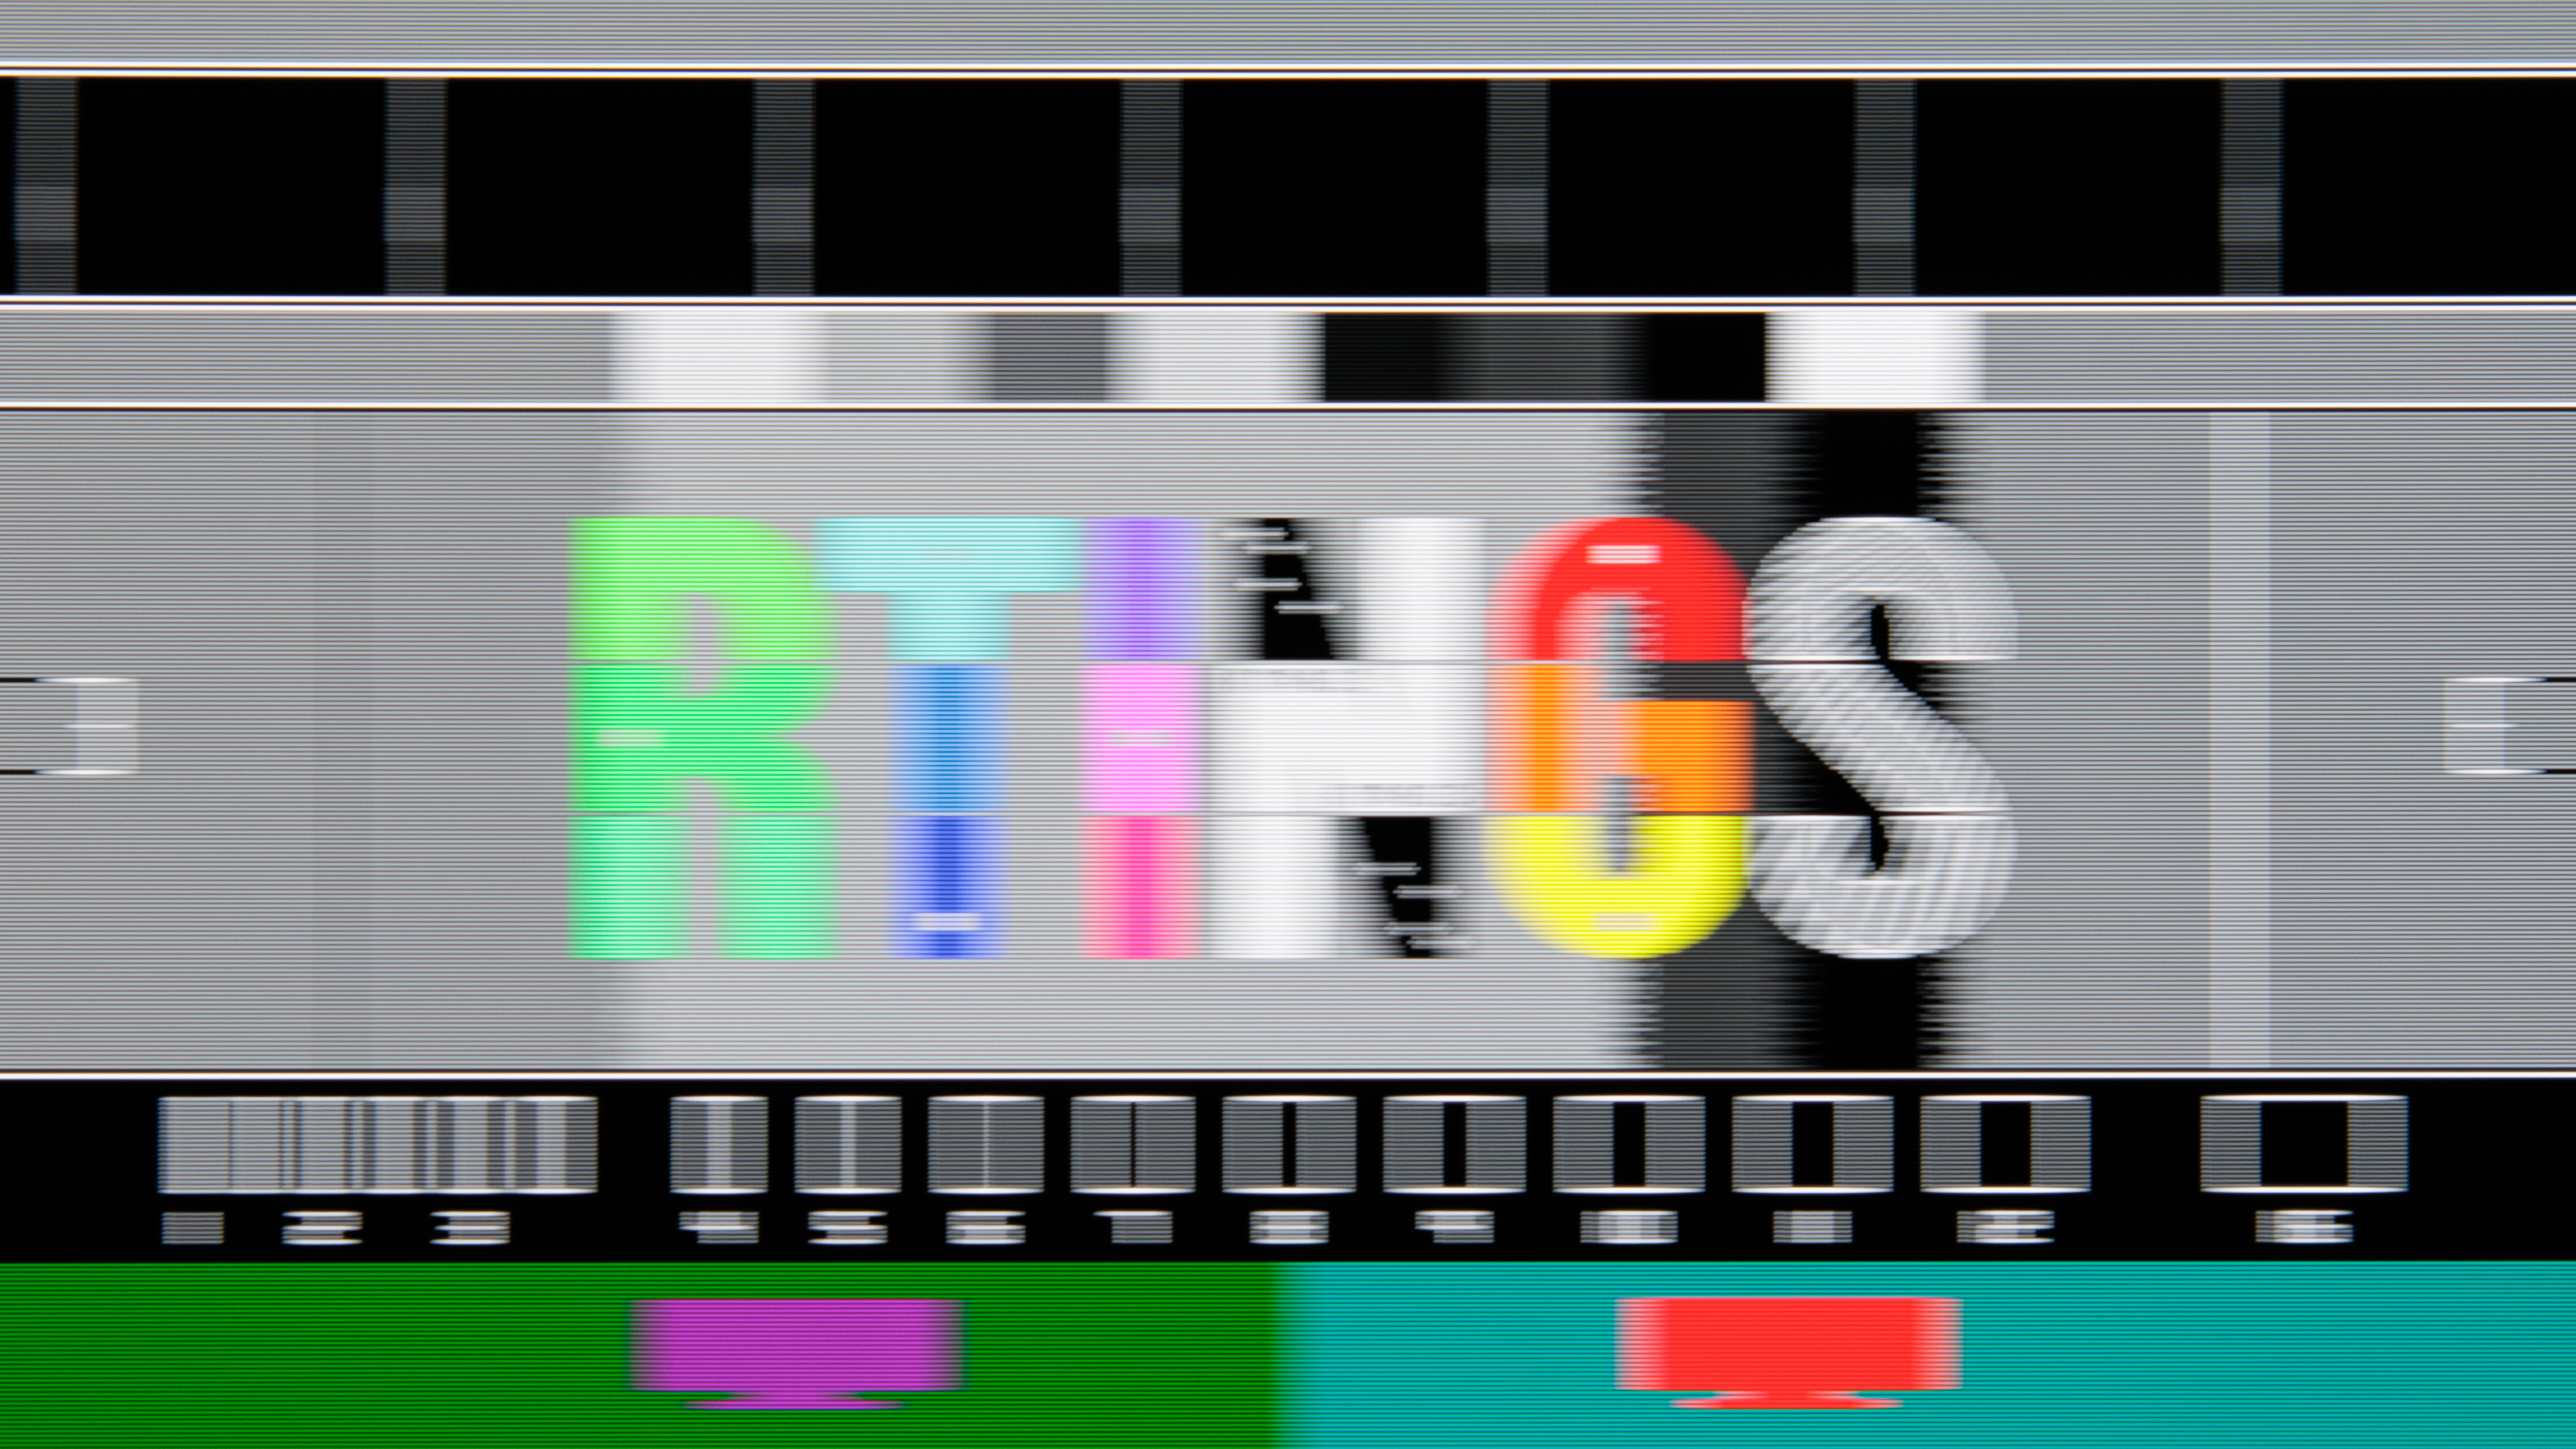
Lastly, we include pursuit photos with the CAD and VRR motion performance tests. This shows a visual representation of what motion looks like, even if it's just a picture of our testing pattern. There are multiple elements, from different colors to white lines on a black background. This is to better represent various content that may move on your screen while gaming.
The pursuit pattern moves across the screen at 1,920 pixels/second, which is fast enough that you can easily see any differences between high refresh rates and lower refresh rates (like 60Hz), and it also represents how our eyes track moving objects across the screen. The reason why motion naturally looks worse at 60Hz is because of persistence blur, as each frame stays on the screen longer, and there aren't as many new frames every second. You can see the differences between a 240Hz refresh rate vs 60Hz with the Dell Alienware AW3225QF, and CAD is minimal on that monitor.
 |
 |
Additional Information
Benefits Versus Other Testing Methods
There are many ways to test for motion handling. While there's no perfect solution, this current testing with CAD is more representative of what we're seeing with fast-moving objects. CAD also better encompasses both response time and overshoot, so you aren't too focused on either measurement. Now there's one single value that aims to better understand motion, as opposed to in the past when we measured and evaluated response time and overshoot separately. By gamma-correcting our response time tool, this also allows for more precise measurements and better represents any change in brightness that our eyes are seeing.
Even the pursuit pattern is an improvement of what we used to have: a red RTINGS.com logo on a cyan background. By introducing more colors, any faults in motion are easier to see, like overshoot with different colors. Even having the purple and red monitors at the bottom of the image makes it easier to see black smearing, particularly with monitors with a slow response time.
There are some drawbacks, particularly with our recommended overdrive setting. As some monitors don't allow overdrive settings with VRR enabled, we instead have to disable VRR to test these overdrive settings. This isn't entirely representative of people who game with VRR enabled on their monitor, even with a fixed signal from the source or their gaming console. In that case, the VRR Motion Performance test is more representative of their monitor's performance.
Panel Types and Motion Handling
Motion handling differs between the common panel types: OLED, IPS, VA, and TN. OLEDs are considered the best for motion as they have a near-instantaneous response time, resulting in sharp motion at high refresh rates. Between LED-backlit LCD panels, VA panels generally have the most black smearing due to slow response times, and both IPS and TN panels can have fast response times, but some also have overshoot.
You can see an example of each panel type below, with the refresh rate at 120Hz. While these are good examples, it's important to remember that each monitor performs differently, so it's better to check out the full review to see how it performs instead of generalizing with its panel type.
| OLED | IPS | VA | TN |
|---|---|---|---|
 |
 |
 |
 |
Response Time Vs. Input Lag
Some people get confused between the response time and input lag. Although they're important factors for gaming, they represent different things. While the response time is the time it takes for pixels to completely transition between colors, the input lag is the time it takes for the monitor to register an input from an external source and start transitioning colors. Essentially, from the time you press a key on your keyboard and your monitor receives the signal, the input lag is the time it takes until pixels are activated and start their color transition. The response time is measured after that, so input lag and response time are measured one after another in the image processing chain of events. Low input lag results in a responsive feel, but unlike response time, it isn't dependent on panel technology.
Impact Of Refresh Rate On Motion Handling
It's easy to think that a higher refresh rate guarantees better motion handling. It can improve the appearance of motion if the CAD is the same at different refresh rates, as there's persistence blur at low refresh rates. That said, it doesn't affect the CAD and response time. This means you can have two 240Hz refresh rate monitors with different CAD, which is often the case if you compare an OLED to an LCD monitor with the same refresh rate. On top of that, persistence blur means that motion looks worse at lower refresh rates, even if CAD is minimal.
Below you can see the impact of the refresh rate on motion handling with the LG 27GX790A-B, which has low CAD at any refresh rate.
 |
 |
 |
 |
 |
 |
With more high refresh rate monitors coming out, the opportunity for improved motion handling is there. That said, getting a monitor with minimal CAD is still important if you want the best motion handling. Another important factor is a monitor's refresh rate compliance, which is a way to see if it can make full-color transitions before the monitor draws the next frame. If it can't, the monitor can't even take advantage of the refresh rate, as it isn't fully changing colors between frames.
Learn more about our refresh rate testing.
How To Get The Best Results
While there's no way to physically improve a monitor's response time and CAD, there are ways to get better motion handling.
- If you have an LCD monitor, warming it up before gaming results in a faster response time than the same monitor without any warm-up, like if you were to power it on and start gaming immediately. You can do this by even watching a video before gaming.
- Gaming at the highest possible refresh rate your graphics card supports can improve motion handling.
- Choosing the right overdrive setting also affects motion and response time. Often, the strongest setting on a monitor has the most overshoot, which results in distracting inverse ghosting. If that bothers you, try using a lower setting.
- OLEDs provide the best motion handling, much better than LCD monitors. If you can afford one, getting an OLED monitor is best if you truly care about motion handling. If you're interested, see our recommendations for the best OLED monitors.
Conclusion
Getting a monitor with a fast response time and minimal overshoot results in the best motion handling and, in turn, provides a great gaming experience. There are different ways to objectively measure how good a monitor's motion handling is, and we use Cumulative Absolute Deviation (CAD) to determine this. It's a measurement of how close a monitor's pixel is to its ideal color. Low CAD results in good motion handling, and although it's impossible to have a CAD of 0, OLED monitors are the closest to it, resulting in the best motion handling. Gaming at high refresh rates also improves overall motion handling on a monitor, but doesn't guarantee it.
We test for CAD by measuring a monitor's first response time and total response time, as well as its overshoot at its max refresh rate, at 120Hz, and at 60Hz. We also repeat these measurements for each overdrive setting that a monitor may have, helping you decide which overdrive setting to use. Lastly, we also take a photo of a pursuit pattern so you can visually see what motion looks like on the monitor.