The response time of a monitor is the time it takes for its pixels to switch from one color to another. It has a significant impact on the display's motion handling, so it's an important consideration if you're a gamer. A slow response time results in blur and/or inverse ghosting with fast-moving objects, while a fast response time minimizes blur.
We changed how we measure response time in recent test benches. We used to test response time by taking a picture of a test pattern, then using a specialized tool to measure response time across different transitions. We tested it with the variable refresh rate (VRR) feature enabled, and if the monitor offers different overdrive settings, we also tested those.
Learn more about our response time testing on TVs.
Test Methodology Coverage
We changed the way we measured a monitor's response time as of Test Bench 2.0. We now measure the Cumulative Absolute Deviation (CAD), which combines response time and overshoot into a single metric, making it more detailed than the older response time test. We still measure response time on Test Benches 2.0 and newer, but they're not scored and are measured differently than in the past, so the results aren't comparable to older test benches. As we changed our response time testing in each of our test benches prior to 2.0, scores are only comparable between monitors on the same test bench.
| Tests | 1.0 | 1.1 | 1.2 | 2.0 and newer |
|---|---|---|---|---|
| Response Time @ Max Refresh Rate Recommended Overdrive Setting Rise/Fall Time Total Response Time Overshoot Error Worse 3 Rise/Fall Time Worse 3 Total Response Time Worse 3 Overshoot Error |
❌ | ✅ | ✅ | ❌ |
| Response Time @ 120Hz Recommended Overdrive Setting Rise/Fall Time Total Response Time Overshoot Error Worse 3 Rise/Fall Time Worse 3 Total Response Time Worse 3 Overshoot Error |
❌ | ❌ | ✅ | ❌ |
| Response Time @ 60Hz Recommended Overdrive Setting Rise/Fall Time Total Response Time Overshoot Error Worse 3 Rise/Fall Time Worse 3 Total Response Time Worse 3 Overshoot Error |
❌ | ✅ | ✅ | ❌ |
You can also learn how our test benches and scoring system work, and how we test monitors.
When It Matters
The response time is the time it takes for pixels to change from one color to the next. When there's constant movement on the screen, the pixels are constantly changing color, so a monitor needs to keep up. The faster the response time, the better the motion looks, and a slow response time leads to smearing, blur, and/or inverse ghosting.
A quick response time is especially helpful for gaming or for content creators who work with fast-moving videos. It isn't as important if you're typing all day and there's less movement on the screen, but motion blur can still be noticeable while scrolling through documents or web pages.
Our Tests
As of Test Bench 1.2, we enabled the monitor's VRR while measuring the response time. First, we played a test video with a fast-moving object and took a picture of it. We then used a specialized photodiode tool connected to a PC to measure the response time while displaying different shades of gray as they transitioned from one shade to another. The software we used automatically generated graphs and tables for the measurements of the different transitions.
We repeated this process with the different overdrive settings the monitor offers. We then chose the best-performing overdrive setting as the recommended one in our review. If the monitor can't use overdrive settings alongside VRR, we just used the results with VRR enabled. We redid these steps at the monitor's max refresh rate, at 120Hz, and at 60Hz.
Motion Blur Picture
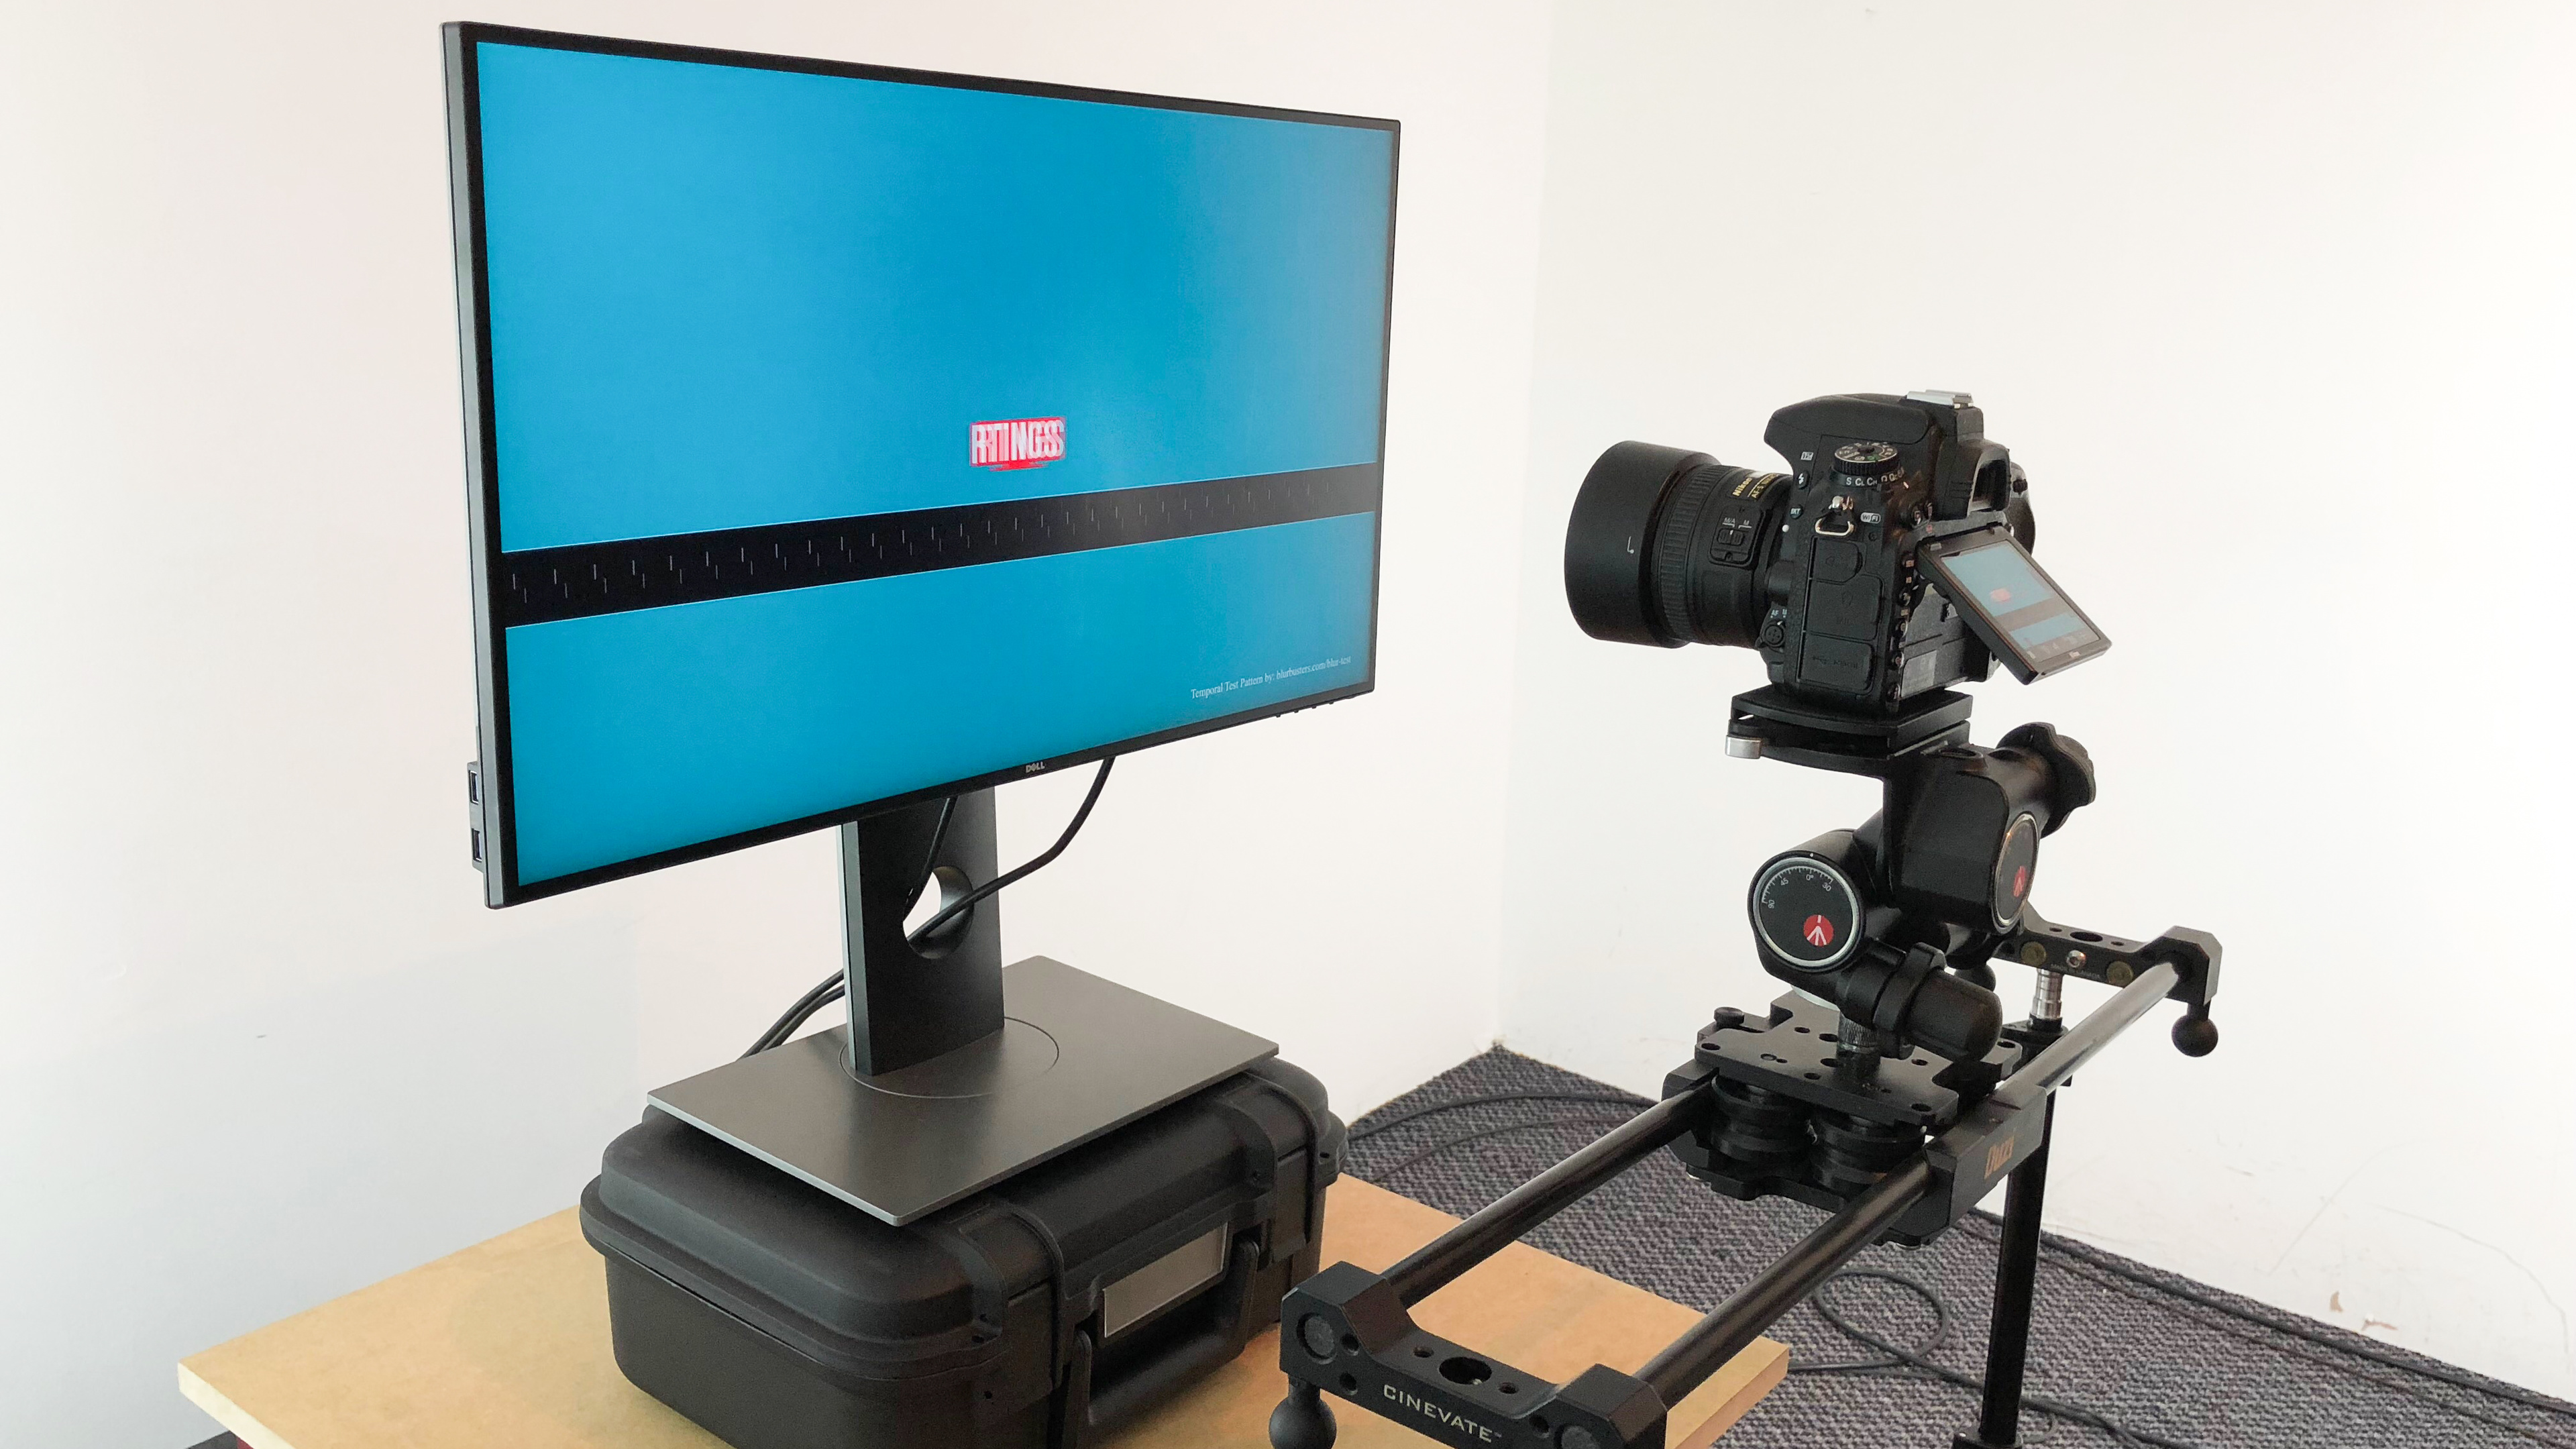
To accurately capture the appearance of motion blur, we used the pursuit camera test methodology developed by Mark Rejhon of Blur Busters. It consists of a test pattern moving transversely and a camera placed on a rail parallel to the screen. The pattern also includes a validation system with a series of temporal tick marks below the logo. This technique helped create consistent, representative images of the blur across different monitors.
While physically tracking the test pattern with the camera, the logo moved at a speed of 960 pixels per second, and we took a picture at a shutter speed of 1/15th of a second. We took these photos at the monitor's max refresh rate, at 120Hz, and at 60Hz. Below are the different refresh rates on the same monitor, the LG 27GP950-B.
| 160Hz | 120Hz | 60Hz |
|---|---|---|
 |
 |
 |
Recommended Overdrive Setting
We repeated the response time measurements with the different available overdrive settings. The overdrive settings are meant to increase response time, but that usually comes at the cost of overshoot, so sometimes the highest settings aren't the best choice. We considered several factors when choosing the best one, such as total response time and overshoot, and we also looked at the motion photos to compare. For example, if one setting has a faster response time but more overshoot that you can notice in the photo, we chose the one with a slower response time but less overshoot. As with any recommendation, these are just guidelines, and you can choose any setting you prefer.
Since we tested monitors with VRR enabled, some don't allow you to adjust the overdrive setting with VRR on. If that's the case, we just put the recommended setting as VRR enabled.
Response Time Tables
After we took the photo, we used our specialized tool to measure the response time of different gray-to-gray transitions in the center of the screen. The tool captured the light intensity coming from the screen in each transition, enabling us to calculate the response time. The gray slides ranged from 0% (black) to 100% (white), with the 20%, 40%, 60%, and 80% slides in between. We measured the response time of each possible transition, first from darker slides to brighter slides (i.e., 0% to 20%), then all the transitions from brighter to darker (i.e., 20% to 0%).
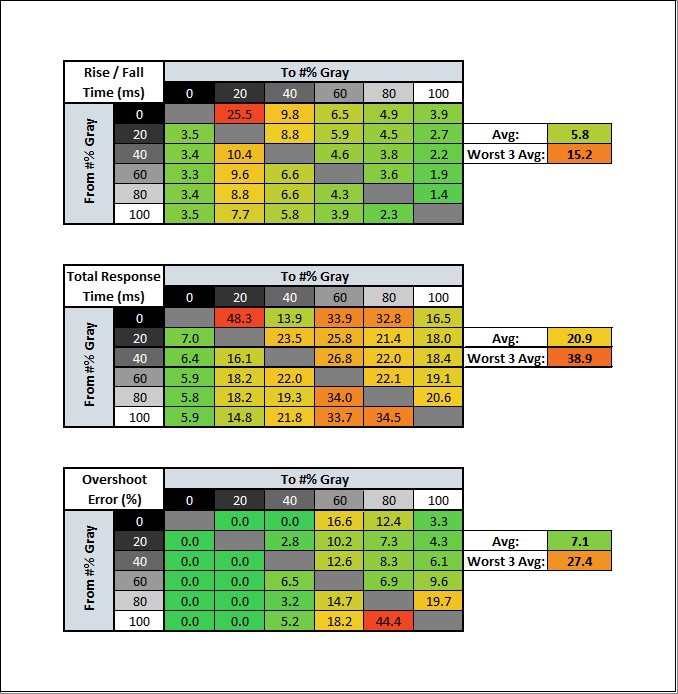
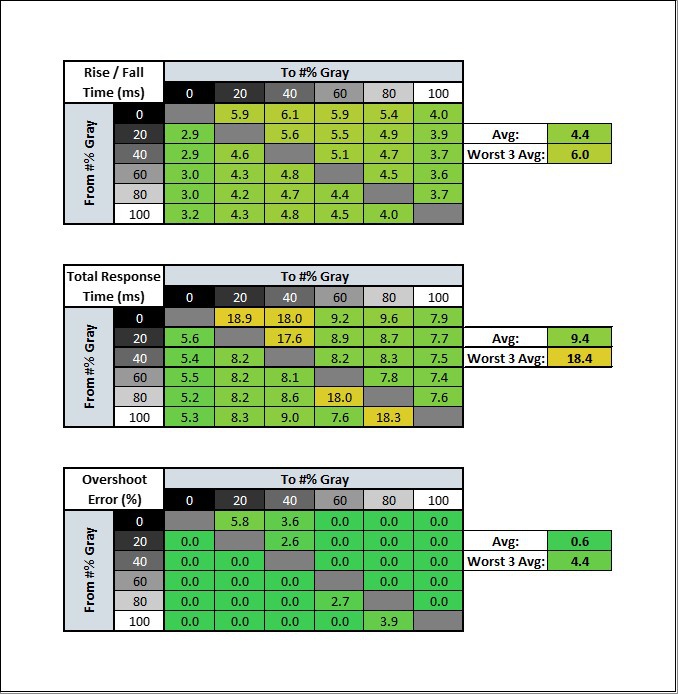
Our program then generated the response time tables to show the measurement for each transition. As you can see in the tables below, it starts with each of the gray values in the left column and transitions to the specified value in the top row. The software calculated an average of each result to get the final result, and it measures the average of the worst three results. Luckily, these tables are easy to read, as they're color-coded, with green being good and red being bad, so you know what performs well and doesn't.
Below are examples of a monitor with a fast response time (right) compared to one with a slower response time (left). You can see that the monitor on the right has more green than the one on the left. There are three tables that represent the different aspects we measure: rise/fall time, total response time, and overshoot.
In the text, we also included a heatmap for each overdrive setting, along with charts showing the backlight intensity for each transition. These helped you further visualize all the data, especially if you're curious about a specific transition.
Rise/Fall Time
The rise/fall time told us the response time from 10% into the transition until 90% of the transition. For example, if the screen is transitioning from pure black (0%) to pure white (100%), it measured the time it takes to go from 10% gray to 90% gray. The same concept was applied even if it's going from 60% to 80%; it was measuring from 62% to 78%. This response time is good to know when there are incomplete transitions, like when an object transitions from one color to the next so fast that it doesn't have time to make a full transition.
In the response time tables, the rise/fall time results are represented in the top table.
Total Response Time
The total response time is the time it takes for the monitor to complete a full transition, although we used a 2% leniency to account for noise. For example, the 0-100% transition was actually being measured from 2-98%. This number is also important for motion handling, but it's more important than the rise/fall time for slower-paced games because colors have the opportunity to make a full transition.
In the response time tables, the total response time results are represented in the middle table.
Overshoot Error
Overshoot error is the percentage by which the monitor goes past its target color, hence the name overshoot. So if the monitor has to transition from 20% to 80% gray, it overshoots if it goes past the 80% target. The error is a percentage of the target, not the difference, so if it goes to 85% for an 80% target, it overshoots by 6.25% and not 5%. Overshoot often occurs when you set the monitor to its fastest overdrive settings, because the pixels try to transition so quickly that they go past their target.
Below is an example of overshoot with the ASUS ROG Strix XG27AQ. In the chart on the left, you can see that the pixel transitions way past its target of 20%, with an overshoot error of 236%. It eventually stays at 20% gray, but after it's done overshooting. It's the strongest overdrive setting for this display, and you see in the motion photo that the overshoot causes inverse ghosting behind the moving object.
 |
 |
In the response time tables, the overshoot error results are represented in the bottom table.
Worst 3 Rise / Fall Time
As of Test Bench 1.2, we showed the average measurements of the worst three transitions. It tended to be in the dark transitions, as monitors have more trouble going from dark to bright colors. Because of this, this number is important if your games tend to include a lot of dark scenes, so you want something with a fast response time in dark transitions. If the worst three measurements are close to the total average, it means the monitor is consistent across different transitions. The system automatically calculates the worst three rise/fall times.
Worst 3 Total Response Time
Once again, we published the average of the worst three total response time measurements. A big difference between the worst three transitions and the average total response time often indicates that the monitor struggles with darker colors and exhibits black smearing. You can see this with the Dell S3221QS below:

Worst 3 Overshoot Error
Lastly, we showed the average overshoot error for the worst three transitions. Like with the rise/fall and total response time, this measurement is more representative of dark transitions, as it's more likely that a display overshoots when going from 0% gray to 20% than from 60% to 80%.
Response Time at 120Hz and 60Hz
We repeated the same testing process at 60Hz and at 120Hz, with the same Rise/Fall Time, Total Response Time, and Overshoot Error tests, including with the Worst 3 transitions. The testing methodology is the same at these refresh rates.
Additional Information
Persistence Blur
While the response time has a big impact on motion handling, another cause of blur is called persistence. This happens at lower refresh rates. Essentially, the longer a frame is kept on screen before switching to the next one, the blurrier a moving object will appear on-screen. As a result, the monitor's refresh rate affects motion handling. A display can have a fast response time at any refresh rate, but there will be more blur at low refresh rates, as you can see with the ASUS ROG Swift 360Hz PG27AQN below. It's also important to remember that a faster refresh rate doesn't guarantee better motion handling, as the monitor must also have a fast response time.
| 360Hz | 60Hz |
|---|---|
 |
 |
Using a monitor's backlight strobing feature can help reduce this persistence blur. However, many factors affect motion handling, so response time isn't the end-all.
Learn more about the refresh rate
Impact Of The Panel Type
The monitor's panel type affects the response time and motion handling. OLEDs are known for their near-instantaneous response time because they can turn individual pixels on and off. This means they have the best motion handling with minimal blur behind fast-moving objects.
As for LED-backlit LCD monitors, TN and IPS types are best for motion handling, but performance still varies between models. VA panels typically have slower response times in dark transitions than IPS and TN panels, leading to black smearing. However, some VA displays compensate for this with the overdrive settings, which improves the dark scene performance at the cost of overshooting in bright scenes.
How To Get The Best Results
A monitor's response time can't be changed, but there are a few settings that might help you improve motion handling.
- In the monitor's on-screen display menu, set it to your preferred overdrive setting. You can use our recommended setting, but choose whichever looks best to you.
- Use the highest refresh rate the monitor and your graphics card can go. A higher refresh rate is better for motion handling, and while setting it higher doesn't make it have a quicker response time, it's better than playing at a lower refresh rate.
- Consider using your monitor's backlight strobing feature if available. While some users might be bothered by a flickering screen, this is one of the best ways to reduce persistence blur and enjoy sharper motion.
Conclusion
There are several factors that contribute to a monitor's motion handling, and response time is an important one. Response time is the time it takes for pixels to transition from one color to the next, and a slow response time can lead to motion blur and smearing. It's also possible to have a response time that's too quick, causing it to overshoot its target color and create an inverse ghosting effect. We measured the response time using a special tool, but we no longer measure it as a standalone test. We no longer measure response time on its own, though, as our current CAD testing encompasses the response time and overshoot to give a more accurate representation of motion handling.