Refresh Rate Compliance defines how well a monitor can make effective pixel color transitions before the screen refreshes. Having high compliance means your monitor can take full advantage of high refresh rates with effective response times, helping improve the appearance of motion with less overshoot and black smearing versus a less compliant monitor.
We use a specialized tool to measure a gray-to-gray sequence and see how well the monitor complies versus an ideal transition. We represent refresh rate compliance as a percentage of this ideal transition at its max refresh rate, at 120 fps, and at 60 fps, and we also measure the gray-to-gray sequence with various overdrive settings that may be available.
Test results
When It Matters
With more high refresh rate monitors and premium gaming technology coming out, gaming at high frame rates is becoming more accessible and more common. However, you won't be taking full advantage of these high frame rates with a monitor whose response time is so slow that it isn't making full color transitions before the screen refreshes itself. Although no monitor has 100% compliance, getting one with high compliance at least makes for a better gaming experience than one with lower refresh rate compliance. This is because having higher compliance means the monitor can effectively display proper colors on fast-moving objects, which helps improve the overall appearance of motion.
Compliance matters most for gaming at high frame rates, as this is where there's more variance between monitors. Although compliance is also important when gaming at lower frame rates, it's easier for a monitor to have higher compliance with low frame rates.
How We Measure
We measure a gray-to-gray sequence with our gamma-calibrated response time tool to see how well the monitor transitions between colors before the screen refresh rates. Refresh rate compliance is calculated as a percentage of the monitor's transition versus an ideal transition. We repeat the measurements at various frame rates, from 60 fps up to the monitor's max refresh rate, including with any available overdrive settings.
Response Time Tool
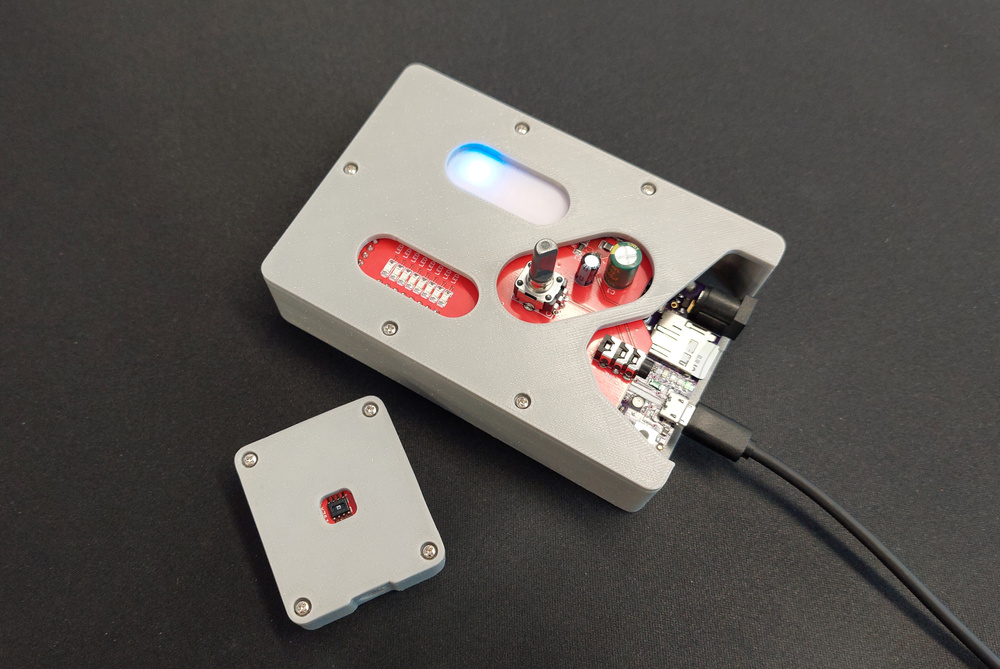
Our specialized tool uses a photodiode placed on the monitor's screen, which our test PC reads via a microcontroller connected over USB. It can read light output from the monitor and convert it to a 16-bit integer (0-65,535). For an even more precise measurement of what exactly the monitor is displaying, we also need to gamma-calibrate the tool. We do this by displaying various gray levels, and by measuring the voltage at each gray level, we can identify the voltage for every RGB level from pure black (0,0,0 on the RGB color wheel) to pure white (255, 255, 255 on the RGB color wheel). This allows for a precise measurement of which exact color the monitor is displaying at various voltage levels and helps us measure refresh rate compliance. You can read more about gamma correction here.
Frame Sequence
Once the tool is gamma-calibrated, we can start testing. We use a nine-frame gray-to-gray sequence, which you can see below. The sequence starts off with RGB 127 before transitioning to RGB 255 as the first measured transition, and then it continues with the rest of the sequence. The tool measures the monitor's RGB level compared to the ideal level during each frame, and to see how close it can get to its target RGB level in the time that the frame appears on screen. Although we measure using various gray levels, they still represent all kinds of colors that may appear on screen while gaming, as each gray level uses each red, green, and blue subpixel equally.
| Initial Color RGB 127 |
Frame 0 RGB 255 |
Frame 1 RGB 0 |
Frame 2 RGB 63 |
Frame 3 RGB 31 |
Frame 4 RGB 191 |
Frame 5 RGB 95 |
Frame 6 RGB 159 |
Frame 7 RGB 223 |
Frame 8 RGB 127 |
|---|---|---|---|---|---|---|---|---|---|
 |
 |
 |
 |
 |
 |
 |
 |
 |
 |
In terms of what this means for your gaming experience, the longer a monitor is away from its target RGB level, the less accurate the image is, so you aren't seeing fast-moving objects as intended. If a monitor fails to remain at the target RGB level before transitioning to the next color, it's either displaying a color that's too dark or too bright, negatively impacting the overall appearance of motion.
Frame Time
The source's frame rate, and in turn, frame time, has an effect on refresh rate compliance because the longer the frame time, the easier it is to have higher compliance. The frame time is the time each frame is on the screen for, which changes depending on the frame rate. Calculating the frame time is easy; you just need to divide 1000 milliseconds by the frame rate. For example, the frame time of 240 fps is 4.167 ms (1000/240), which is the time it takes for the monitor to draw each frame. Each of the frames in the gray-to-gray sequence remains on the screen for that same time before moving on to the next color. Monitors tend to have higher compliance with longer frame times because there's more time to make its full RGB color transition.
We repeat this sequence with different frame rates, meaning the frame time changes for each frame rate at which we test. You can see the frame time for various tested frame rates below.
| Frame Rate | Frame Time |
|---|---|
| 60 fps | 16.67 ms |
| 80 fps | 12.50 ms |
| 100 fps | 10.00 ms |
| 120 fps | 8.33 ms |
| 144 fps | 6.94 ms |
| 165 fps | 6.06 ms |
| 240 fps | 4.17 ms |
| 360 fps | 2.78 ms |
| 500 fps | 2.00 ms |
Our Tests
We perform these tests after calibrating the monitor with it at its max brightness, local dimming disabled, and VRR enabled, and we make sure the monitor is warmed up by running a 30-minute video. If the monitor also allows for it, we enable our recommended overdrive setting that we determine during our response time testing. The actual testing itself is very quick, and we repeat the sequence at various frame rates. We also repeat the same testing with other overdrive settings besides the recommended one. With these results, we can calculate refresh rate compliance as a percentage of its measured transition versus the ideal transition.
Fast GTG Sequence Graph (Recommended Overdrive)
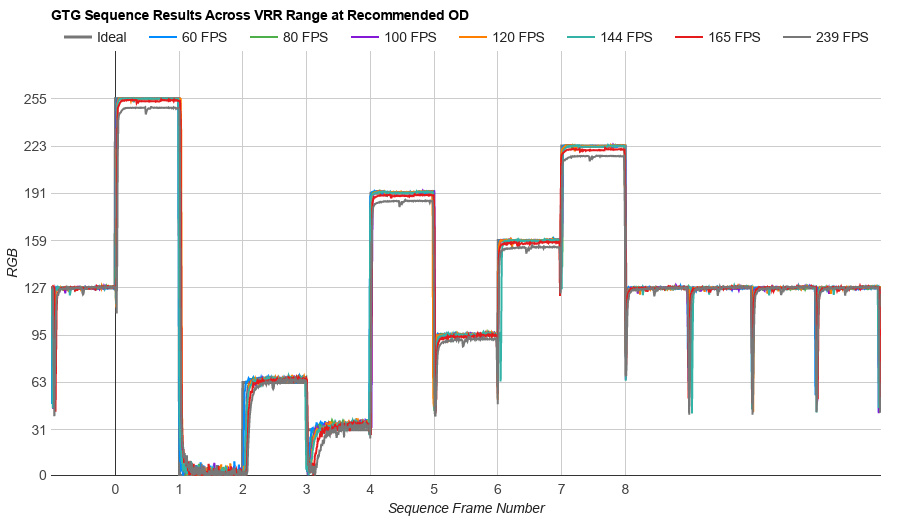
The fast gray-to-gray sequence graph represents the RGB transition during the nine-frame sequence versus the ideal transition. The vertical axis represents the RGB level, while the horizontal axis is the frame sequence number. The graph includes RGB transitions from various frame rates, and because of this, the time between each frame changes for every frame rate. This is why the horizontal axis represents the frame number and not time.
The ideal transition is represented in gray, whereas the colored lines each represent the transition at different frame rates. You can see this with the graphs below, and while it may seem like a lot of data to unpack at once, they all represent the same thing at different frame rates. You can see that some transitions can't even reach their target RGB level before moving on to the next color. This negatively impacts the appearance of fast-moving objects because the monitor fails to display colors as intended, so a rapidly moving red object may look closer to burgundy or pink.
You can see the detailed graphs of each monitor with the interactive tool here. You can also use this to compare the graph between multiple monitors.
VRR Compliance Graph
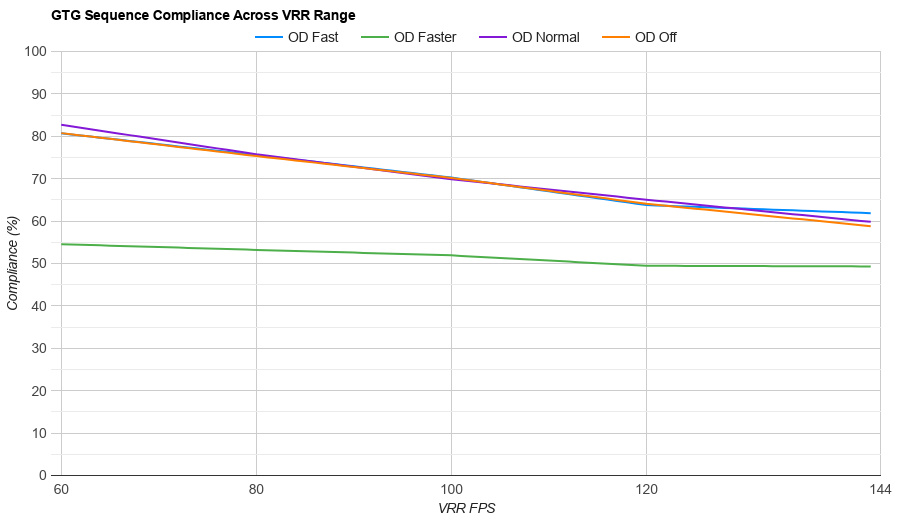
The second graph in every review is the refresh rate compliance over the entire refresh rate range with various overdrive levels that the monitor may have. While the fast GTG sequence graph measures the pixel transition versus an ideal one, this graph aims to identify which overdrive setting has the best compliance over the monitor's refresh rate range.
The results are plotted on a graph, with the vertical axis representing the refresh rate compliance as a percentage, and the horizontal axis is the frame rate. Each colored line represents the various overdrive settings that a monitor may have. If it doesn't have any overdrive settings or doesn't support overdrive with VRR enabled, there will only be one line to represent its performance. As it's easier for monitors to have the best compliance at 60 fps, most monitors have a downward slope towards their max refresh rate. Using the example of the LG 32GR93U-B below, you can see that the 'Off,' 'Normal,' and 'Fast' settings all perform similarly, whereas the 'Faster' setting is much worse across its entire refresh rate range.
Like with the fast GTG sequence graph, you can look at these graphs in more detail with our tool and compare them to other monitors.
Compliance @ Max Hz
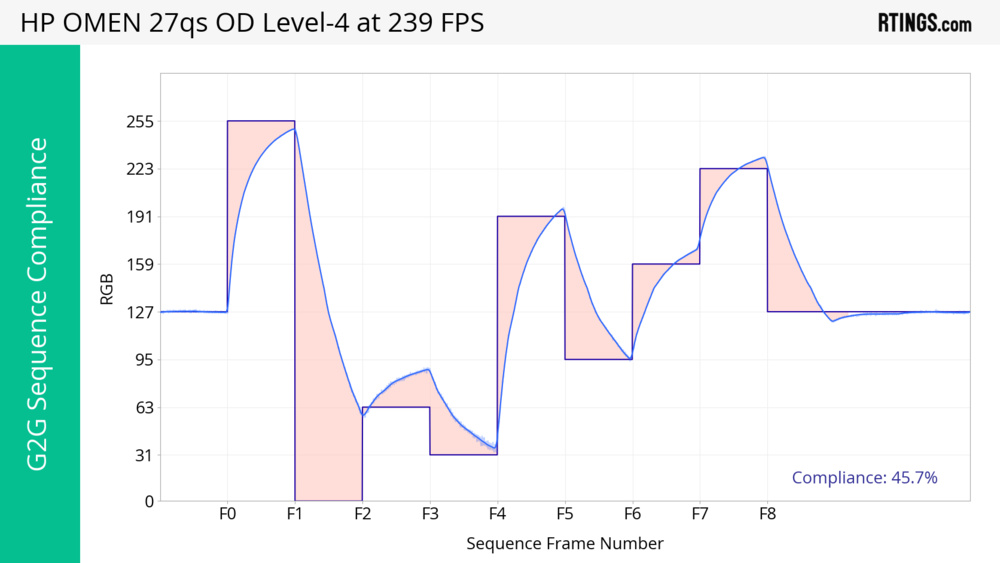
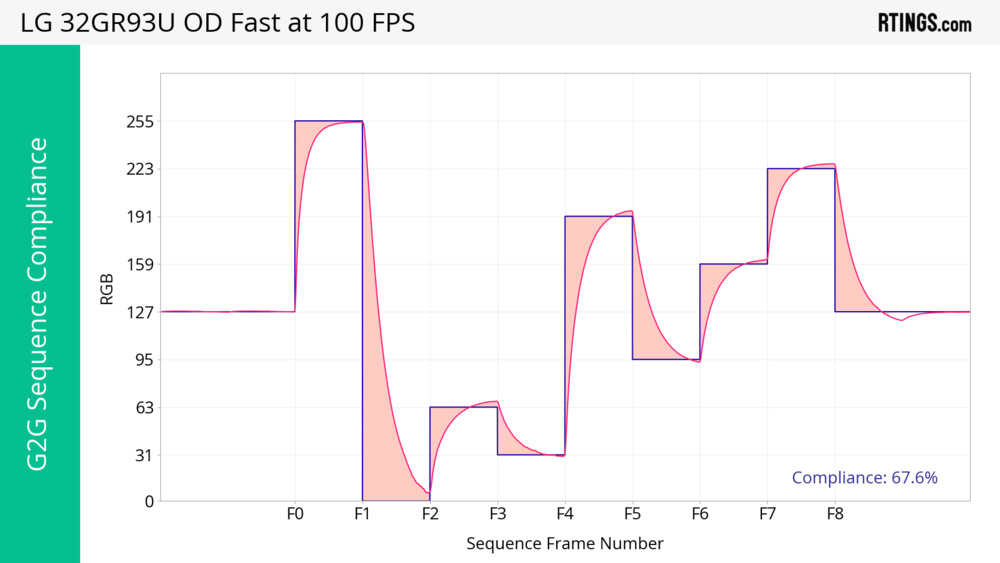
The refresh rate compliance we calculate is presented as a percentage of an ideal target RGB level at its recommended overdrive setting. Using the fast GTG graph, we can see the monitor's gray level vs an ideal level for each frame in the sequence, and its exact RGB levels during the transitions. Looking at the graphs below, you can see what an ideal transition is with the straight purple line. Comparing this purple line to the measured RGB level from each example, we can represent the time the monitor is away from the target with the light red area between the measured and ideal lines.
The larger the area, the more deviation it has from the ideal target value, with the refresh rate compliance being 100% minus the area of the red zones. In the case of the monitor on the left, it's away from its target 54.3% of the time, so it has 45.7% compliance, whereas the monitor on the right has 67.6% compliance because it's away from the target 32.4% of the time.
Although these graphs aren't in each review, they at least help you visualize how we calculate refresh rate compliance. We include the compliance at the monitor's max refresh rate so you can see how it performs, but this result doesn't count towards the overall score of Refresh Rate Compliance because each monitor has a different max refresh rate. This is also because monitors with higher frame rates have less frame time to make full color transitions, usually resulting in worse refresh rate compliance. However, that doesn't necessarily mean motion looks worse on them.
Compliance @ 120 FPS
The compliance at 120 fps uses the same calculation as the compliance at its max refresh rate, except it uses data from the fast GTG sequence at 120 fps with the recommended overdrive setting. This result is important for playing games at 120 fps and helps you determine how well a monitor performs at 120 fps compared to other displays.
Compliance @ 60 FPS
The compliance at 60 fps uses the same calculation as the compliance at 120 fps, except it uses data from the fast GTG sequence at 60 fps with the recommended overdrive setting. This result is important for playing games at 60 fps, like from console games, and it also helps you determine how well a monitor performs at 60 fps compared to other displays. That said, most monitors have their best compliance at 60 fps, as there's usually enough frame time (16.67 ms) for a pixel to make its full color transition.
Additional Information
Effect On Motion
To measure how well a monitor handles motion, we look at how quickly and effectively a pixel can transition from one color to another. We can then categorize and interpret that data to help us better understand different aspects of the overall pixel transition. Two of the most important aspects of a monitor's performance regarding motion are the total response time and the amount of overshoot. The total response time is the time it takes for a monitor to make a full color transition, and overshoot is the amount it goes past its target RGB level before making that full transition. Each of these is measured in time, whereas refresh rate compliance sees how much of the full transition the monitor can make in a certain time frame and is measured as a percentage and not time.
Response time and overshoot can also be translated into Cumulative Absolute Deviation (CAD), a single metric to identify how much blur there is behind fast-moving objects. CAD is one of the more important aspects of motion handling, but there are alternative ways to measure and present motion, one of which is refresh rate compliance. It's different from CAD because we want to know if the monitor is taking advantage of high frame rates and effectively making full pixel transitions. Ultimately, refresh rate compliance and CAD are related to each other, and both impact your gaming experience in terms of motion.
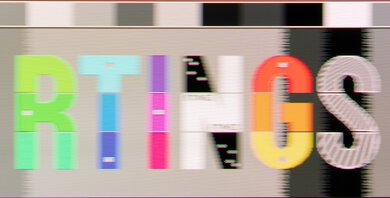
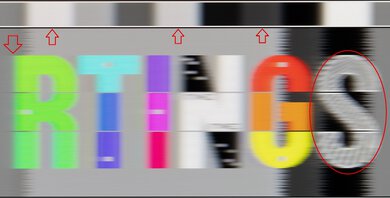
It's easy to get carried away in all the data of response time, overshoot, CAD, and refresh rate compliance, so a better way to see how this affects motion is by looking at our pursuit photos. Below, you can see photos from two monitors with a 240Hz refresh rate. The Dell monitor on the left is an OLED with a near-instantaneous response time, providing a benchmark of what motion should look like. The HP monitor on the right doesn't have such a fast response time, but CAD is still low enough, and it provides excellent motion handling. That said, you can see more blur on each letter, particularly with R, and the white-and-black pattern on the S isn't as sharp, making it harder to see details.
However, where refresh rate compliance has an effect is with the gray-to-gray bar on top. The pattern of this matches the gray-to-gray sequence that we use to calculate refresh rate compliance, and because it's moving from left to right on the screen, the pixels are going through the same transitions as during testing. Looking at the two photos, you can see in transitions where the pixels have to get brighter, the HP struggles to display the proper RGB target level, resulting in grays that are too dark. This is most noticeable in RGB 63, RGB 191, and RGB 223, which are highlighted with the arrows below. The Dell doesn't have the same issues; each color is clearly shown.
| Dell Alienware AW3225QF | HP OMEN 27qs |
| Avg. Cad: 13 | Avg. CAD: 131 |
| Refresh Rate Compliance: 89% | Refresh Rate Compliance: 43% |
 |
 |
You can see more examples of how compliance affects the appearance of the gray-to-gray sequence below, which are all at 120Hz. Although the differences are subtle and likely hard to notice in most situations, you can see that on monitors with higher compliance, there's more of a distinction between different gray levels.
| Samsung Odyssey G5/G55A S27AG55 | Dell G3223Q |
| 45% Compliance | 54% Compliance |

|
 |
| INNOCN 27M2V | AOC Q27G3XMN |
| 67% Compliance | 75% Compliance |

|
 |
Ultimately, there are many things to consider when evaluating a monitor's motion performance, but metrics like CAD and refresh rate compliance can help you see which monitors are better.
Panel Types And Their Refresh Rate Compliance
OLEDs have a near-instantaneous response time, where their pixels can change colors almost instantly, so they have the best compliance (and motion handling) from any panel technology. Although no monitors have 100% compliance, OLEDs are the closest to it.
There isn't a clear-cut winner between LED-backlit LCD panels (VA, IPS, TN) and the compliance changes on a per-monitor basis. That said, using the examples below, you can notice a trend between monitors: the compliance increases at lower refresh rates. This is because it's easier for a monitor to be compliant with lower frame rates due to their longer frame times.
You can learn about different LCD panel types here.
| Compliance | Corsair XENEON 27QHD240 (OLED) | LG 27GR93U-B (IPS) | AOC Q27G3XMN (VA) | BenQ ZOWIE XL2566K (TN) |
|---|---|---|---|---|
 |
 |
 |
 |
|
| Max Hz | 90% | 57% | 65% | 44% |
| 120 FPS | 95% | 62% | 75% | 73% |
| 60 FPS | 98% | 78% | 86% | 85% |
Does This Mean Your Monitor Is Useless?
Most of the examples we've included in this article show monitors that can't keep up with a high frame rate, and that's the case with most LED-backlit monitors. While OLEDs are the closest to 100% compliance, they're also expensive, and not everyone wants to get an OLED because of the risk of burn-in. The alternative would be to get an LED-backlit monitor, which has much worse compliance, but then you're probably wondering if the monitor is useless for playing games at high frame rates.
The short answer is no; you can (and should) still play games at high refresh rates. Ultimately, playing at the highest refresh rate that your setup allows results in the best gaming experience with smoother motion and lower input lag than you would get at a lower refresh rate. Of course, if you care about this, getting a monitor with higher compliance than the rest of the market is important, but it's important to know that you'll never get 100% compliance.
As monitor technology continues to improve, we hope that monitors coming out in the next few years improve their compliance, which would benefit any gamer.
Conclusion
Refresh rate compliance is a calculation of how well a monitor can effectively make pixel color transitions before the screen refreshes. It's a percentage of an ideal transition, with higher compliance being better, resulting in improved motion handling with colors close to the intended image. Although no monitors have 100% compliance, OLEDs tend to have the highest compliance due to their near-instantaneous response time. On top of that, it's easier for monitors to have higher compliance at lower refresh rates, so if you care about this, it's important to look for a monitor with high compliance close to its max refresh rate.
We calculate refresh rate compliance by measuring a gray-to-gray sequence with nine frames of various gray levels from pure black to pure white. We use a specialized tool to measure the RGB level of the monitor to compare it to an ideal level and represent it as a percentage of the target level. We also test for the refresh rate compliance at various overdrive levels that a monitor may have so you can see how each performs.
