See the previous 1.11 changelog.
Goal
TV 2.0 represents a significant change in our TV testing. The culmination of thousands of hours of research & development, nearly every aspect of our TV reviews has been changed in some way, from test coverage to the individual objective scoring splines. We've also added new reflection tests, changed how we measure color volume, and completely overhauled our response time testing. We've also completely restructured our reviews, as some sections like "Picture Quality" were getting very long, making it hard to find specific sections. We now group related tests together, making it easier to find the information you care the most about.
Structure
One of the first things you'll notice when you open a review on TV 2.0 is that we've completely changed the structure. Some of our old sections, like Picture Quality, were getting very long and filled with tests that not everyone cared about. To remedy this, we've restructured the reviews to show the most important tests first. Instead of 6 main test categories on TV 1.11, we've broken down TV 2.0 into 12 separate sections. These sections more or less match the usages at the top of the review.
Scoring
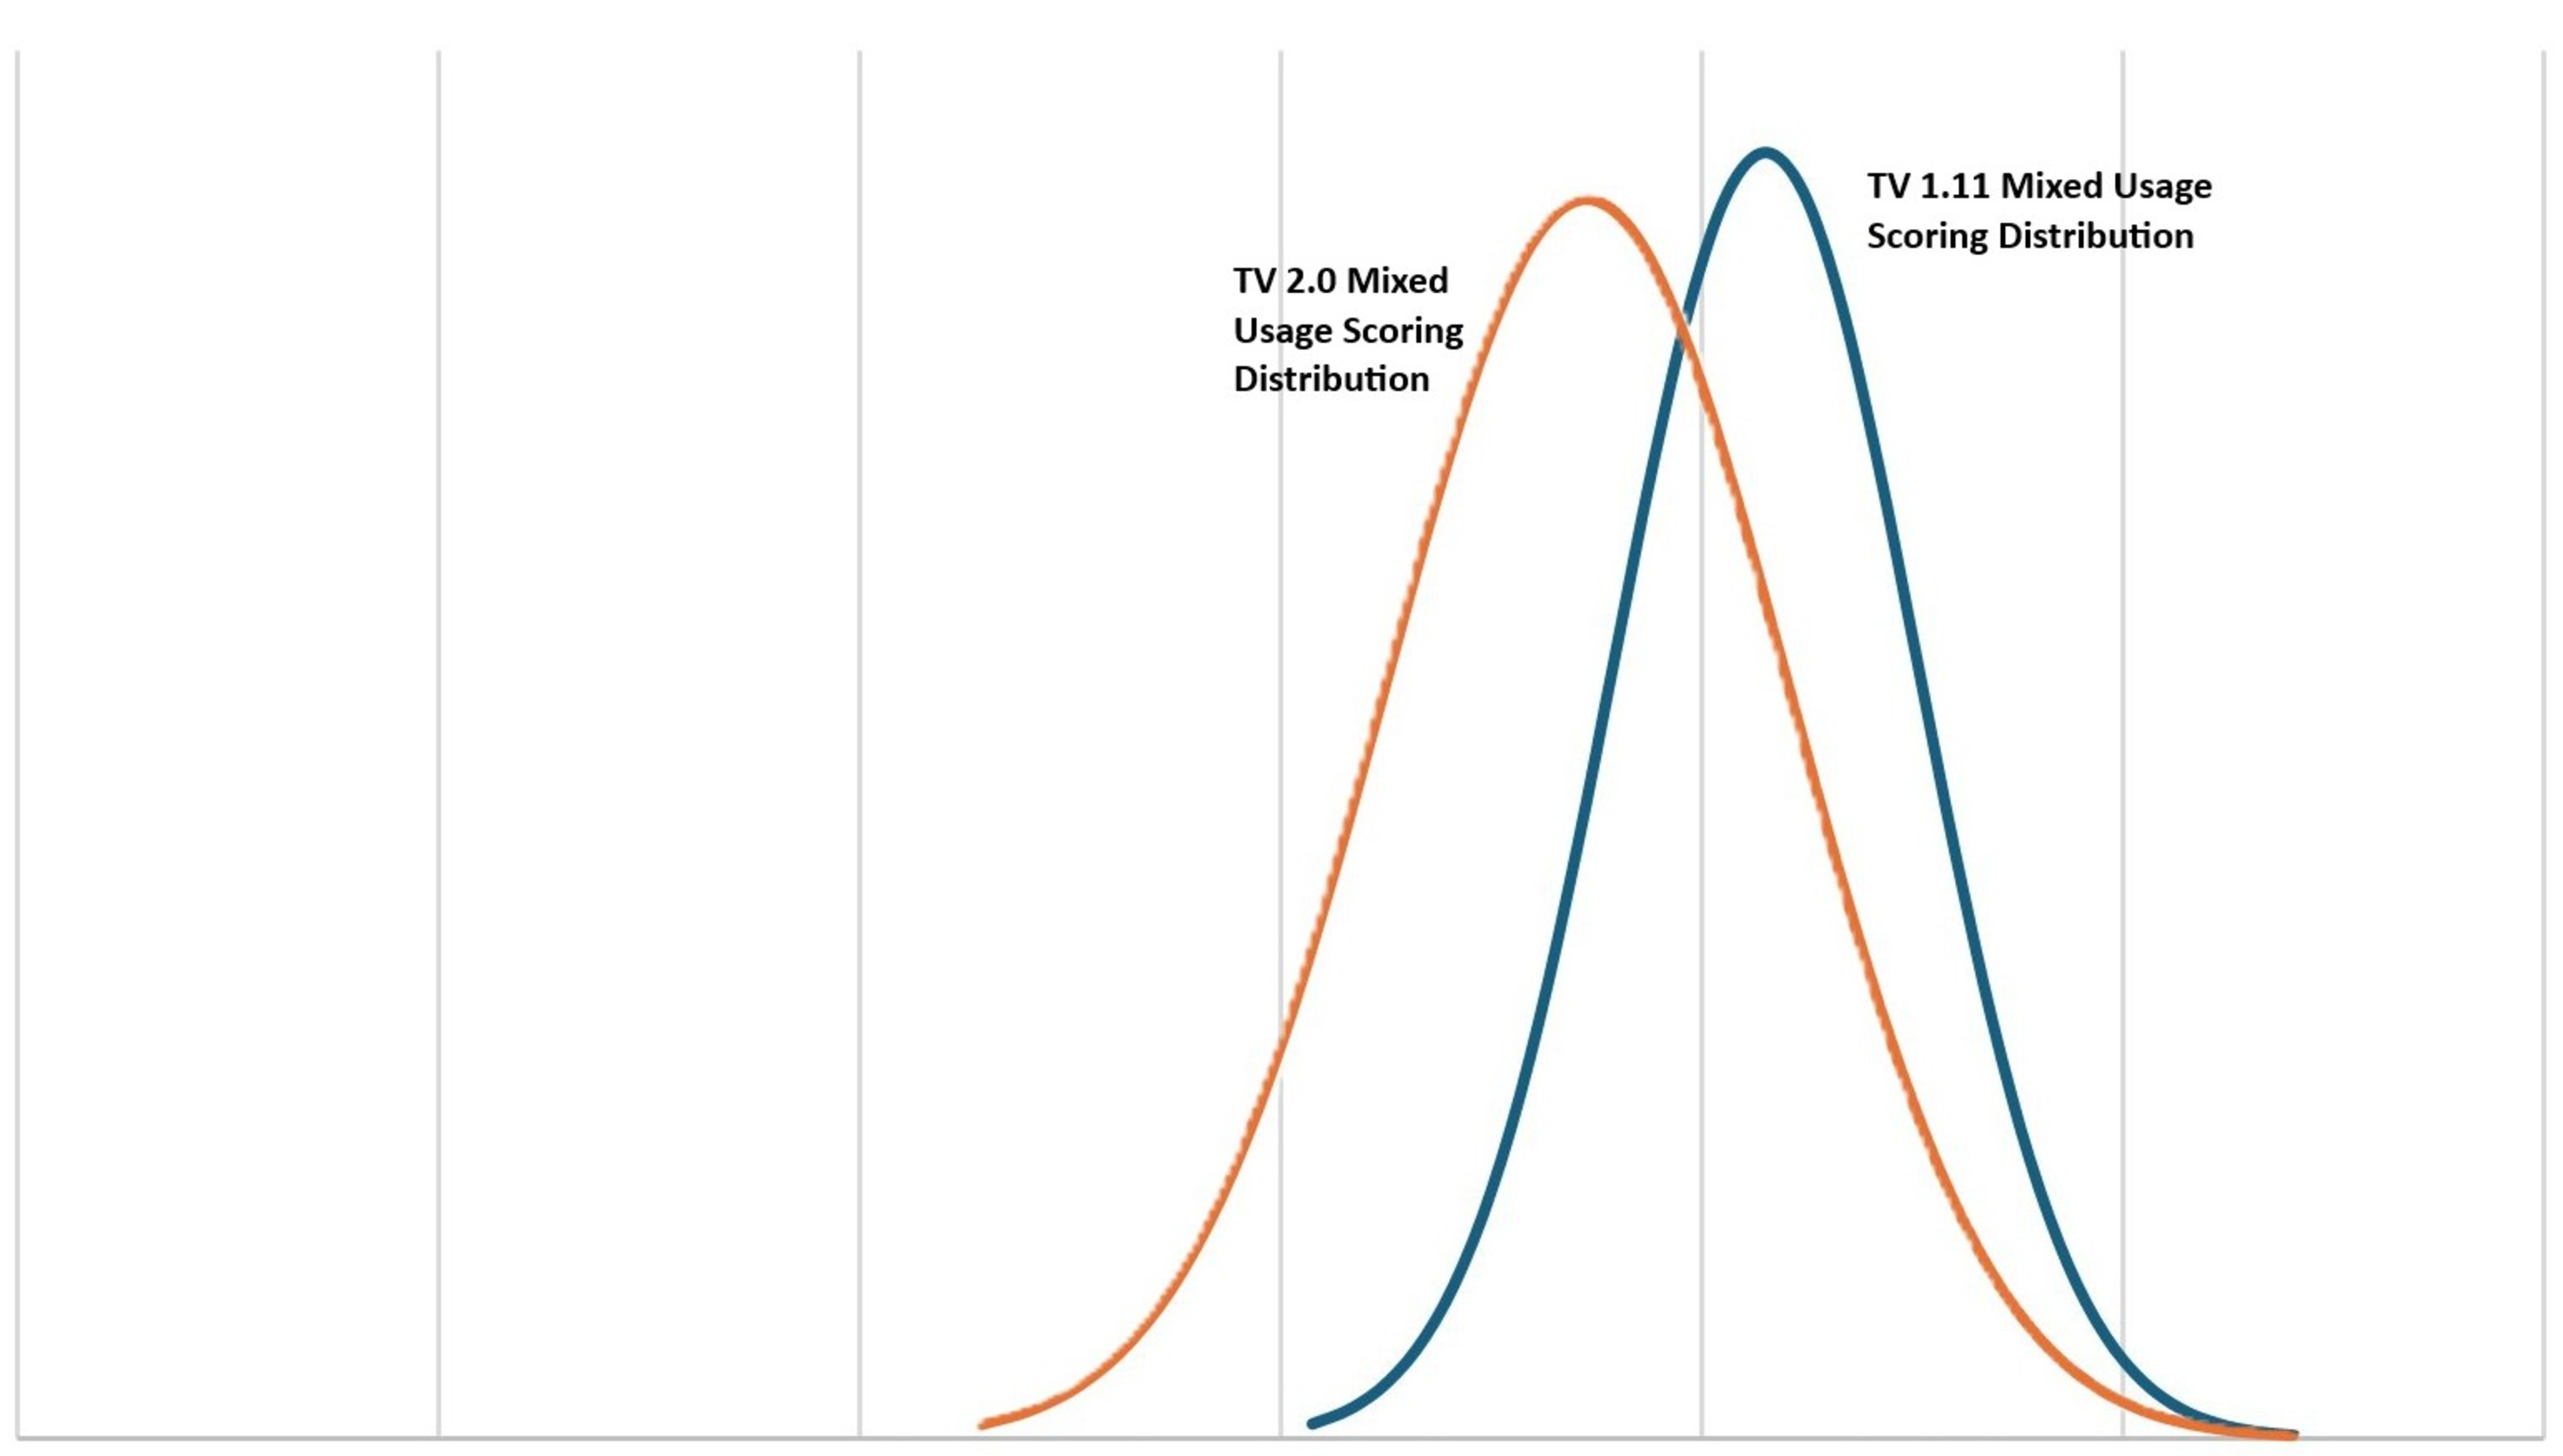
From individual test scores to usages at the top of the review, TV 2.0 represents the biggest change to our scoring we've ever made. Most TVs score significantly lower, which better represents how they actually perform. The mixed usage score, for example, has decreased by an average of 0.7, but the difference is even more noticeable at the low end of the market, with many cheap TVs now scoring in the deep red. While there can still be a market for some of these TVs, if you care about picture quality and performance, the scoring now better reflects the overall experience with these TVs.
Usage Scores
| Usage Name | Change | Description |
|---|---|---|
| Mixed Usage | Updated | Revamped weights to use individual scores instead of other usages. |
| Sports | Updated | Significantly increased the weight of SDR Brightness, adjusted other weights down. |
| Video Games | Updated | Renamed to 'Gaming,' simplified weights. |
| HDR Movies | Updated | Renamed to 'Home Theater.' Simplified scoring breakdown. |
| TV Shows | Removed | Replaced with Bright Room. |
| HDR Gaming | Removed | Updated the Gaming usage to cover HDR as well, so this usage is no longer needed. |
| PC Monitor | Removed | Removed for now, but we'd like to revisit this if there's enough interest. We're missing a few key tests like text clarity. |
| Bright Room | New | New usage. Covers watching TV and movies in a bright room. |
| Brightness | New | New performance usage. |
| Black Level | New | New performance usage. |
| Color | New | New performance usage. |
| Processing (In Development) | New | We're in the process of improving our tests related to image processing, but this score should give you a general idea of how a TV performs overall with its image processing capabilities. |
| Game Mode Responsiveness | New | New performance usage. |
| Motion Handling (Broken) | New | We're in the process of fixing the way we evaluate a TV's overall motion handling. This section is currently broken, and the score isn't indicative of how well a TV handles motion overall. |
Test Changes
| Test Group | Change | Description |
|---|---|---|
| Accelerated Longevity Test | Removed | None of the TVs that are running on this test will be updated to 2.0. |
| Contrast | New Methodology | Adjusted the test pattern to now take two sets of measurements. Adjusted the scoring curve. |
| Blooming | Updated | Renamed to 'Lighting Zone Precision'. The philosophy of the test has changed, we're now looking at how precisely the TV's local dimming can display a bright highlight without bleeding into surrounding areas, so TVs with no local dimming are now scoring a '0' on this test. |
| HDR Brightness | Updated | Adjusted the scoring to only look at peak brightness. ABL and sustained brightness are no longer scored. Adjusted the scoring splines. |
| HDR Brightness In Game Mode | Updated | Adjusted the scoring to only look at peak brightness. ABL and sustained brightness are no longer scored. Adjusted the scoring splines. |
| PQ EOTF Tracking | Updated | Adjusted the scoring splines. |
| SDR Brightness | Updated | Adjusted the scoring to only look at peak brightness. ABL and sustained brightness are no longer scored. Adjusted the scoring splines. |
| Color Gamut | Removed | |
| SDR Color Volume | New | |
| Color Volume | Updated | Renamed to 'HDR Color Volume'. Adjusted the scoring splines. |
| Pre Calibration | Updated | Renamed to 'SDR Pre-Calibration Color Accuracy'. Scoring weights changed slightly. |
| Post Calibration | Updated | Renamed to 'SDR Post-Calibration Color Accuracy'. Scoring weights changed slightly. |
| HDR Pre-Calibration Color Accuracy | New | |
| HDR Post-Calibration Color Accuracy | New | |
| Gray Uniformity | Updated | Adjusted the scoring splines and individual weights. |
| Black Uniformity | Updated | Adjusted the scoring splines and individual weights. |
| Viewing Angle | Updated | Adjust the scoring splines. |
| Reflections | Removed | Replaced by the four new tests listed below. |
| Total Reflected Light | New | |
| Direct Reflections | New | |
| Ambient Black Level Raise | New | |
| Ambient Color Saturation | New | |
| Panel Technology | Updated | Added SPD chart. |
| Response Time | New Methodology | Changed to new pursuit photo. Added heatmap and new transition charts. Replaced 80% and 100% response time measurements with First Response Time, Total Response Time, and Worst 10% Response Time. |
| CAD In Game Mode @ Max Refresh Rate | New | |
| CAD In Game Mode @ 120Hz | New | |
| CAD In Game Mode @ 60Hz | New | |
| Flicker-Free | Updated | Renamed to 'Flicker,' and removed score. |
| Black Frame Insertion (BFI) | New Methodology | Changed to new pursuit photo. |
| Stutter | Updated | Adjusted scoring spline and weights. |
| Variable Refresh Rate | Updated | Removed 1440p tests. Adjusted scoring splines. |
| Input Lag | Updated | Removed 1440p tests. Changed 144Hz tests to max refresh rate. Adjusted scoring splines. |
| Supported Resolutions | Updated | Removed 1440p tests. Adjusted weights. |
| HDR Format Support | New | Moved from Inputs Specifications. |
| Inputs Specifications | Updated | Moved HDR tests to new box. Renamed 'HDMI 2.1 Class Bandwidth' to 'HDMI 2.1 Rated Speed.' Removed outdated tests. |
| Total Inputs | Removed | Combined with the Inputs Specifications box. |
| Sound | Updated | Removed distortion test. Added test for Digital Room Correction. |
| Interface | Updated | Removed performance tests. |
| Apps & Features | Removed | |
| Remote | Updated | Removed subjective tests. |
| TV Controls | Updated | Added a 'Mute Switch' test |
Usage Scores
 |
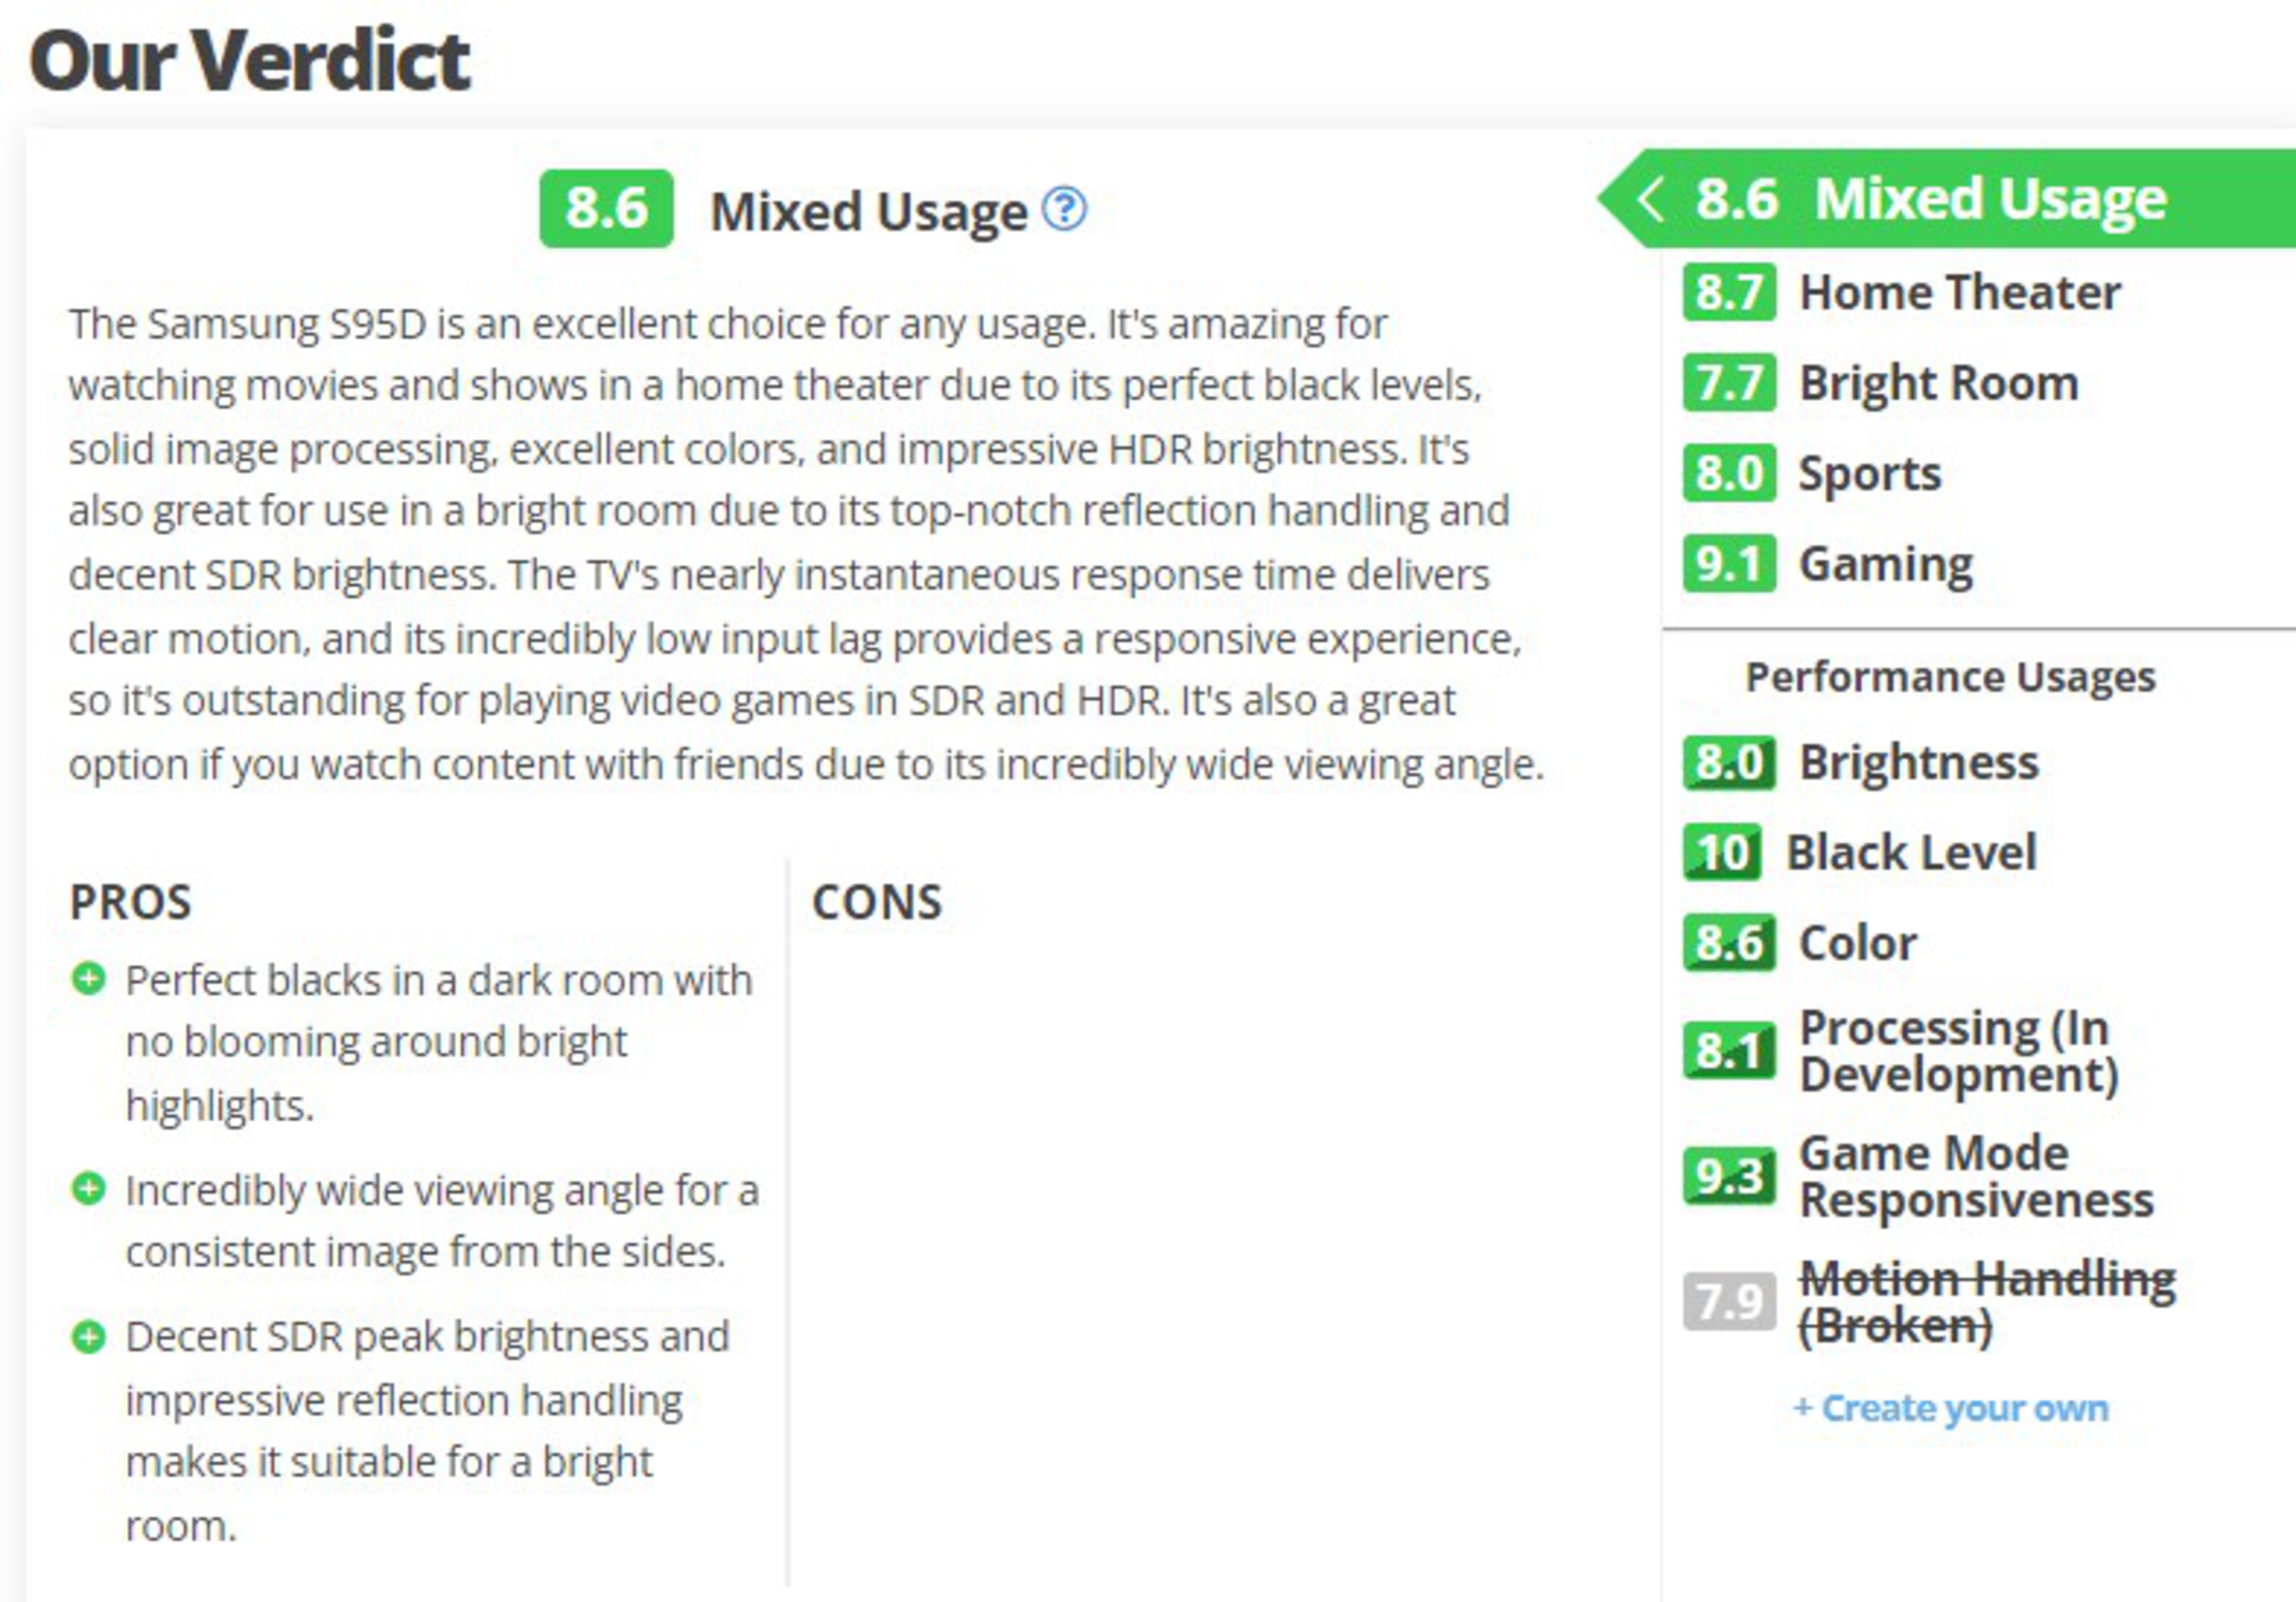 |
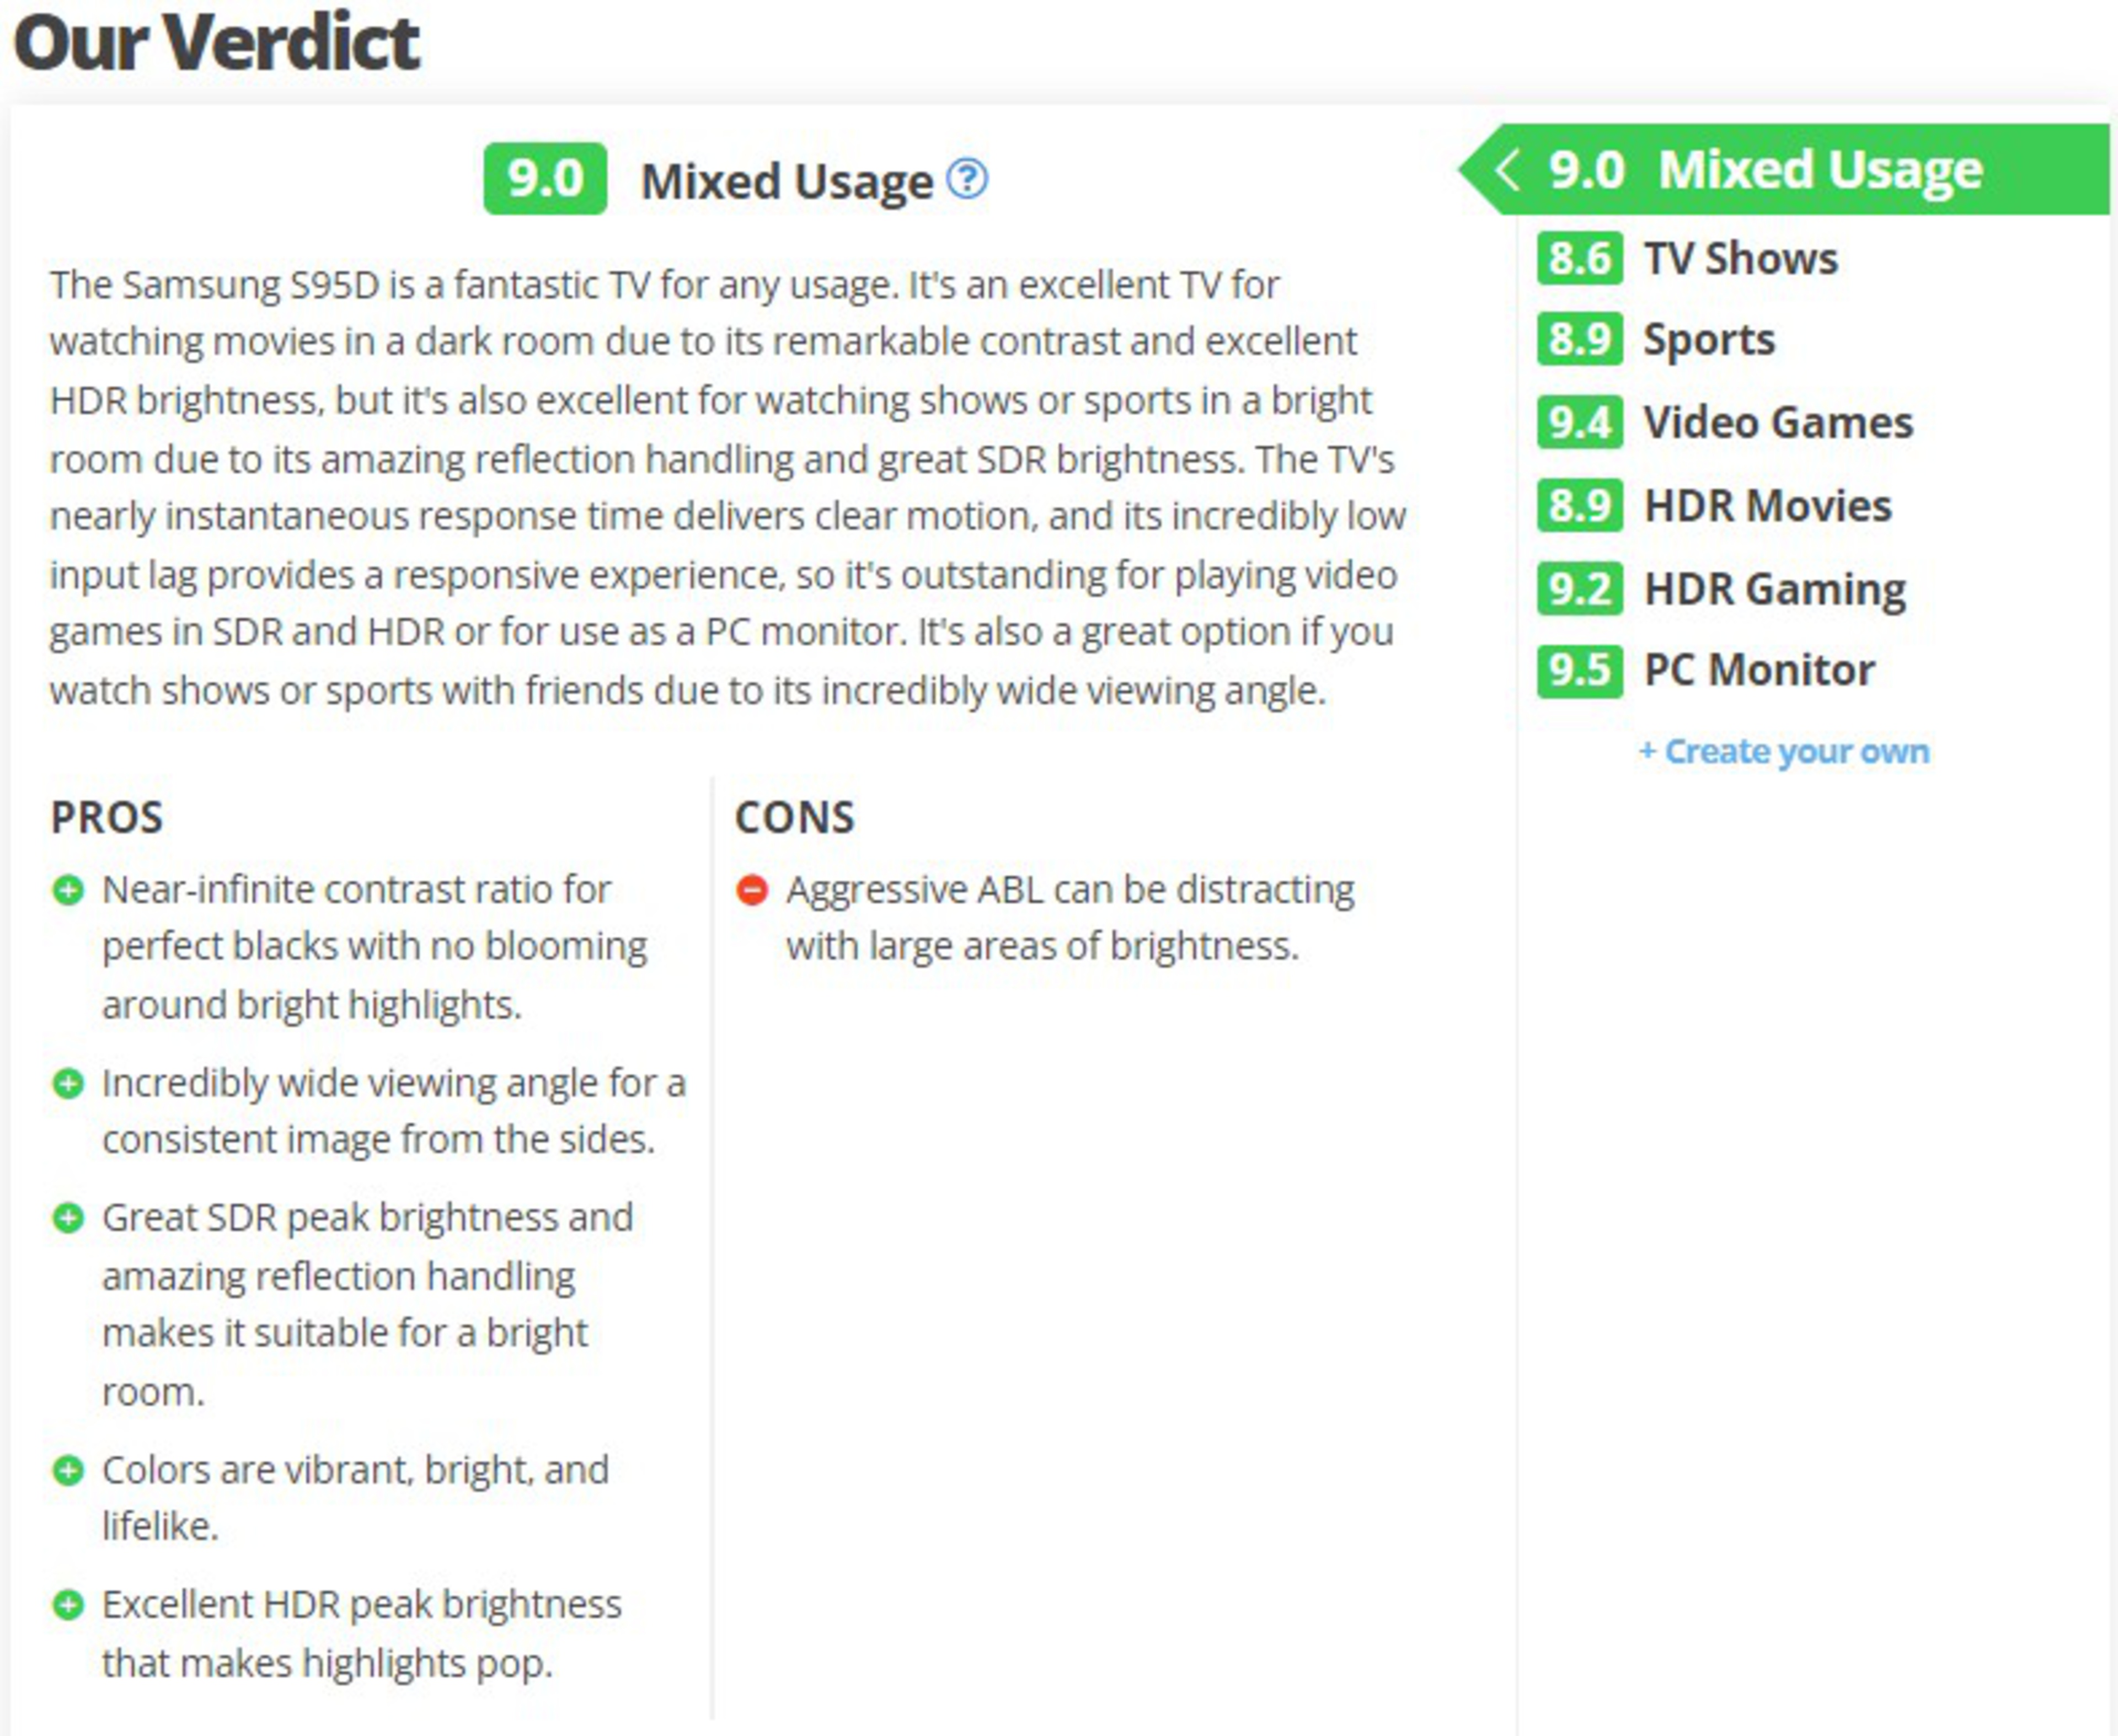
We've completely revamped our usage scores. We've removed a few outdated usages and simplified others. We've also added new Performance Usages to TV reviews. These usage scores look at specific aspects of a TV's performance, so if you care about brightness, for example, you just have to look at the Brightness score to understand how well the TV performs in that aspect. Some of these new performance usages are very much a work in progress. Processing is lacking some key tests that we're still working on, and our motion handling usage is decidedly broken. We're including them anyway because we want your feedback. What tests do you think we should feature in those usages? Let us know in the comments!
| Usage | 1.11 | 2.0 |
|---|---|---|
| Mixed Usage |
|
|
| Sports |
|
|
| Video Games - Renamed to 'Gaming' |
|
|
| HDR Movies - Renamed to 'Home Theater' |
|
|
| Bright Room | N/A |
|
| Brightness | N/A |
|
| Black Level | N/A |
|
| Color | N/A |
|
| Processing (In Development) | N/A |
|
| Game Mode Responsiveness | N/A |
|
| Motion Handling (Broken) | N/A |
|
As you can see, we've greatly simplified most usage scores to better reflect what people care about with each usage. We also removed the TV Shows, HDR Gaming, and PC Monitor usages. We'd like to revisit the PC Monitor usage in a future update, but we're missing a few key tests that people care about.
Contrast
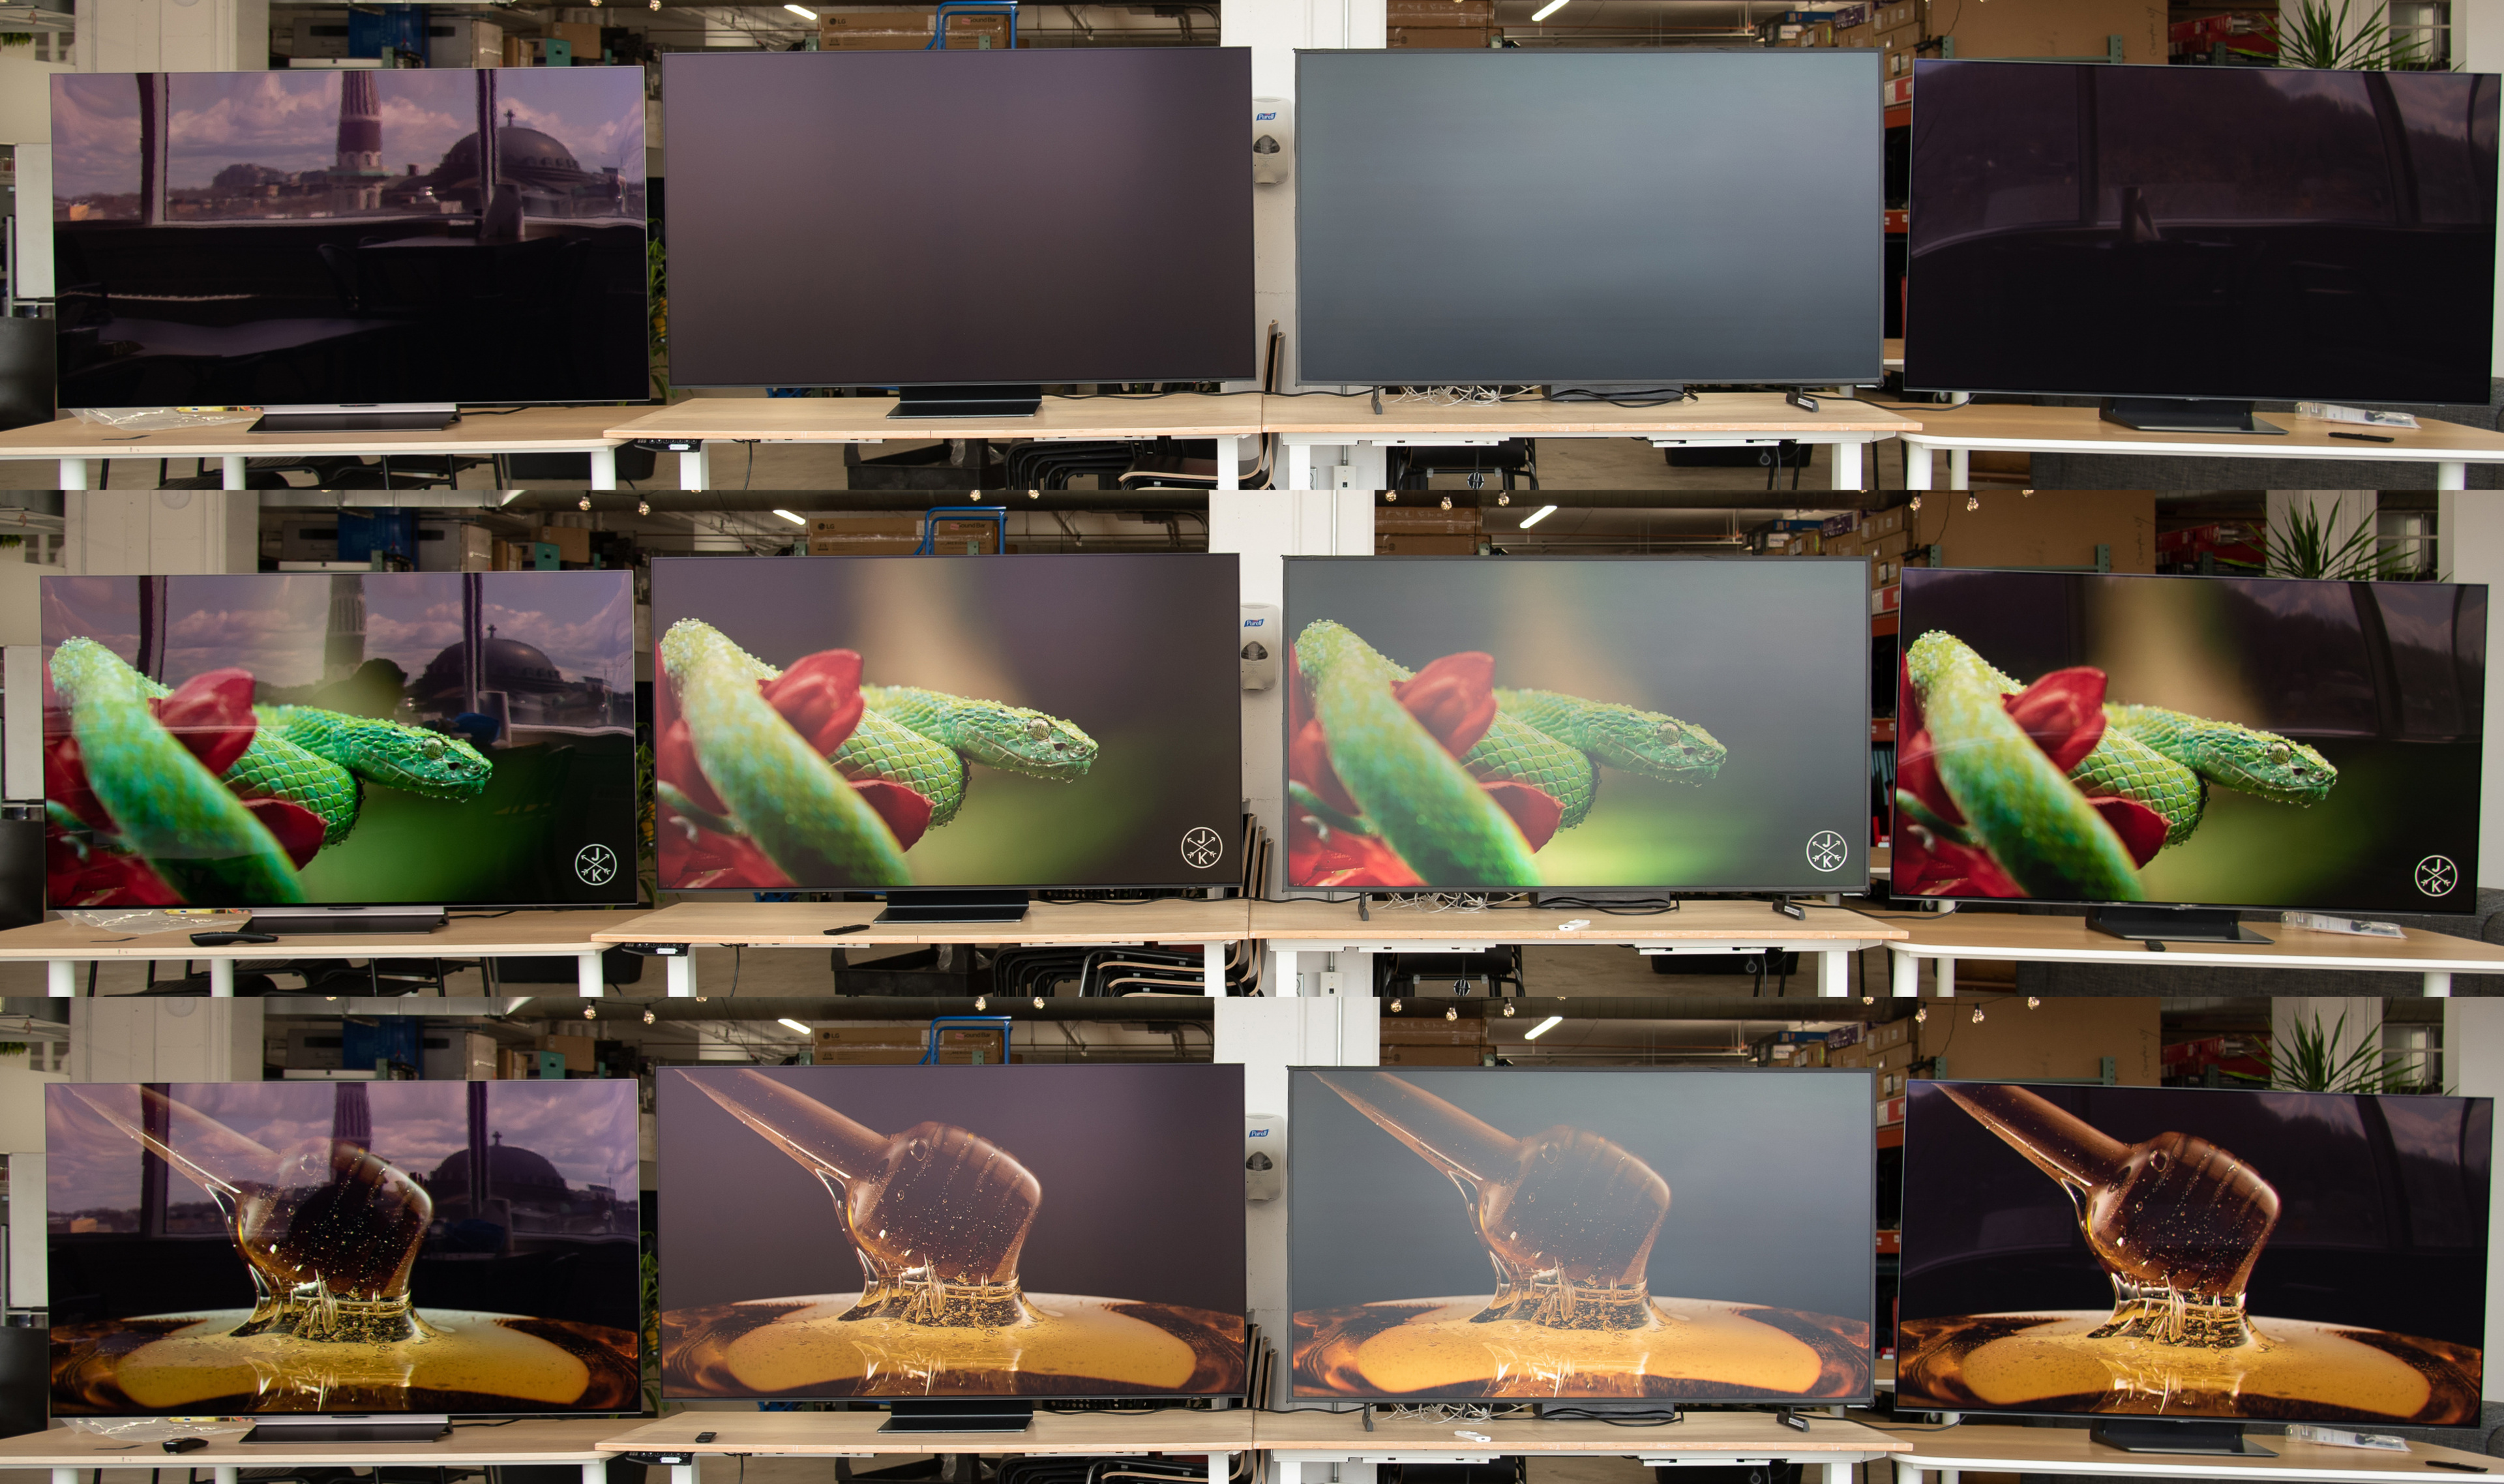
The changes to our contrast test in TV 2.0 are minor but far-reaching. Instead of displaying the single image of the cave opening, we now display it twice, with the second image a mirror flip of the first one. We take measurements on the left and right sides of the test image and average them out. This gives a more realistic black level for displays with noticeable vignetting or poor black uniformity. We've also adjusted the overall scoring curve to be stricter, increasing the definition of "good" contrast from 15,000:1 to 80,000:1.
Blooming
This test has been renamed from 'Blooming' to 'Lighting Zone Precision' to better define the philosophy behind it. We still run the test the exact same way, but instead of looking at it as the amount of light that blooms into dark areas caused by the local dimming, we're now looking at it as how precisely the local dimming feature can display a single point of bright light. One of the issues with the old approach to this test was that TVs that didn't have local dimming at all scored a 10. Since TVs without local dimming can't display a single point of bright light with any precision, they now score a 0.
Brightness
There are no changes to how we run the HDR Brightness test in this update, but we've changed the scoring a bit. Sustained brightness isn't a very representative test, as even TVs that perform badly on this test rarely do so with real content. With that in mind, we've decided to remove the scores from the sustained brightness measurements and the ABL calculation. The data is still there, so if you care about this, you can still see how each TV performs, but it's no longer part of the scoring. We've readjusted the scoring weights to place an even greater emphasis on our real scene tests. We've also adjusted the scoring splines across each individual test. TVs have become much brighter in recent years, so we expect higher brightness levels.
These changes have been applied to the HDR Brightness, HDR Brightness In Game Mode, and SDR Brightness boxes. The scoring curves for the SDR Brightness box are different from HDR.
PQ EOTF Tracking
The changes to this test are minor. We've adjusted the scoring splines for all three curves, instead of < 0.018, the threshold for a good result on this test has been decreased to < 0.008.
Color Gamut
The color gamut test has been removed completely, as the 2D chromaticity plots much of the industry uses are no longer considered to be a valid way to measure chromaticity. Gamut rings have replaced this test.
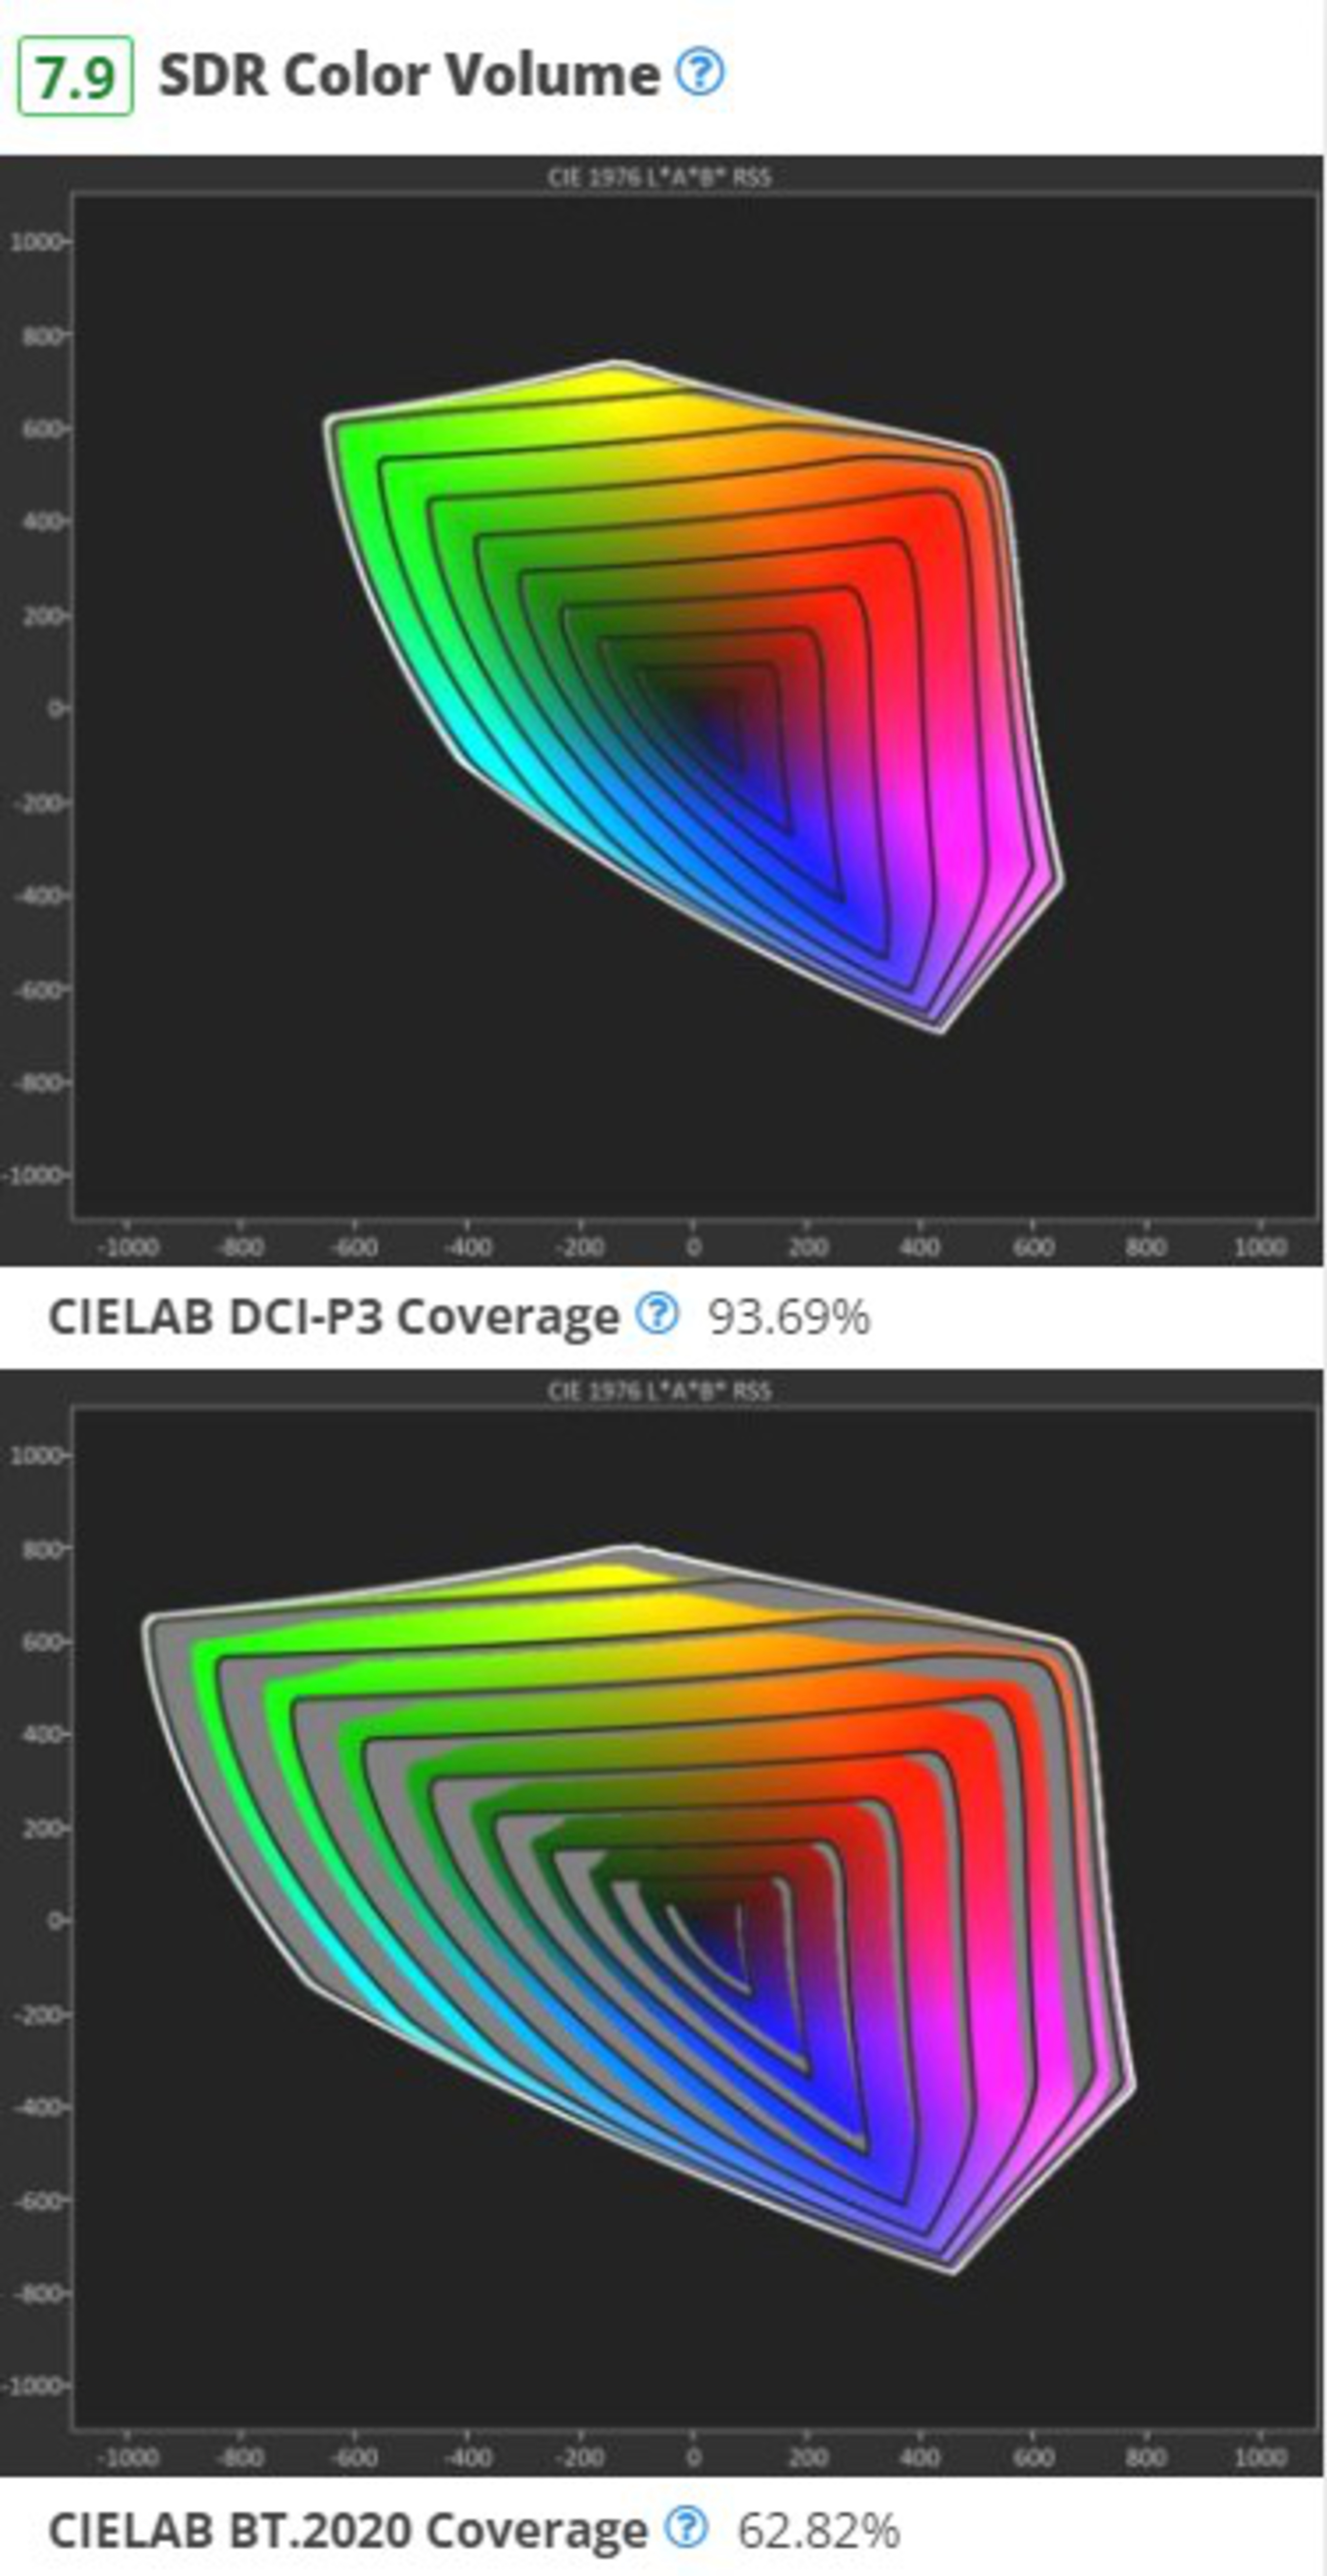
SDR Color Volume
 |
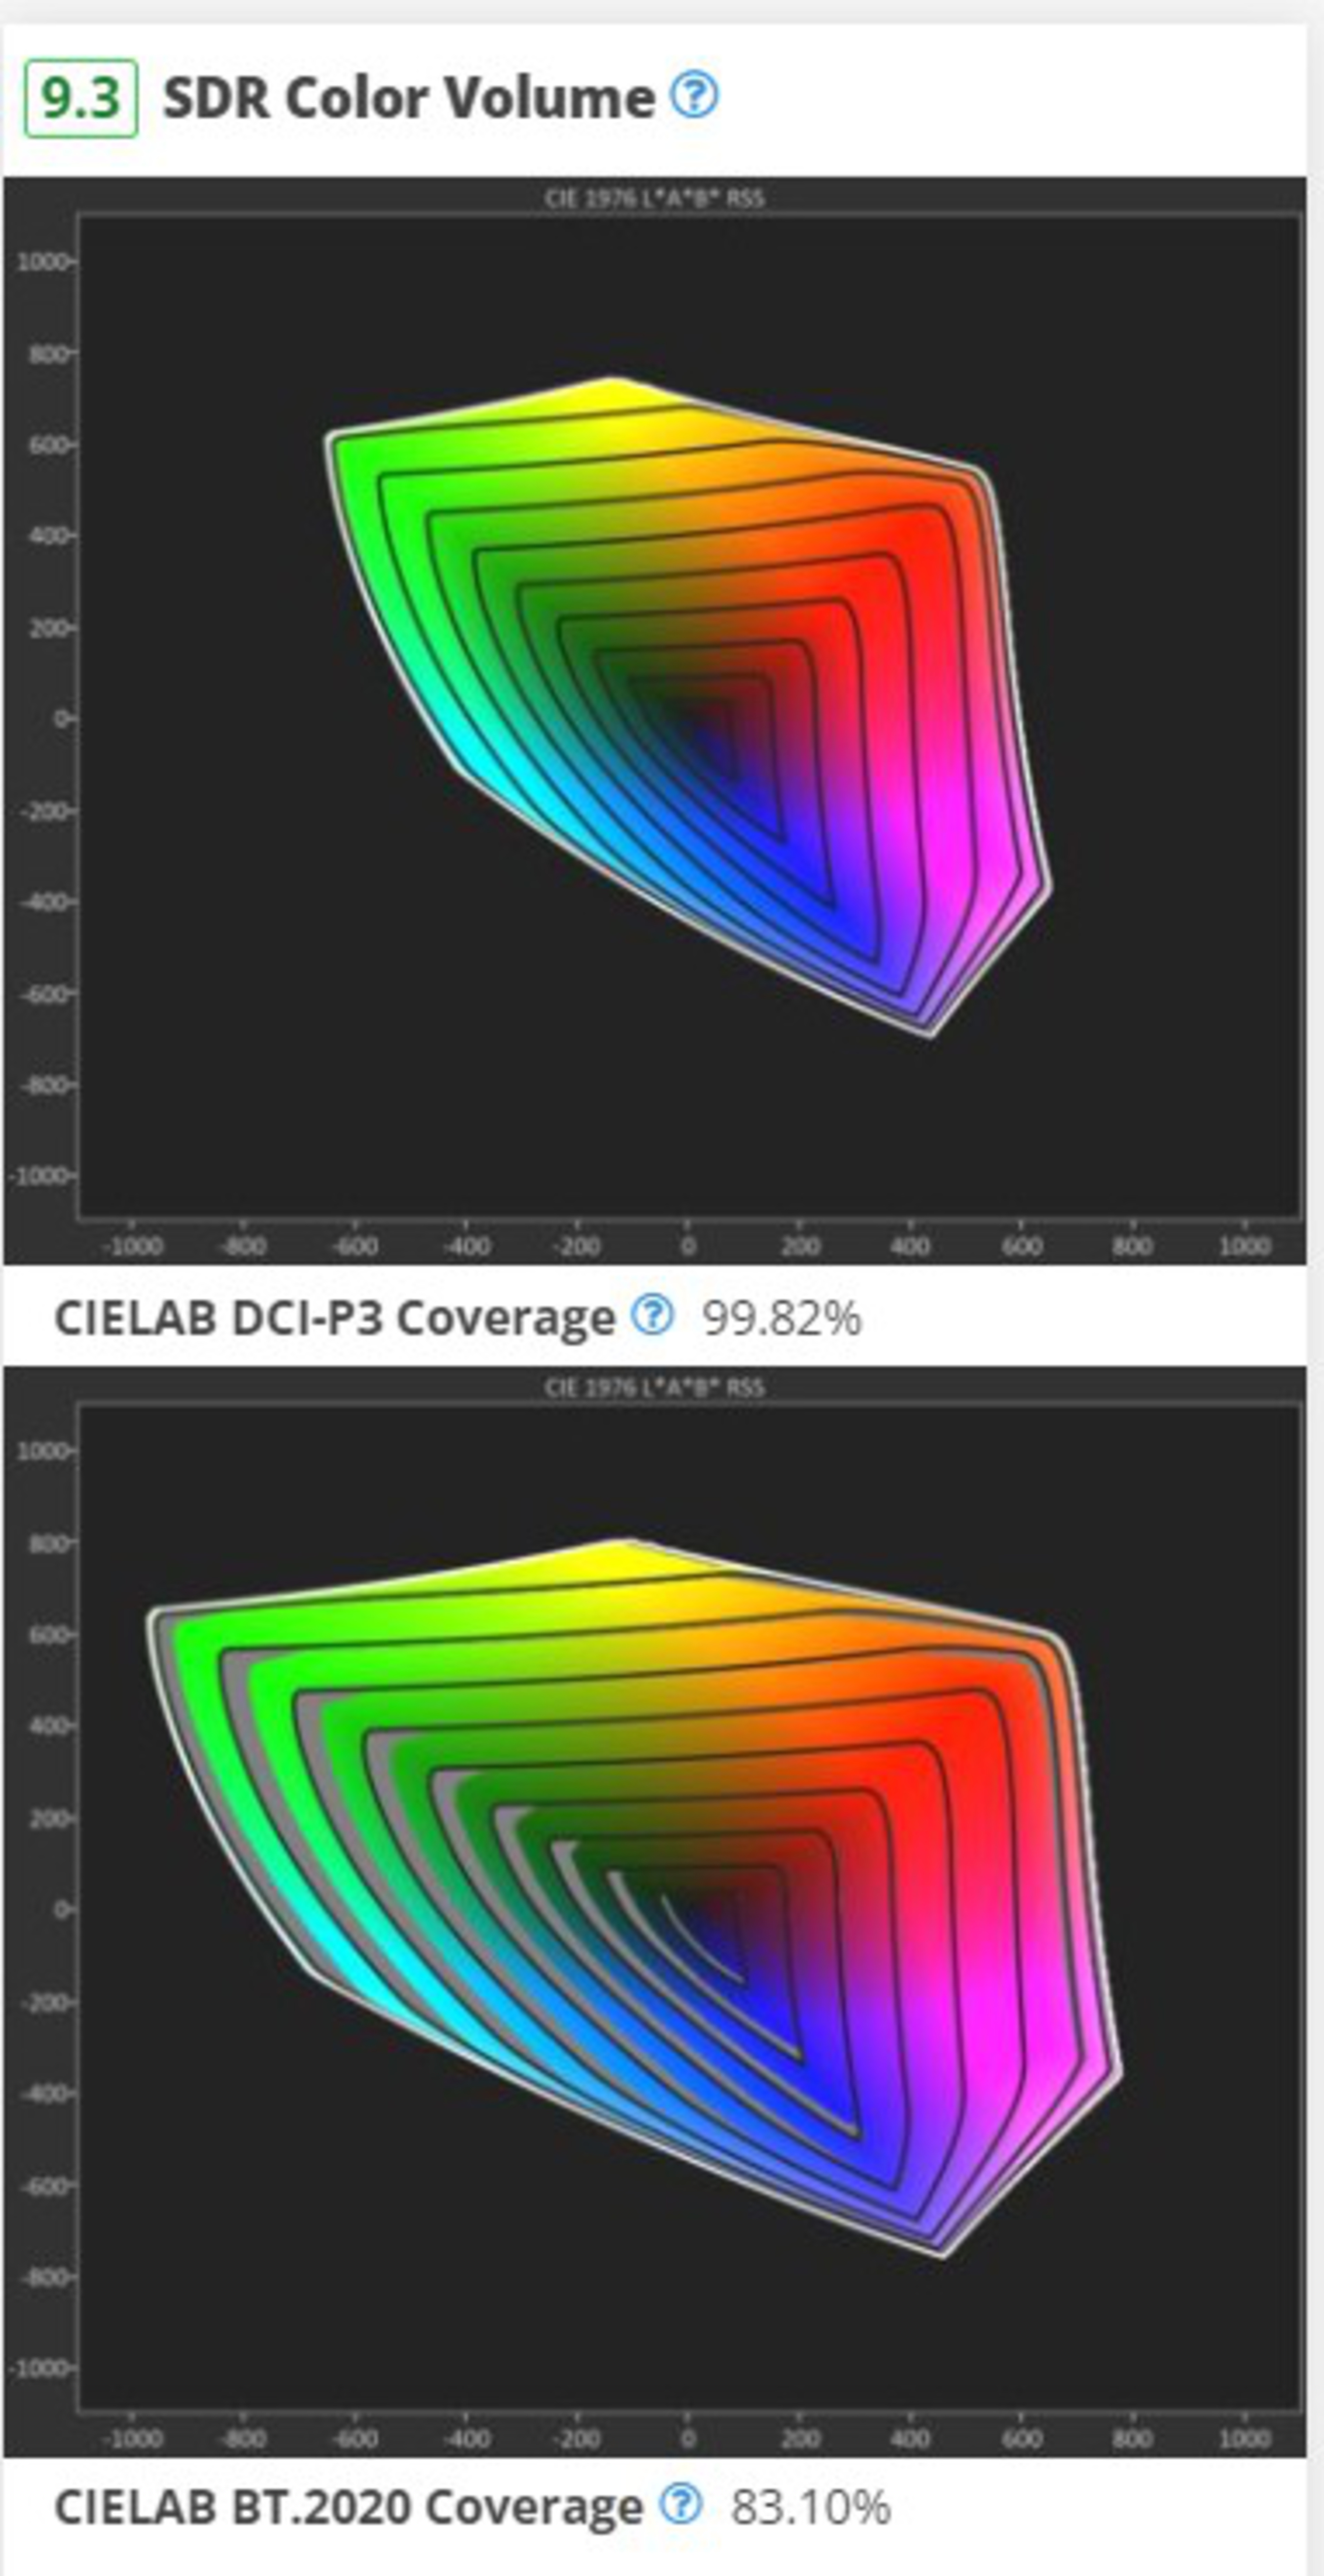 |
Gamut rings are a new way of looking at color volume in SDR by splitting it into rings of increasing lightness, from 0 to 100. We take over 600 individual measurements to produce the rings shown above. As you move from the center out, each ring increases in lightness, and the gray area in each ring shows the parts the TV can't display. This makes it easier to see differences between panel types that weren't very obvious in our previous tests. As you can see above, colors on the LG C4 are noticeably desaturated at high lightness levels. The benefits of the S95D, which doesn't rely on a white subpixel to boost brightness, are immediately apparent.
Color Volume
This has been renamed to 'HDR Color Volume' to avoid confusion with the above test. Other than that, this test is pretty much the same as it's been for a while. We've adjusted the scoring spline slightly, moving the good value for 10,000 cd/m² BT.2020 Coverage ITP from 30% to 35%.
Pre-Calibration/Post-Calibration
These two tests have been renamed to 'SDR Pre-Calibration Color Accuracy' and 'SDR Post-Calibration Color Accuracy,' and the weight of each test in the overall score has been adjusted slightly.
HDR Pre-Calibration/Post-Calibration Color Accuracy
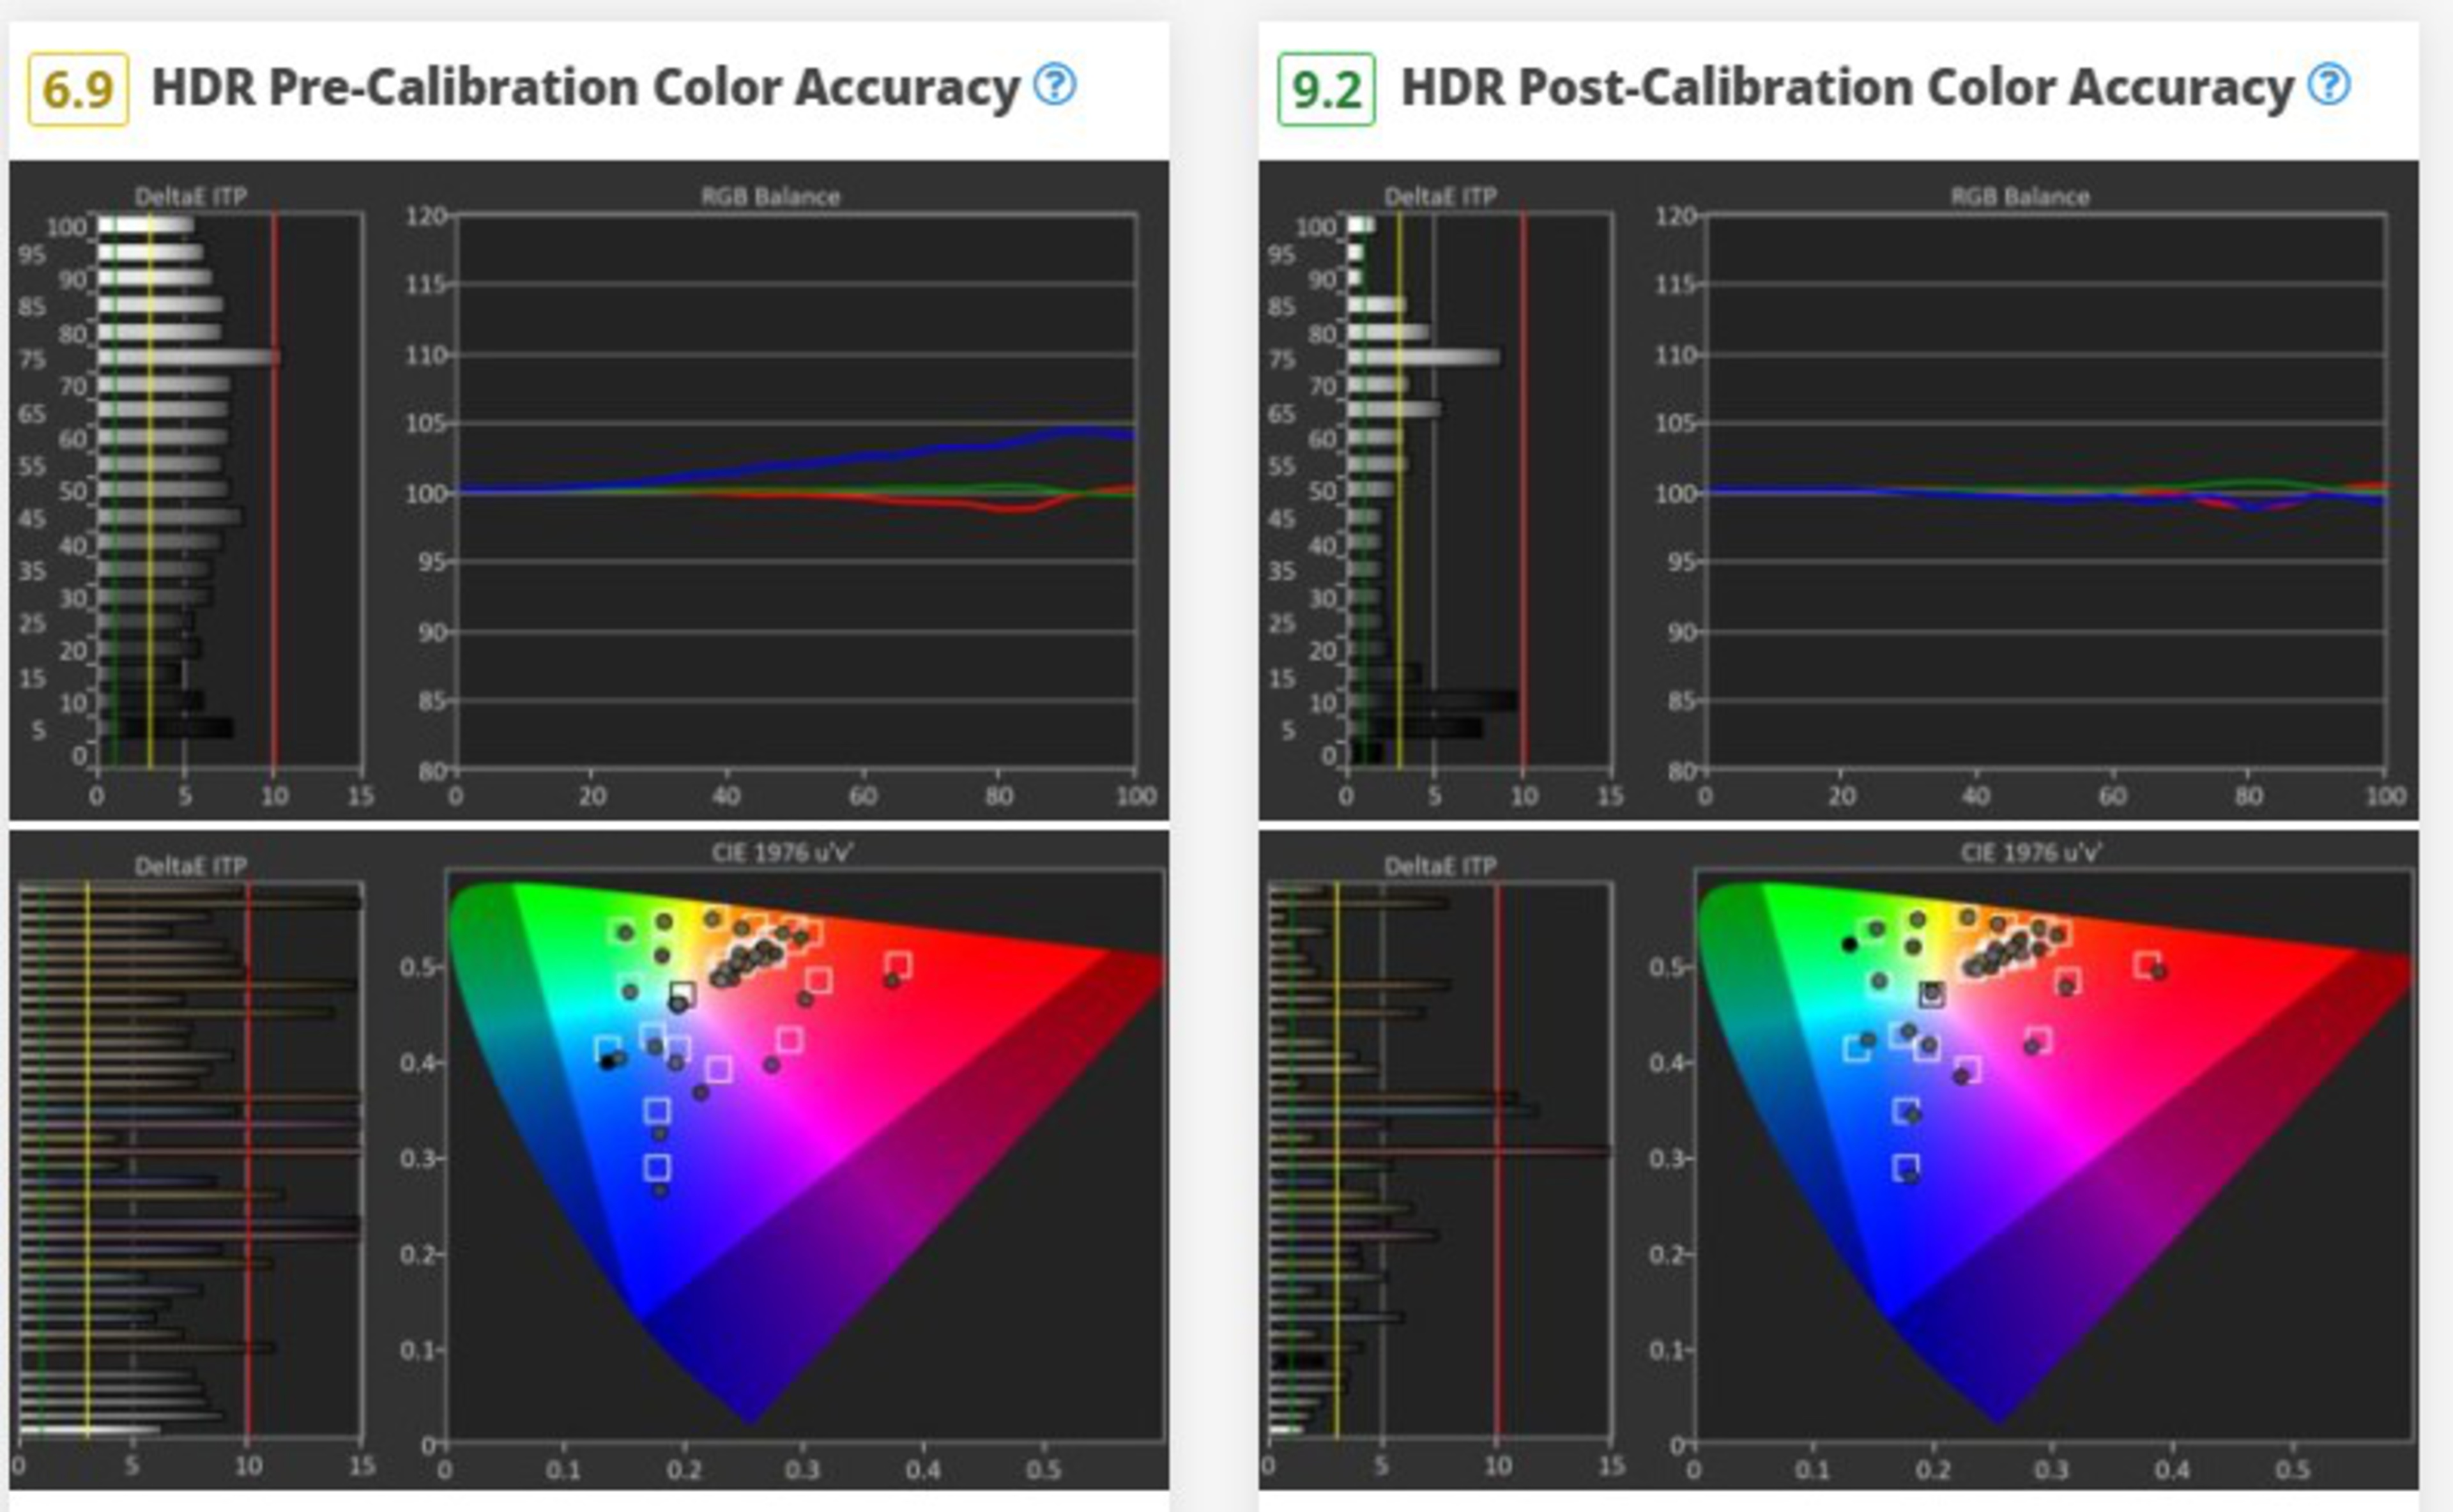
We can't talk about HDR without talking about creative intent, but until now, we've only been able to talk about the range of brightness and colors that a TV could display. Besides our PQ EOTF test, we couldn't really talk about how well a TV tracks creative intent. TV 2.0 takes one small step closer to answering those questions, as we now measure the white balance dE, color dE, and the overall color temperature in HDR10. We do this twice, once with the TV in its most accurate pre-calibration settings and again after calibrating it.
Gray Uniformity
Although we've not changed how we run this test, we've updated the scoring splines and weights to better reflect how TVs look in person. The scoring splines were a bit too generous before, and it wasn't possible for any TV to score below a 5 or a 6 on certain tests. We've corrected this, and most TVs are now scoring lower.
Black Uniformity
Similar to the Gray Uniformity test above, we've slightly adjusted the scoring splines for this test. The differences aren't as significant, but again, most TVs are scoring a bit worse than they used to.
Viewing Angle
Again, we've slightly tweaked the scoring splines for our viewing angle test. Some of the recent QD-OLED releases, like the Samsung S95D, have incredibly wide viewing angles, remaining accurate beyond 70°, but our scoring didn't look beyond that angle. We've adjusted the splines to account for this. We've also slightly adjusted the scoring splines, but unlike most of the changes we've made, this time, we decreased the 'Good' value. We've heard from a lot of you that our viewing angle scoring is a bit harsh, so we're adjusting the scoring a bit. Most TVs are scoring slightly higher on 2.0 than they were on 1.11.
Reflections
Last year's Samsung S95D OLED, with its matte coating and QD-OLED panel, exposed some limitations in our reflections handling. There are pros and cons to any TV coating, but other than measuring the pure intensity of reflections, we didn't really have any way to quantify how light impacts a TV's picture quality. So, we decided to remove the existing Reflections test and replace it with two new tests that better show how a TV handles both direct and total reflections.
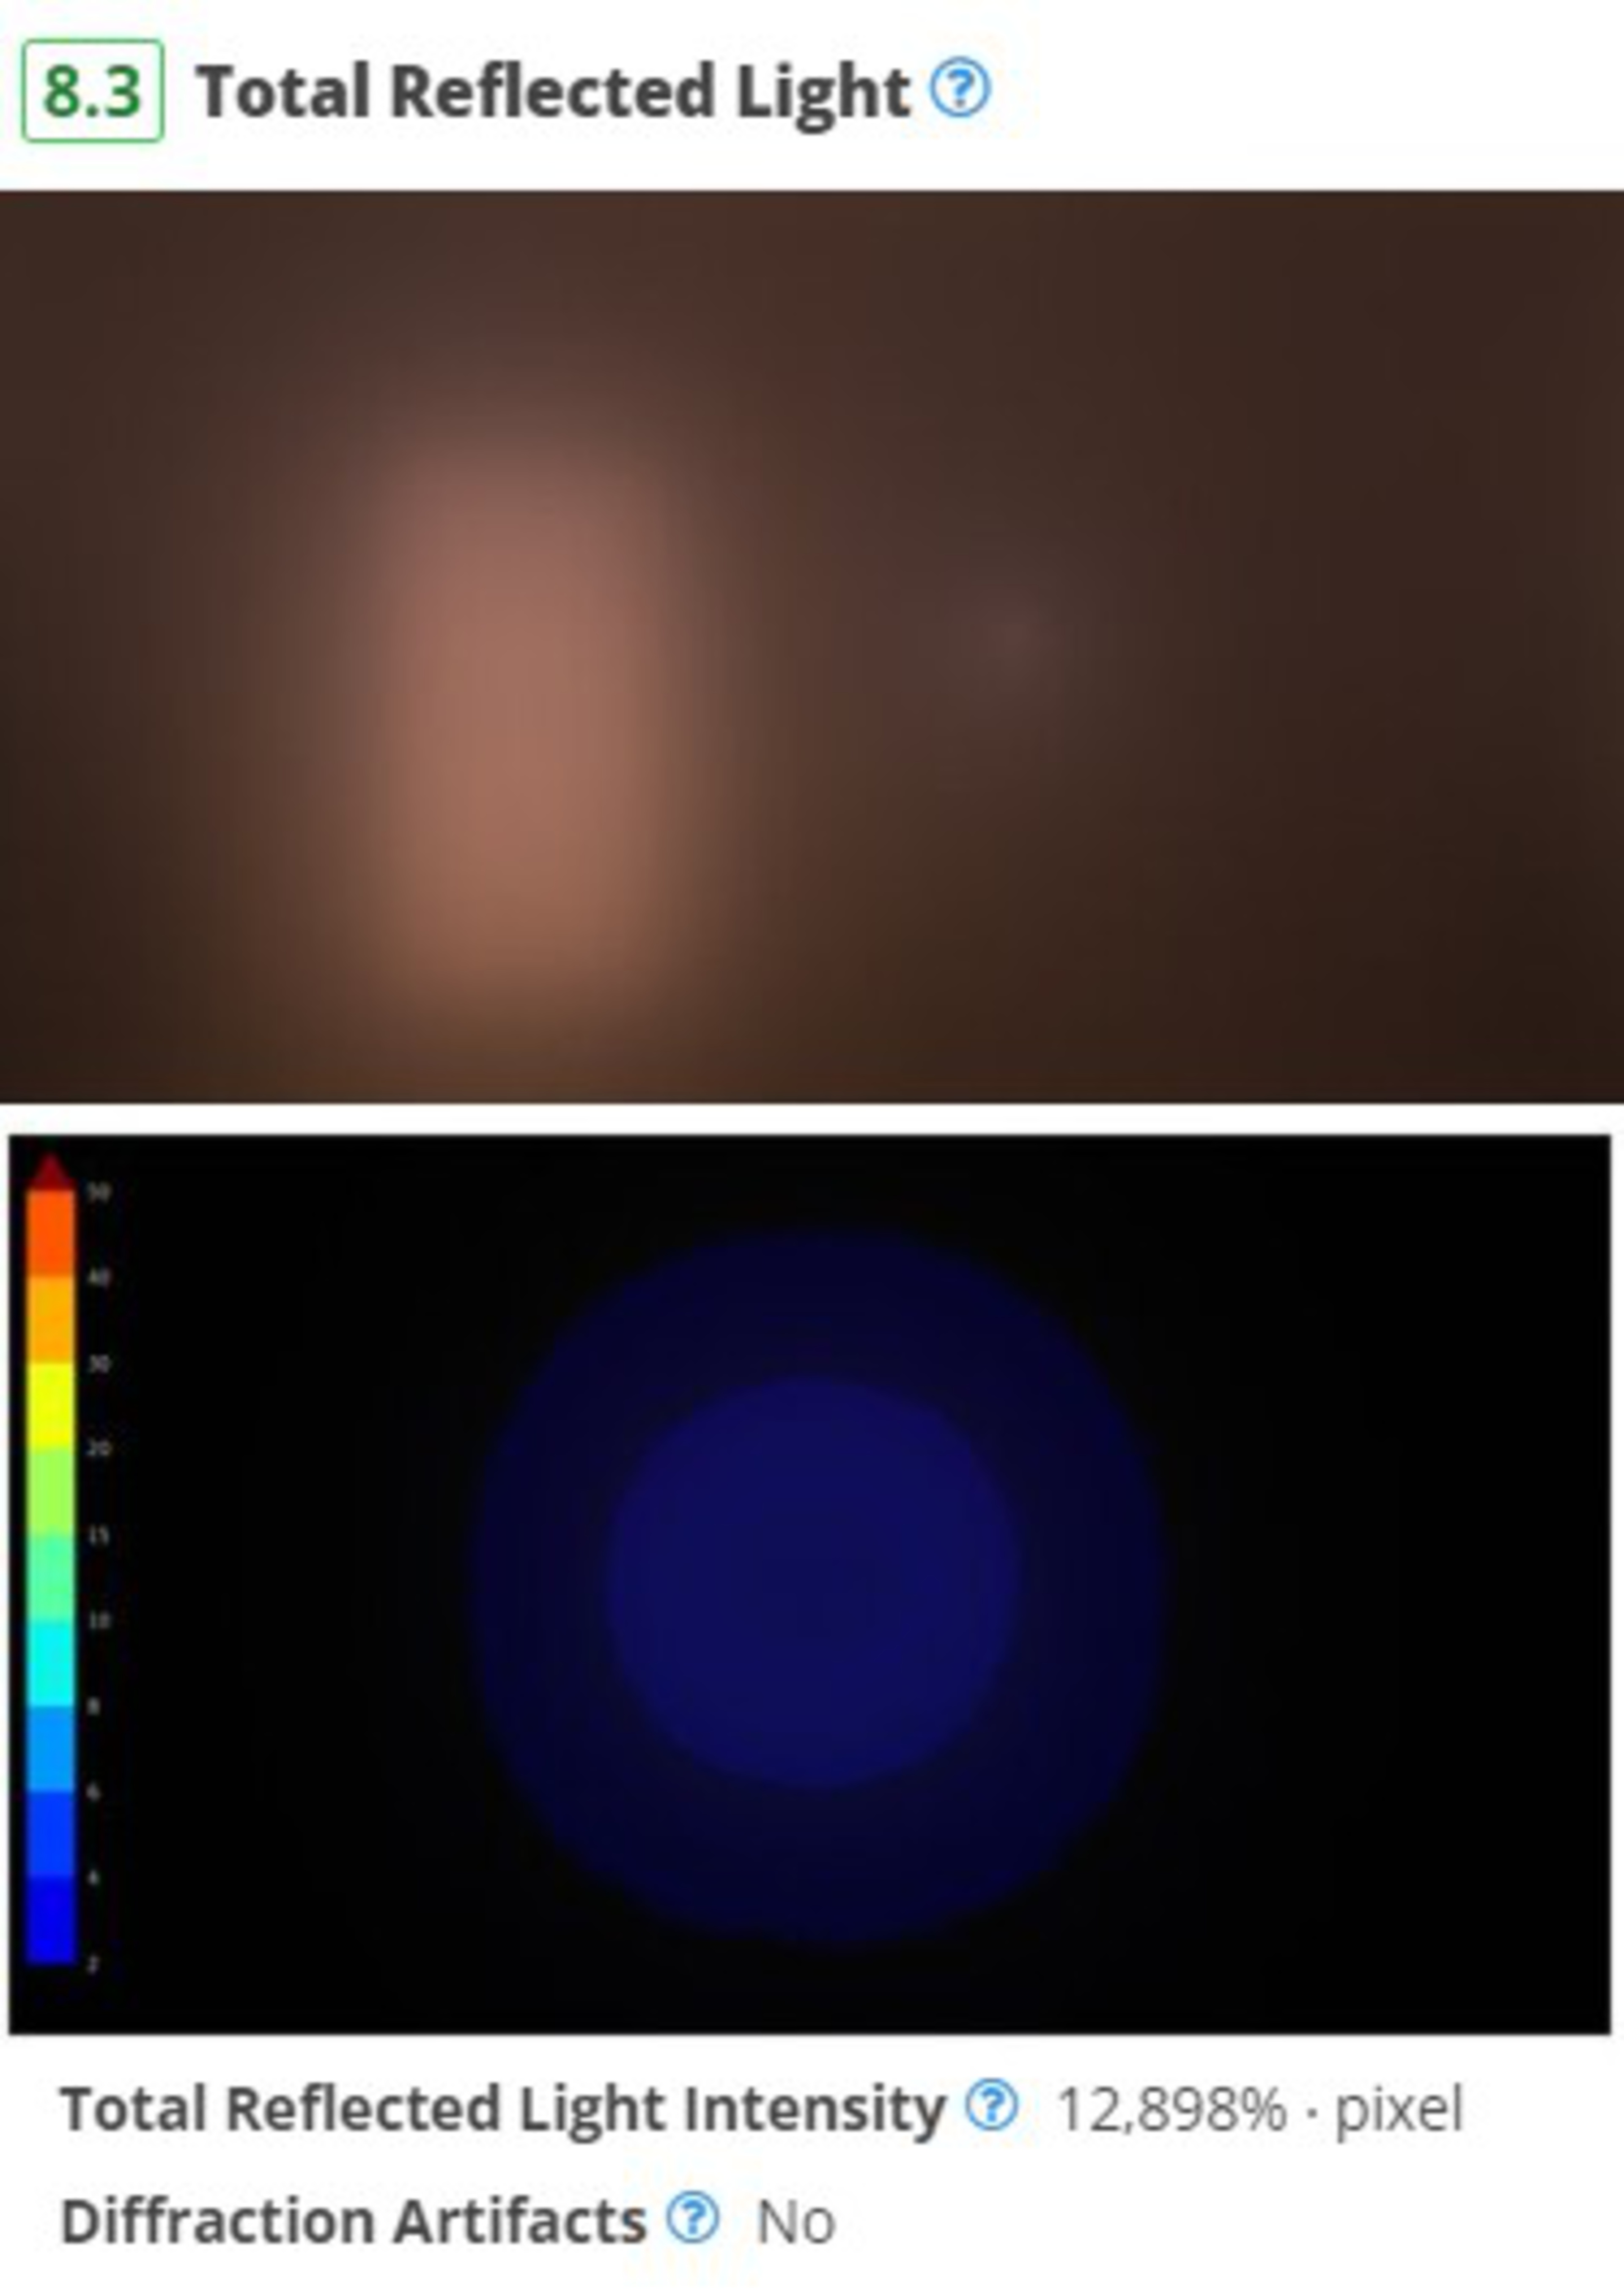
Total Reflected Light & Direct Reflections
 |
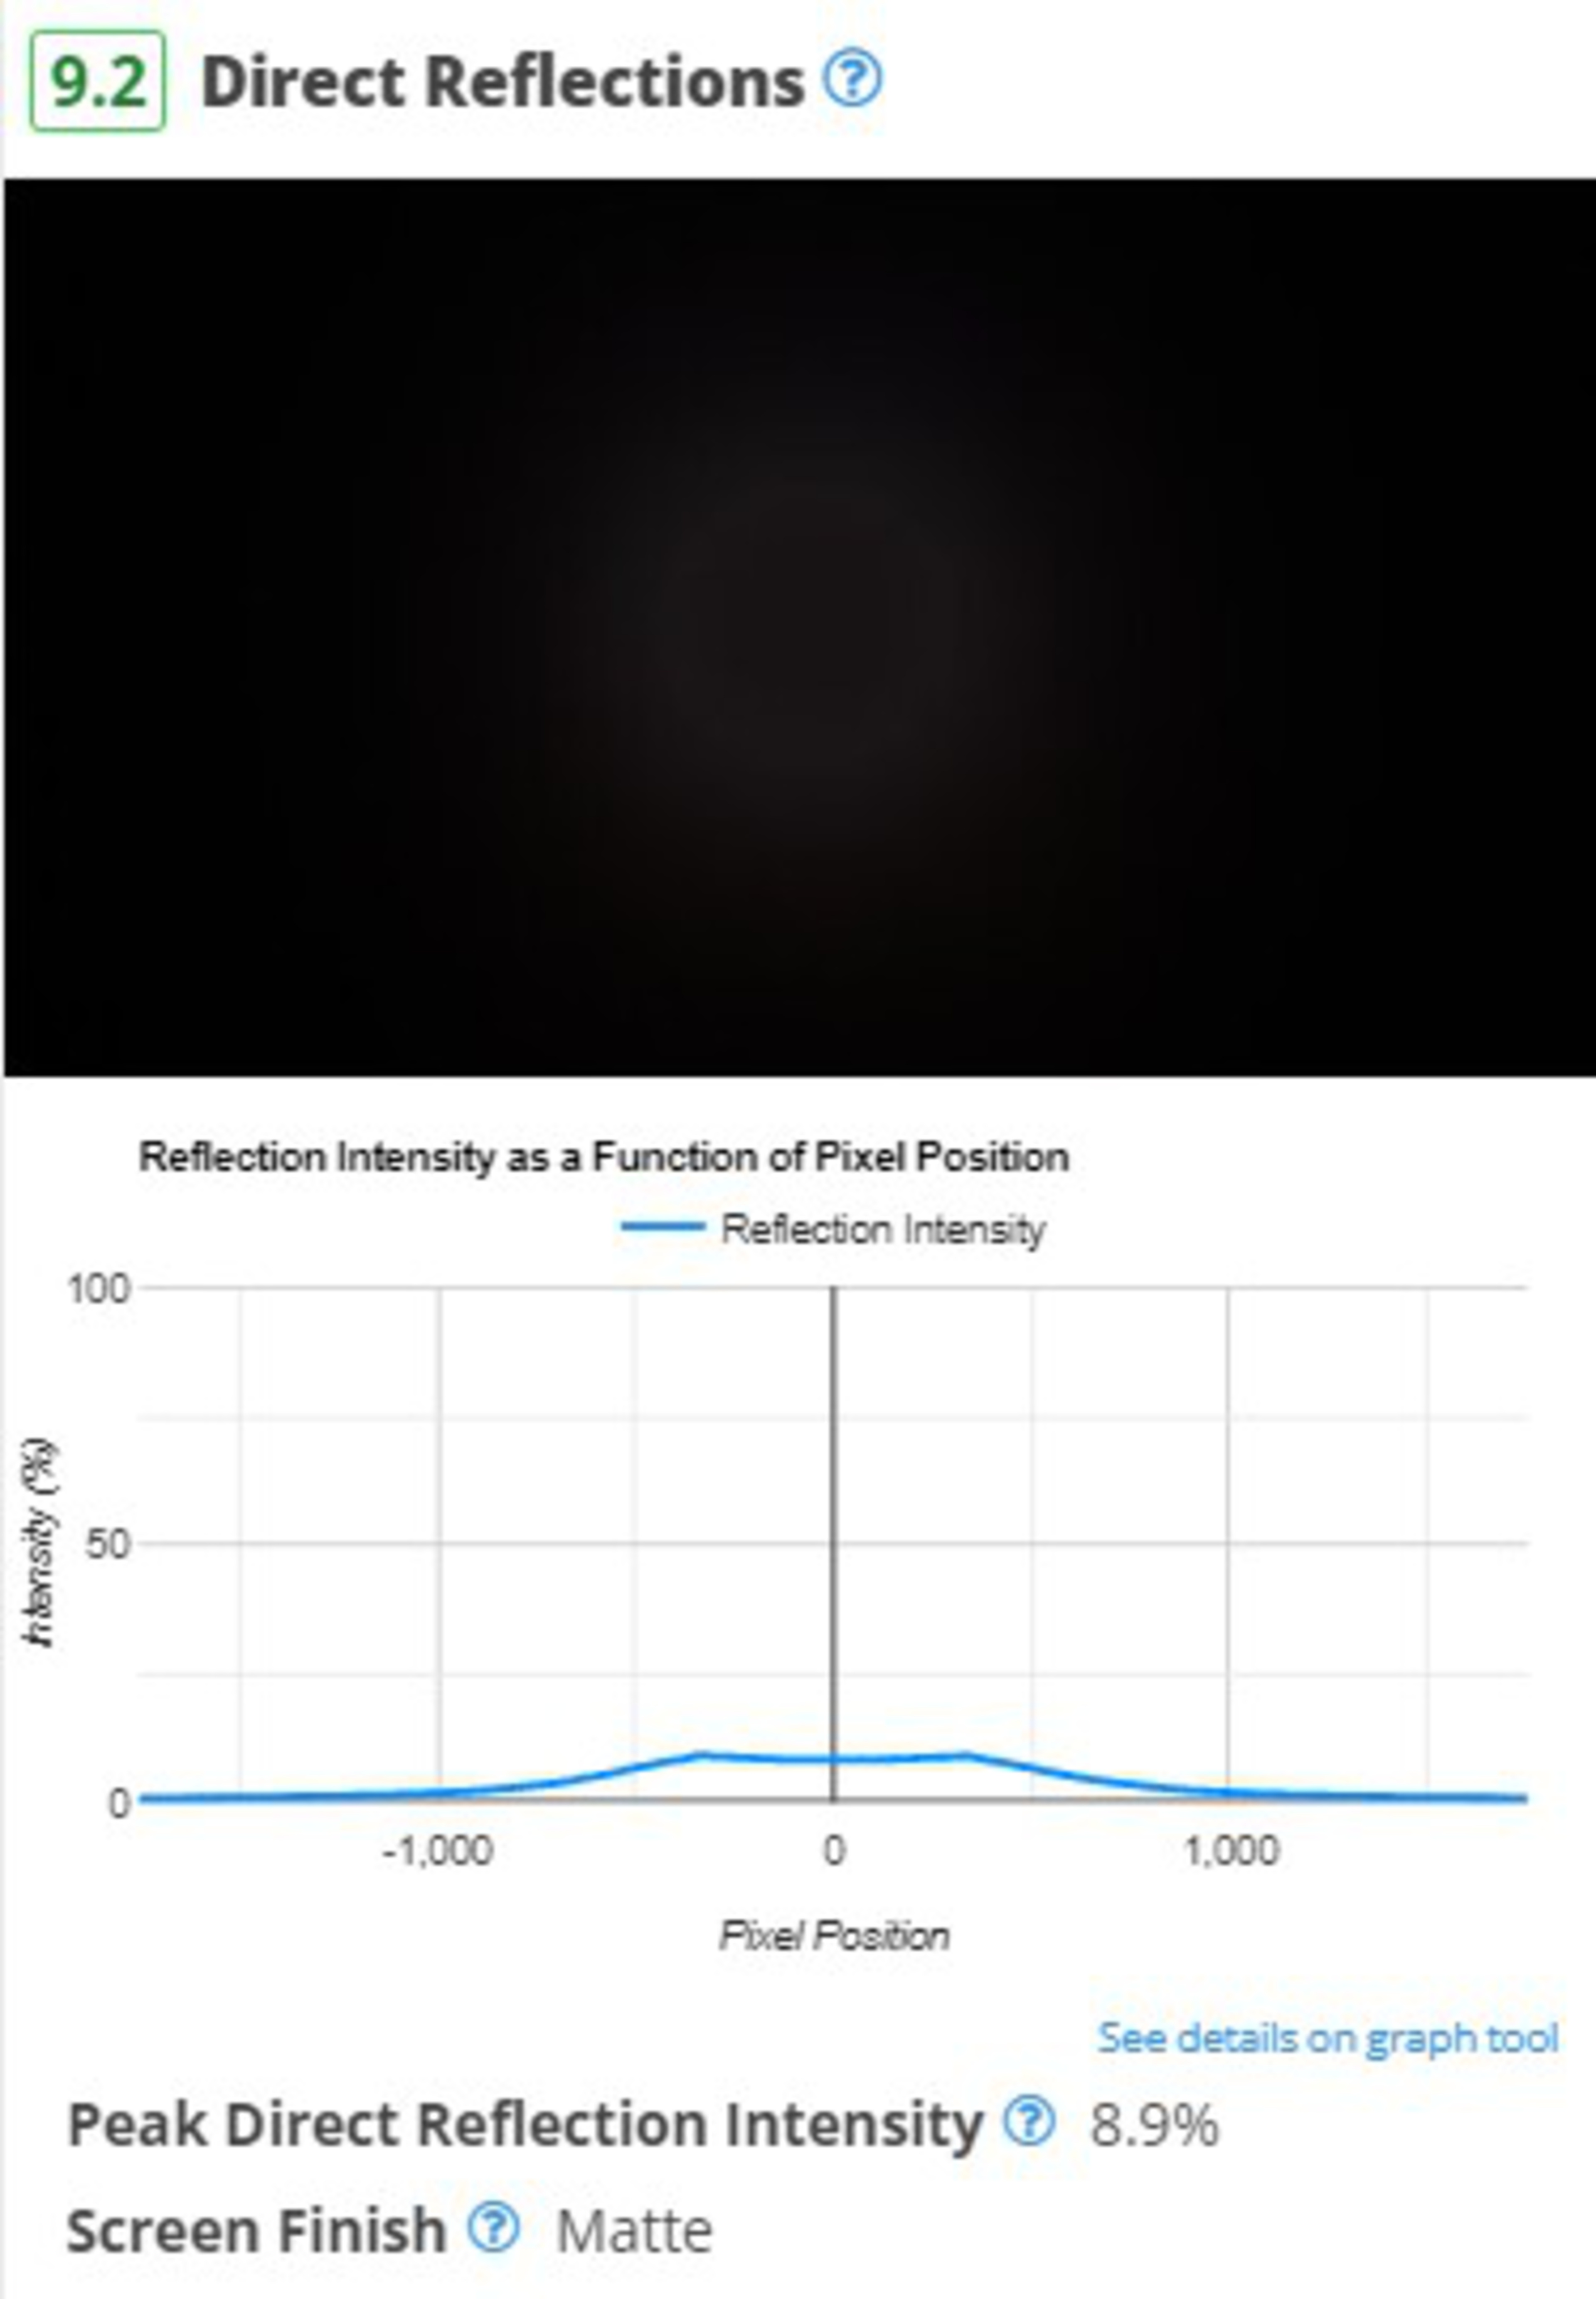 |
One of our goals with this test bench was to expand our reflection handling tests to better capture the nuances between different coatings so you can make an informed decision. We've redone our total and direct reflections tests to make the test easier to run and more representative. These new tests use a ring light to simulate a consistent bright light source and measure the intensity of the light reflected. This makes it easier to see the impact of bright lights, and you can also quickly see if there are any distracting diffraction artifacts like rainbow smearing.
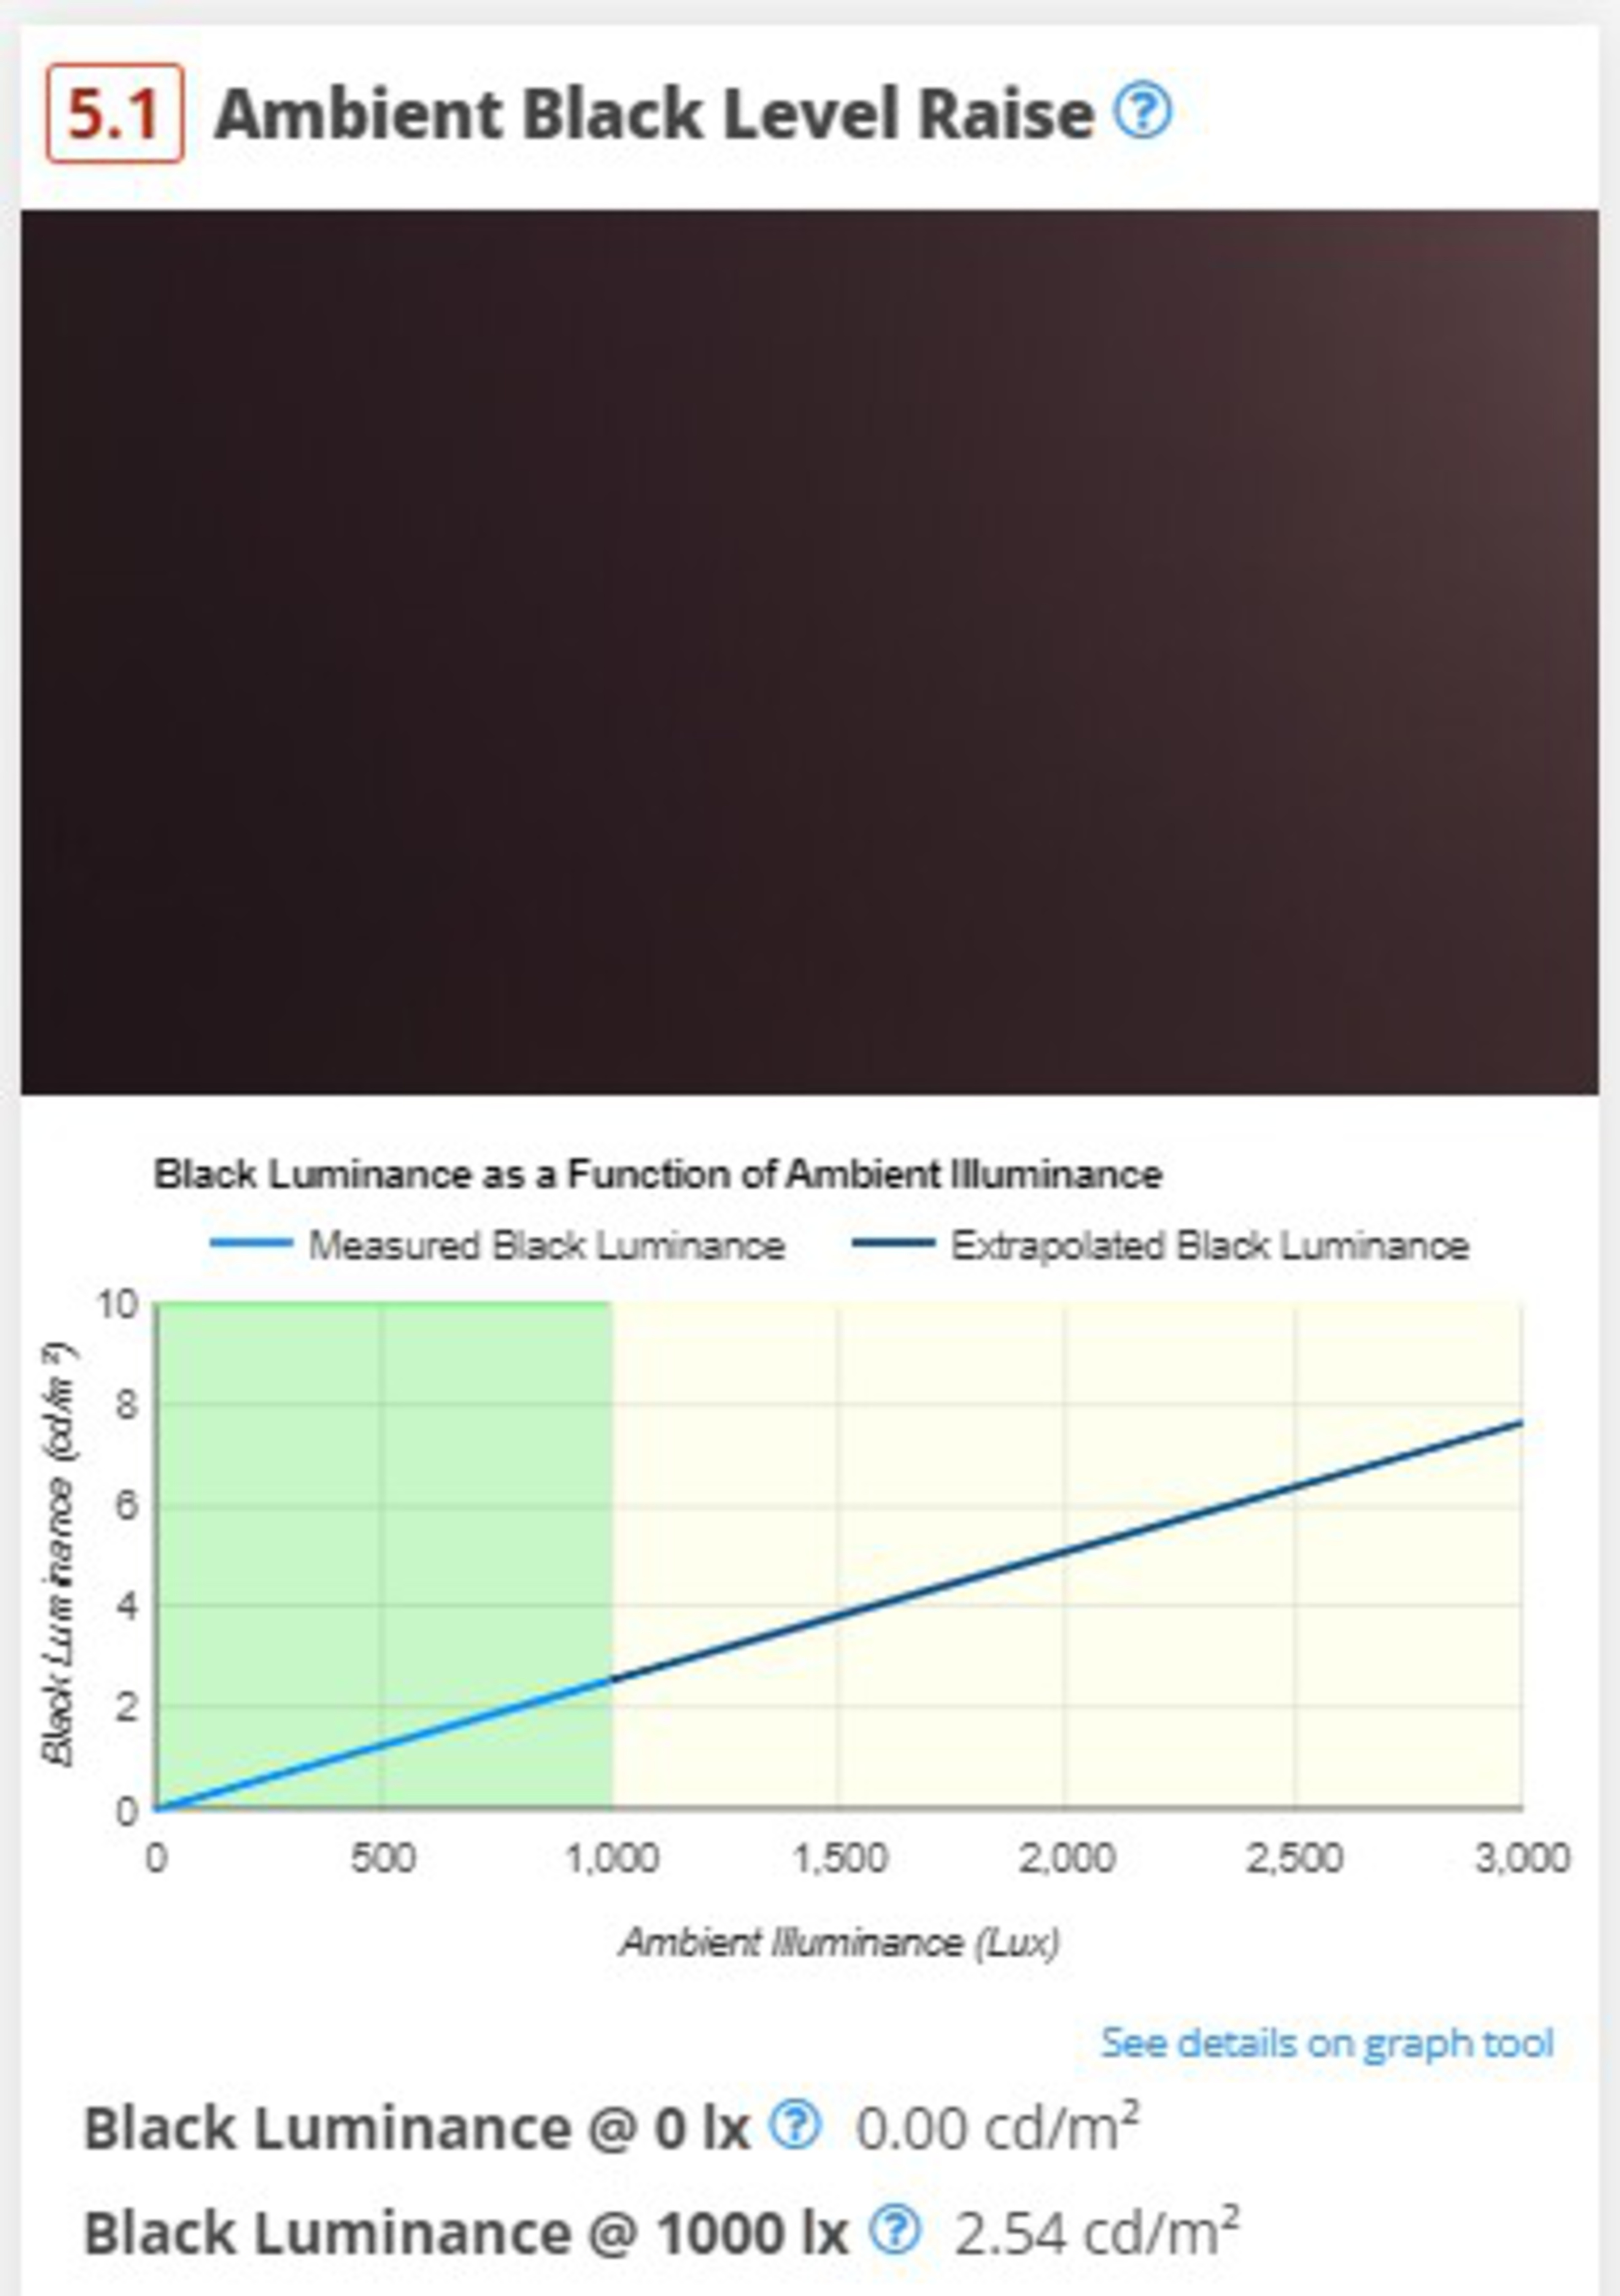
Ambient Black Level Raise
These new tests are a good start, but it's not enough. When we talk about TVs, many reviewers assume that viewers are watching movies in a perfectly black room. But that's simply not the case for the vast majority of users. So, we needed to find a way to measure not only the reflectivity of a TV's screen but also the impact that those reflections have on a TV's picture quality.
 |
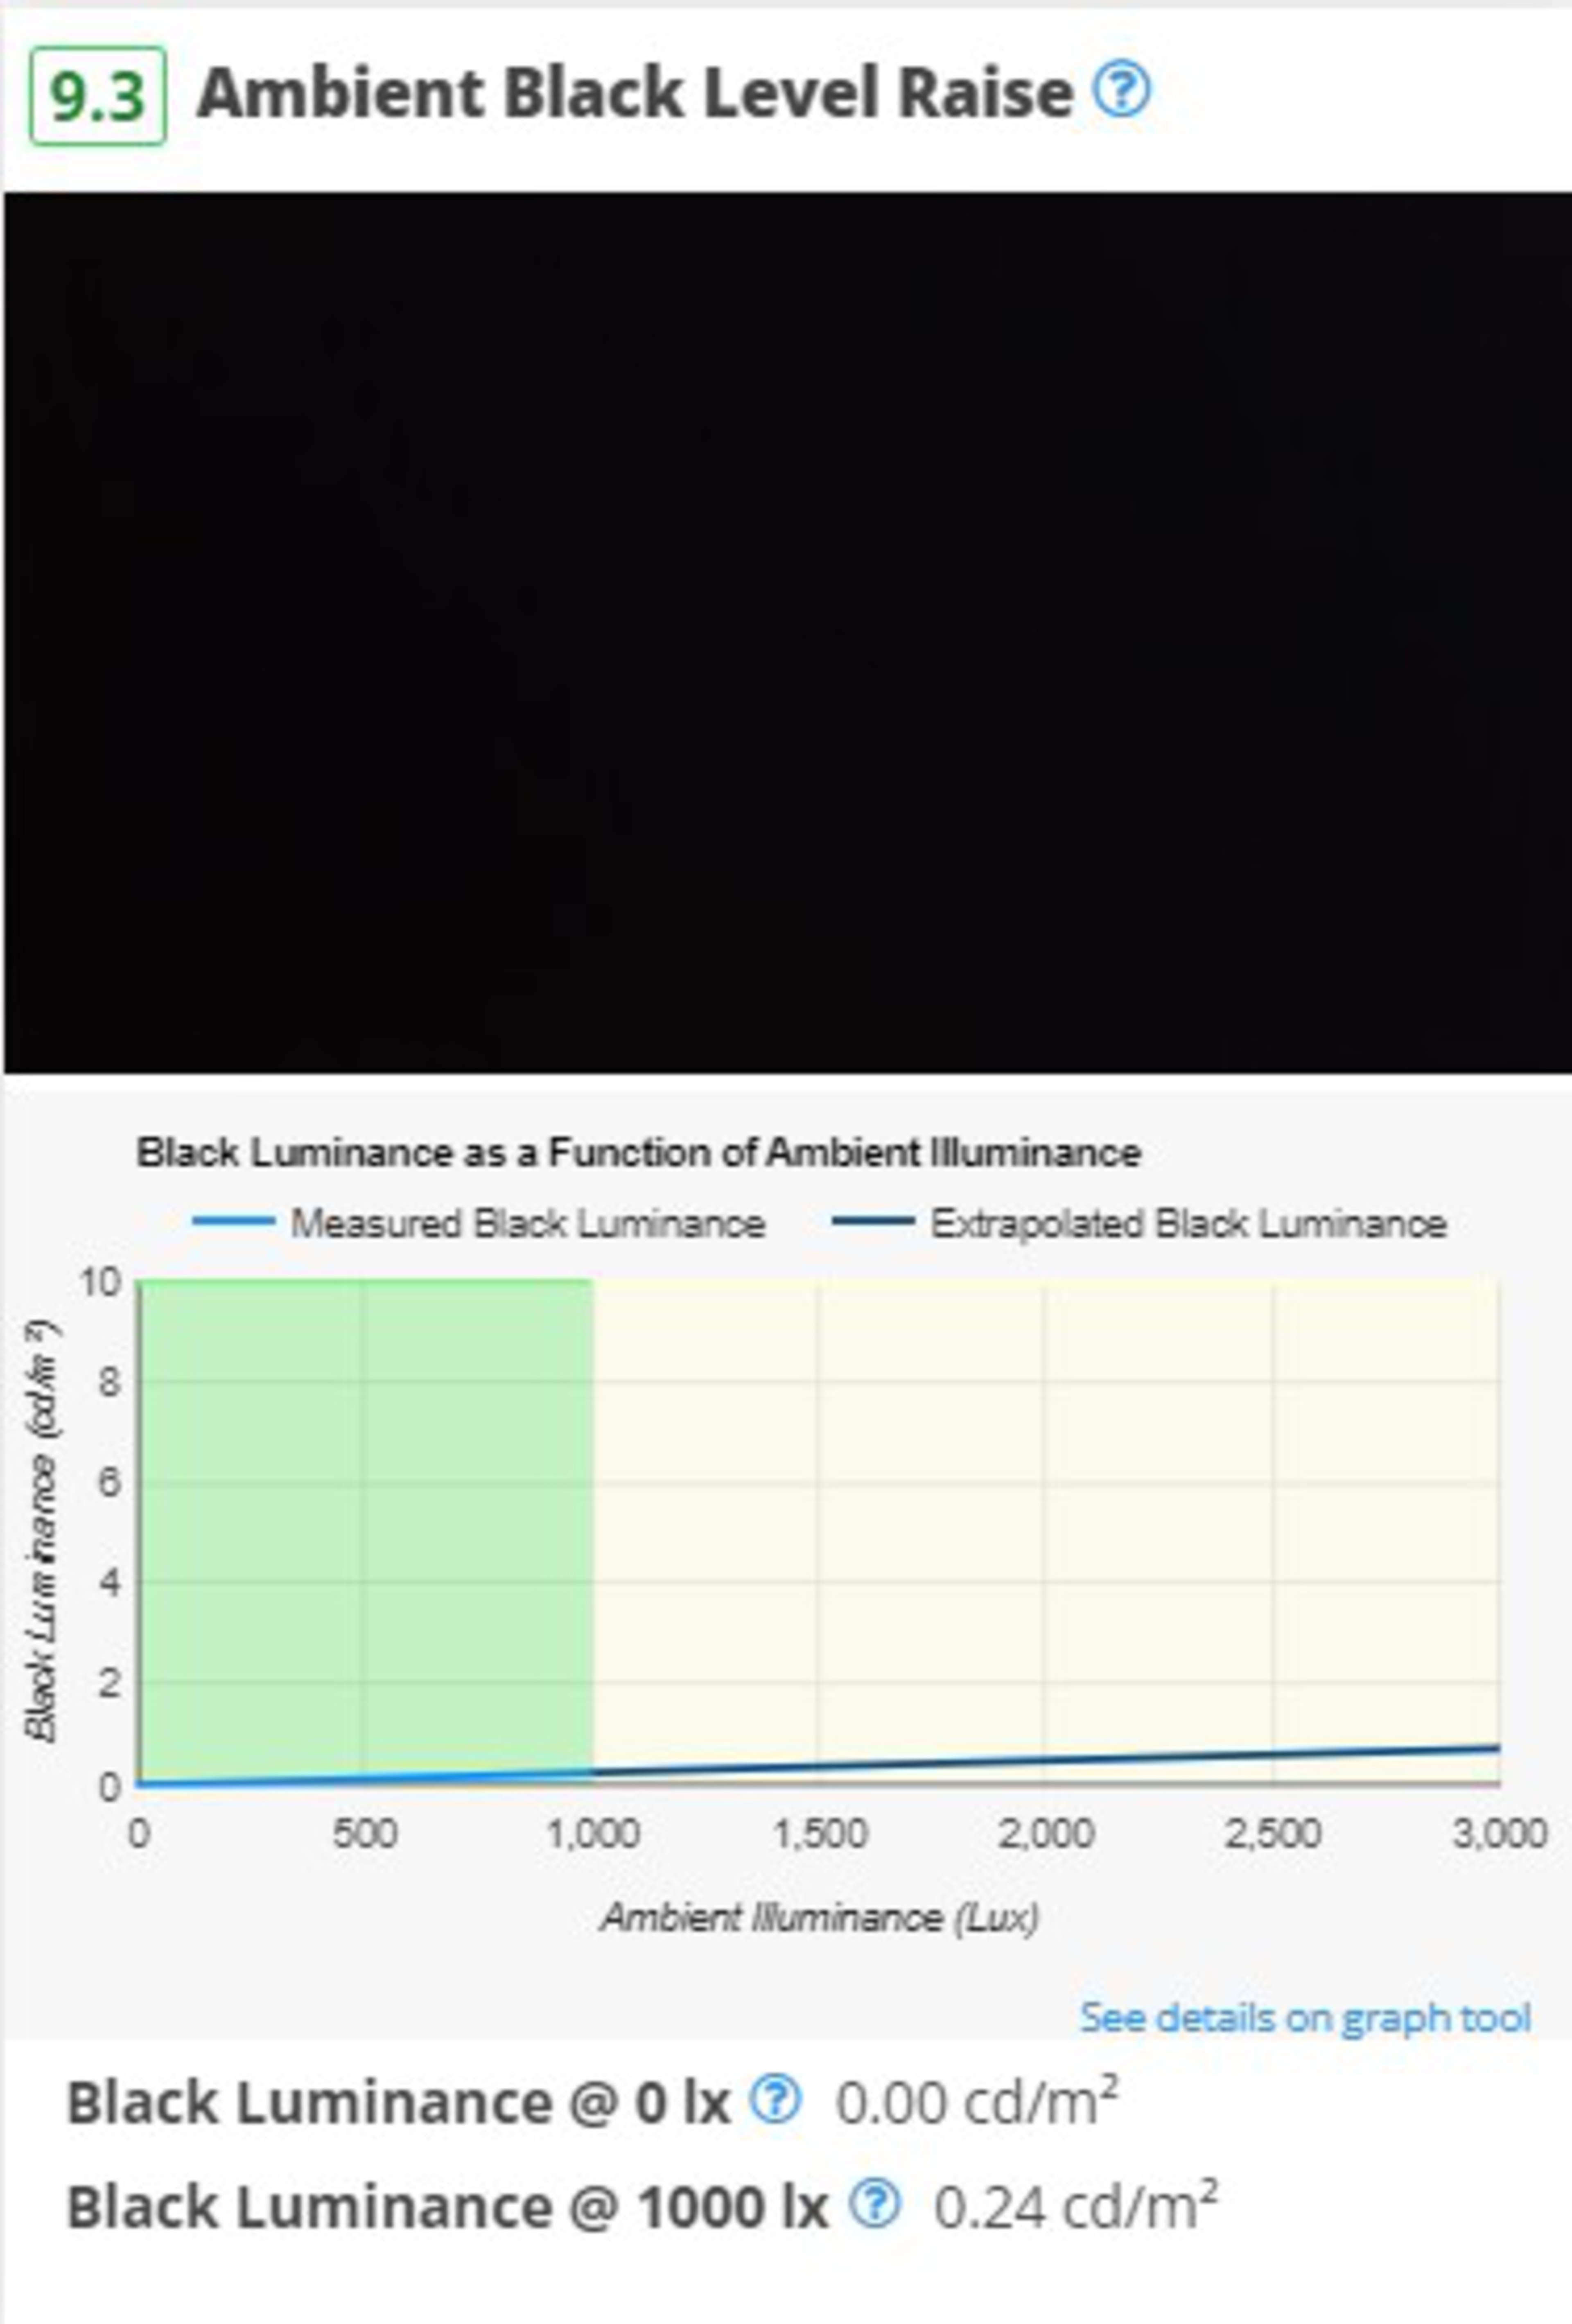 |
The Ambient Black Level Raise test measures how much a TV's black levels rise when you're in a bright room. This became more of an issue in recent years with the release of QD-OLED panels. Since these TVs lack a polarizer, they have a noticeable purple tint when used in a bright room, and blacks aren't as deep. This new test lets you quickly see how the panel technology impacts contrast when watching TV in a bright room.
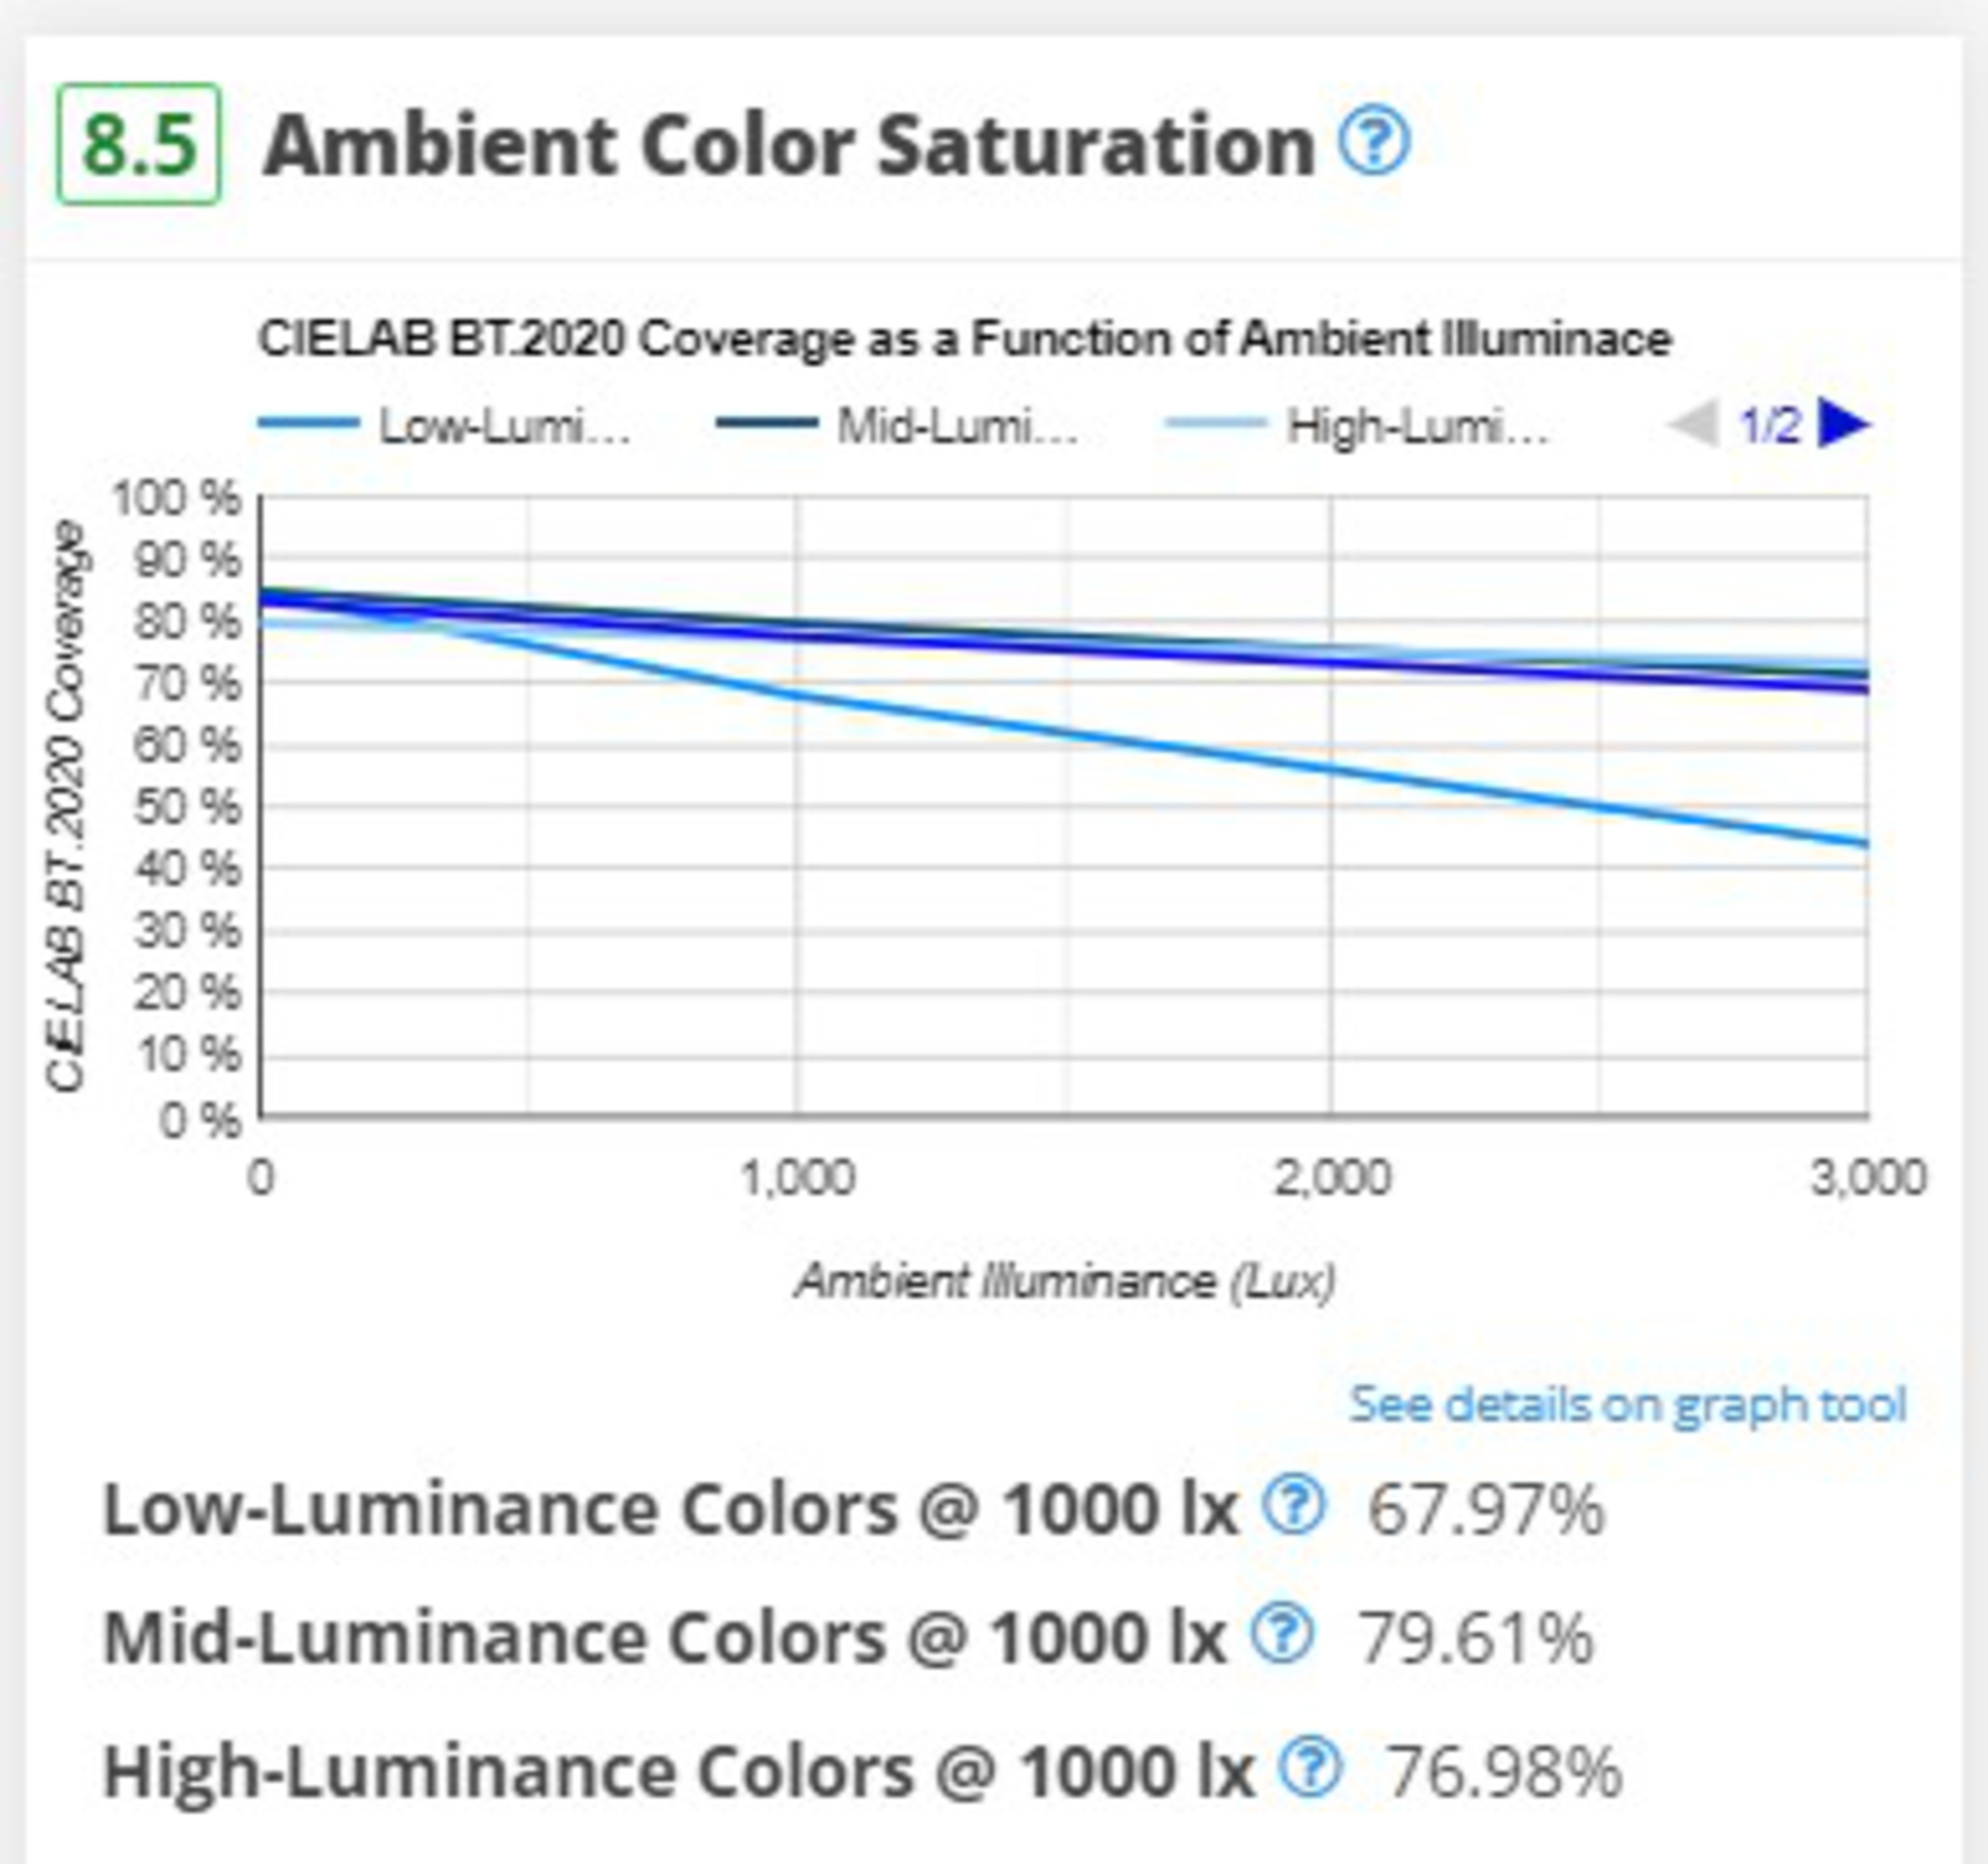
Ambient Color Saturation
The Ambient Color Saturation test is very similar to the black level raise test mentioned above. Instead of looking at black levels, though, it looks at a TV's perceived color volume as a function of ambient lighting. This shows you how bright and vibrant colors will be in a bright room. Unlike the black level raise test, which shows the change in black levels relative to a dark room, the color saturation test shows the absolute values in both dark and bright rooms.
 |
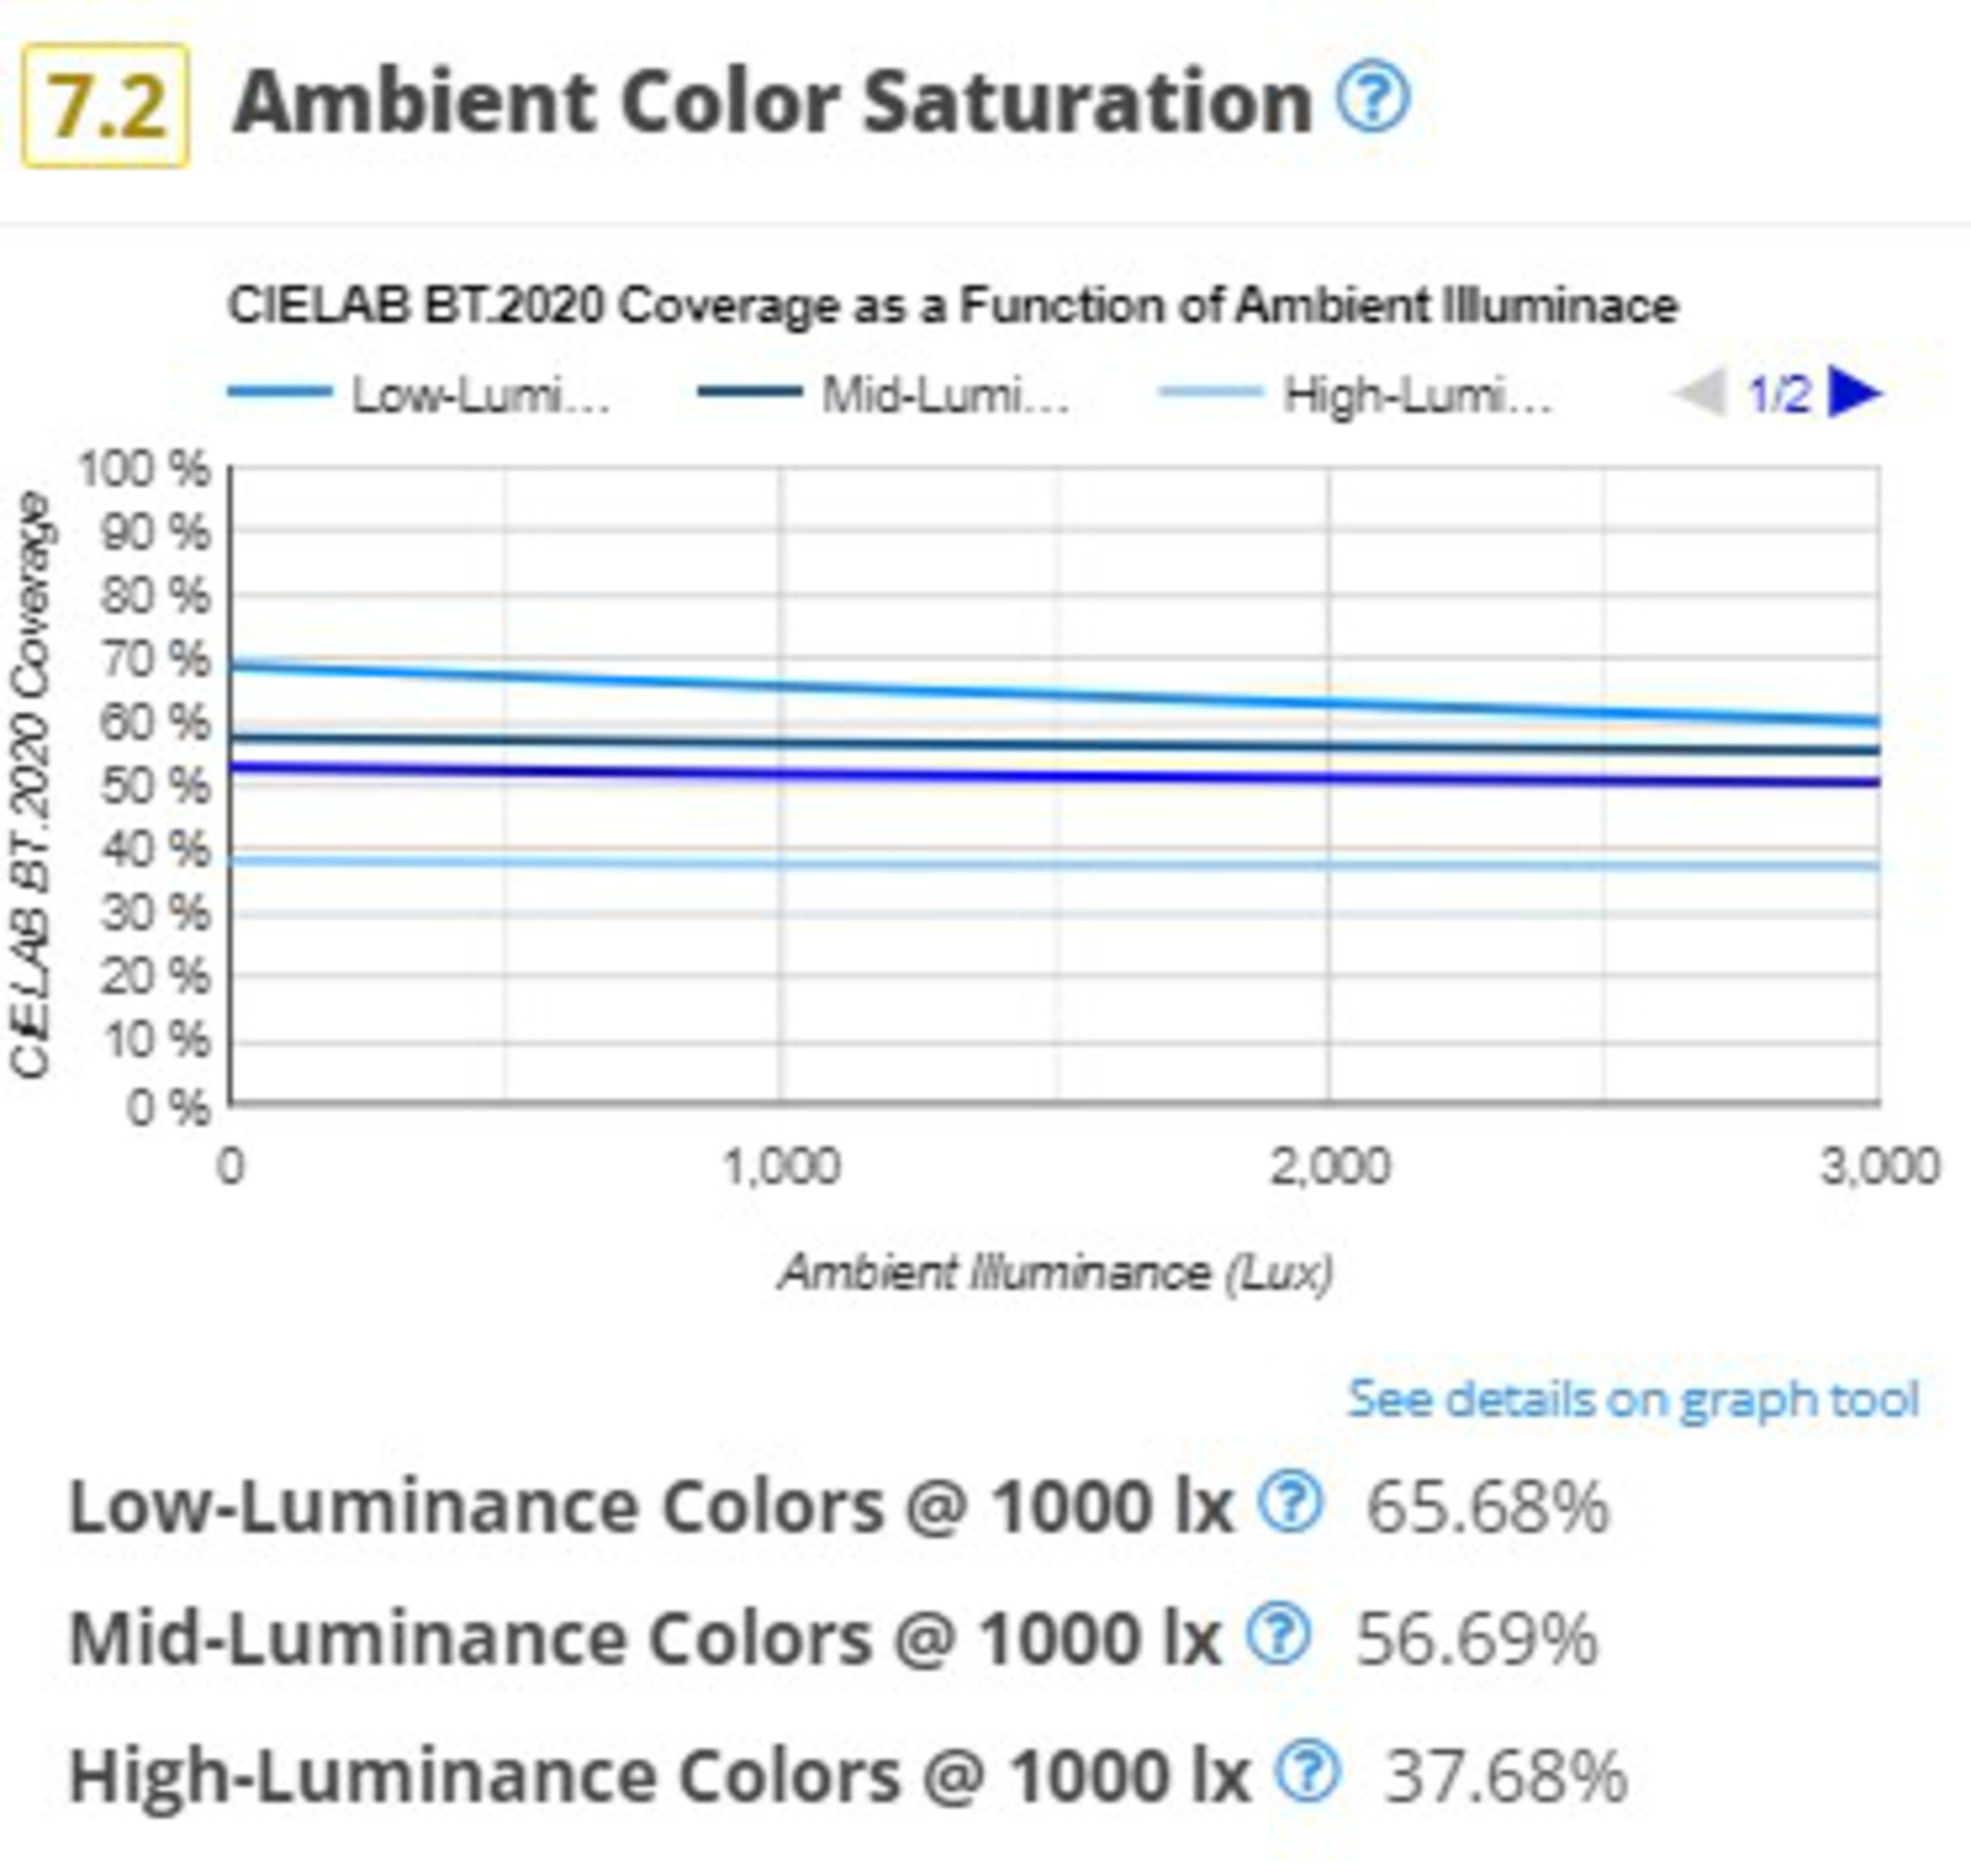 |
Taking the above examples of the LG C4 and the Samsung S95D, you can immediately see the benefits of each model. The C4 retains its black levels better in a bright room, so it maintains more of those deep, inky blacks OLEDs are known for. On the other hand, the S95D maintains bright colors better, so if you prefer bright, saturated colors and usually watch TV in a bright room, you can immediately see why the S95D is a better choice.
Panel Technology
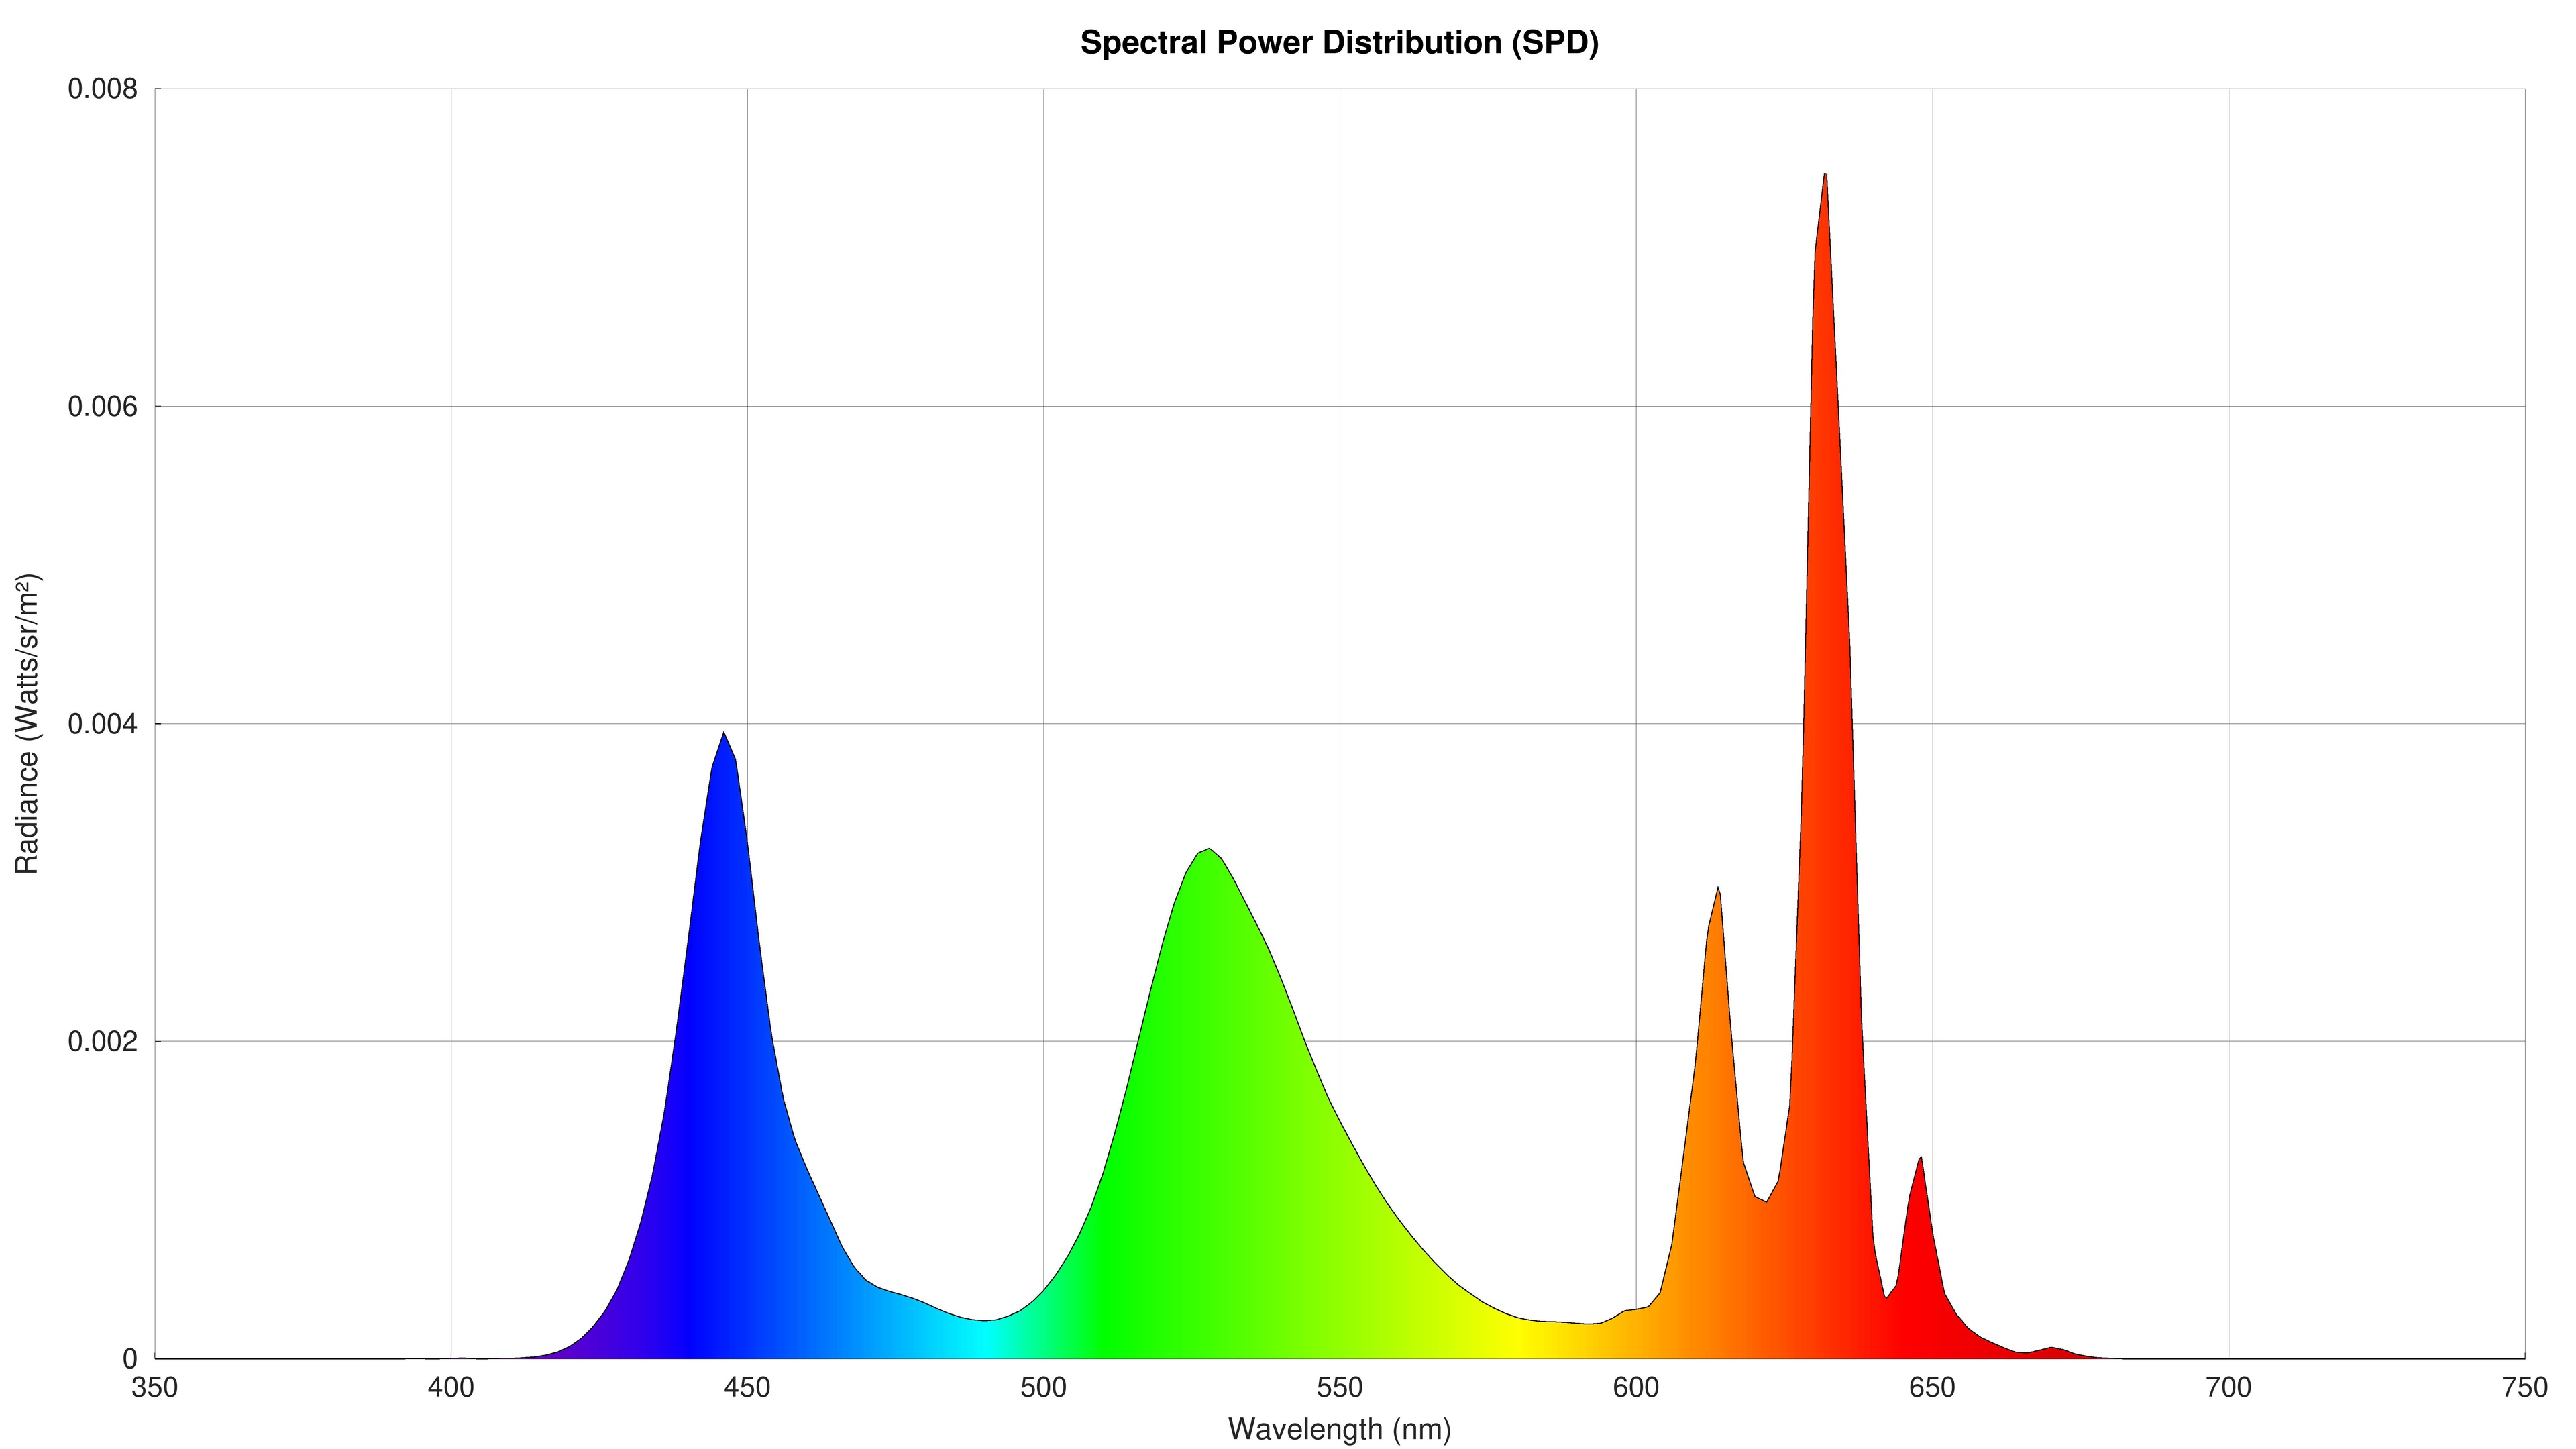 |
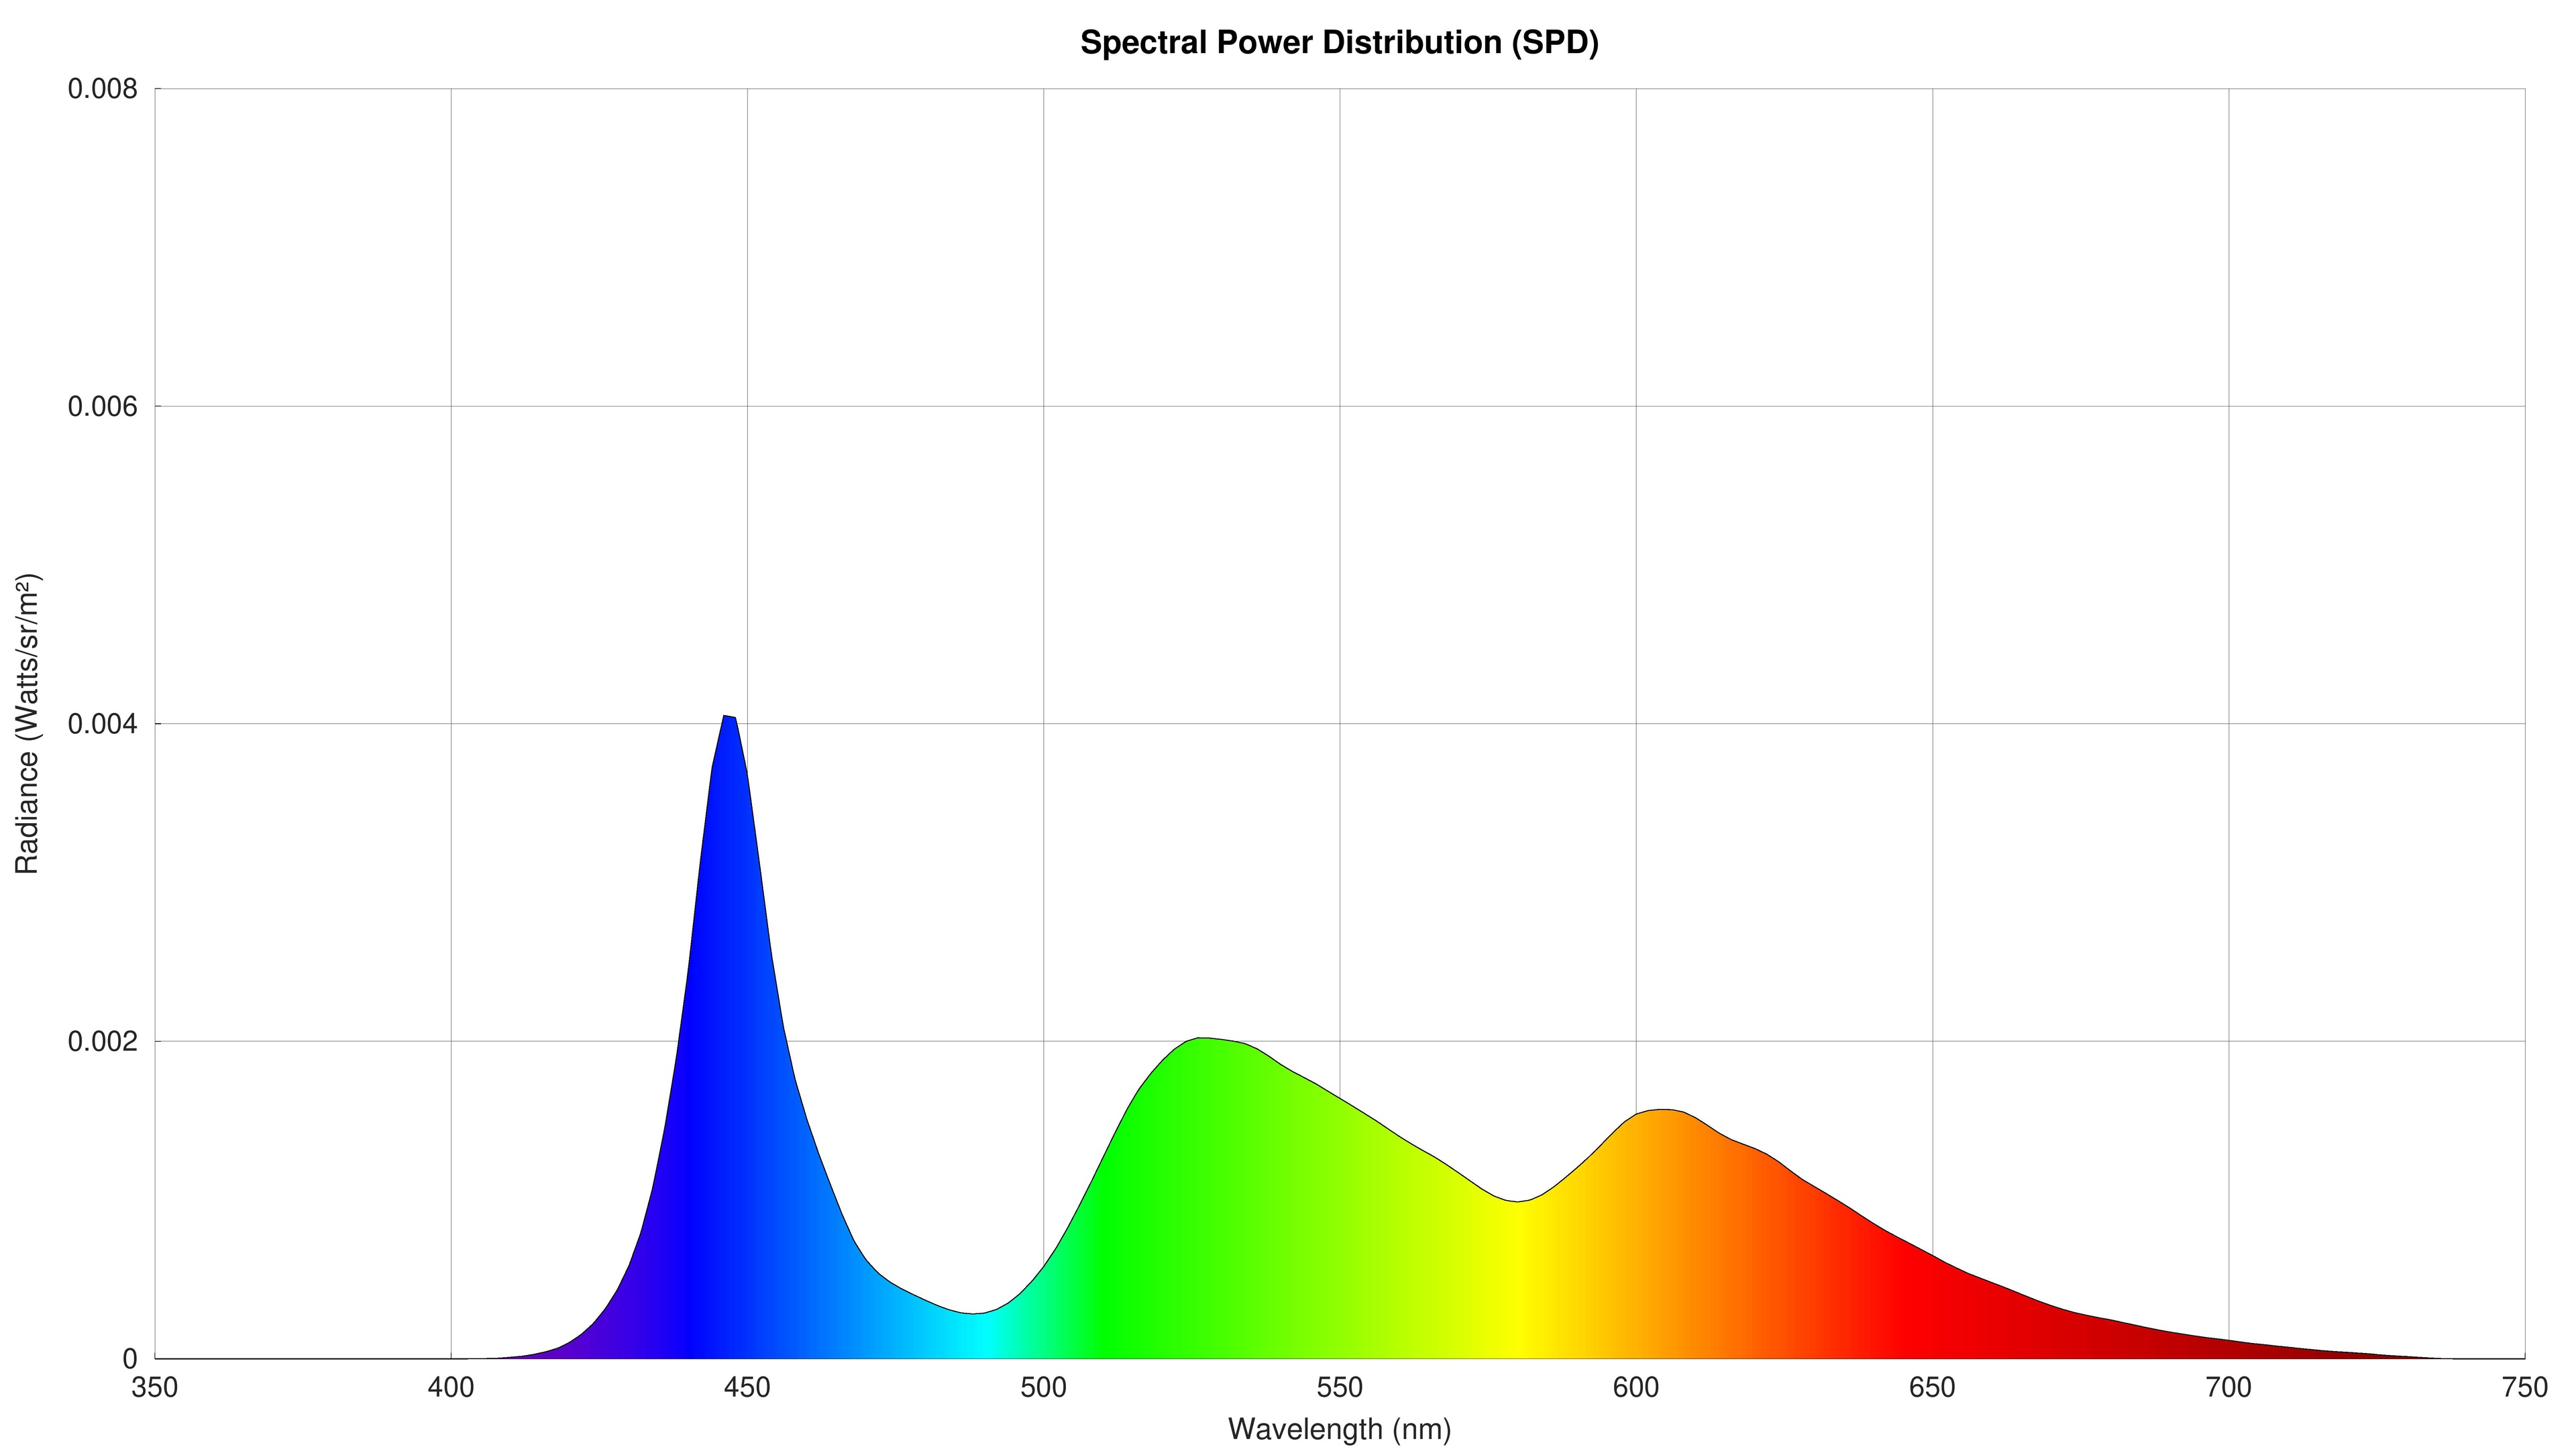 |
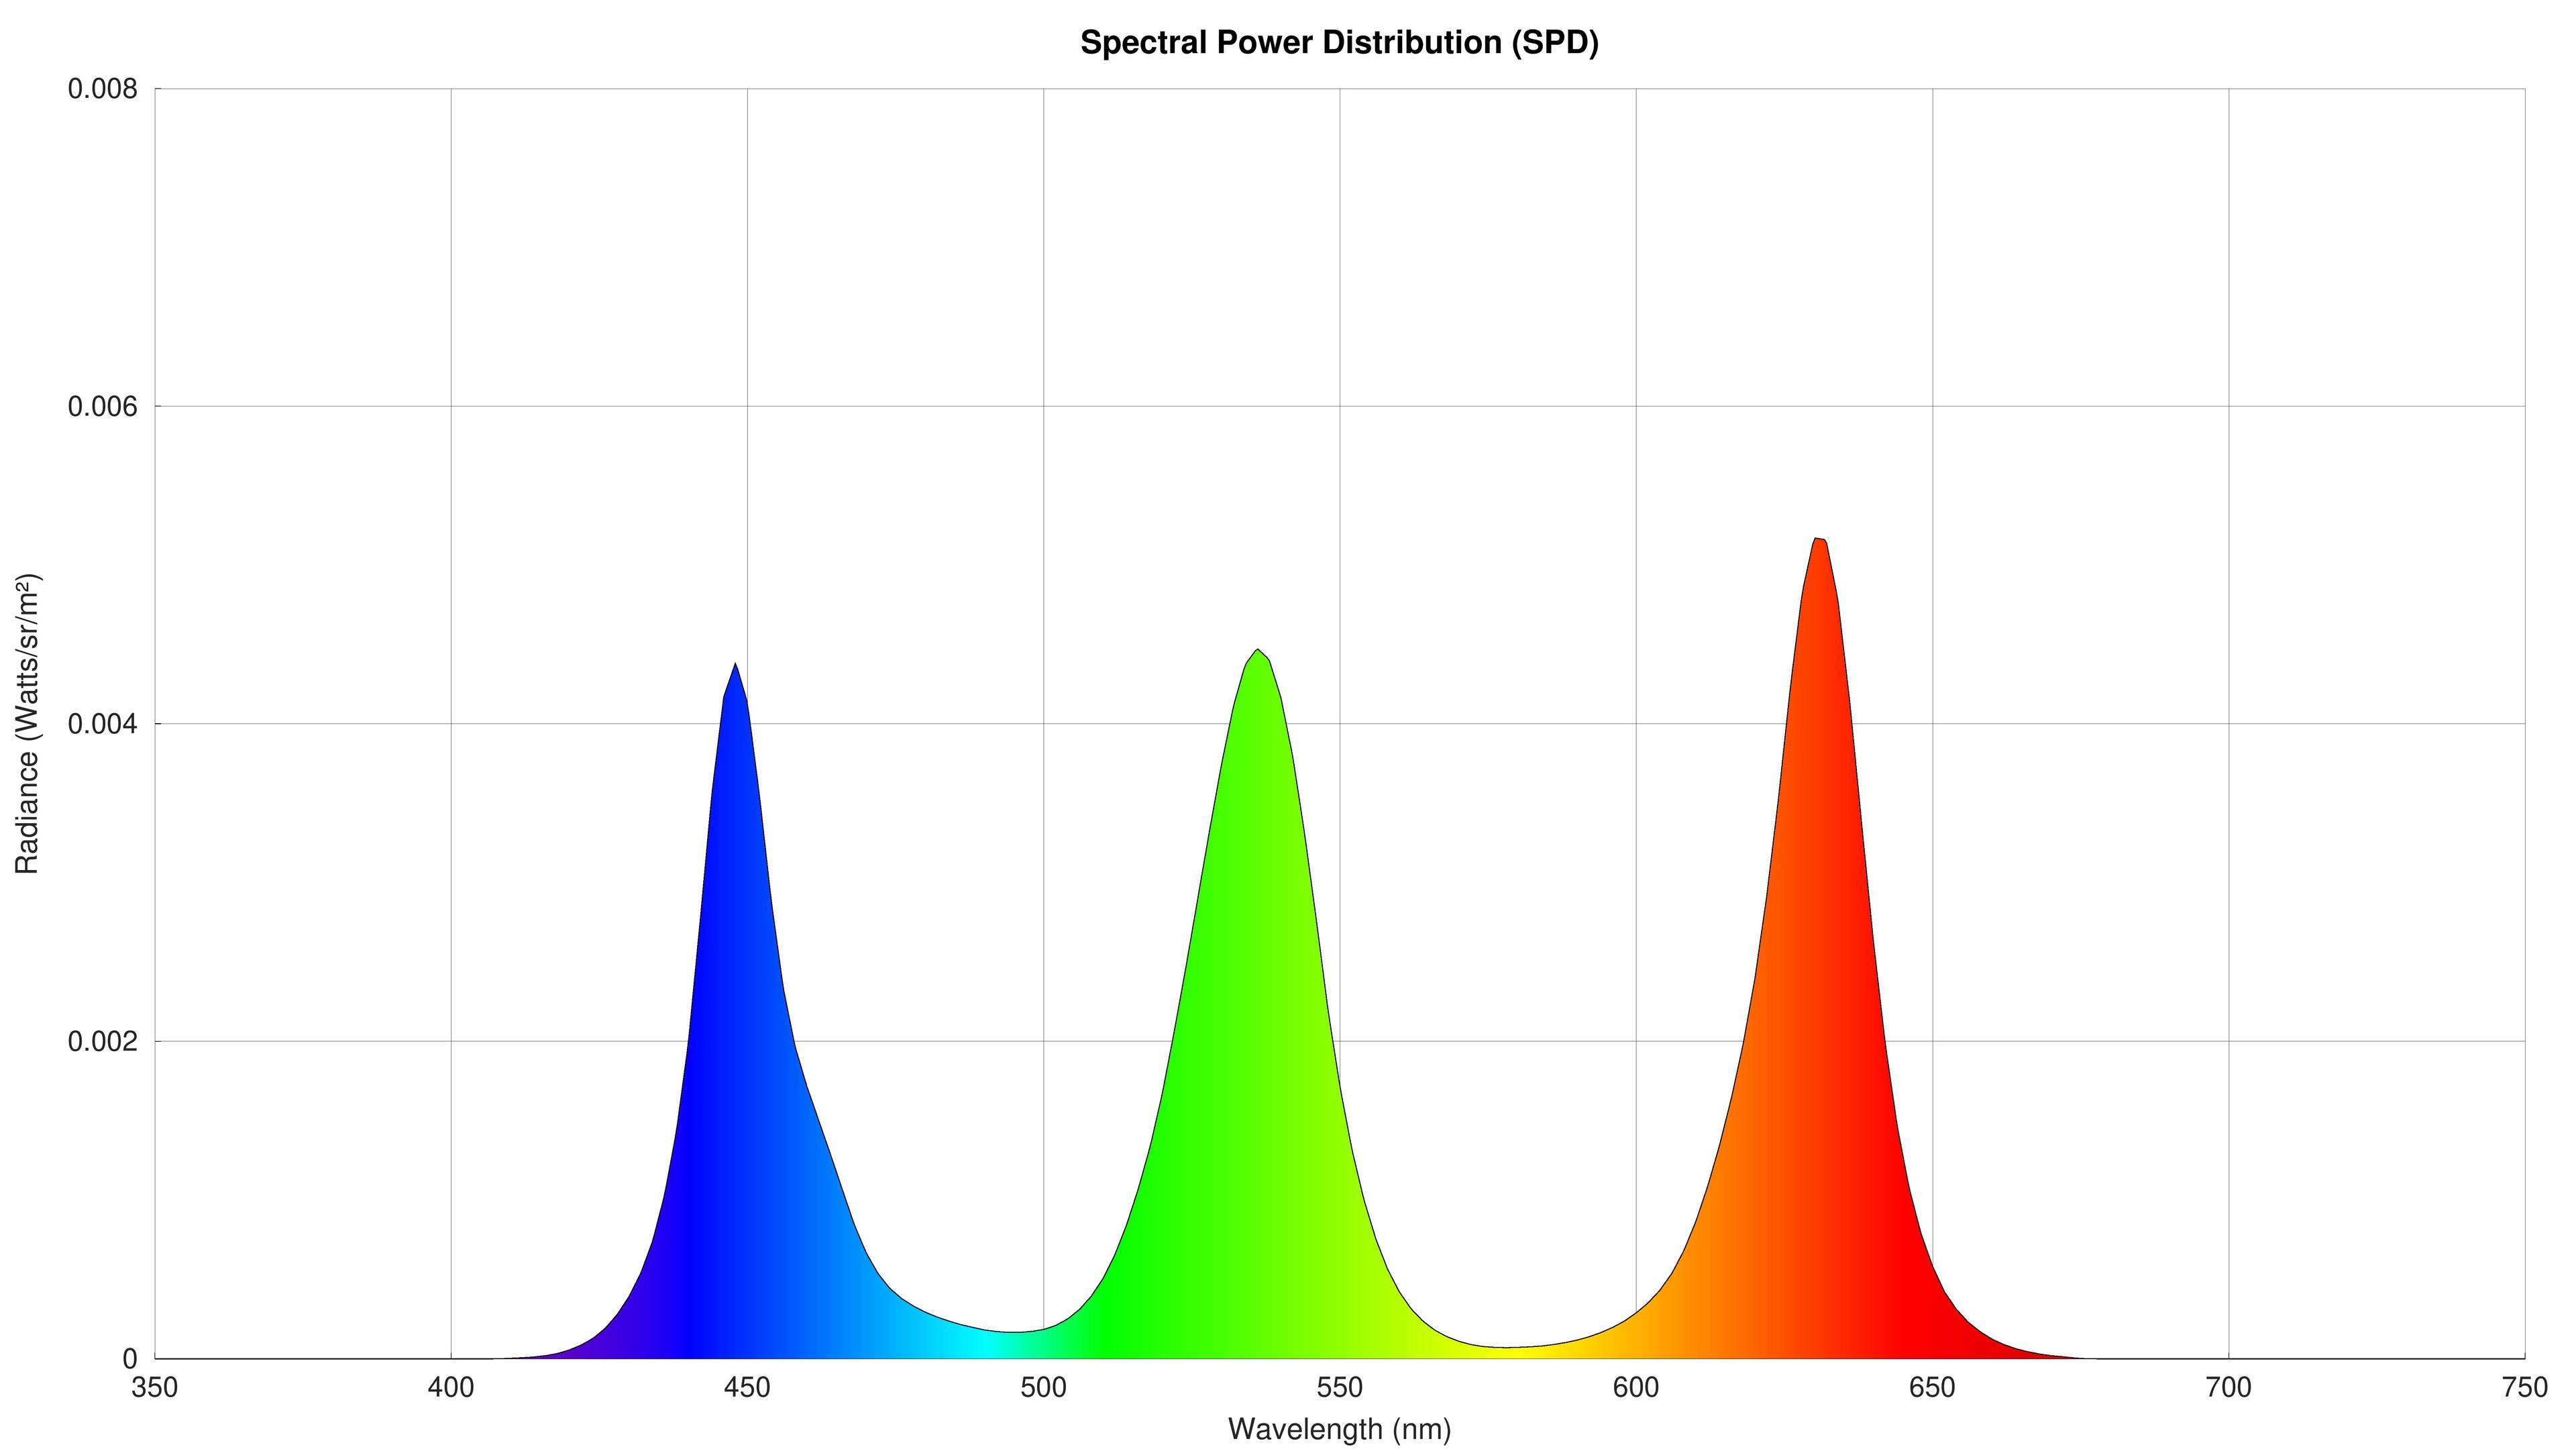 |
Although we've been collecting this data for years as part of the process needed to calibrate our equipment before each test, by popular demand, we're now including the spectral power distribution charts for all TVs under the Panel Technology section. Although most people shouldn't pay any attention to this, a TV's SPD tells us a lot about how it produces light. More precise peaks on each primary lead to better color separation and (usually) a wider color gamut. We can also see which TVs are using certain technologies like KSF phosphors, like the Sony X90L above, or quantum dots, like the Hisense U9N.
Response Time & Cumulative Absolute Deviation
Our response time testing has remained relatively unchanged for the last 7 years. It was fine when people mainly used TVs for watching shows/movies or playing casual games on older consoles, but with the rise of high refresh rate TVs, it simply isn't good enough anymore. With more and more people looking to use their TVs as they would a high-end gaming monitor, we needed a better test. The solution to this was fairly easy, and by popular request, we ported a portion of the response time and cumulative absolute deviation tests we developed for Monitor 2.0.
 |
 |
 |
 |
With this update, we've updated our response time test to use the new pursuit photo. This updated photo makes it easier to spot things like overshoot as specific color response times compared to our old photo. Like our previous test, we still run the response time test in the most accurate settings, and it's intended to show how motion is handled when watching movies, shows, or sports.
We've also added three new tests. Instead of measuring the response time itself, these tests measure the cumulative absolute deviation, or in other words, the total area shaded in yellow on the charts above. This new way of measuring transitions takes into account how severe overshoot is, so if you have two TVs that take the same amount of time to transition between two shades, but one overshoots the target before falling back, it'll score worse in this test. Unlike the response time test, the CAD tests are done in Game Mode, at 60Hz, 120Hz, and the max refresh rate of the TV.
Flicker-Free
We've renamed this box to simply 'Flicker' and removed the score, but this test has not been changed in any other way.
Black Frame Insertion (BFI)
With the updates to our response time testing, we also updated the pursuit photo for our BFI test. Other than that, our BFI test is exactly the same as it was on 1.11.
Stutter
With the changes to the response time test mentioned above, we also had to update our stutter test, as it uses the results of the response time test to calculate the frame hold time. Instead of the 100% Response Time result, for TV 2.0, stutter is calculated from the First Response Time result. We've also updated the scoring weights and spline to increase the focus on 24 fps stutter, as 60 fps stutter is almost never an issue.
Input Lag & Supported Resolutions
 |
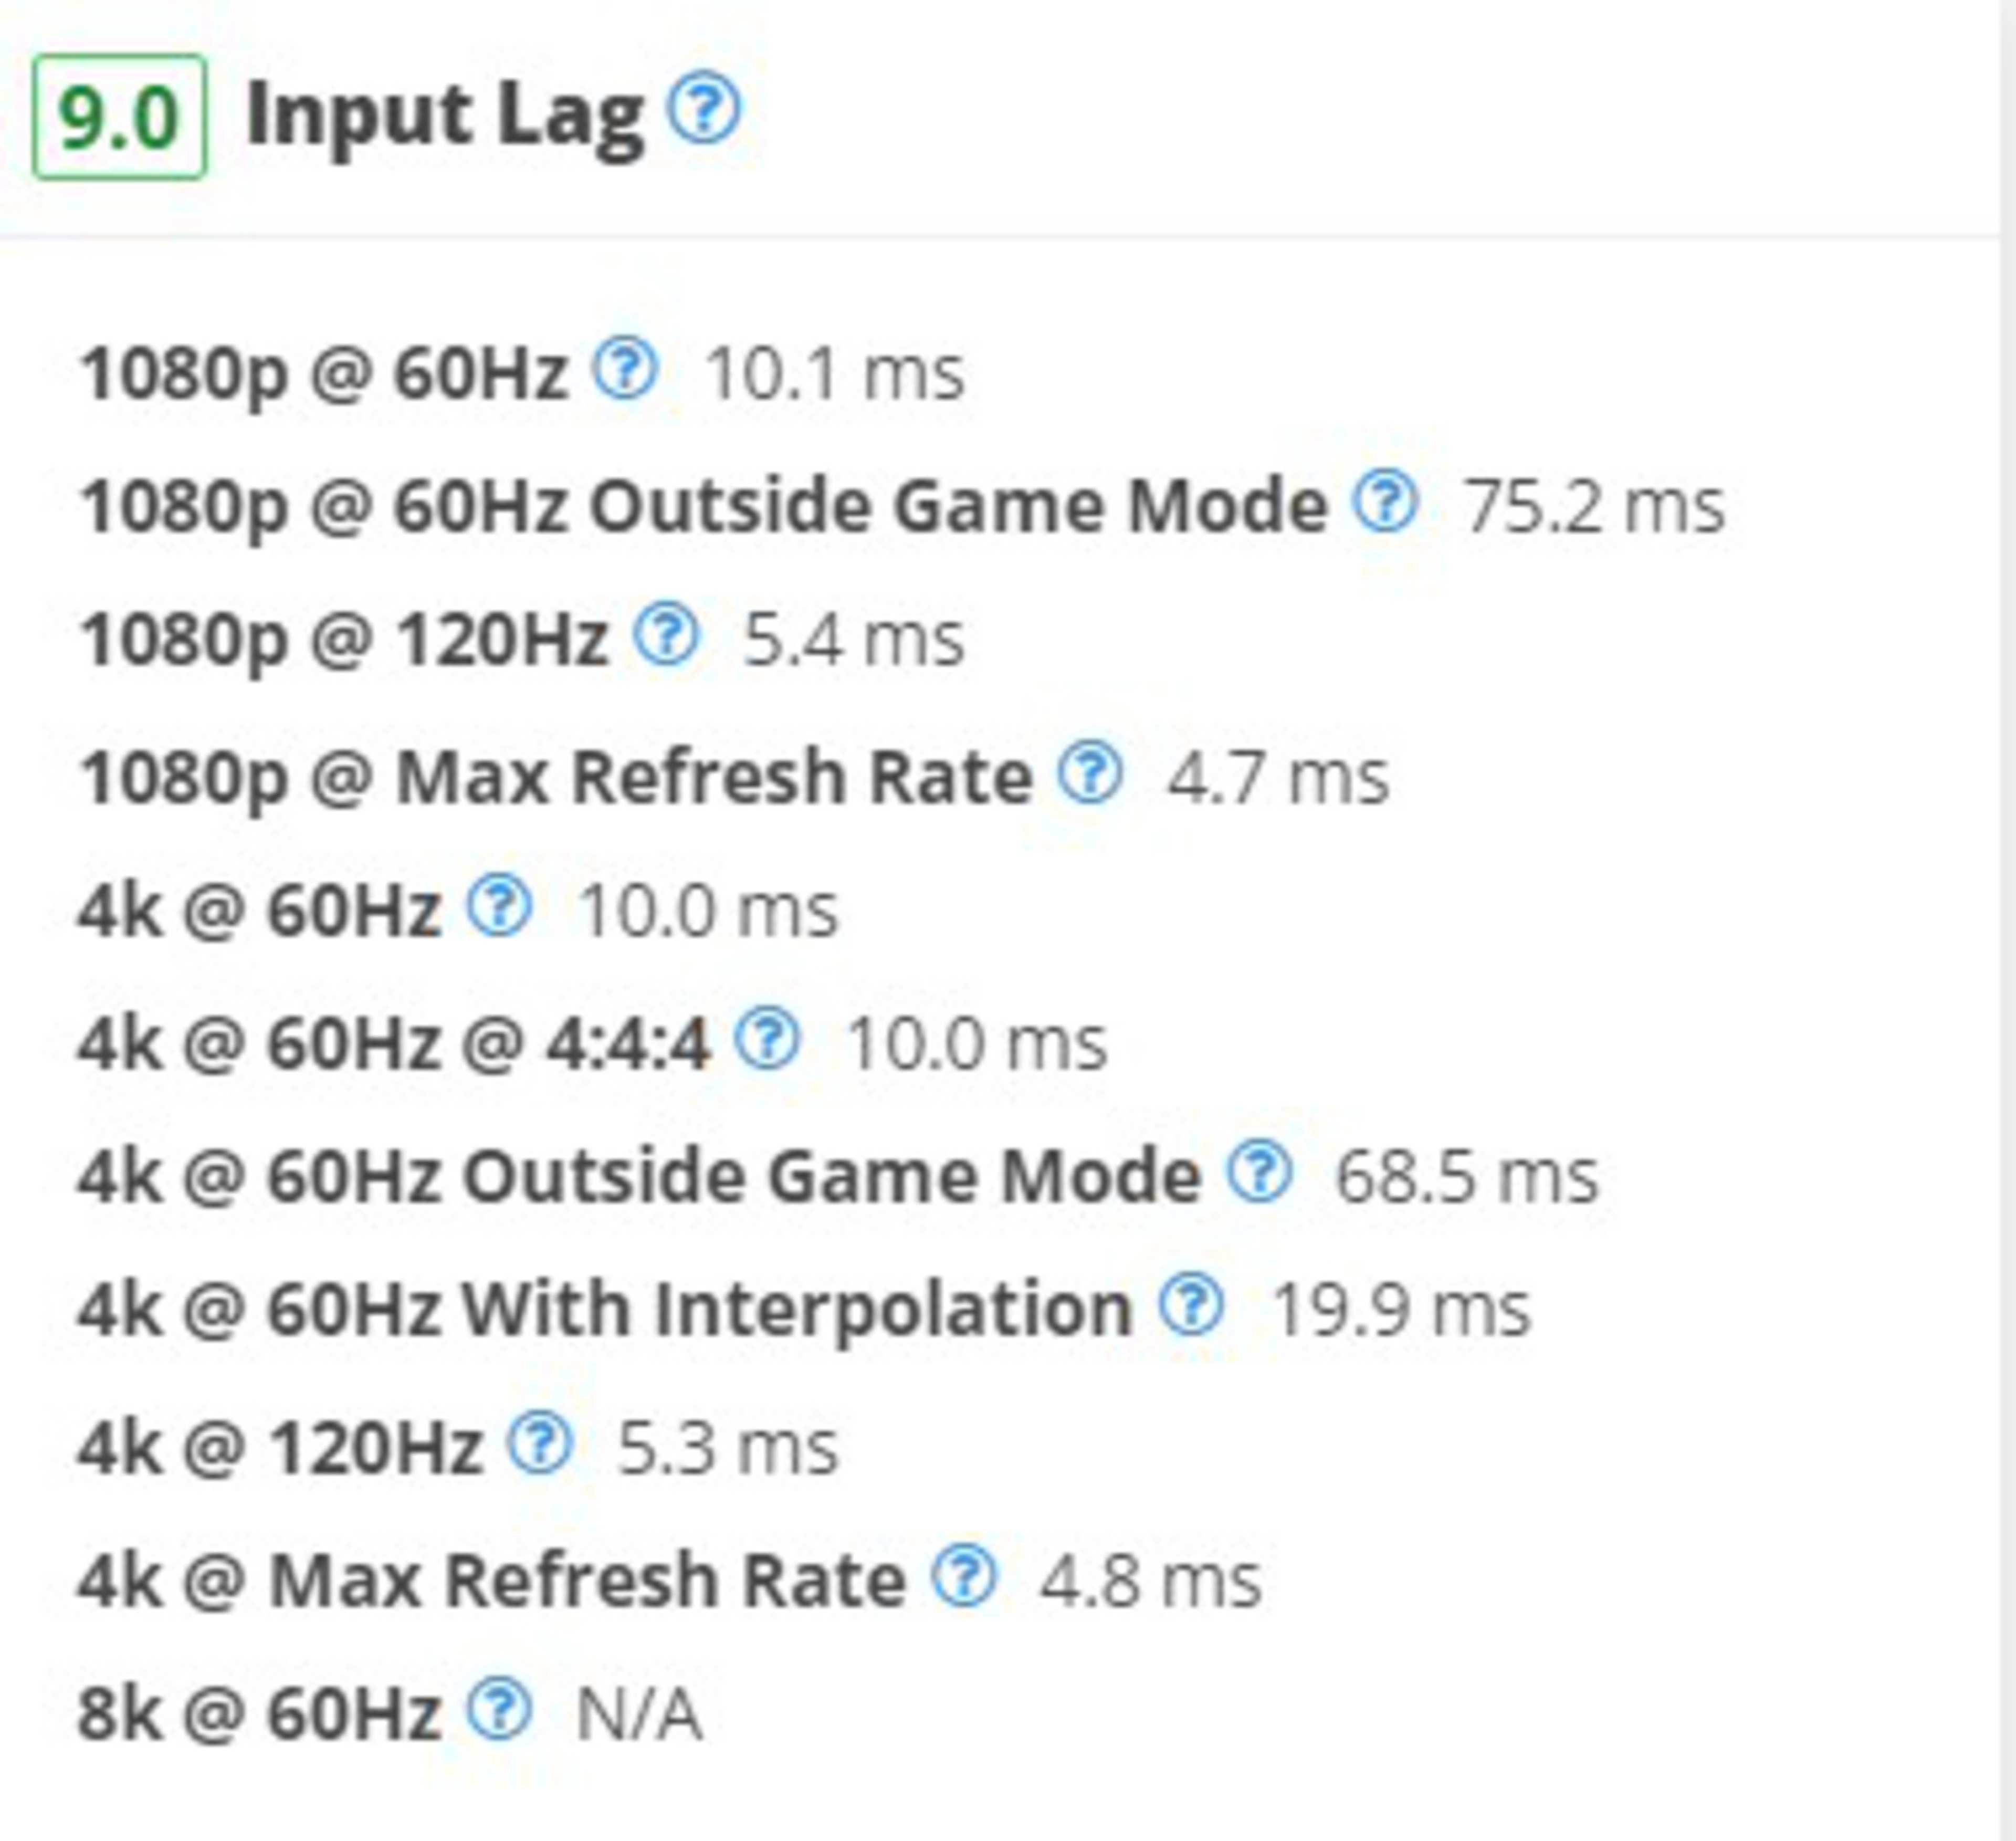 |
On TV 2.0, we decided to simplify the input lag test to remove formats that don't matter as much anymore, like 1440p. TVs were never designed for 1440p inputs, and with the rise of HDMI 2.1, PC gamers looking to render their games at 1440p to achieve a higher framerate can simply have their graphics card upscale the image to 4k anyway, so it doesn't matter. This change isn't just on input lag, as we've also removed tests for 1440p in the Variable Refresh Rate and Supported Resolutions sections of the review.
Beyond the test coverage itself, we've also made significant changes to our input lag scoring. Our scoring curve hasn't changed much in the last few years, but TVs have gotten a lot better. If input lag is important to you, it's difficult to make a buying decision when the best and worst TVs all score almost the same.
We also adjusted the 144Hz input lag measurements to instead measure the input at the maximum refresh rate a TV supports for both 1080p and 4k. With more and more TVs supporting 165Hz and even higher refresh rates, this ensures we're showing you the best input lag a given TV can provide.
HDR Format Support
We've moved the various HDR tests (HDR10, Dolby Vision, HDR10+, HLG) from the Inputs Specifications box into a new section called HDR Format Support.
Inputs Specifications & Total Inputs
Minor changes; we've moved the HDR tests mentioned above and combined this section with the Total Inputs section. We removed the tests for CEC and HDCP 2.2, as all TVs support these features. We also removed the tests for Component In, Analog Audio Out RCA, DisplayPort, and IR In.
Accelerated Longevity Test
Our accelerated longevity test is running until Summer 2025, but since none of the TVs on the test are being updated to our 2.0 test bench, we decided to remove this section entirely. This ensures that no data is lost, and you'll still be able to see the brightness change over time and the uniformity slides for any TV that ran on the test.
Sound Quality
We've made the difficult decision to remove the distortion test, as it's not very useful in its current form. We plan to revisit our sound quality testing in a future test bench update.
Interface
We've removed the subjective performance-related tests, as they're not very representative of real-world performance.
Remote
We removed the Size, CEC Menu Control, Other Smart Features, and Remote App tests, as they weren't useful. We also changed the Voice Control test to a simple Yes/No.
42 TVs Updated
We have retested popular models. The test results for the following models have been converted to the new testing methodology. However, the text might be inconsistent with the new results.
- Hisense 75U8N
- Hisense A7N
- Hisense CanvasTV 2024
- Hisense QD7N
- Hisense U6N
- Hisense U7N
- Hisense U8N
- Hisense U9N
- LG B4 OLED
- LG C4 OLED
- LG G4 OLED
- LG QNED90T
- LG UT75
- Panasonic W95A
- Panasonic Z85A OLED
- Panasonic Z95A OLED
- Roku Select Series 2023
- Samsung DU7200
- Samsung DU8000
- Samsung Q60D
- Samsung Q70D
- Samsung Q80D
- Samsung QN85D
- Samsung QN900D 8K
- Samsung QN90D
- Samsung QN95D
- Samsung S85D OLED
- Samsung S90D OLED
- Samsung S95D OLED
- Samsung The Frame 2024
- Sharp AQUOS XLED FV1
- Sony A95L OLED
- Sony BRAVIA 3
- Sony BRAVIA 7
- Sony BRAVIA 8 OLED
- Sony BRAVIA 9
- Sony X90L/X90CL
- TCL NXTVISION
- TCL Q651G
- TCL QM751G
- TCL QM851G
- TCL S551G