See the previous 1.2 changelog.
See the next 2.0.1 changelog.
What's Changed?
This test bench update mainly focuses on improving motion testing with new tests and revamped motion testing, including a Cumulative Absolute Deviation (CAD) measurement that defines how much motion blur a monitor has. Besides that, we've also made some minor updates throughout to improve our methodology and usage scores. As this is such a big test bench update and our methodology has significantly improved, particularly with the new motion tests, we decided to upgrade the name to 2.0.
| Test Group | Description |
|---|---|
| Usages |
|
| Ergonomics |
|
| SDR Color Gamut |
|
| SDR Color Volume |
|
| HDR Color Volume |
|
| VRR Motion Performance |
|
| Refresh Rate Compliance |
|
|
Cumulative Absolute Deviation (CAD) @ Max Refresh Rate, 120Hz, and 60Hz |
|
|
Response Time @ Max Refresh Rate, 120Hz, and 60Hz |
|
| VRR Flicker |
|
| Backlight Strobing (BFI) |
|
|
PS5 Compatibility Xbox Series X|S Compatibility |
|
| Resolution |
|
Response Time
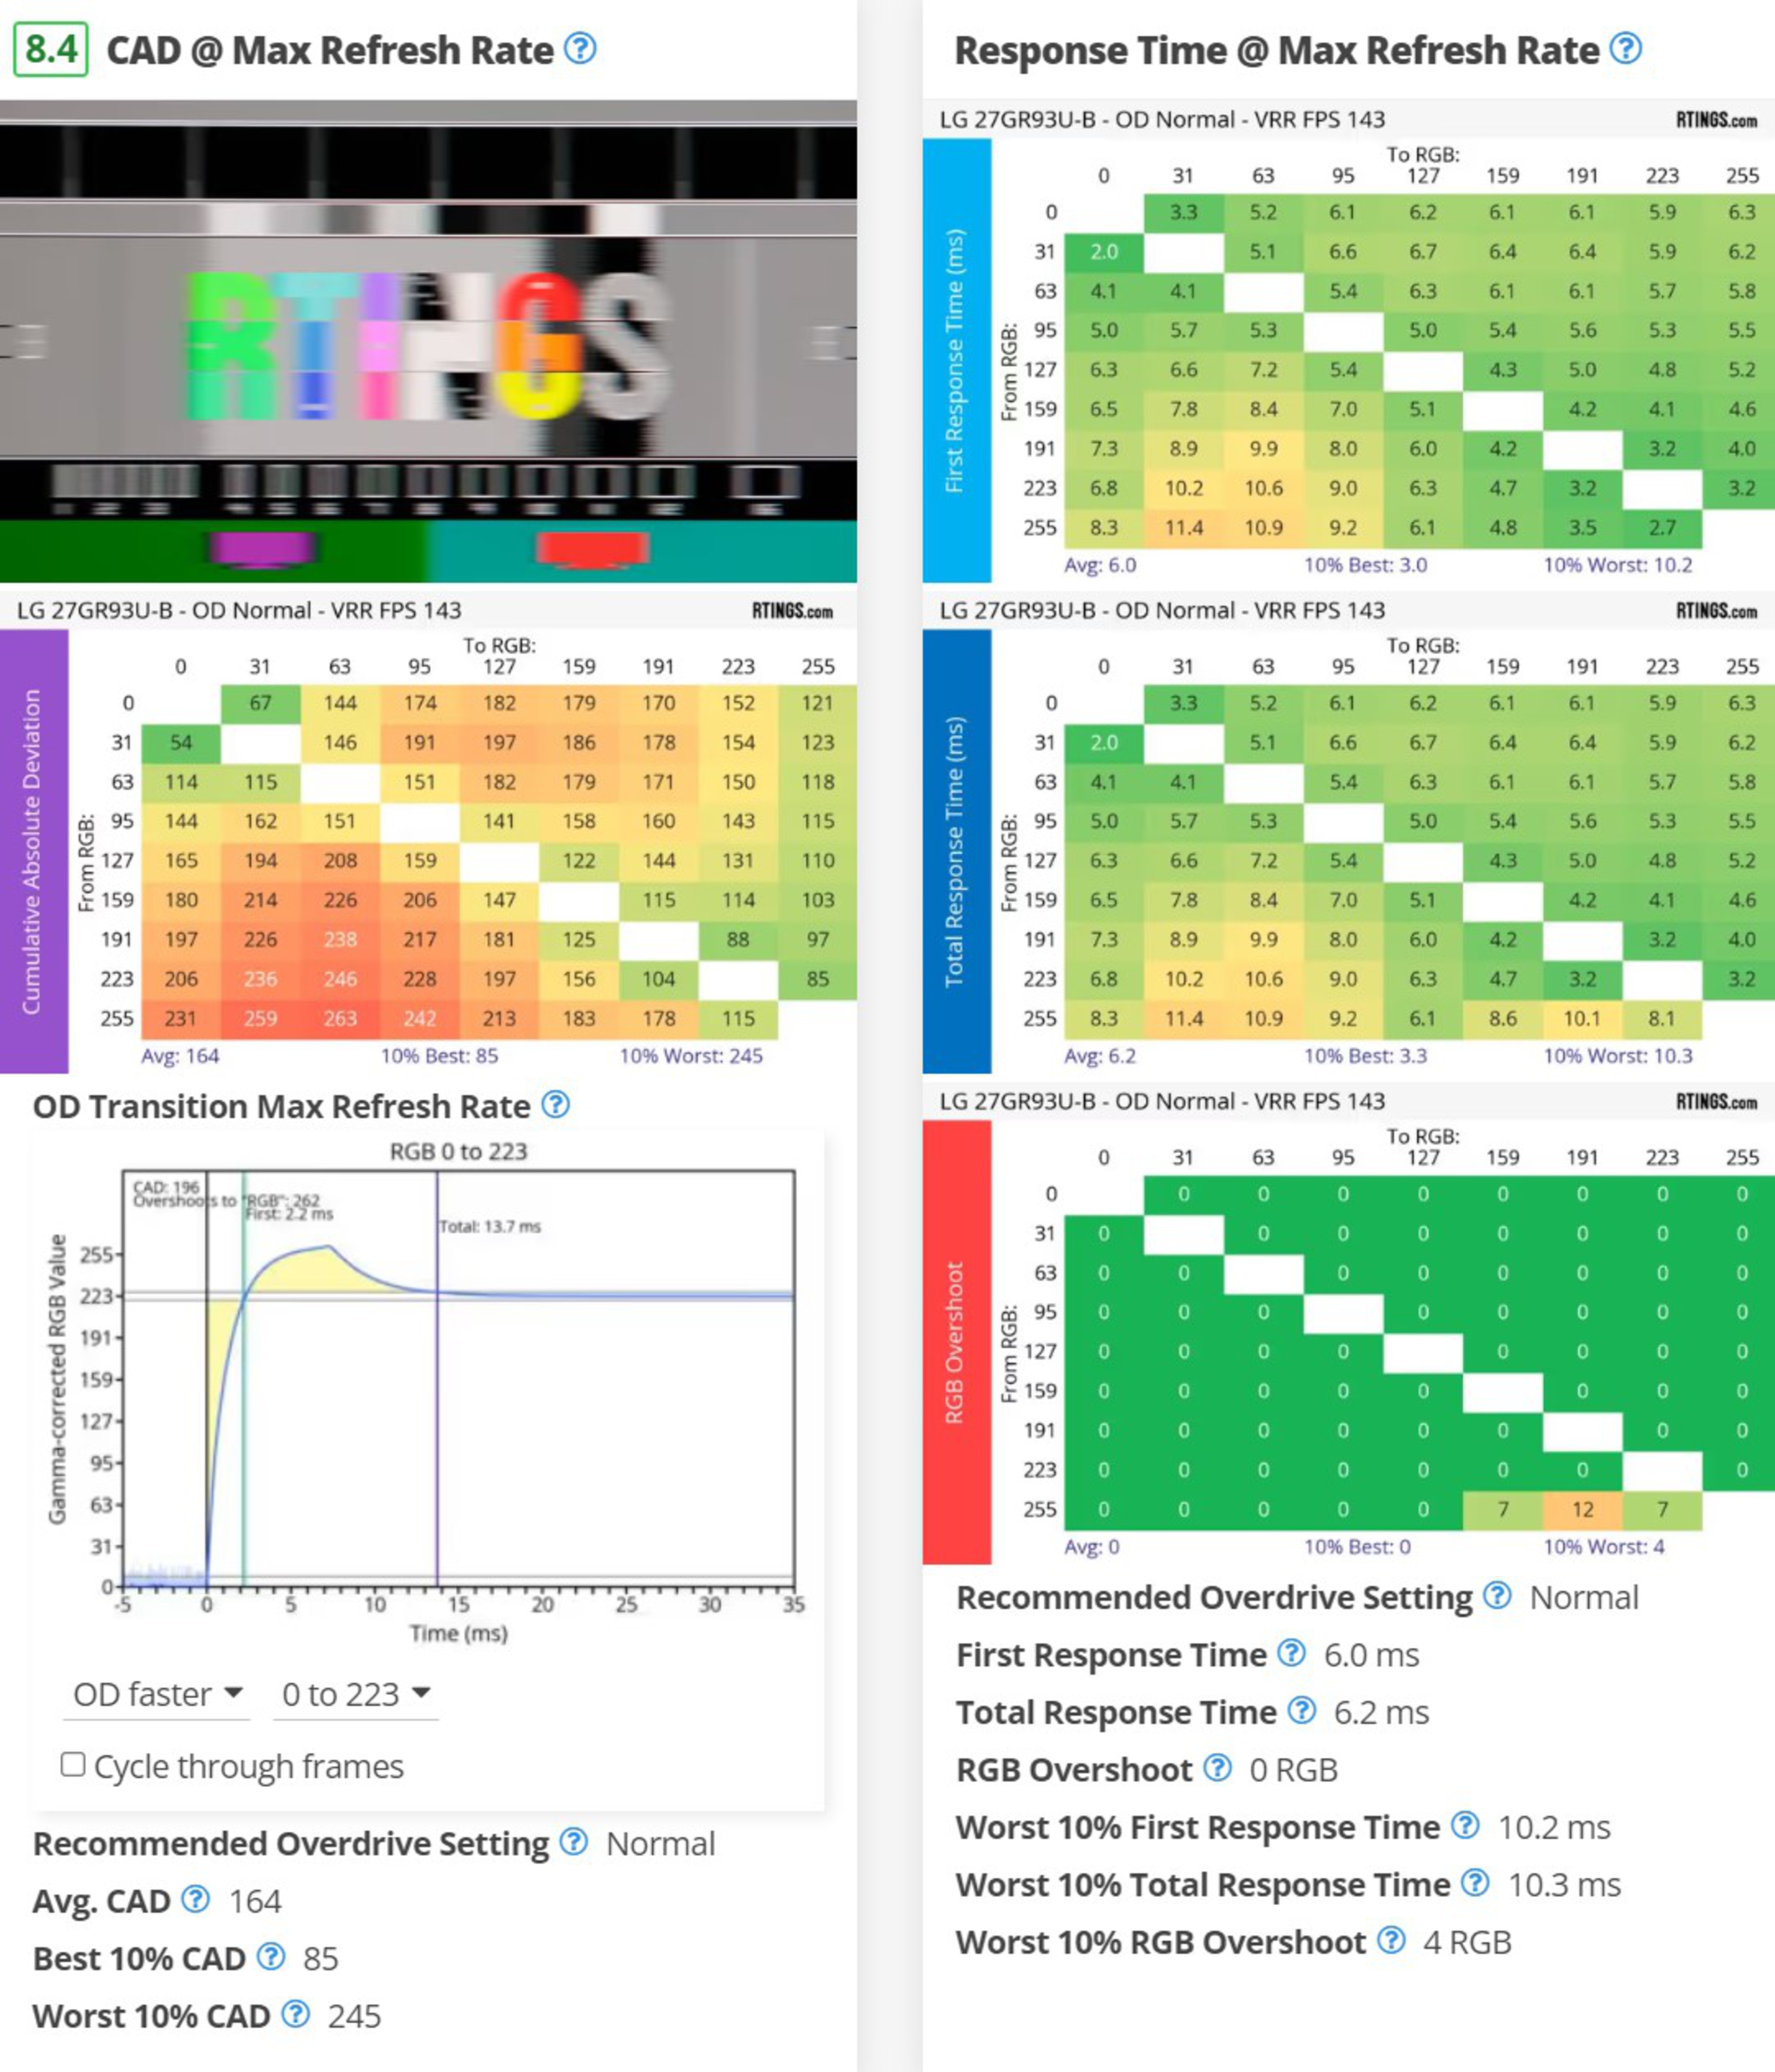
Our revamped response time testing is the biggest change in this test bench update. We designed a new response time tool, and we use gamma correction to measure the response time and overshoot more precisely. On top of that, we measure 72 unique gray-to-gray transitions for a more extensive response time measurement than before, which measured 30 gray-to-gray transitions.
Unlike previous test benches, this box is no longer scored; it's there to provide extra data. We test the response time at the monitor's max refresh rate, at 120Hz, and at 60Hz.
- Recommended Overdrive Setting: Our recommended overdrive setting is the one with the lowest CAD.
- First Response Time: The first response time is the time it takes for the monitor to achieve its target RGB level. This is a change from the Rise/Fall Time we had on previous test benches. The final result is an average of all transitions.
- Total Response Time: This is the average of all total response times across all transitions, which is the time it takes for the monitor to stabilize at the target RGB level.
- RGB Overshoot: The average overshoot of all transitions. Unlike previous test benches, this is given as an absolute value of total RGB that it overshoots its target by, as opposed to a percentage.
- Worst 10% First Response Time: This is an average of 10% of the worst transitions in terms of first response times.
- Worst 10% Total Response Time: This is an average of 10% of the worst transitions in terms of total response times.
- Worst 10% RGB Overshoot: This is an average of 10% of the worst transitions in terms of RGB overshoot.
Cumulative Absolute Deviation (CAD)
CAD is an extension of response time testing, as it's a measurement to identify how close a pixel's response time transition is to an ideal transition. Essentially, it tells you how much time the pixel is away from an ideal state, and CAD increases when there's a slow response time or overshoot. You can see this with the yellow area highlighted in the chart on the bottom left. Monitors with high CAD have motion artifacts, so this is an important factor to consider regarding the overall appearance of motion.
We calculate the CAD at the monitor's max refresh rate, at 120Hz, and at 60Hz. Other elements of the test group include:
- Pursuit pattern photo: We take a photo of our new pursuit pattern to show what motion on the monitor looks like.
- OD Transition: This is where you can see the individual response time charts for all 72 transitions, including with any overdrive setting that a monitor may have. You can use the drop-down menu to select which transition you want to see.
- Recommended Overdrive Setting: Lists which overdrive setting has the lowest CAD.
- Avg. CAD: Average CAD of all 72 transitions at the monitor's recommended overdrive setting.
- Best 10% CAD: Average of 10% of the best transitions for CAD.
- Worst 10% CAD: Average of 10% of the worst transitions for CAD.
You can see examples of the new CAD and response time tests below. You can also learn more about CAD here.
VRR Motion Performance
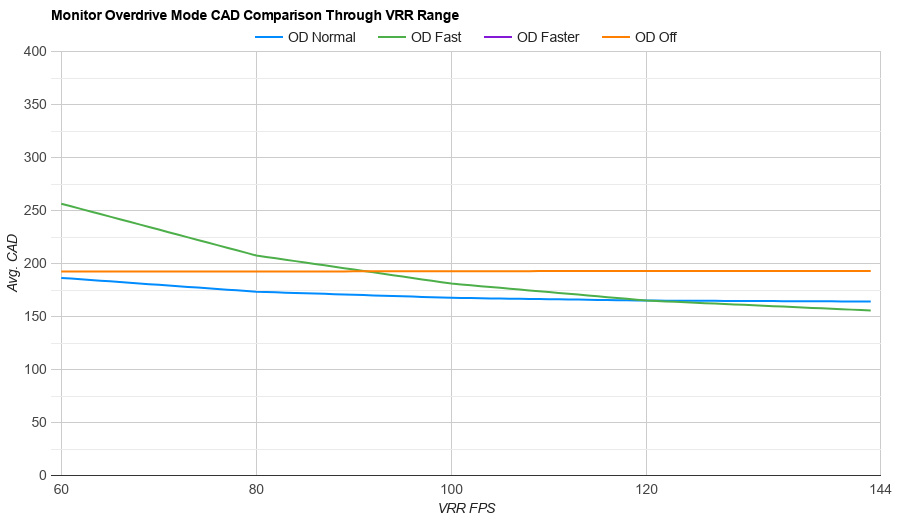
This new test evaluates a monitor's CAD over a wide refresh rate range with various overdrive settings that may be available. While the response time and CAD tests are helpful for playing games at fixed refresh rates, VRR motion performance is more useful if your games fluctuate frame rates and you want to know which overdrive setting performs the best over the entire range.
We plot the CAD results in a graph to show which overdrive settings consistently perform the best. We also list:
- Recommended VRR OD Setting: The overdrive setting with the lowest CAD and most consistent performance. Although this is subjectively chosen, we choose something that's consistently low over the refresh rate range.
- Variable Overdrive Advertised: Whether or not the manufacturer advertises variable overdrive, which can help provide consistent performance over the entire refresh rate range.
- Avg. CAD: Average CAD over the refresh rate range of the recommended overdrive setting.
- Best CAD: The lowest possible CAD at any point of the recommended overdrive. Ideally, it's close to the average CAD.
- Worst CAD: The highest possible CAD at any point of the recommended overdrive. Ideally, it's close to the average CAD.
You can learn more about VRR motion performance here.
Refresh Rate Compliance
Refresh rate compliance is a way to measure if a monitor's response time is fast enough to make full color transitions before the monitor draws a new frame. It's measured as a percentage versus a hypothetical monitor with 100% compliance.
There are two graphs in this test box. The first (on the left) represents the compliance of its recommended overdrive setting with our gray-to-gray sequence, and it shows the compliance at various frame rates, from 60 fps up to its max. The second graph (on the right) represents the compliance over its refresh rate range with various overdrive settings that a monitor may have. This helps you see which overdrive setting has the highest compliance.
We measure the compliance at its max refresh rate, at 120 fps, and at 60 fps.
You can learn more about refresh rate compliance here. You can also use our interactive tool to look at these graphs here.
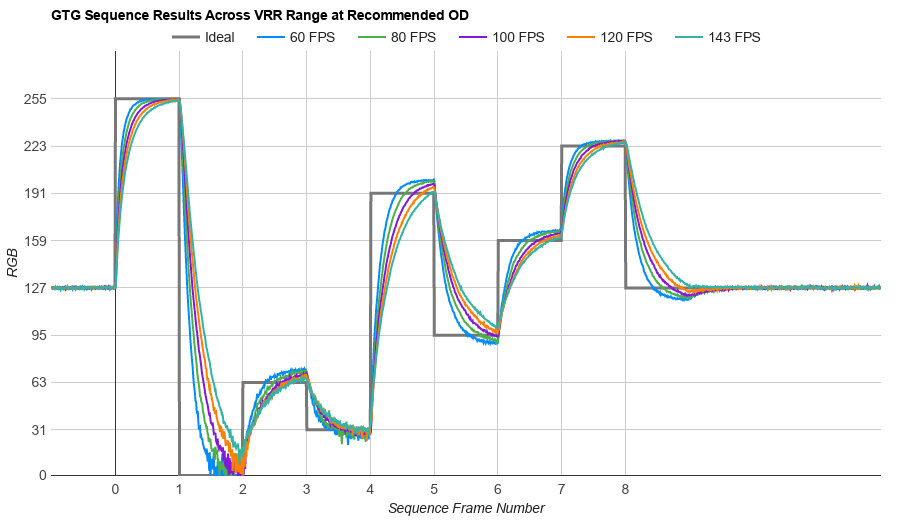 Fast GTG Sequence Graph
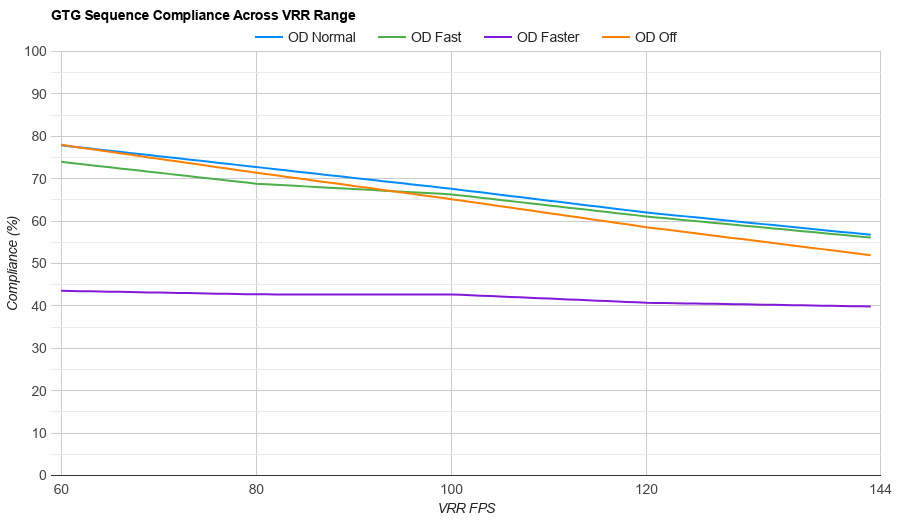 VRR Compliance Graph
VRR Flicker
Another new test in Test Bench 2.0 is VRR Flicker. A common problem with many gaming monitors is that there's VRR flicker with changing frame rates that's most noticeable in dark scenes and can get distracting while gaming. Using our gamma-corrected response time tool, we can measure any fluctuation in gamma with VRR enabled at changing frame rates. The change in gamma gives this distracting appearance of flicker, but it's different from backlight flicker. This test is important if you play games that can't maintain steady frame rates and want to avoid getting a monitor with flicker issues.
You can learn more about the VRR flicker test here.
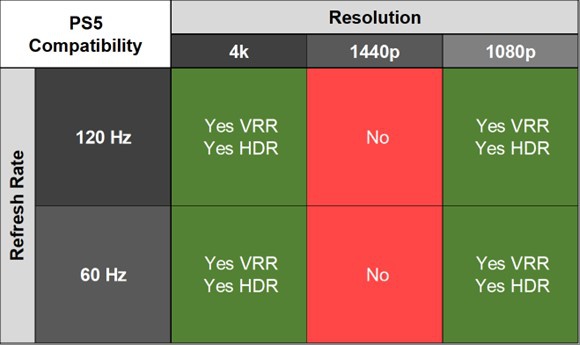
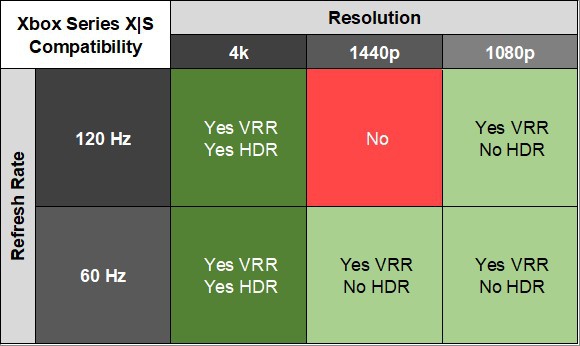
Console Compatibility
We added PS5 and Xbox Series X|S Compatibility in Test Bench 1.2 and improved it in Test Bench 2.0. We're now including tables with various resolutions and refresh rates so you can see which signals the monitor supports and if VRR and HDR work with each signal. You can see an example of each table below.
As the Xbox Series X|S only supports HDR with 4k signals, all monitors don't support HDR with 1440p or 1080p on the console. It's important to remember that this is a limitation of the console and not the monitor.
We also changed the scoring system to reflect VRR and HDR support with each console.
HDR Color Volume
Another change we've made in testing is with HDR Color Volume, which is now tested similarly to TVs. Unlike previous test benches, which targeted a normalized color volume target, we now target unnormalized targets with 1,000 cd/m² in DCI-P3 and 10,000 cd/m² in Rec. 2020. With this change, we can better compare each monitor's performance against each other, as using normalized targets limits the color volume to each display's peak brightness.
Unlike the past test bench, the HDR color volume score is now based entirely on the Rec. 2020 color volume.
Old - Normalized DCI-P3 Color Volume (84.9%)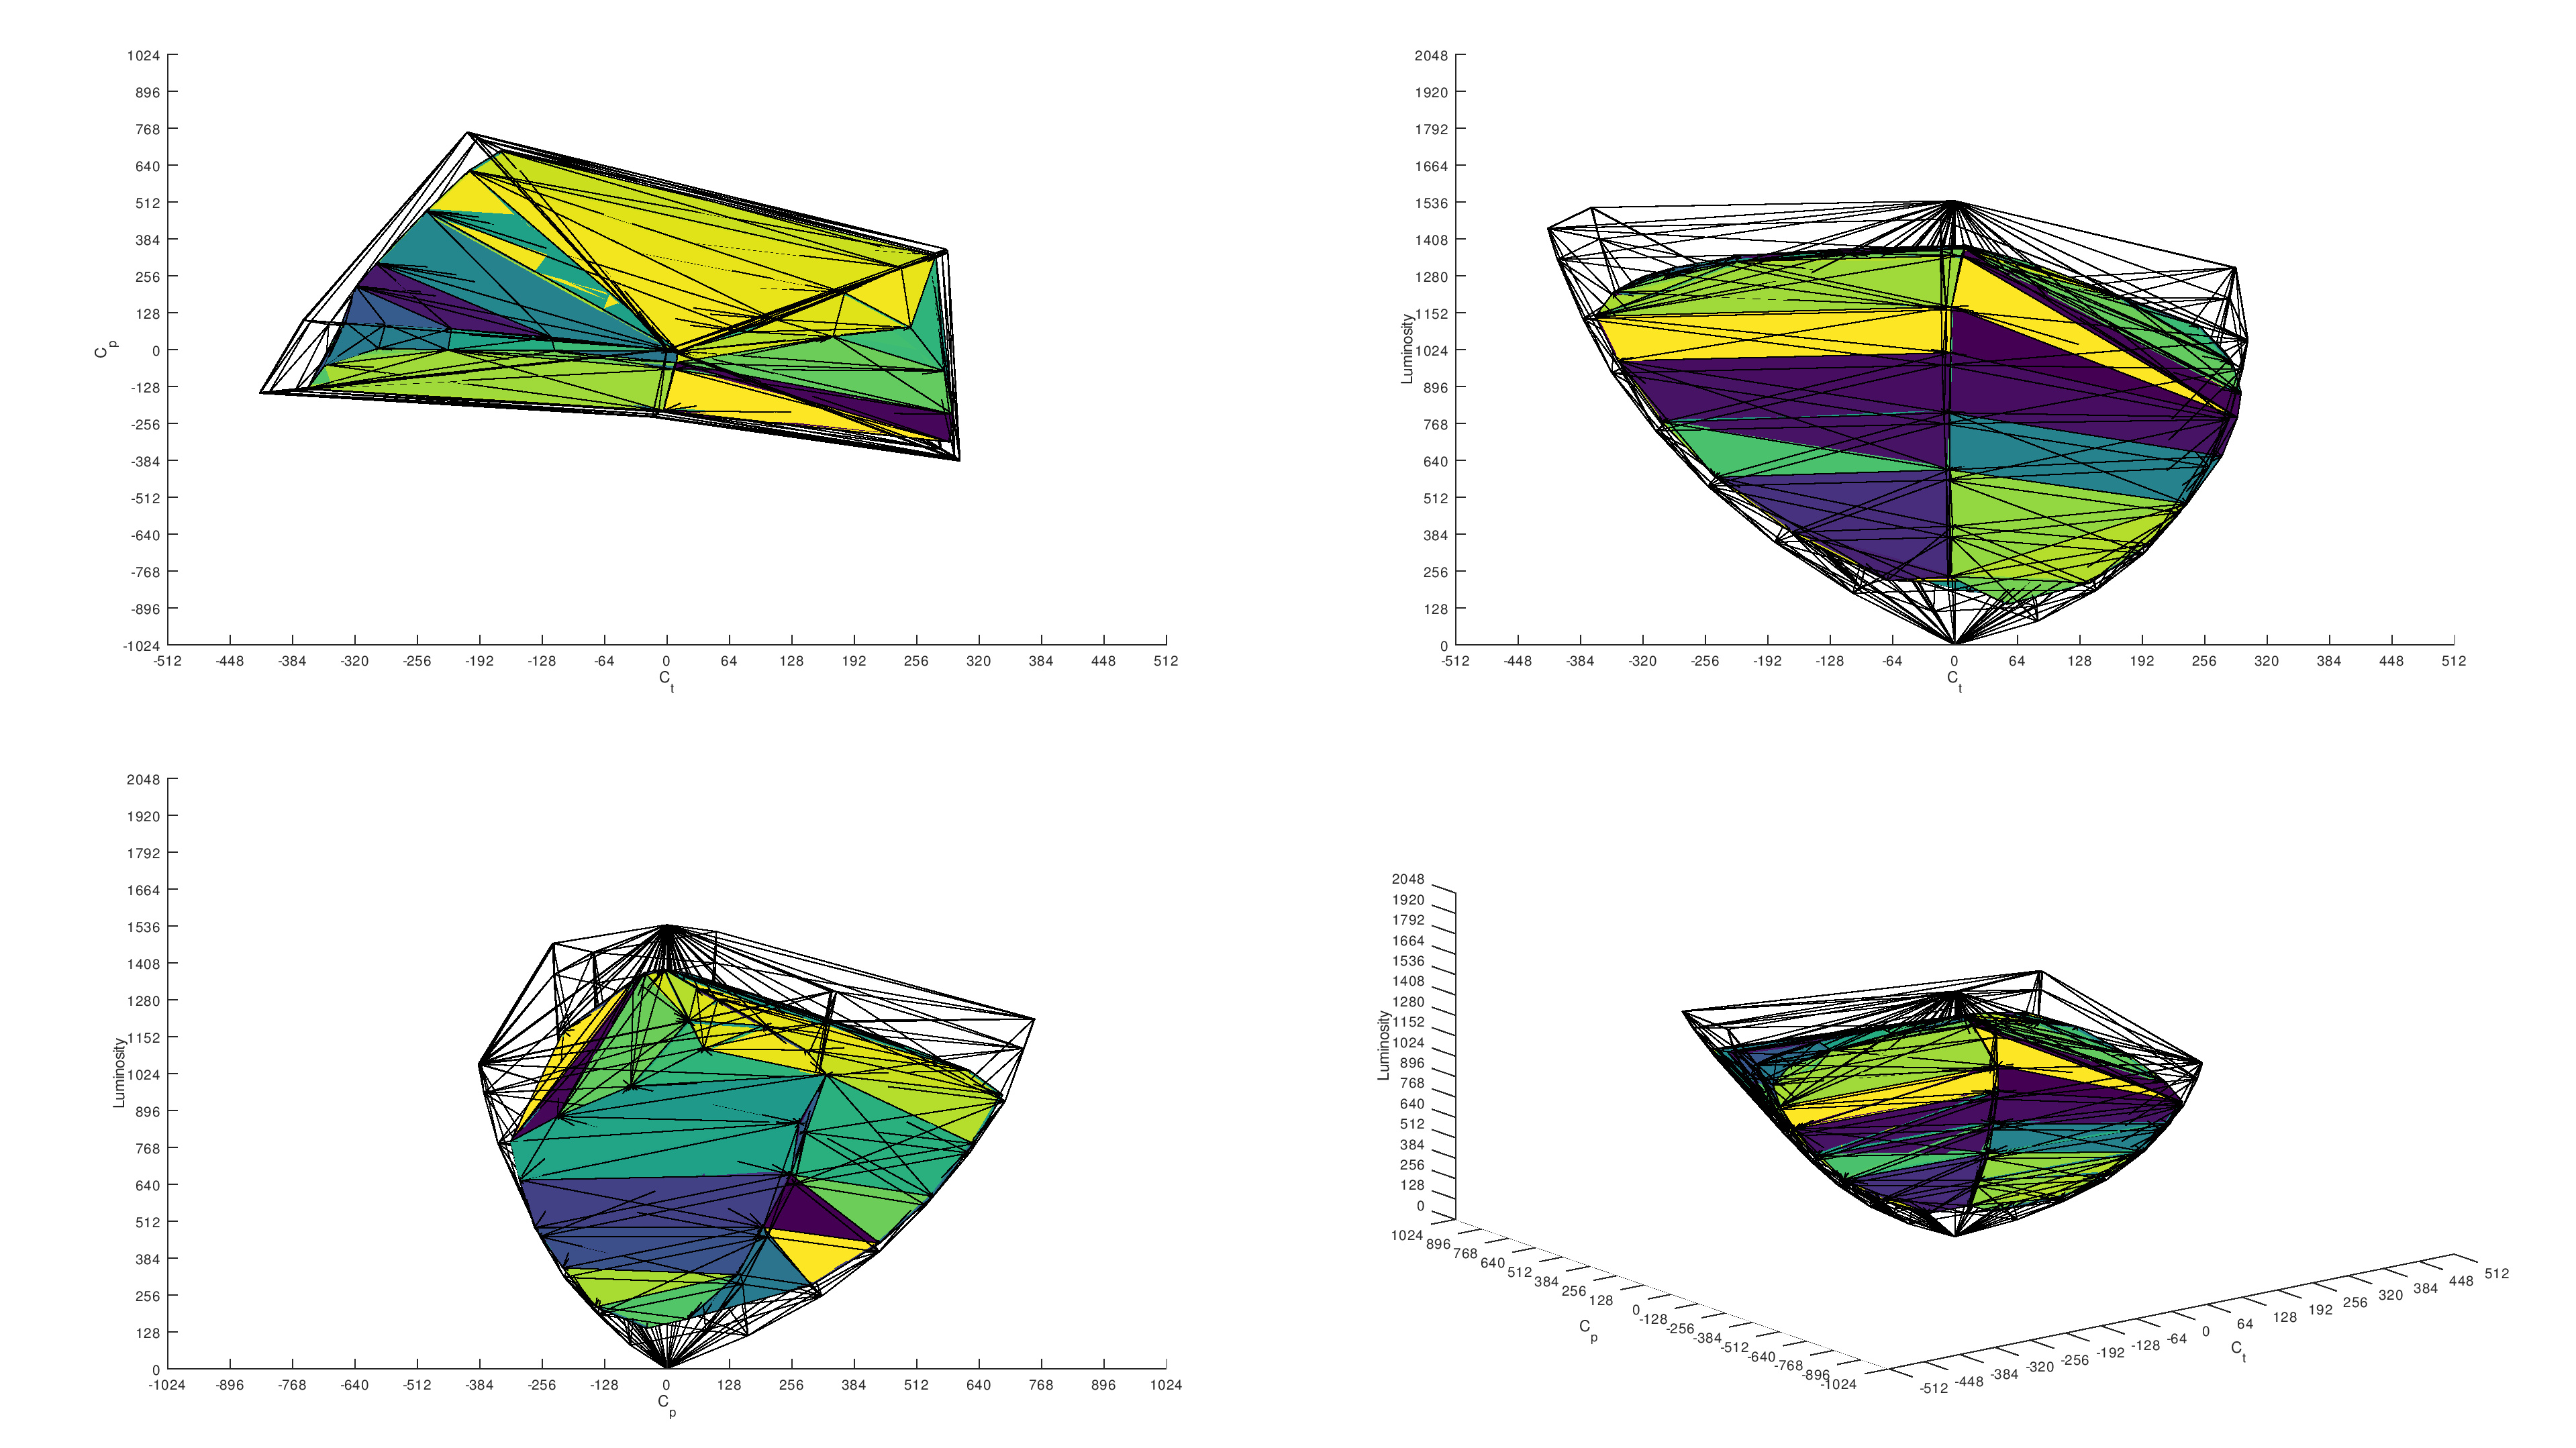 New - Unnormalized DCI-P3 Color Volume (68.4%)
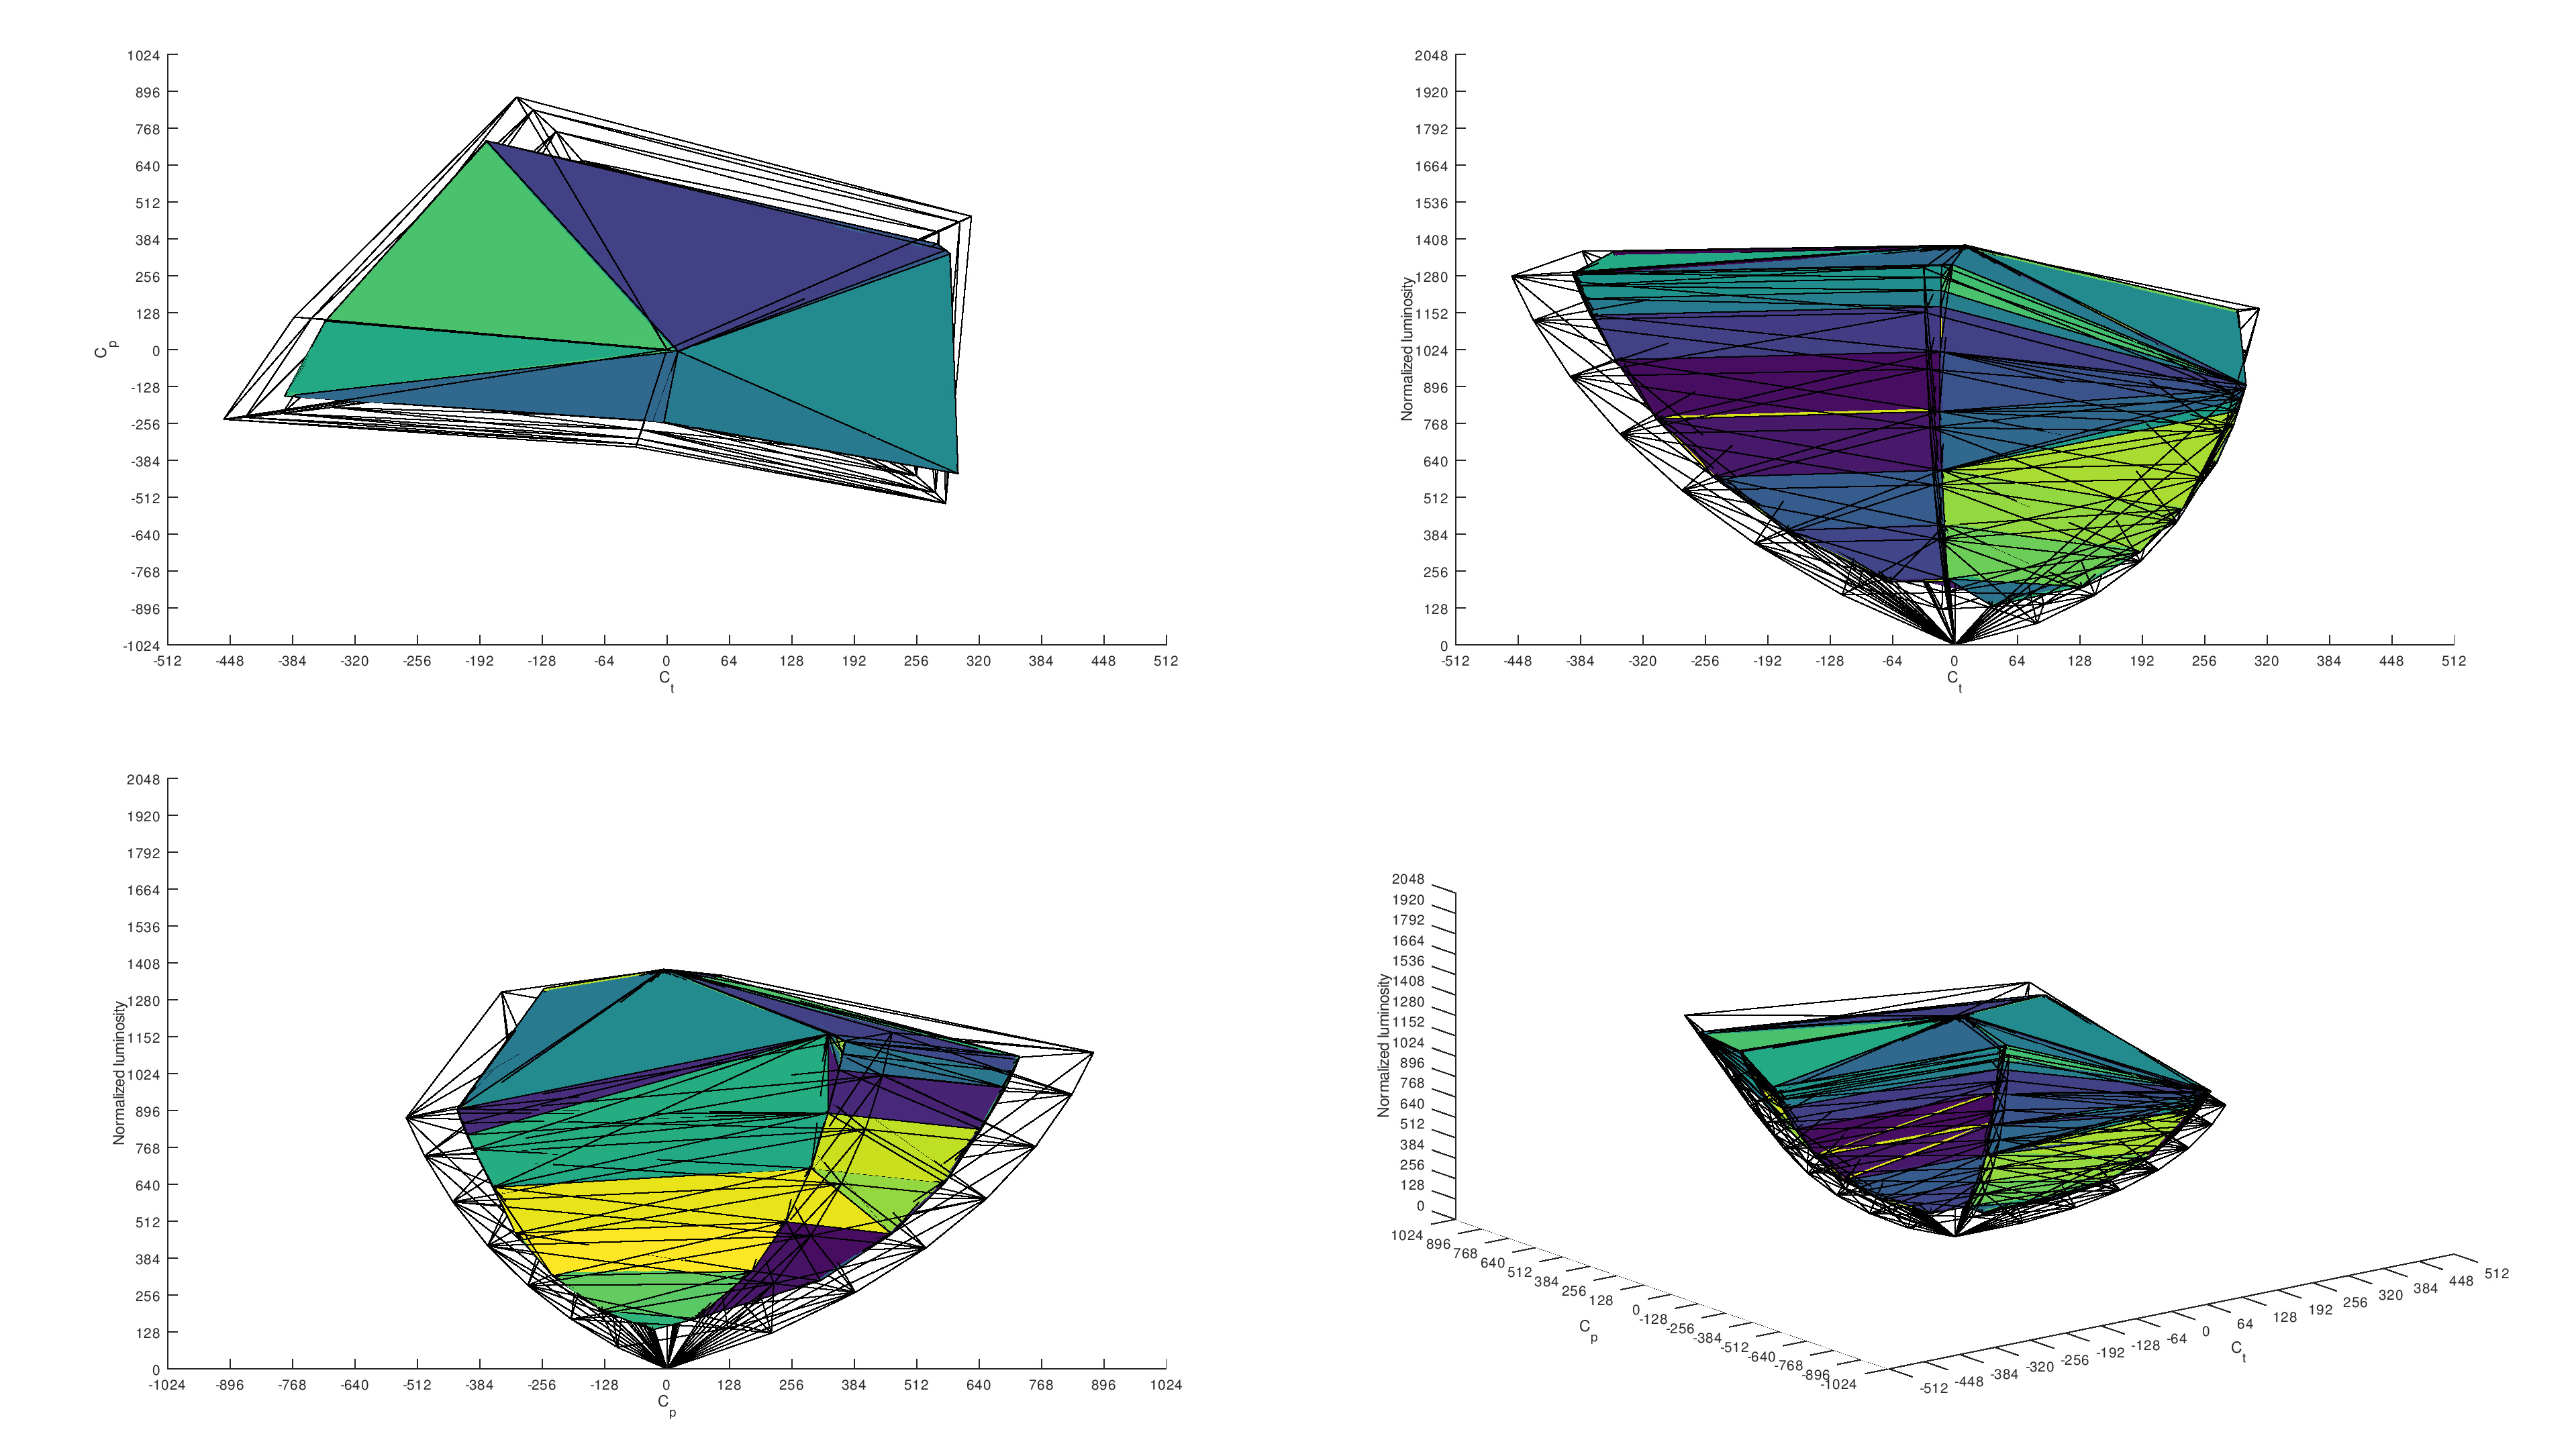 Old - Normalized Rec. 2020 Color Volume (70.3%)
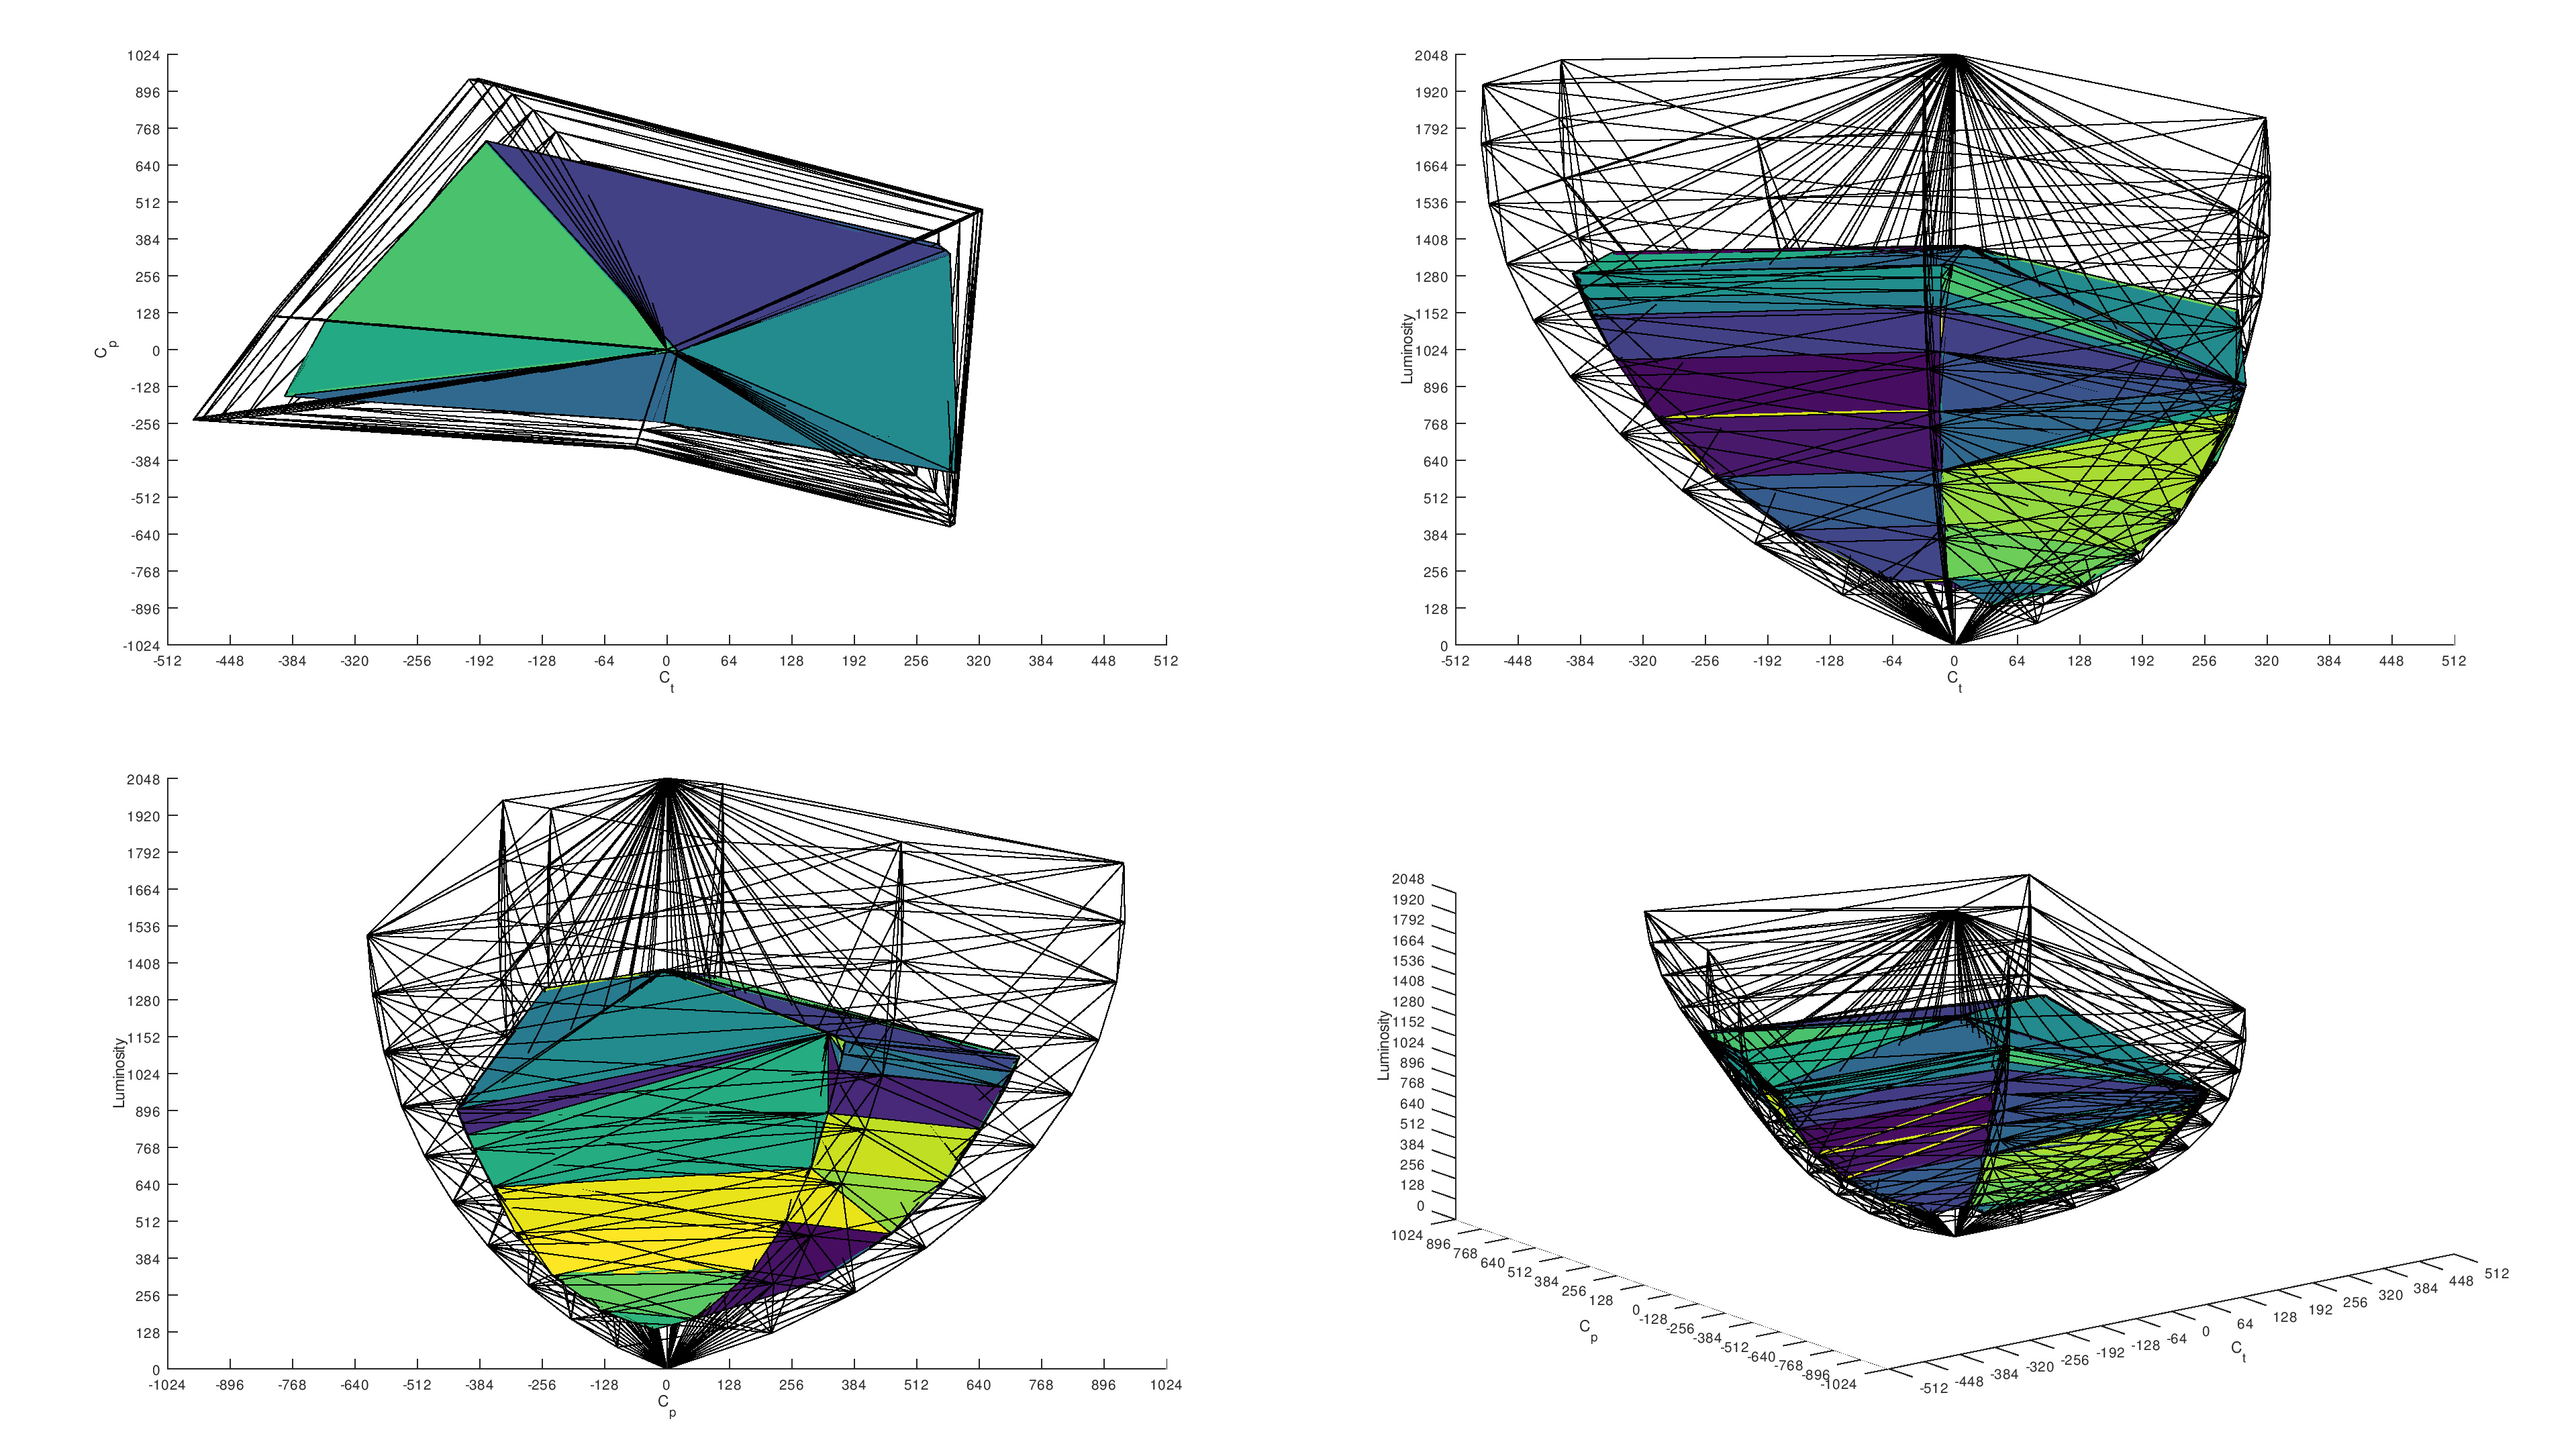 New - Unnormalized Rec. 2020 Color Volume (33.7%)
Usage Ratings
We've added and removed several usage ratings in the Our Verdict section, renamed Media Creation to Editing, and overhauled each of their scoring weight systems. We also split up the Gaming usage into PC Gaming and Console Gaming. You can see the differences between the weightings of the old test bench versus the new one.
| Usage | Before | After |
|---|---|---|
| PC Gaming |
|
|
| Console Gaming | N/A |
|
| Office |
|
|
| Editing |
|
|
We removed the Mixed Usage, HDR, and Media Consumption usage scores in Test Bench 2.0.
Performance Usages
We've added a new section of scores called Performance Usages. These are meant to represent performance-related aspects of the monitor and not one specific use like the typical usage scores. The new performance usages are Brightness, Response Time, HDR Picture, SDR Picture, and Color Accuracy. These are also included in the typical usage scores above.
Let Us Know What You Think!
Your feedback is instrumental in making improvements to our testing. If you have comments, questions, or suggestions about this or any future updates, reach out to us in the forums.
72 Monitors Updated
We have retested popular models. The test results for the following models have been converted to the new testing methodology. However, the text might be inconsistent with the new results.
- Acer Nitro XV275K P3biipruzx
- Acer Predator XB273U GXbmiipruzx
- AOC Q27G3XMN
- Apple Studio Display 2022
- ASUS ProArt Display PA279CRV
- ASUS ROG Swift OLED PG27AQDM
- ASUS ROG Swift OLED PG34WCDM
- ASUS ROG Swift PG279QM
- ASUS ROG Swift Pro PG248QP
- ASUS TUF Gaming VG27AQL1A
- ASUS TUF VG27AQ
- BenQ ZOWIE XL2566K
- Corsair XENEON 27QHD240
- Corsair XENEON FLEX 45WQHD240
- Dell Alienware AW2523HF
- Dell Alienware AW2524H
- Dell Alienware AW2723DF
- Dell Alienware AW2724DM
- Dell Alienware AW2725DF
- Dell Alienware AW3225QF
- Dell Alienware AW3423DW
- Dell Alienware AW3423DWF
- Dell G2724D
- Dell G3223Q
- Dell S2721QS
- Dell S2722QC
- Dell S3422DWG
- Dell U2723QE
- Dell U3223QE
- Gigabyte GS27QC
- Gigabyte M27Q (rev. 1.0)
- Gigabyte M27Q (rev. 2.0)
- Gigabyte M27Q X
- Gigabyte M27U
- Gigabyte M32U
- Gigabyte M32UC
- HP OMEN 27qs
- INNOCN 27M2V
- Lenovo Legion Y32p-30
- LG 27GL850-B/27GL83A-B
- LG 27GP850-B/27GP83B-B
- LG 27GR75Q-B
- LG 27GR83Q-B
- LG 27GR93U-B
- LG 27GR95QE-B
- LG 27GS95QE-B
- LG 32GN650-B/32GN63T-B
- LG 32GP850-B/32GP83B-B
- LG 32GQ950-B
- LG 32GR93U-B
- LG 34GP83A-B
- LG 40WP95C-W
- LG 49GR85DC-B
- MSI G274QPF-QD
- MSI MEG 342C QD-OLED
- MSI MPG 271QRX QD-OLED
- MSI Optix G321CU
- MSI Optix MAG274QRF-QD
- Samsung Odyssey G50A S27AG50
- Samsung Odyssey G51C S27CG51
- Samsung Odyssey G55A S27AG55
- Samsung Odyssey G55C S27CG55
- Samsung Odyssey G7 C32G75T
- Samsung Odyssey G7/G70B S32BG70
- Samsung Odyssey Neo G7 S32BG75
- Samsung Odyssey Neo G8 S32BG85
- Samsung Odyssey Neo G9/G95NA S49AG95
- Samsung Odyssey Neo G9/G95NC S57CG95
- Samsung Odyssey OLED G85SB S34BG85
- Samsung Odyssey OLED G9/G95SC S49CG95
- Sony INZONE M9
- ViewSonic XG2431