
See the previous 1.10 changelog.
Goal
With our 1.11 test bench update, we wanted to address one of the oldest issues with our TV test methodology: upscaling. For years you've been telling us that our upscaling tests were too limited and the scoring was too similar to be very helpful when making a buying decision.
The second goal is to fix a more recent issue that came up. We made significant changes to our local dimming and contrast tests as part of our 1.9 test bench update, and unfortunately, as we've tested more products, it's become clear that our approach wasn't perfect. With 1.9, we wanted to fix an issue with some TVs scoring too low, but unfortunately, we went a bit too far, and those same TVs were scoring too high, resulting in some strange comparisons that didn't make much sense, as entry-level TVs with high contrast but no local dimming were scoring higher than high-end models with full array local dimming.
Summary Of Changes
Below is a summary of the changes we've made in this update. More detailed information on the changes made to each test is available below this table.
| Test Group | Change |
|---|---|
| Scoring Changes |
|
| Blooming |
|
| Black Crush |
|
| Upscaling |
|
| Supported Resolutions |
|
Issues with our scoring
In our 1.9 TV test bench update, we made the largest changes to our contrast and local dimming tests in years. These changes were made for good reasons—our scoring simply didn't work anymore, and our tests didn't represent a real-world experience. One of the biggest issues with the old scoring was our usage weights. The Movie score, for example, had a component for local dimming that was worth 20% of the total score, so TVs that lacked local dimming automatically scored up to 20% lower than TVs that did—regardless of how well the TV looked in a dark room.
This led to strange results, with nearly identical TVs scoring very differently simply due to a lack of local dimming. One of the most obvious examples was the Sony X90K and the Sony X85K. These TVs are nearly identical—the only significant difference is that the X85K lacks a local dimming feature. Our scoring didn't show this very well, though, as the overall scores for these TVs before our 1.9 update made it seem like the X85K was vastly inferior to the X90K, with the X85K appearing as one of the worst TVs for watching movies, while the X90K was one of the best, with an 8.3 score for Movies.
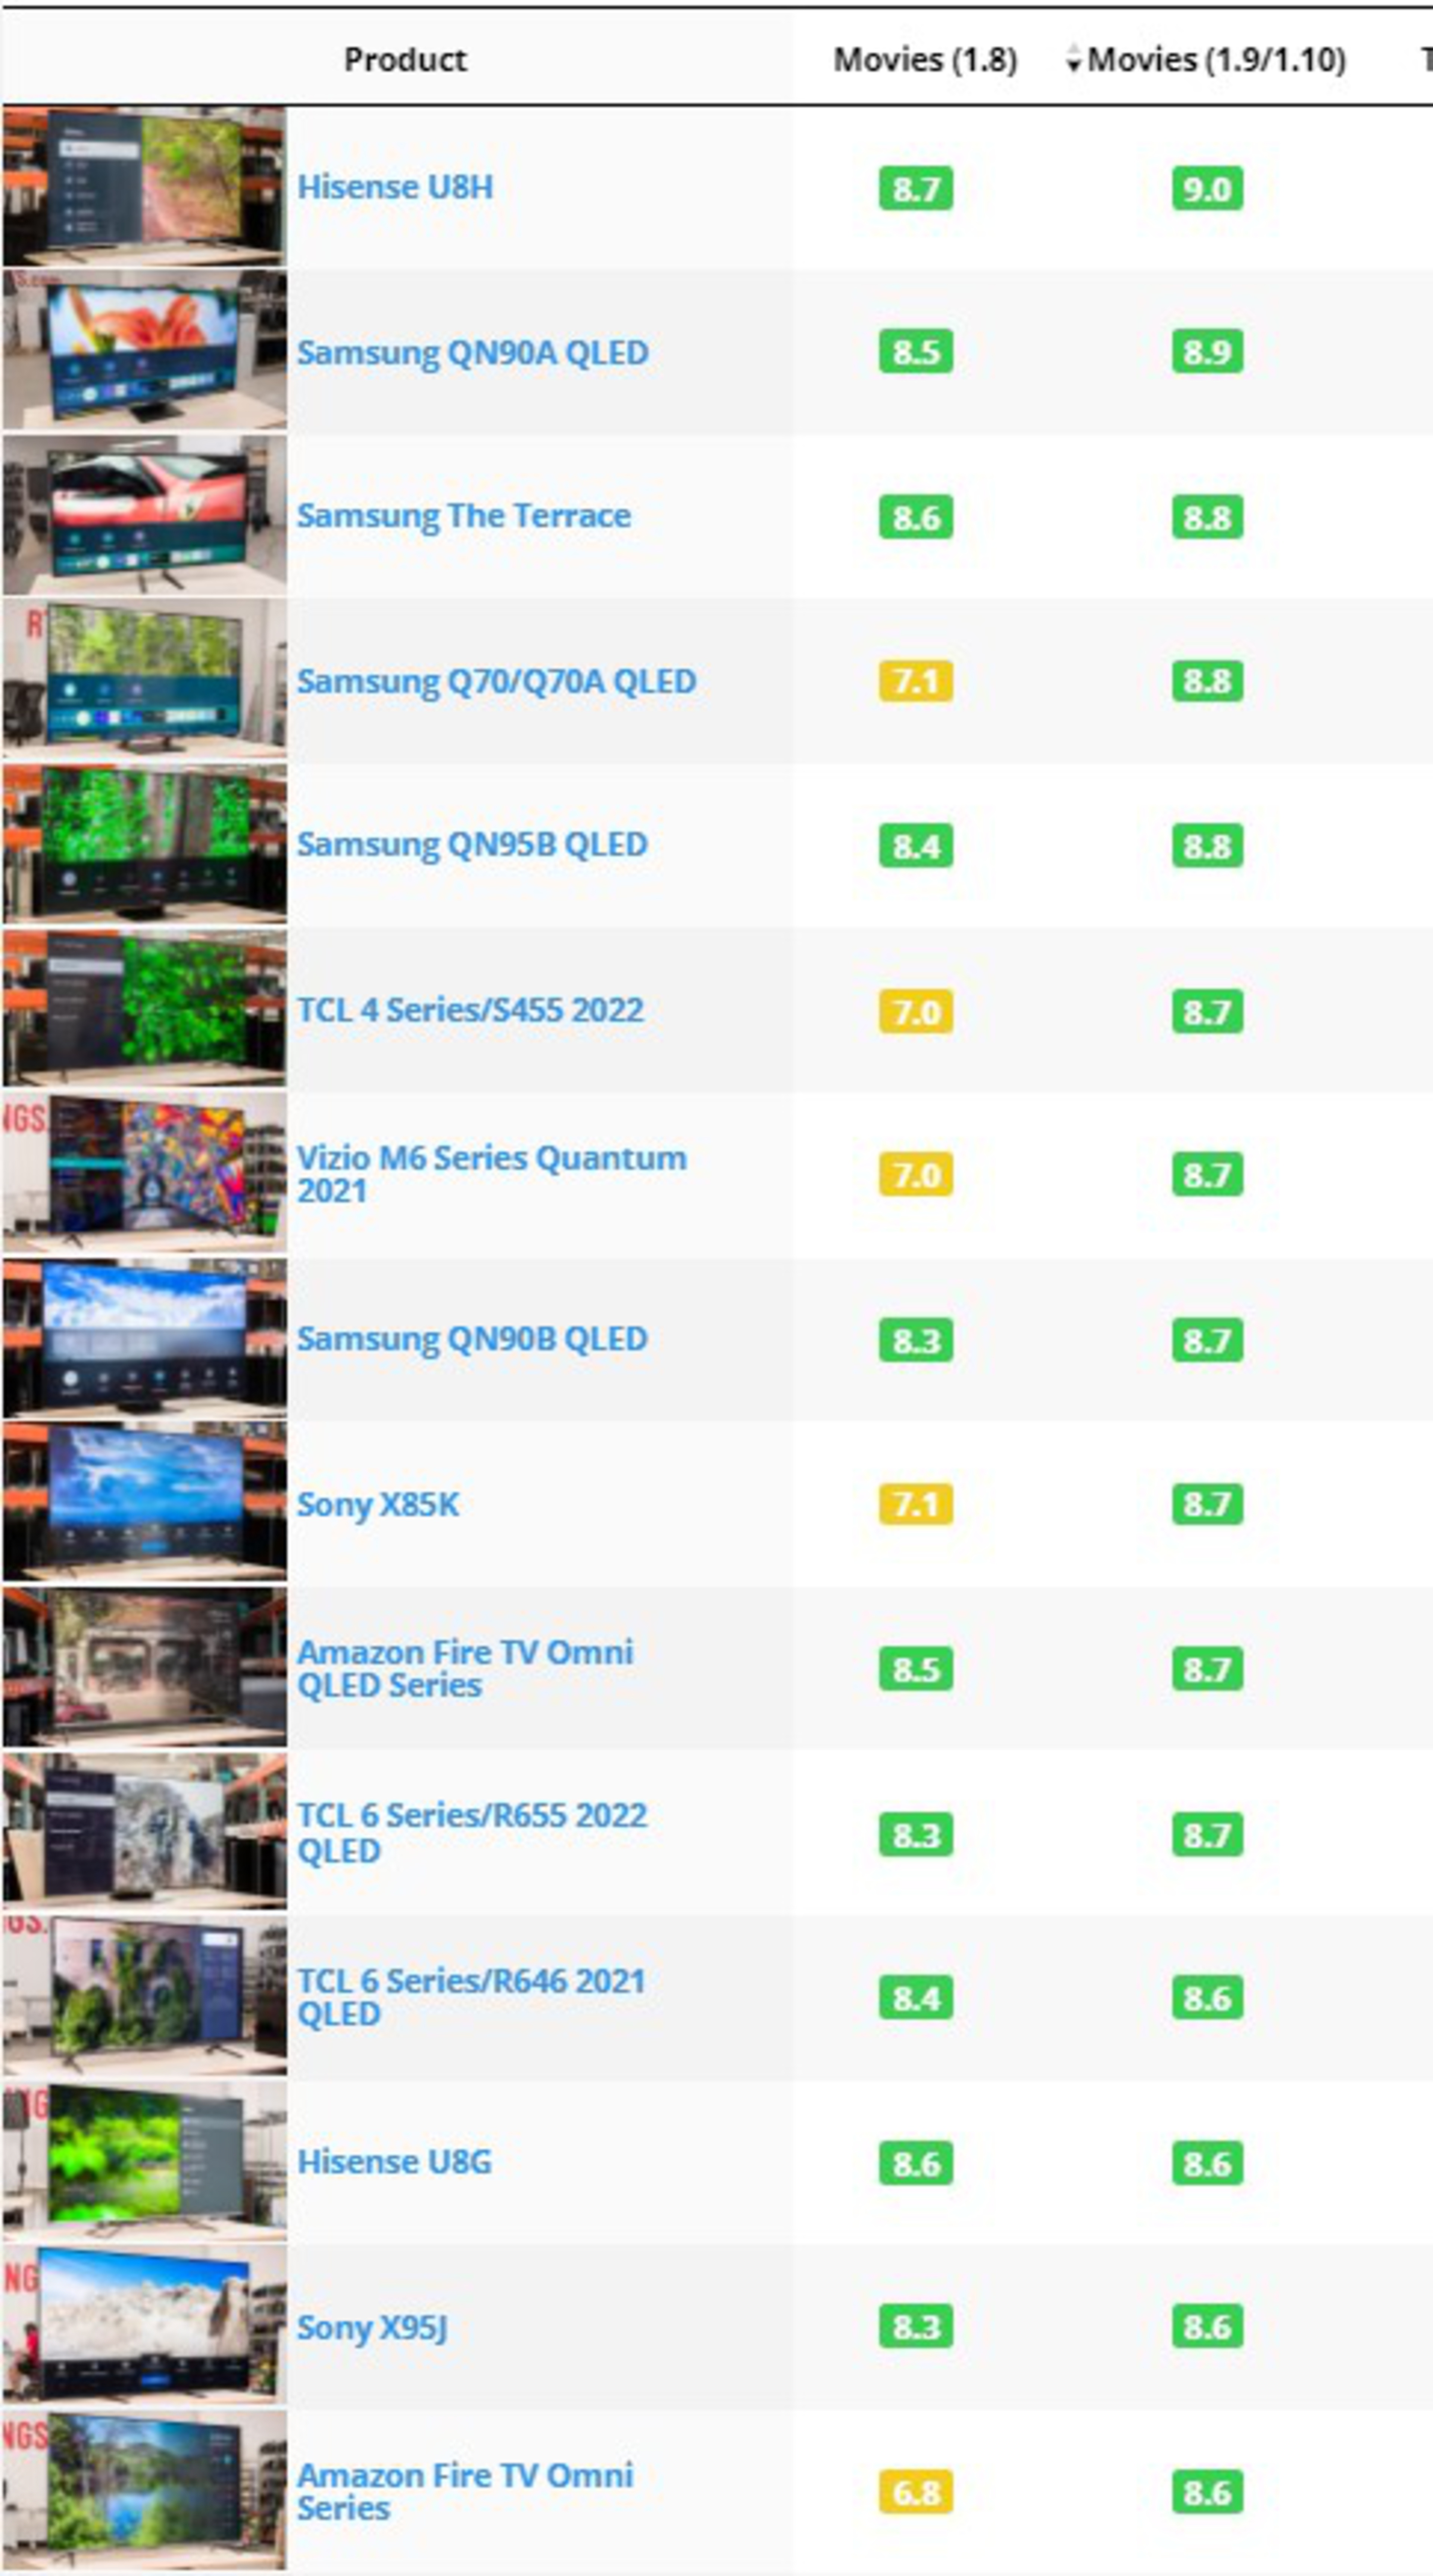
Our solution to this in 1.9 was to stop scoring local dimming as a feature and instead test and score the aspects of a TV's picture quality that were affected by the local dimming feature. Unfortunately, our fixes for the issues with contrast and local dimming went a bit too far. Look at the list at the right: you can see our top-scoring TVs for the Movie score on the 1.9 test bench and the previous score for each TV. The score for TVs with full array local dimming features didn't change much for the most part; they went up by 0.1-0.3, and a few even stayed the same. TVs without local dimming, though, increased drastically and are now some of our highest-scoring TVs with LED backlights. While TVs like the Samsung Q70/Q70A QLED are good TVs for watching movies in a dark room, they shouldn't be scoring that high on the list. Looking at the previous example of the Sony X85K and the Sony X90K, the X85K now scores an 8.7 for movies, whereas the X90K actually decreased and now scores an 8.0. The ranking of TVs flipped, and after 1.9, it seems like the X85K is significantly better than the X90K for watching movies in a dark room.
So why did these changes have such a drastic impact on the Movie scores? Instead of penalizing TVs with no local dimming, our scoring did the opposite—it gave an unfair advantage to TVs with VA panels and no local dimming. Such TVs score an automatic perfect 10 for things like blooming and zone transitions—since those tests are meant to showcase issues caused by local dimming, and TVs without local dimming don't have those problems. This means that TVs with local dimming automatically score worse than similar TVs with no local dimming. Since no local dimming implementation is perfect, there will always be some blooming and some issues with zone transitions, so they'll always score worse. The only opportunity TVs have to increase their score with local dimming is contrast.
Finally, we've also added a few new tests in recent months, from our latest changes to upscaling listed below to low-quality content smoothing and HDR gradient testing, and these new and updated tests weren't fully integrated into our usage scores. Although the primary focus of these changes is fixing the issues with our contrast scoring, we also wanted to ensure these tests were properly included in the relevant usage scores.
The solution
The main fix for this was pretty simple. We compared the list of our top-scoring TVs with the 1.8 scoring with the current list. By shifting the usage weights from blooming and zone transitions back to contrast, TVs without local dimming aren't scoring as high. We also had to adjust the scoring curves for the contrast score itself. Before our switch to a real scene for contrast, only a few TVs measured above 10,000:1 contrast. Now, we have many TVs scoring above that, and some are even scoring above 100,000:1. However, our previous scoring curves weren't designed for contrast measurements that high, so all high-end TVs were scoring a perfect 10!
These changes resulted in a slight increase in the overall score for most TVs compared to our previous test bench, but the order makes more sense. VA TVs with high contrast ratios are no longer outscoring similar TVs with local dimming; rather, the HDR Movie usage score more accurately shows the overall dark room experience, taking everything from the contrast to blooming and black uniformity into account. Our highest-rated TVs for HDR Movies now make more sense, with OLEDs generally filling the top of the list and LED TVs with Mini LED backlights and extremely high contrast, like the Sony X95K and the Samsung QN95B QLED next. TVs with IPS panels and no local dimming, like the Insignia F30 Series 2022 and the Sony X75K, are back at the bottom of the list for HDR Movies, where they belong.
Since these are just scoring curve changes and weight changes, the good news is that it's easy to correct. We also decided to remove the Movie usage score and focus our efforts on the HDR Movie usage instead. These two usages are extremely similar, and most TV these days are designed for watching movies in HDR. The new usage score also already gives you a good idea of how well most TVs should perform for SDR since many of the criteria for HDR and SDR are the same (contrast, blooming, etc.), so it didn't make much sense to have two separate usage scores.
So what do you think? Does our new scoring make sense and match your expectations? Look at our table tool for the latest scores, and let us know in the discussions if you have any suggestions or if anything doesn't match your experience or expectations.
Issues with our test
As we were updating our usage scores, we noticed that some of our TVs were scoring too high on the blooming test. It was especially noticeable on TVs with IPS panels and a local dimming feature, like the LG QNED90. Our blooming test was too sensitive to other factors, including the contrast ratio and viewing angle. On VA TVs, blooming is more noticeable as you move off-center due to the viewing angle. IPS TVs don't have this issue, at least not at a moderate angle, so blooming is less noticeable as you move off-center. This doesn't represent what we want to test, though. The goal of this test is to evaluate how well a local dimming feature can display bright highlights without brightening up the dark areas of the screen around it, this isn't a viewing angle test.
Improving our test - what we tried and what issues we encountered
Thankfully, the solution to this is pretty simple, and again, it's all about the viewing angle. When we initially built this test, we first tried taking the blooming photo directly in front—this simply didn't work. Most photos looked the same, and even TVs with poor local dimming features show very little blooming from directly in front. So, we settled on taking the photo at an angle. To fix the current scoring issues, we decided to add a vertical element to our camera shot. It turns out that some TVs that look good at a decent horizontal angle, like the LG QNED90, look terrible if you're even slightly above the center of the screen.
The final solution - Showing users the worst-case scenario
In the end, we decided that the best solution for our users is to show you how bad a TV can get, within certain limits. This levels out the playing field for all TVs, ensuring that even if the blooming itself doesn't necessarily show what your experience will be, the comparisons between TVs will be accurate. To achieve this, when taking the blooming photo, the camera will now be angled between +40° to +50° horizontally and +4° to +6° vertically. We've changed our approach to the scoring a bit. When subjectively scoring a TV, we look at how harsh the blooming is, not just how wide it spreads out. Extremely bright highlights that cut off suddenly in dark scenes can be more distracting than a brightness gradient.
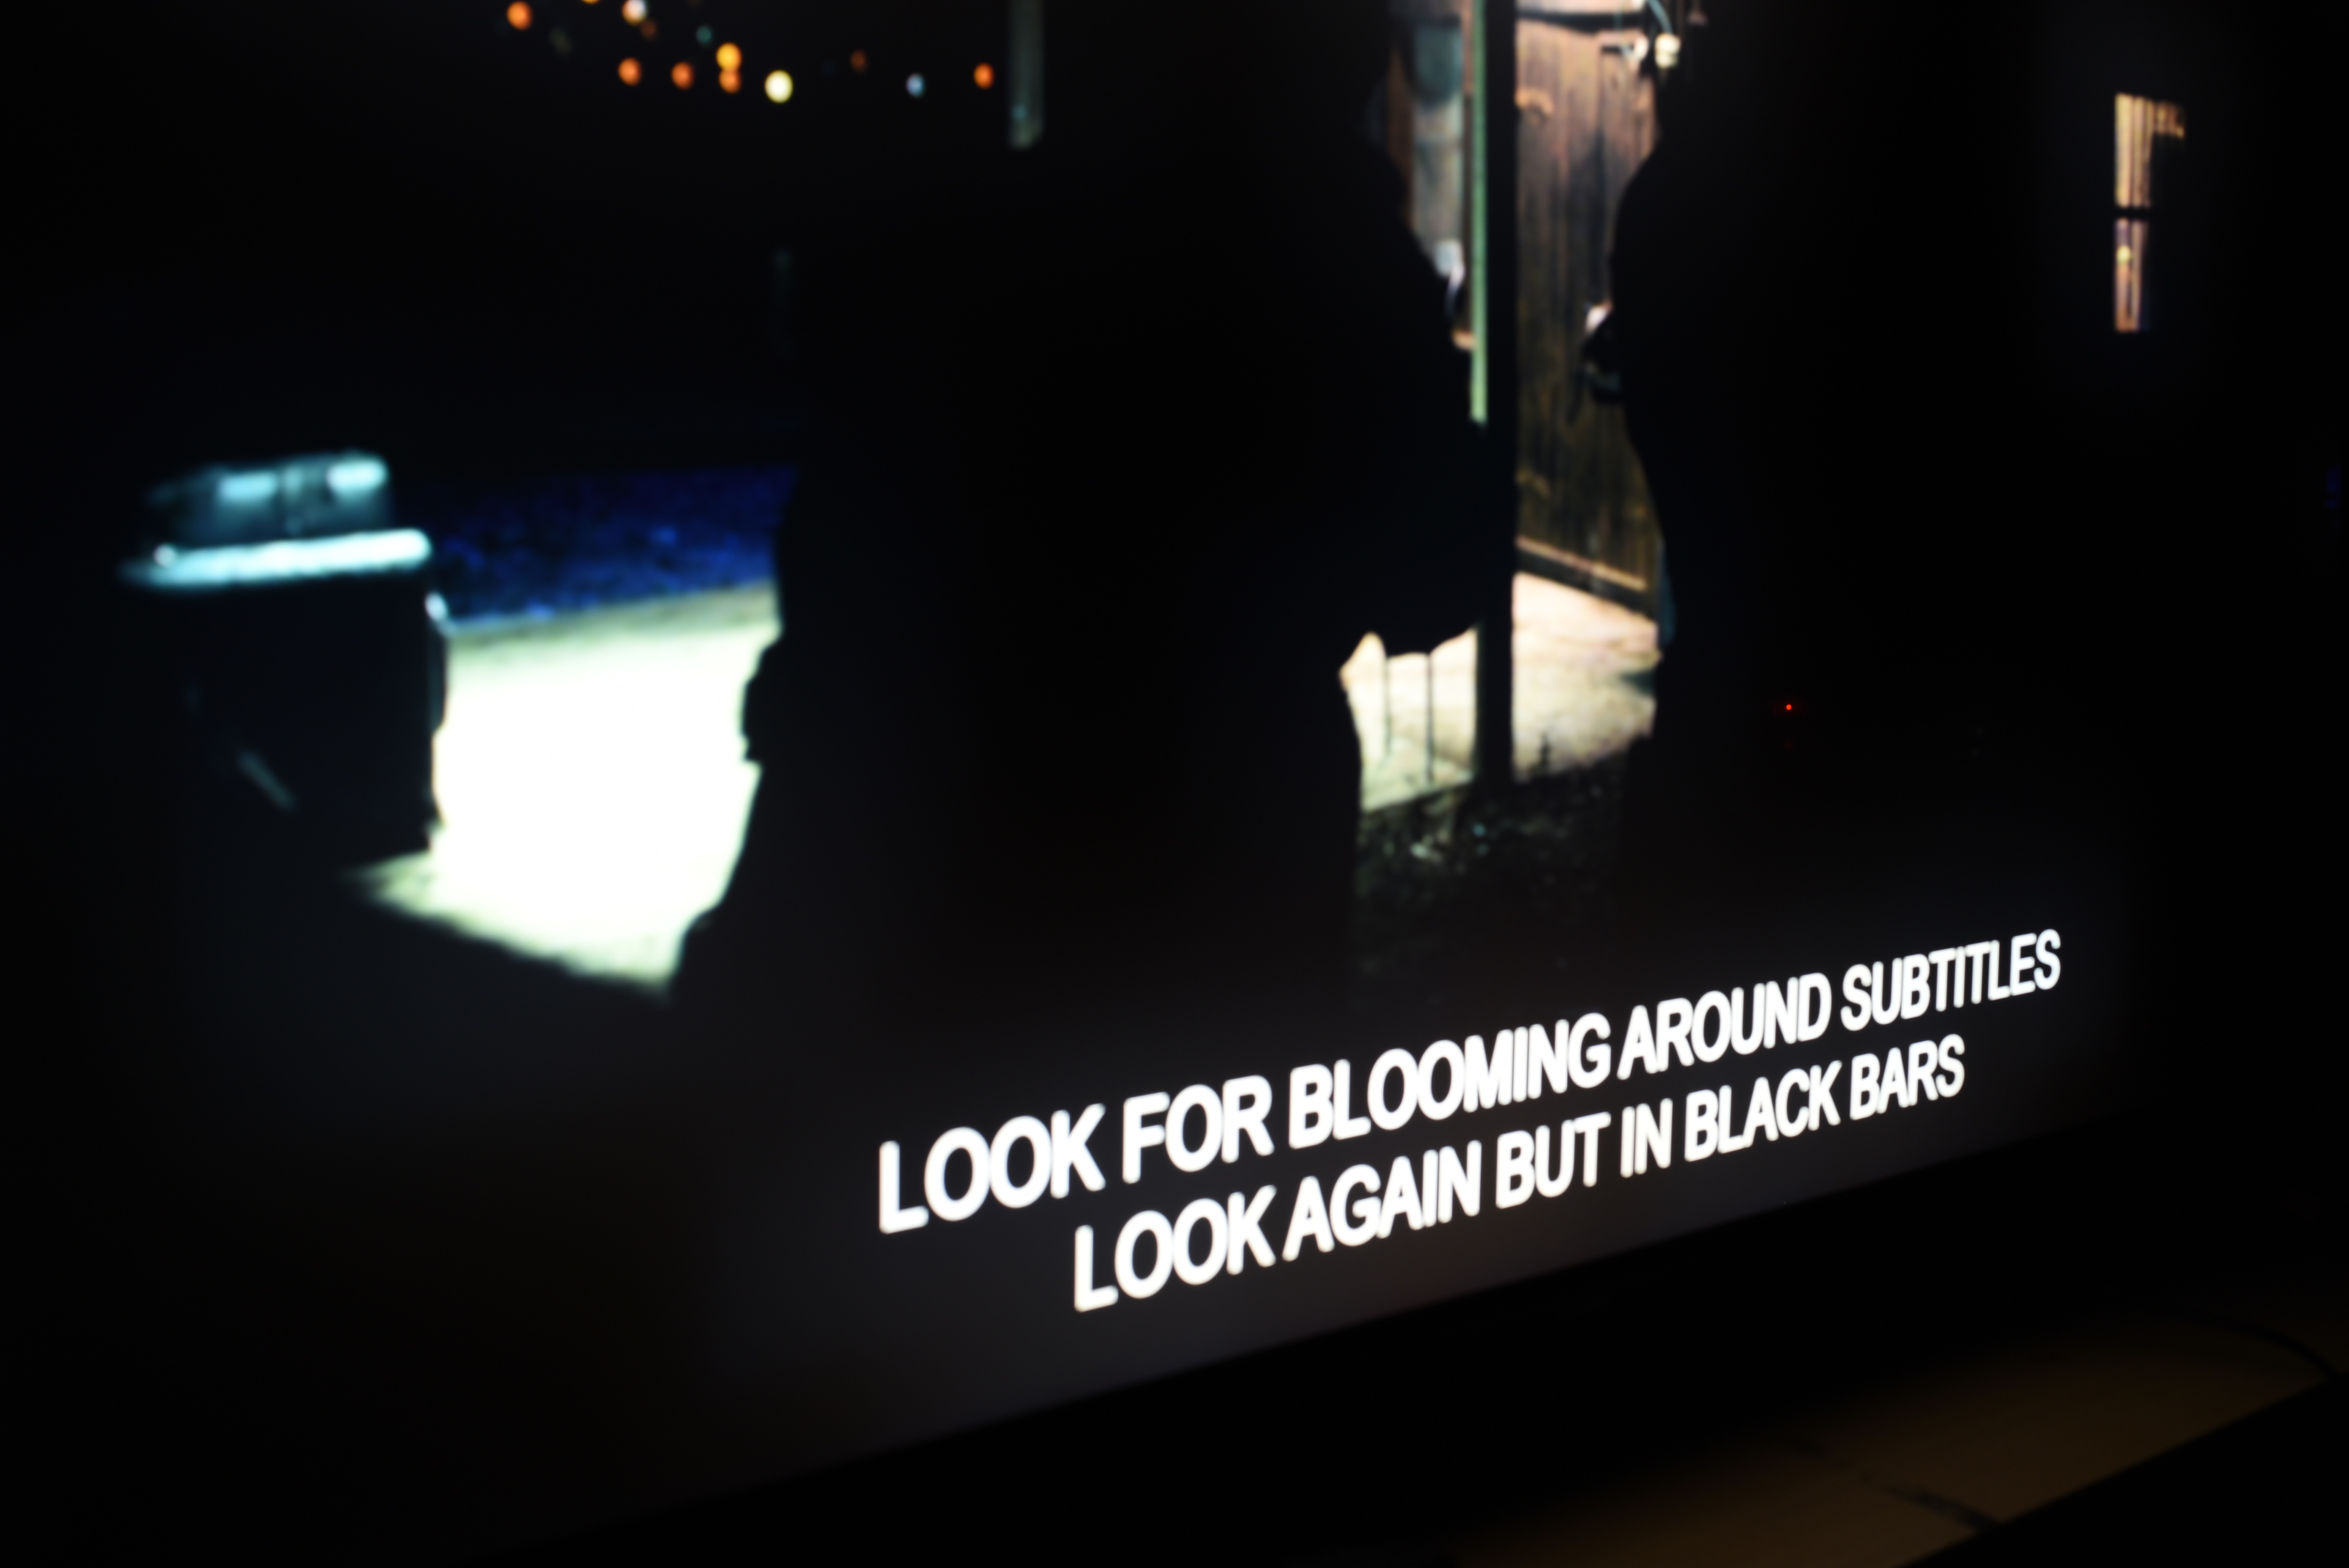
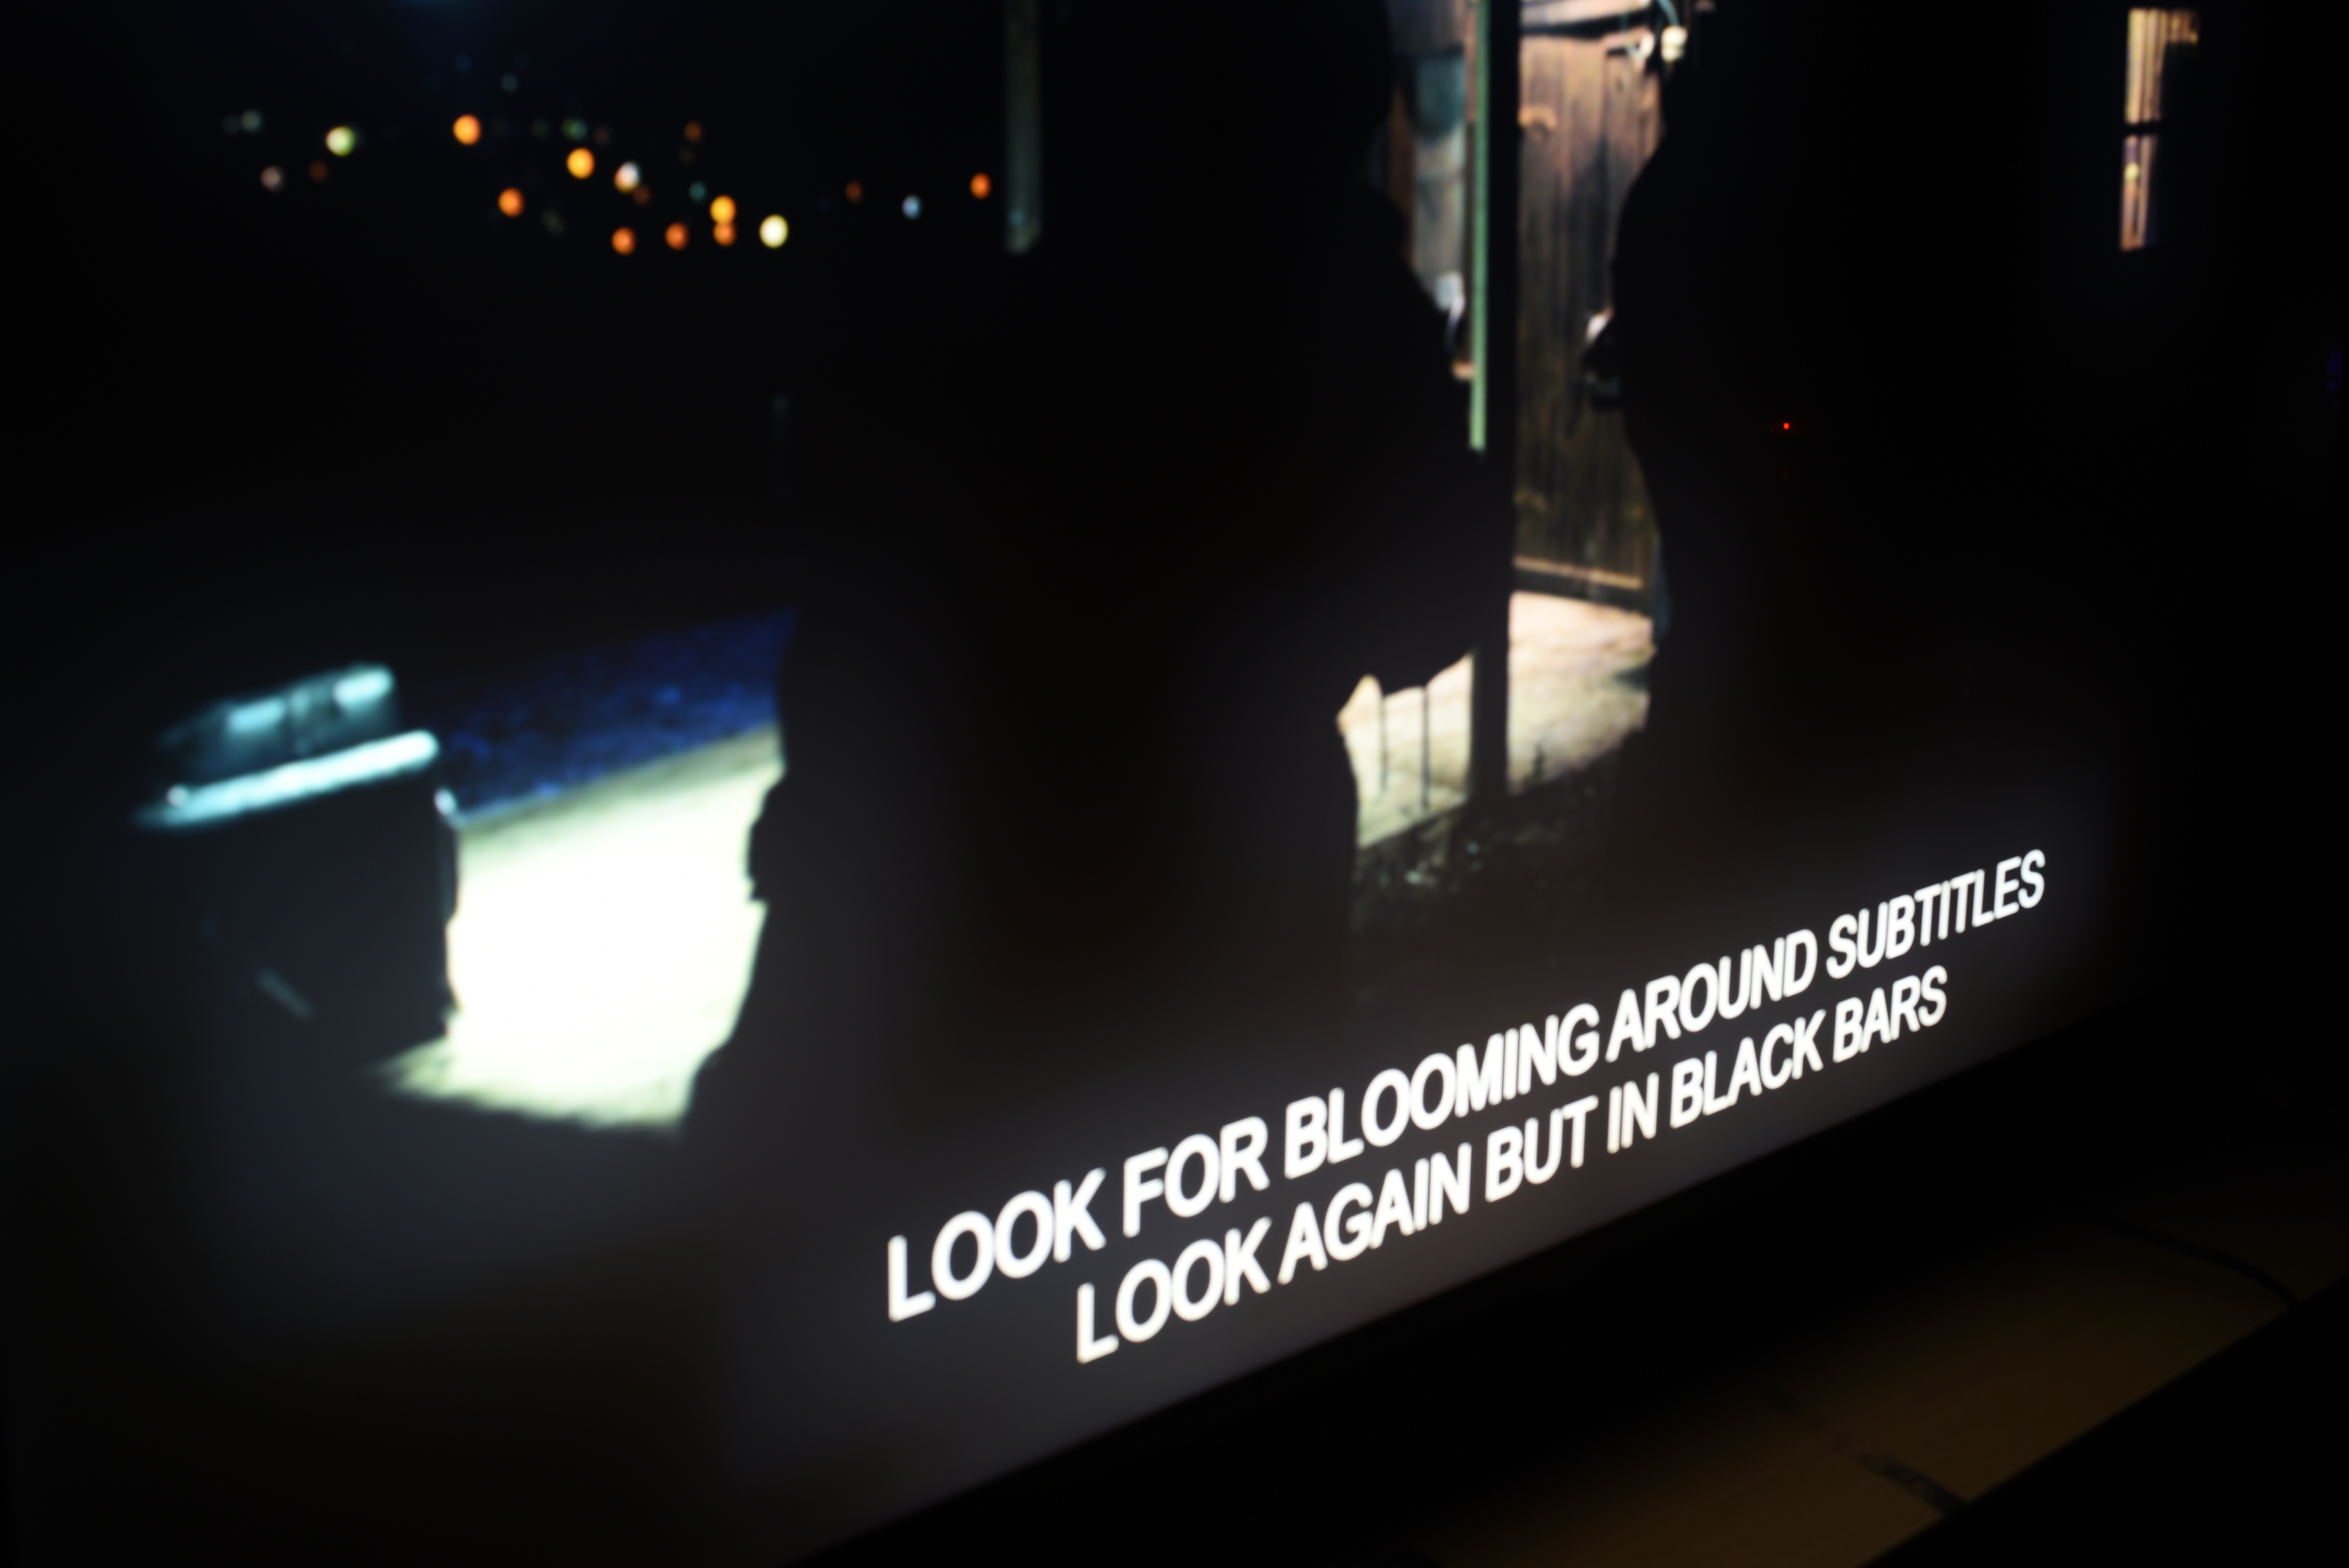
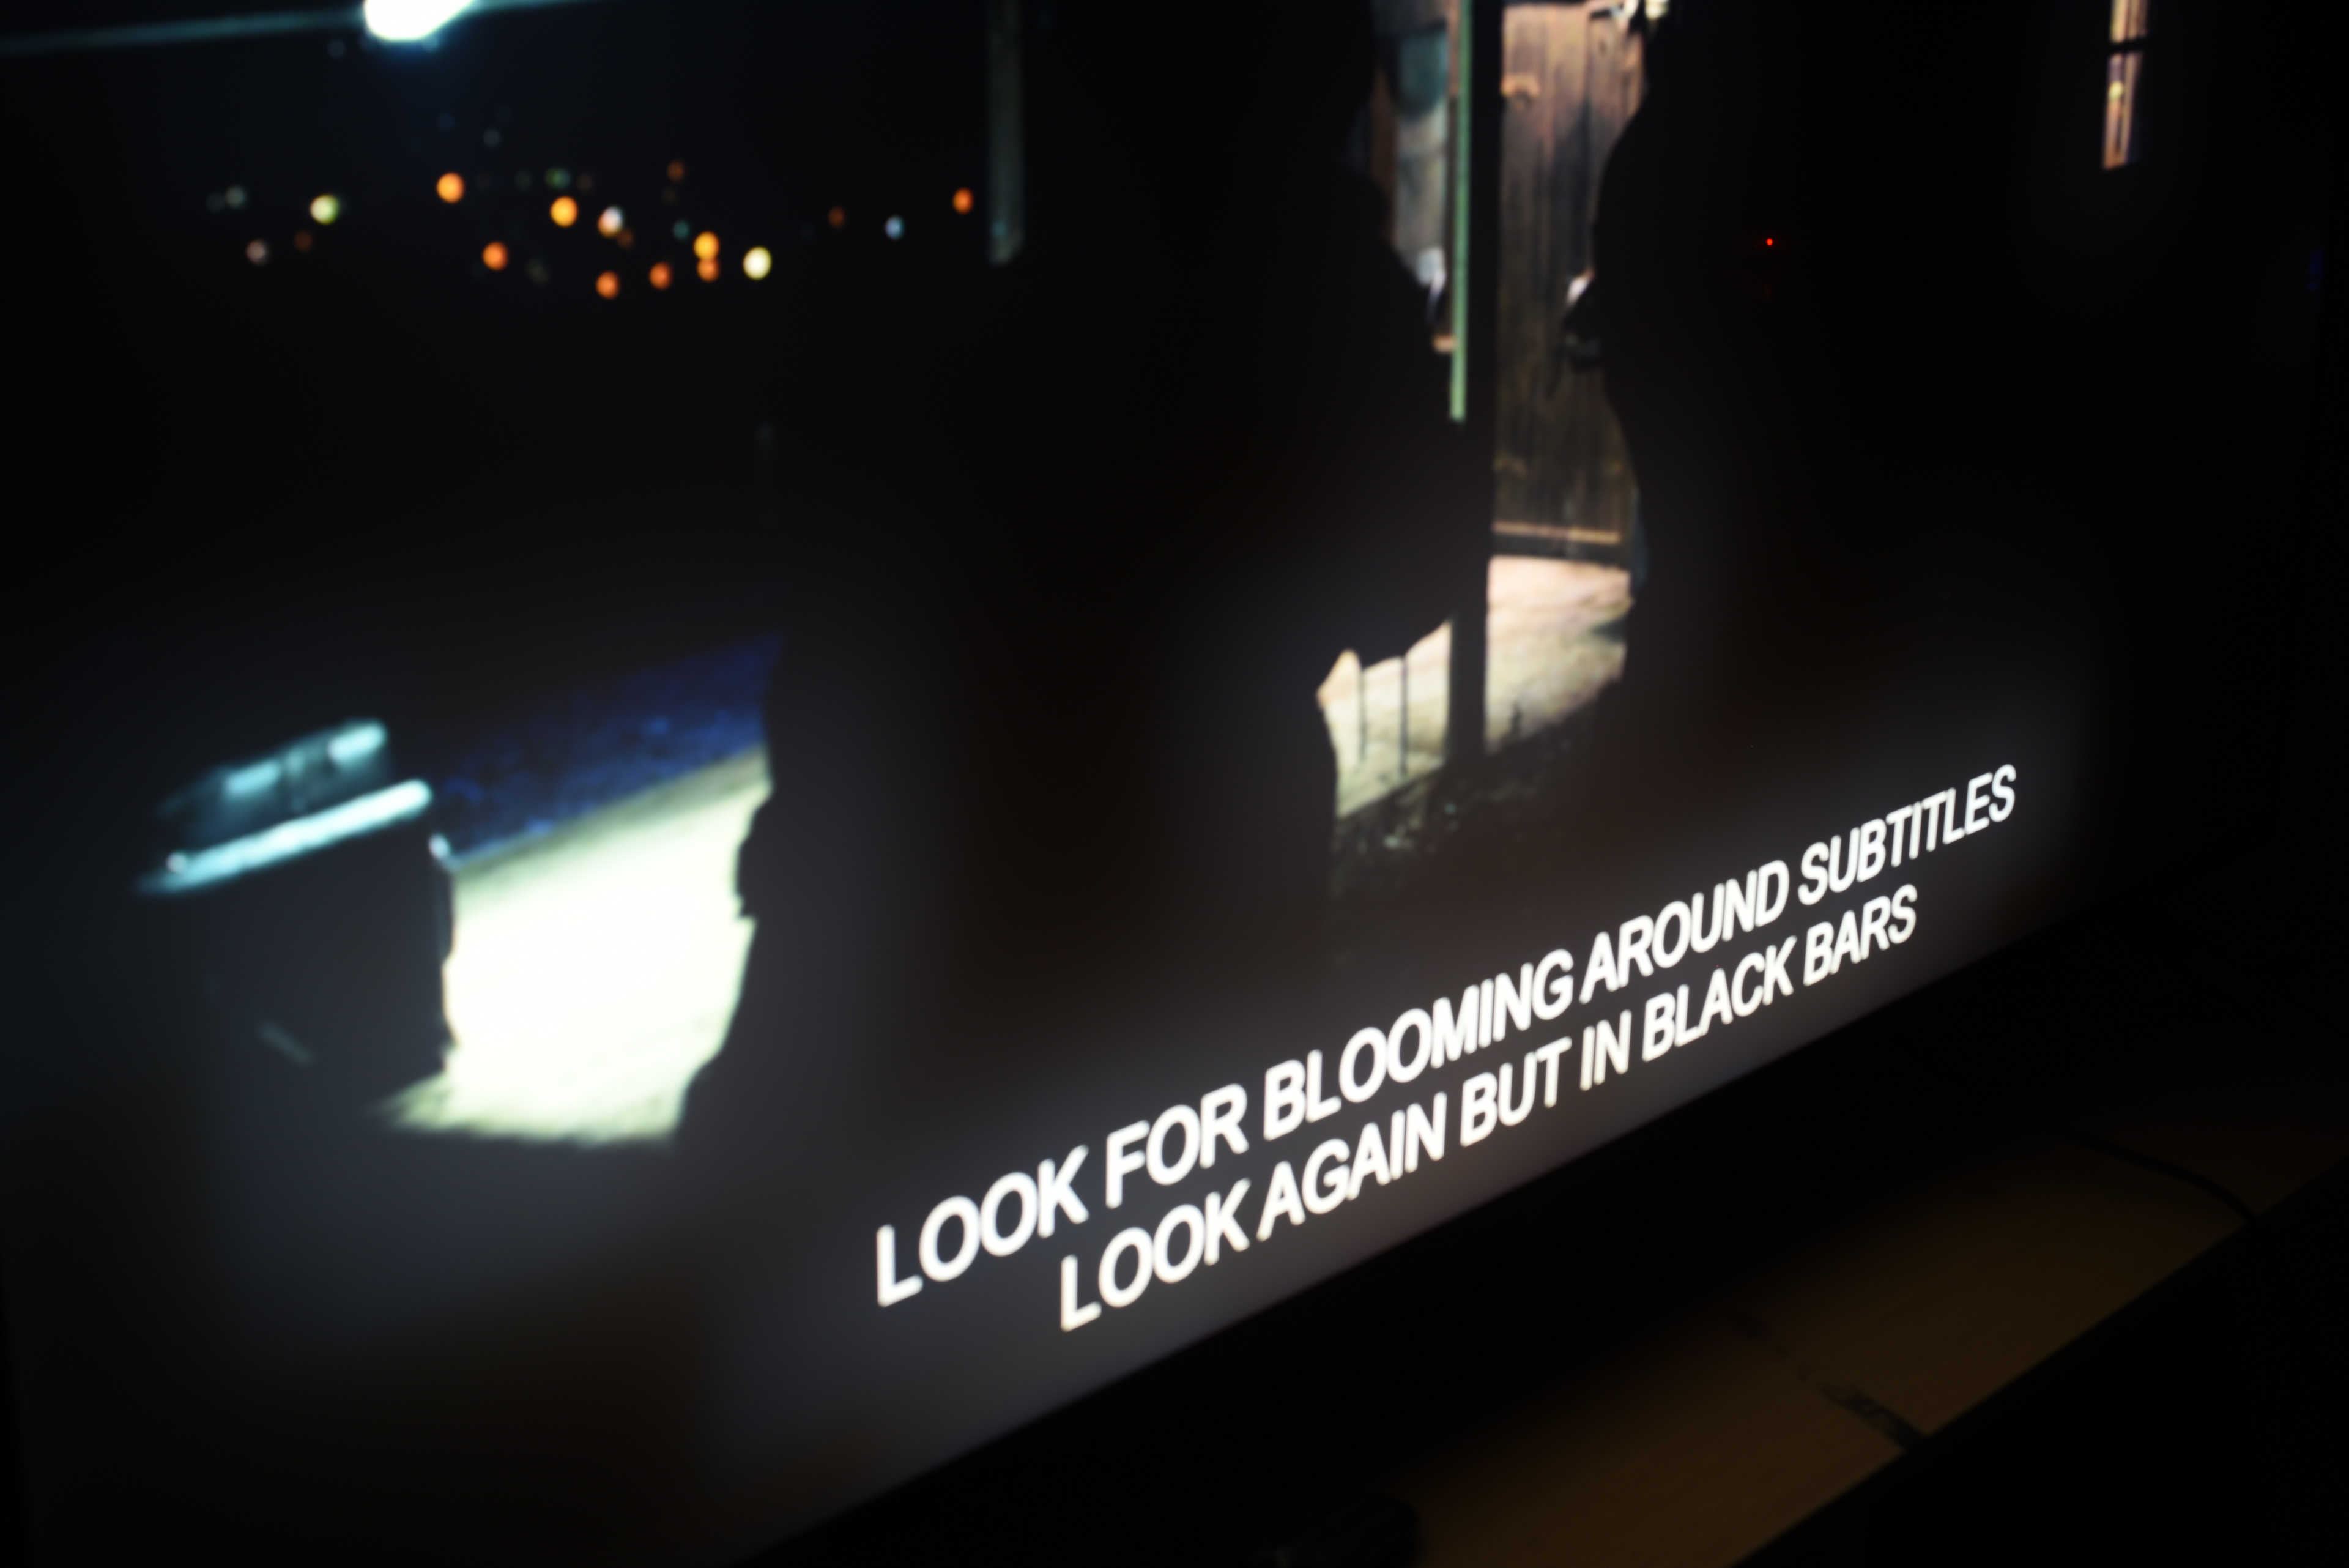
Take, for example, the LG QNED90 above. The photos above show the same section of our blooming test image, focused on the subtitles, taken at three different angles. The first photo is close to the photo used for the Test Bench 1.9 test. There's very little noticeable blooming around subtitles, and this photo resulted in an overall blooming score of 7.0. Anyone who had seen the TV in person knew that that photo didn't represent how it looked in real life. The third photo, taken at a higher angle, shows the blooming much clearer, and it's even noticeable around the white lights reflecting off the garage floor. This much more closely resembles how the TV looks in person, and the final score of 6.5 is closer to the real-world experience of this TV. While a change from a 7.0 score to a 6.5 might not seem like much, the impact on the scores of other TVs was far more significant, and the order of our blooming scores makes much more sense.
Issues with our test
Initially added as part of our 1.9 Test Bench Update, we've heard from many of you that our black crush test isn't giving you the information needed to make a proper buying decision. Our goal with this test was to look for a side effect of local dimming. Due to the technical limitations of LED backlights, almost all LED TVs struggle with shadow details. They either crush blacks in shadows to maintain the tone of the scene, or they raise blacks to maintain those fine details, but by doing so, shadows aren't as dark as they should be. The goal of our test was to look for the former, specifically, to see if TVs could display small highlights in shadow details without dimming the shadow details to prevent blooming. Our test only penalized TVs that crushed those details out, it didn't look for the inverse issue of raised blacks, as some TVs raise the brightness in dim scenes to reduce blooming, but instead of preserving shadow details, this just removes the shadows.
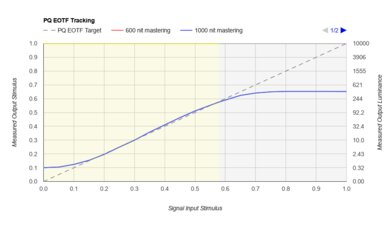 Sony X75K showing raised blacks in the PQ EOTF Tracking graph.
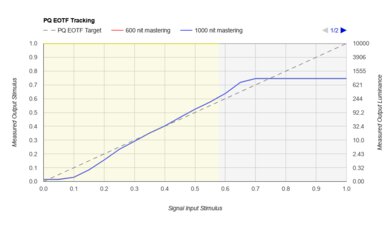 Vizio P Series Quantum 2021 showing crushed blacks in the PQ EOTF Tracking graph.
One way we can measure this is to use the PQ EOTF, which shows how the TV translates the brightness of the scene that the content creator intended to the actual brightness on the screen (learn more about PQ EOTF Tracking). Looking at the above examples, you can see that in the 0-0.1 Stimulus range, which shows the measured brightness in very dark scenes, the Sony X75K raises blacks considerably, while the Vizio P Series Quantum 2021 does the opposite. It clearly shows the different approaches manufacturers have taken to shadow details. The Sony TV lacks a local dimming feature, so when displaying near-black details, it raises the overall black level, preserving fine details in the process but increasing the brightness of the entire scene, so shadow scenes are much brighter than they should be. The Vizio, on the other hand, preserves the darkness of the scene but loses the fine shadow details in the process. Which one is better is largely subjective, there's no perfect solution, and this is simply a limitation of LED backlight technology.
 Sony X75K showing raised blacks in the black crush image
 Vizio P Series Quantum 2021 showing crushed blacks in the black crush image
Even though the PQ EOTF tracking is done in HDR, you can see above that the Sony X75K and the Vizio P Series Quantum 2021 behave the same in SDR, and the Vizio is noticeably darker in shadow details. Since our PQ EOTF Tracking test already shows this behavior, the image doesn't add anything new to our review, and it doesn't add any additional information that'll help you with your buying decisions.
The final solution
Unfortunately, in the end, we felt it was necessary to completely remove the black crush test. After the other changes we've made to our contrast scoring mentioned above, the 'HDR Movie' score was in a good enough state that we didn't need this test anymore. The mismatch between our test results and the community's expectations for that test also meant that our test wasn't helping people with their buying decisions. We recognize that not everyone will agree with this change, so please let us know in the discussions if you think we should keep this test or if you have any other feedback about these changes.
Issues with our test
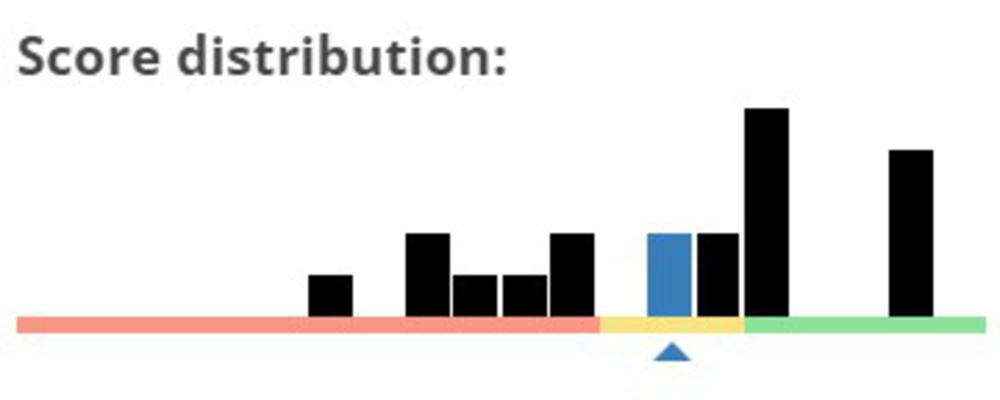
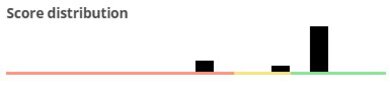 The score distribution of our 480p upscaling test
Over the years, we've heard from many of you that our upscaling testing wasn't cutting it. Our existing tests, which we've been using for a few years, were too simple for modern TVs, so almost all TVs were scoring the same thing. Budget TVs with very limited processing are scoring the same as high-end TVs with advanced AI-powered upscaling and much better picture quality overall. It doesn't represent the market, as some TVs are better than others at upscaling lower-resolution content, and it simply wasn't very helpful when trying to make a buying decision.
Overall, it's clear that our current combination of 480p, 720p, and 1080p upscaling boxes simply aren't very helpful. Our scores weren't testing image processing, they only looked at if a TV could scale an image properly, not if it could scale the image properly and look good. So if you're a user looking for a TV to watch cable or a DVD collection, which TV delivers the best experience? Our existing results can't help you at all.
Improving our test - what do users care about?
Before improving the test, we first needed to better understand what aspect of a TV's upscaling performance users care about. The first part is to answer a simple question, "What is upscaling?". Modern TVs upscale content in two steps: first, the TV scales the image to the panel's native resolution. Next, the TV's processing applies some image processing to clean up the image. The level of processing varies significantly between brands and individual models and even sometimes between different picture modes on the same TV. All TVs have some automatic image processing that the end user can't control, but most TVs also offer a few settings you can adjust.
The first question we needed to answer was which formats users care about. Most streaming services are at least 1080p, and if you're in North America, most over-the-air (OTA) broadcasts are at least 720p. Do users care about the upscaling quality going from 1080p to 4k? What about 720p? Another question that users frequently ask us is what kind of scaling algorithms are used? Certain scaling functions are better for certain uses, so users sometimes care about that. For example, integer scaling, also known as nearest neighbor, is often preferred for PC users, as it results in a more accurate image with fewer scaling or processing artifacts.
Improving our test - what we tried and what issues we encountered
Before we can evaluate upscaling performance, we first need to find an ideal test clip and decide if we want to use a test pattern or real content. The first thing we tried was a test pattern on a Spears and Munsil DVD. Using this DVD, upscaling and processing errors were noticeable and differed from one TV to another. Interestingly, some processing modes like Sony's Noise Reduction feature caused more upscaling artifacts, as it broke straight lines, but they also appeared to "learn" over time, as the issue disappeared over time. The most significant differences from one brand to another appeared in chroma changes, where Sony stood out for better maintaining the separation of colors and contrast, while TCL was one of the worst. Our findings here line up well with the larger community's impressions of each brand.
The problem with this approach is that each test clip is a few minutes long. Since we're scoring these subjectively, and each TV is tested independently, this approach makes it difficult to arrive at a consistent evaluation. These reels are all a mix of different content, so it's hard to define the best settings for each TV since the best ones are heavily dependent on the content—some settings might look better with some content over others.
What about scaling? Some brands and models handle the scaling step of the process differently, and some TVs even use different scaling methods depending on the picture mode. For example, the Sony X900E uses integer scaling, also known as "Nearest Neighbor", but only in the 'Graphics' picture mode. This type of upscaling results in a more accurate upscaled image, as the TV doesn't add any extra processing that would otherwise soften the image.
We tried it on a few different models, but it turns out that it's incredibly hard to accurately determine the scaling algorithms used. Integer scaling is the easiest to detect, but in the last few years, very few brands still offer that. There are many different other scaling methods used by manufacturers, including many AI-based ones, and since we usually can't fully disable the upscaling processing on a TV, it's nearly impossible to determine the scaling algorithms used. Because of this, we've decided against adding a test to determine the scaler used at this time. Let us know in the discussions if you think this is important or if you have any ideas for how we could test this.
The final solution
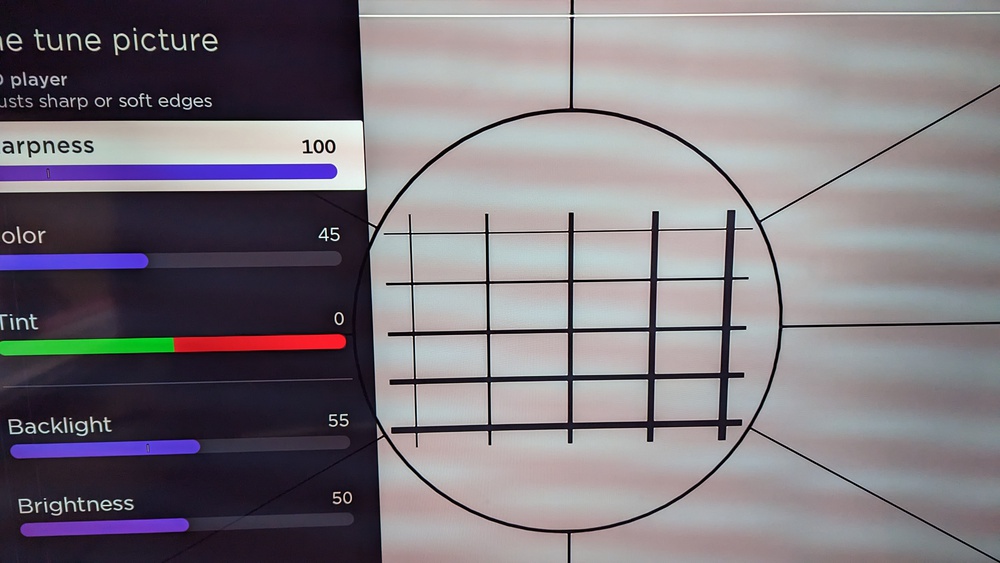 The sharpness test pattern used to determine the optimal sharpness setting on each TV.
After trying multiple test scenes and patterns, we finally found a solution that works consistently and matches the community's expectations. The new upscaling test now consists of a single 480p clip of a moving picture based on the original test image. Why 480p? Even if it doesn't represent the majority of content people watch today, using a low-resolution clip makes it easier to see the differences in upscaling performance between models.
Even though we're using a 480p signal, the results of this test are valid for any low-resolution or low-bitrate source, including cable TV channels. As the quality of the signal increases, the sharpness processing of the TV is less important, though, as the TV doesn't have to work as hard to produce a nice image. Even going up to 1080p can make a huge difference, as most modern TVs do very little processing on 1080p signals like Blu-rays, so issues that are exposed with a 480p signal aren't as obvious.
We've added framing references to the clip to ensure that our photos are always cropped to the same spot, so the final upscaling image in the review is easier to compare between TVs.
We start by using the Spears and Munsil HD Benchmark 2nd Edition Bonus DVD to find the optimal sharpness setting for each TV. This test pattern makes it easy to find the perfect sharpness pattern for each TV. Our goal is to find the highest sharpness setting that doesn't introduce any artifacts or errors in the image, ensuring that straight lines remain straight and text is easy to read.
 Full resolution 4k reference image.
 Downscaled image to show the difference in sharpness.
The score is subjectively assigned based on the sharpness of the image and the quality of the upscaling. Above, you can see two example reference images. The one on the left is close to a perfect ten. The one on the right is noticeably softer and corresponds to a 5 or a 6 on our scoring scale. There are a few different points of comparison that make it easy to see the differences in a TV's upscaling. The roof shingles should be clearly visible on a TV with good upscaling. In the image on the right, the shingles appear to be an almost uniform color, with just a slight haze around them; it doesn't look like they're shingles at all. Next, there's some text throughout the scene, including the names of the boats. Again, on a TV with good upscaling, the names should be easy to read. Finally, there's an overlay that closely mimics how well a TV can upscale hardcoded subtitles. Since each line is progressively smaller, it's easy to see where a TV starts to struggle so we can objectively score their performance. Most TVs begin to struggle at around the third line, where the "T" starts to be difficult to read and the "I" and "N" combine.
 Cropped reference image.
 Sony X90K - Fantastic 480p upscaling.
 TCL 6 Series/R646 2021 QLED - Bad 480p upscaling.
Above, you can see three examples: a cropped version of the reference image above, a TV with good upscaling, and a TV with bad upscaling. Comparing the two real-world examples, you can clearly see the differences in upscaling, especially when looking at the sharpness of the image. Fine details on the TCL are hard to see, and text, especially the RTINGS text in the bottom-right of the image, isn't well defined, and edges appear soft.
First 20 TVs
After retesting the first 20 TVs with our new methodology, there's a much better spread of scores across the entire score range. High-end Sony TVs with advanced processing features, like the Sony X95K and the Sony A95K OLED, achieved the highest scores on our test; this matches the community's general expectations. Sony TVs are well-respected for their processing and upscaling capabilities, and our scores now show this.
At the lower end of the scale, again, most of the results aren't surprising. Budget TVs with limited processing capabilities are among the worst at upscaling 480p content. The Insignia F30 Series 2022, the TCL 6 Series/R646 2021 QLED, and the Vizio V Series 2022 all perform poorly at this test. There were also a few surprises in our results. Samsung TVs all performed well, with good upscaling in general, but surprisingly, we found little difference in upscaling performance between their high-end and low-end models. Even in person, when displaying the same 480p content, the Samsung Q60/Q60B QLED and the Samsung QN95B QLED look nearly identical, at least as far as upscaling and sharpness are concerned.
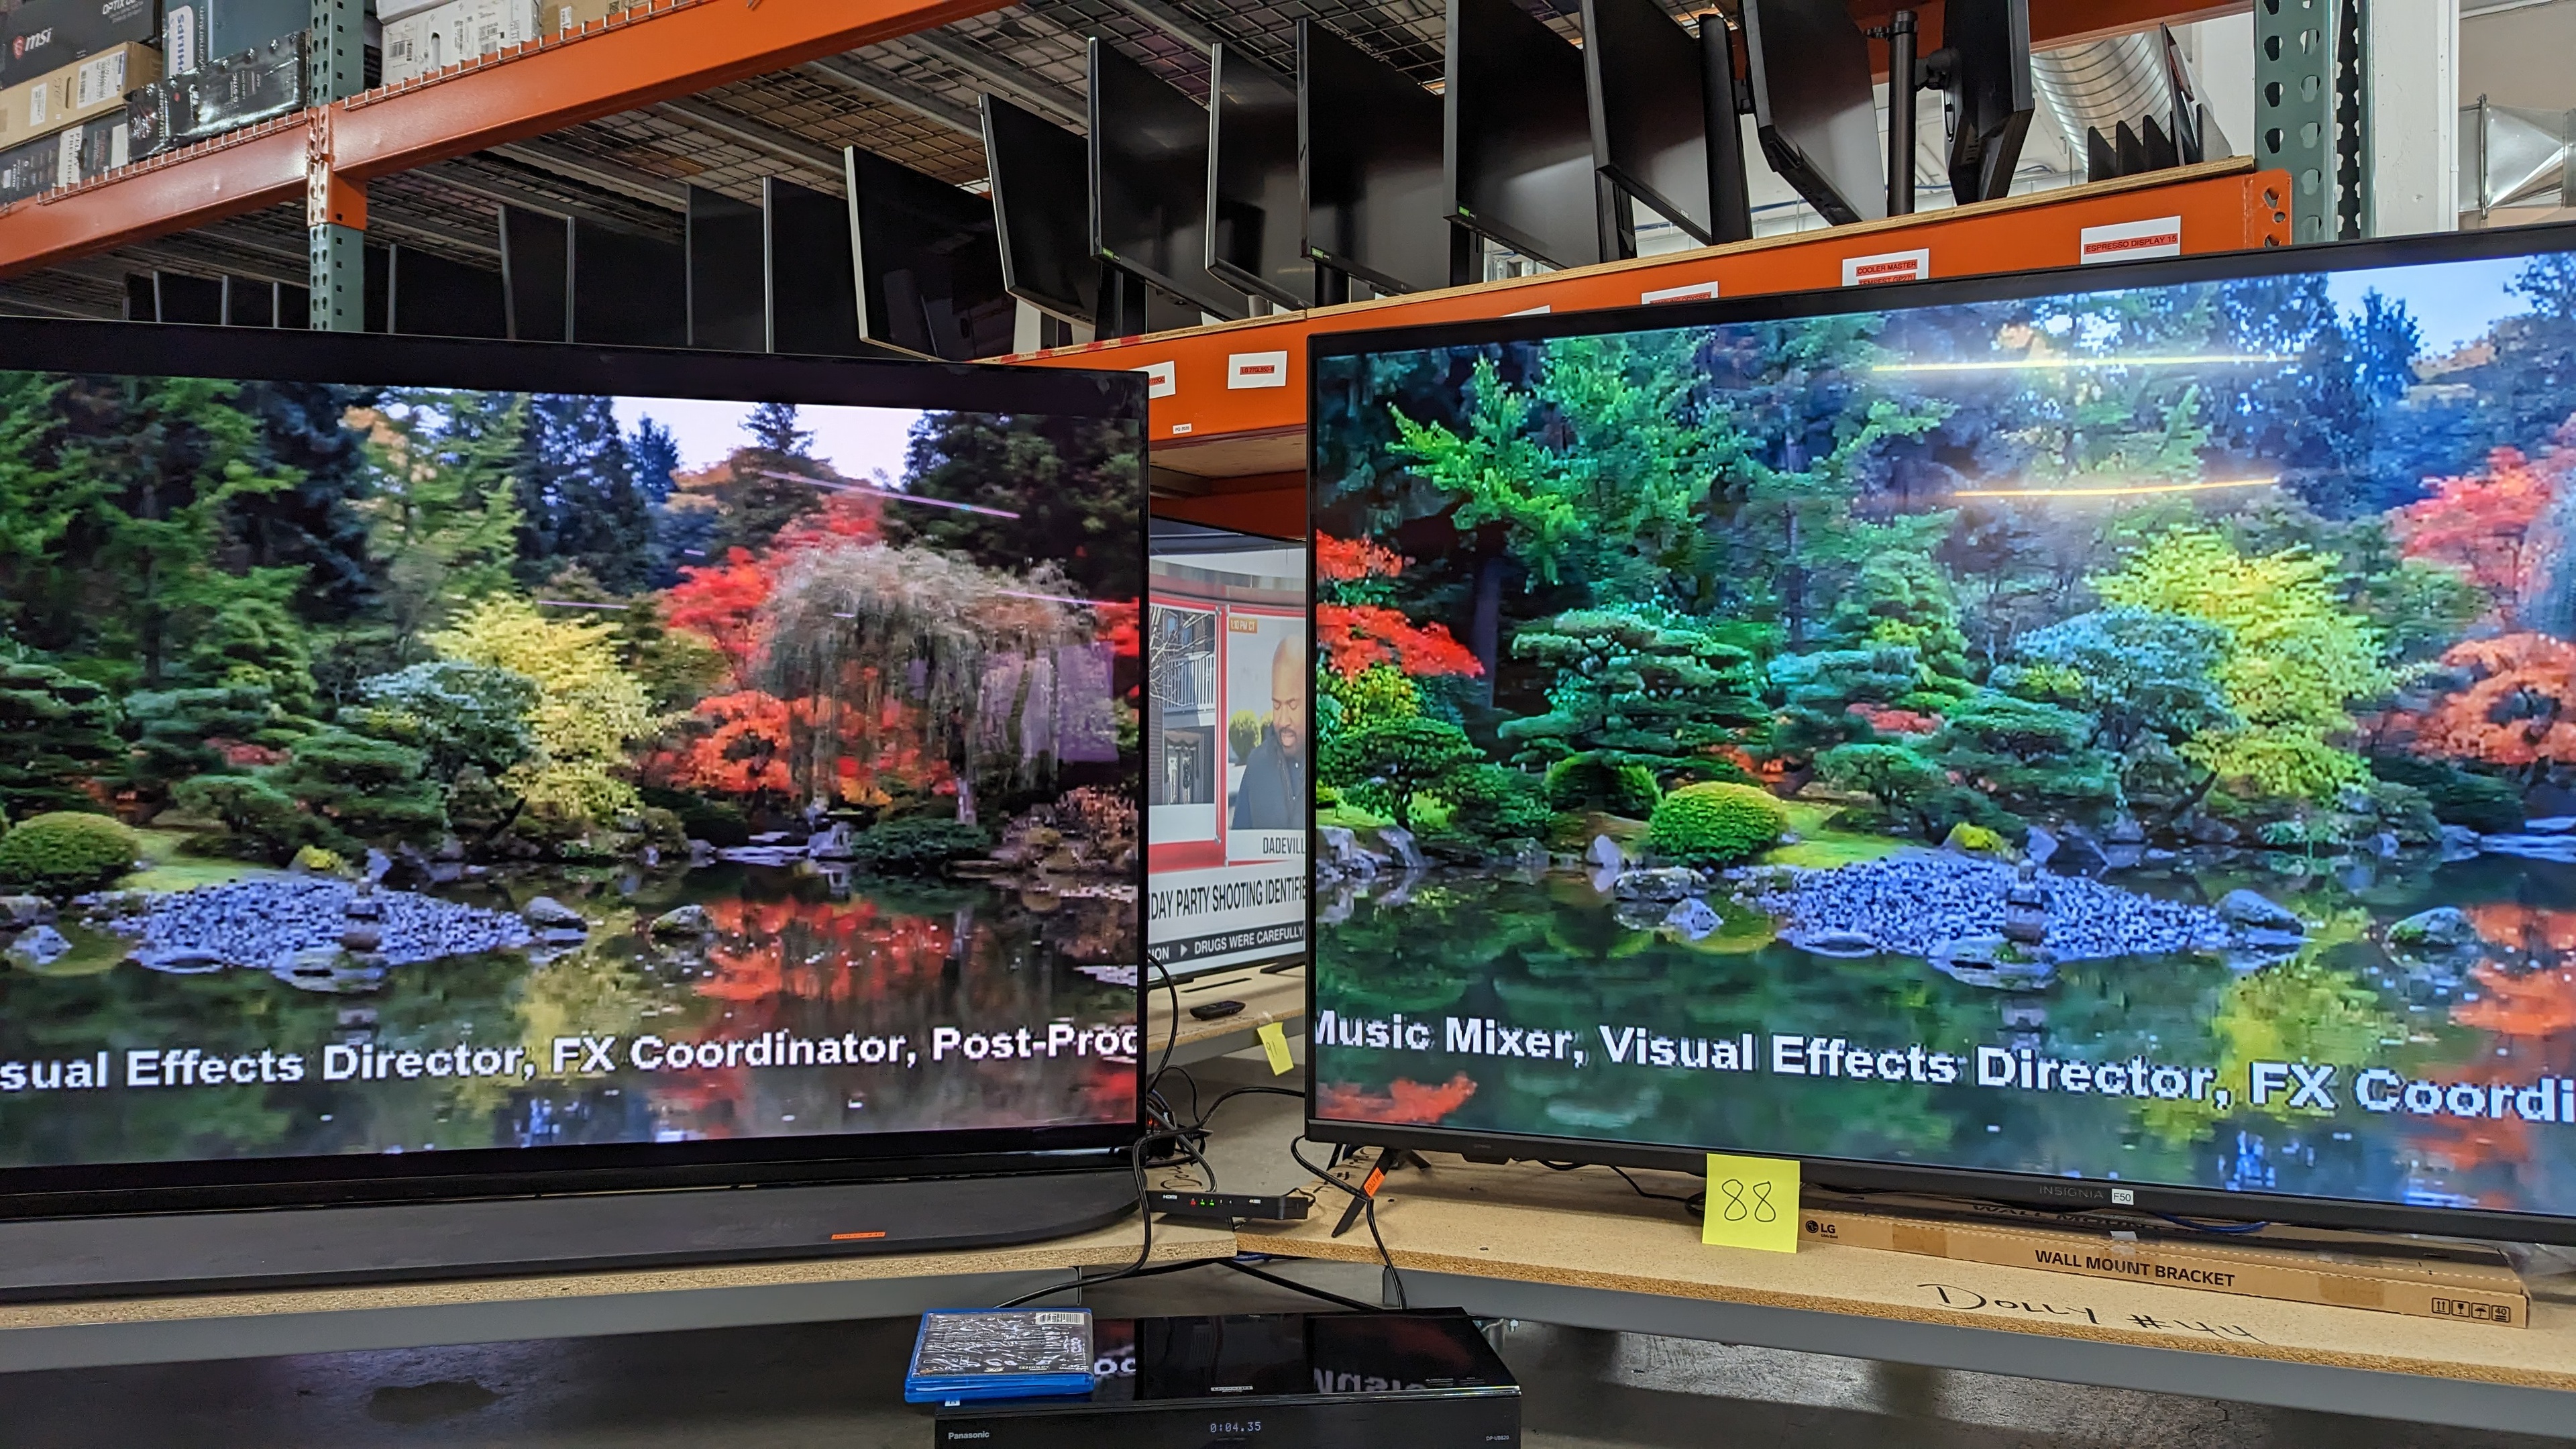
 Samsung QN95B QLED - 480p upscaling and sharpness test.
 Samsung Q60/Q60B QLED - 480p upscaling and sharpness test.
So, overall, what do you think? Do our new upscaling test and the results match your expectations and experience? Let us know in the discussions down below. We're always trying to improve our tests, so let us know if you have any suggestions or if there are other aspects of upscaling that you'd like us to test.
Supported resolutions - new tests
The goal of the upscaling test above is to answer the question, "Is this TV good at upscaling?", so to that end, we decided to remove the scaling aspect from that test. We've added 480p @ 59.94Hz and 720p @ 59.94Hz tests to the supported resolutions section of the review to answer the scaling question. The goal of this test is very different from the upscaling test. The test for upscaling focuses on the processing aspect of upscaling, taking advantage of the processing features offered by each TV to properly answer this question. The goal of that test is to look at what the processing can do to improve the picture quality of lower-resolution sources. In the supported resolutions test, our goal is to ensure that the TV can display lower-resolution signals from older sources properly, respecting the pixel aspect ratio of the original signal.
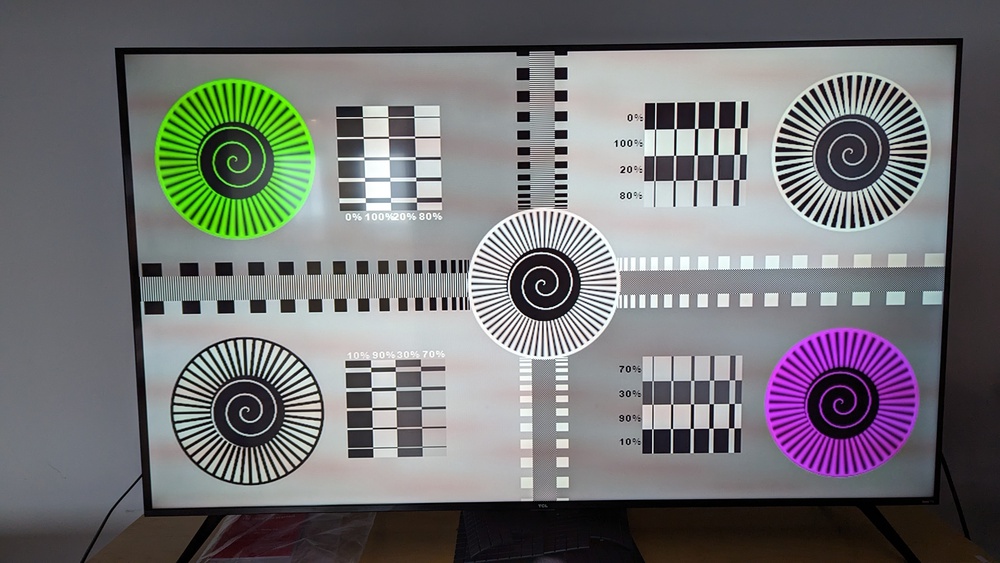
These are two very straightforward tests that required very little experimentation. The first goal is to test for anamorphic 720 x 480p widescreen signals. As mentioned above, anamorphic signals have a non-square pixel ratio and are usually sent by older DVD players that don't have an upscaling feature. To test for this, we use a DVD or Blu-ray player with the upscaling feature disabled and send a test pattern from the Spears & Munsil HD Benchmark 2nd Edition Bonus DVD. This pattern has a series of static circles; we measure the height and width of the circles. If they're the same, then we know that the TV is scaling the image properly.
For the second test, we send a 1280x720p signal from a PC and make sure that it's displayed properly. This resolution is slightly more common, as many modern cable TV channels, especially sports channels, broadcast at this resolution. This time, it's not an anamorphic pixel aspect ratio, so we don't need to worry about the height and width scaling properly. Instead, this is a simple pass/fail like our other supported resolution tests. Although these tests are still important for some users, we don't expect many TVs to fail this test, and in our initial batch of 20 TVs tested, none of them failed either test.
72 TVs Updated
We have retested popular models. The test results for the following models have been converted to the new testing methodology. However, the text might be inconsistent with the new results.
- Amazon Fire TV 4-Series
- Amazon Fire TV Omni QLED Series 2022
- Amazon Fire TV Omni Series
- Hisense A6H
- Hisense U6G
- Hisense U6GR
- Hisense U6H
- Hisense U7G
- Hisense U7H
- Hisense U8G
- Hisense U8H
- Insignia F30 Series 2022
- Insignia F50 QLED
- LG A1 OLED
- LG A2 OLED
- LG B2 OLED
- LG C1 OLED
- LG C2 OLED
- LG C3 OLED
- LG G2 OLED
- LG G3 OLED
- LG NANO75 2022
- LG NANO85 2021
- LG NANO90 2021
- LG OLED Flex
- LG QNED80 2022
- LG QNED85
- LG QNED90
- LG UP7000
- LG UQ8000
- LG UQ9000
- Samsung AU8000
- Samsung CU7000/CU7000D
- Samsung CU8000
- Samsung Q60B
- Samsung Q60C
- Samsung Q70A
- Samsung Q80B
- Samsung QN85A
- Samsung QN85B
- Samsung QN900B 8K
- Samsung QN90A
- Samsung QN90B
- Samsung QN90C
- Samsung QN95B
- Samsung S95B OLED
- Samsung S95C OLED
- Samsung The Frame 2022
- Samsung The Terrace
- Samsung TU7000
- Sony A80J OLED
- Sony A90J OLED
- Sony A90K OLED
- Sony A95K OLED
- Sony X75K
- Sony X80K/X80CK
- Sony X85K
- Sony X90J
- Sony X90K/X90CK
- Sony X95K
- TCL 4 Series/S455 2022
- TCL 6 Series/R646 2021 QLED
- TCL 6 Series/R648 2021 8k QLED
- TCL 6 Series/R655 2022 QLED
- TCL S546
- TCL S555
- Vizio M Series Quantum X 2022
- Vizio M6 Series Quantum 2021
- Vizio M6 Series Quantum 2022
- Vizio M7 Series Quantum 2021
- Vizio P Series Quantum 2021
- Vizio V Series 2022