See the previous 0.8 changelog.
We've updated our speaker sound testing methodology to Test Bench 1.0. This update changes how we measure and score Frequency Response Accuracy, Raw Frequency Response, Directivity, and Loudness. Because these tests changed significantly, Sound scores from Test Bench 1.0 aren't directly comparable with results from previous test benches.
What's Changed?
This update affects the following Sound tests:
| Test Group | Changes |
|---|---|
| Frequency Response Accuracy | Updated measurements using sine sweeps, nearfield measurements, a 1 m microphone-array measurement, and a dedicated port measurement when applicable |
| Raw Frequency Response | Updated graph using the same new measurement method, while still showing the uncompensated response |
| Directivity | Renamed from Soundstage, measured with sine sweeps instead of pink noise, updated with a circular polar plot, and reweighted to focus more on off-axis consistency |
| Loudness | Renamed from Dynamics, measured at 1 m using CTA-2034 weighted noise, updated with a new DRC calculation, and reweighted to focus more on maximum volume |
| Usage Scores | Updated to reflect the renamed Sound tests: Soundstage is now Directivity, and Dynamics is now Loudness |
Why Are We Making This Change?
Speaker measurements are especially sensitive to the room they're taken in. Our previous Frequency Response Accuracy method used averaged in-room measurements, which could be affected by room modes and other room effects, especially in the bass range. Test Bench 1.0 uses a new measurement method that better estimates the speaker's own frequency response while reducing the influence of the room.
We've also renamed and adjusted some Sound tests to better reflect what they measure. Soundstage is now Directivity, since the test focuses on off-axis consistency rather than subjective soundstage impressions. Dynamics is now Loudness, since the test focuses on how loud the speaker gets and how much its sound changes at maximum volume.
Frequency Response Accuracy
Frequency Response Accuracy now uses an updated measurement method. Instead of using pink noise and averaging 1 m and 2 m in-room measurements, we now measure the speaker's response using a sine sweep. We take three sets of measurements: nearfield measurements at seven positions, a 1 m measurement with a 15-microphone array, and a dedicated port measurement when applicable. This better estimates the speaker's own frequency response while reducing the influence of room effects, especially room modes in the bass range.
The in-room target hasn't changed, but the way we measure the speaker against that target has. This means a speaker's Frequency Response Accuracy score may change even if its general sound profile is similar.
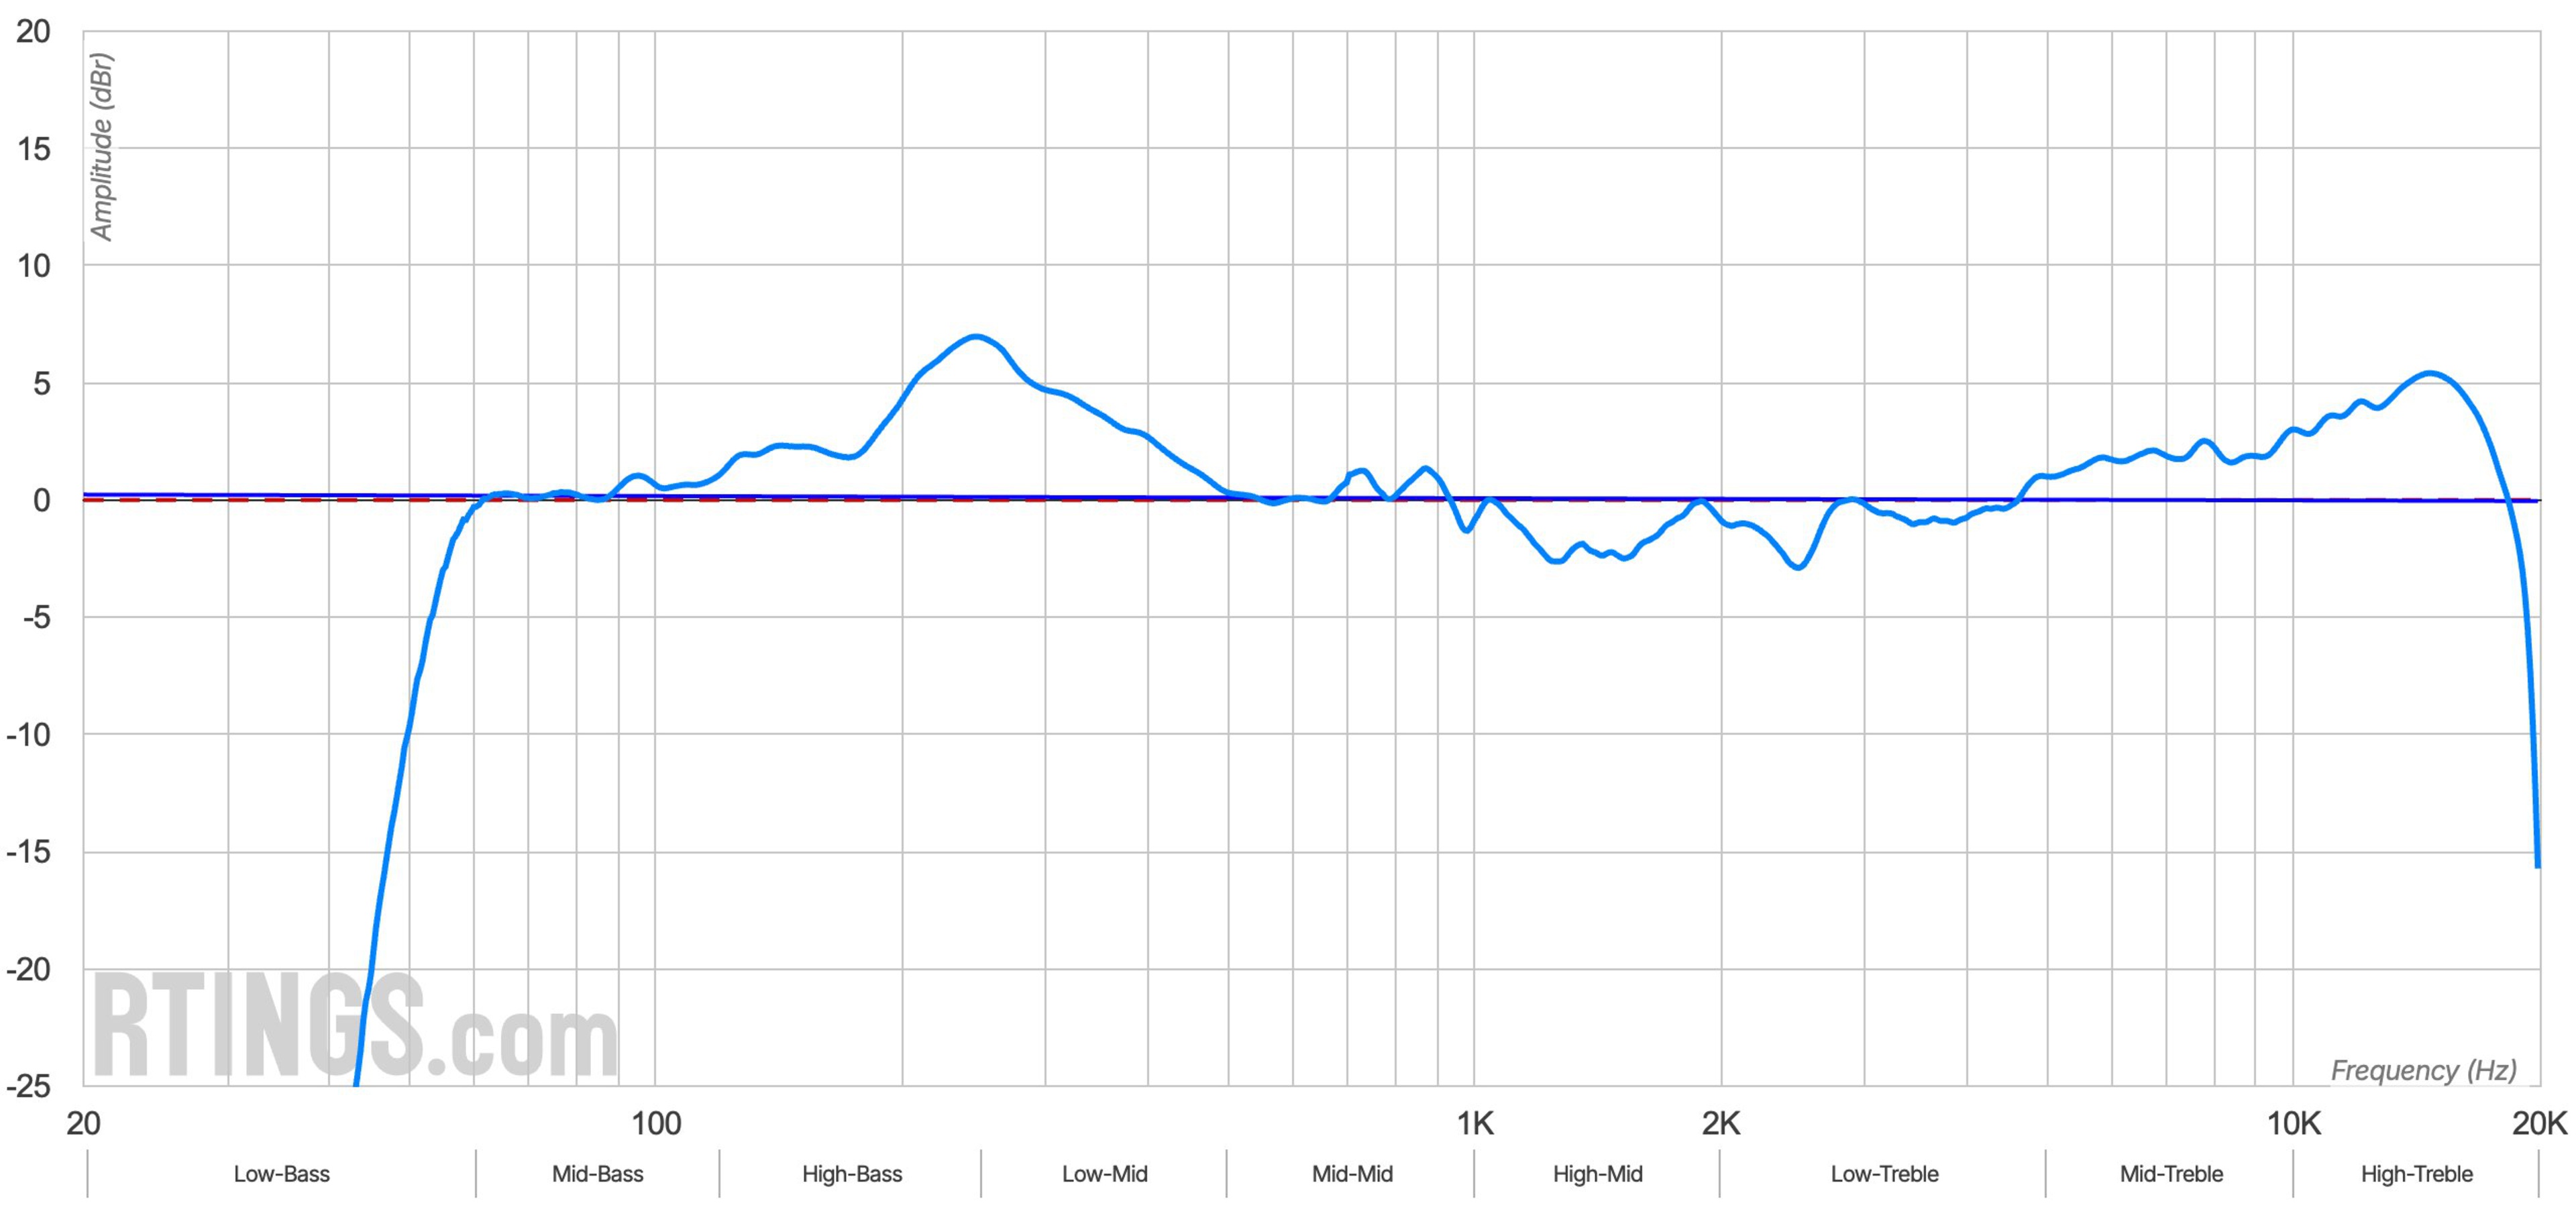
We've also changed the score weighting. Std. Err. now has more influence because an even, balanced response is a major part of what makes a speaker sound accurate. Low-Frequency Extension is still important, but the new weighting avoids leaning too heavily on it, which can overly penalize smaller speakers that sound balanced but can't reproduce much deep bass.
| Score Component | Old Weighting | New Weighting |
|---|---|---|
| Std. Err. | 40% | 50% |
| Low-Frequency Extension | 55% | 45% |
| High-Frequency Extension | 5% | 5% |
Raw Frequency Response
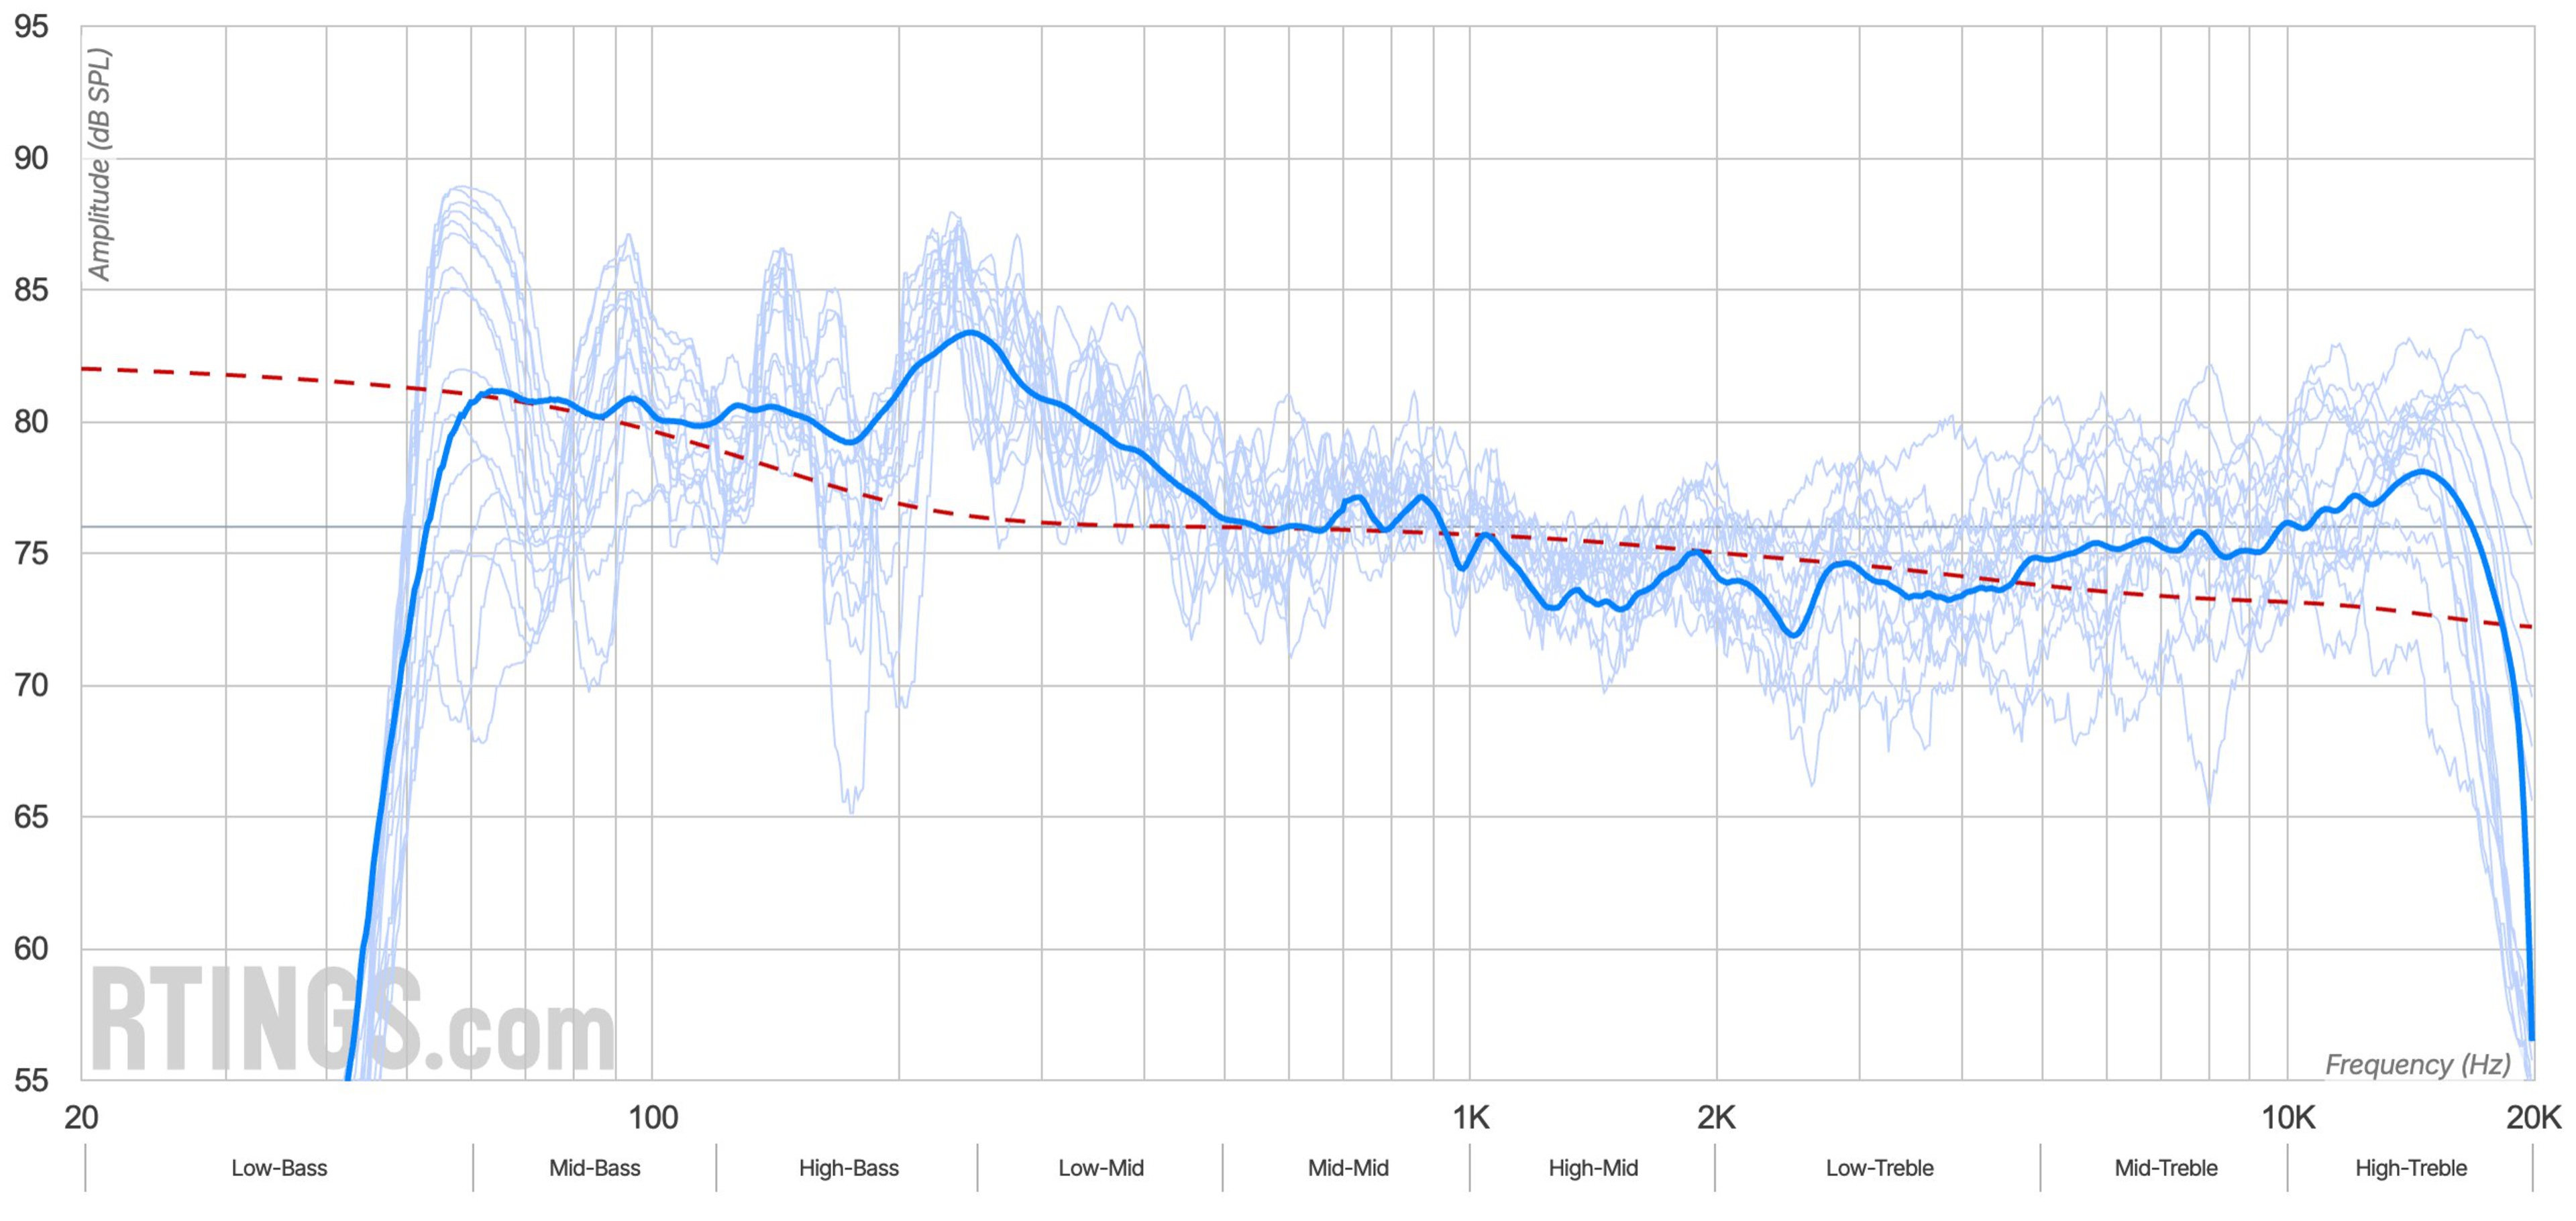
Raw Frequency Response now uses the same updated measurement method as Frequency Response Accuracy. It still shows the speaker's uncompensated response, so the results aren't adjusted to match our in-room target. However, the target curve is still shown on the graph for reference. The new graph is based on the updated sine sweep, nearfield, and 1 m microphone-array capture process, making it more useful for comparing our results with external measurements.
Directivity
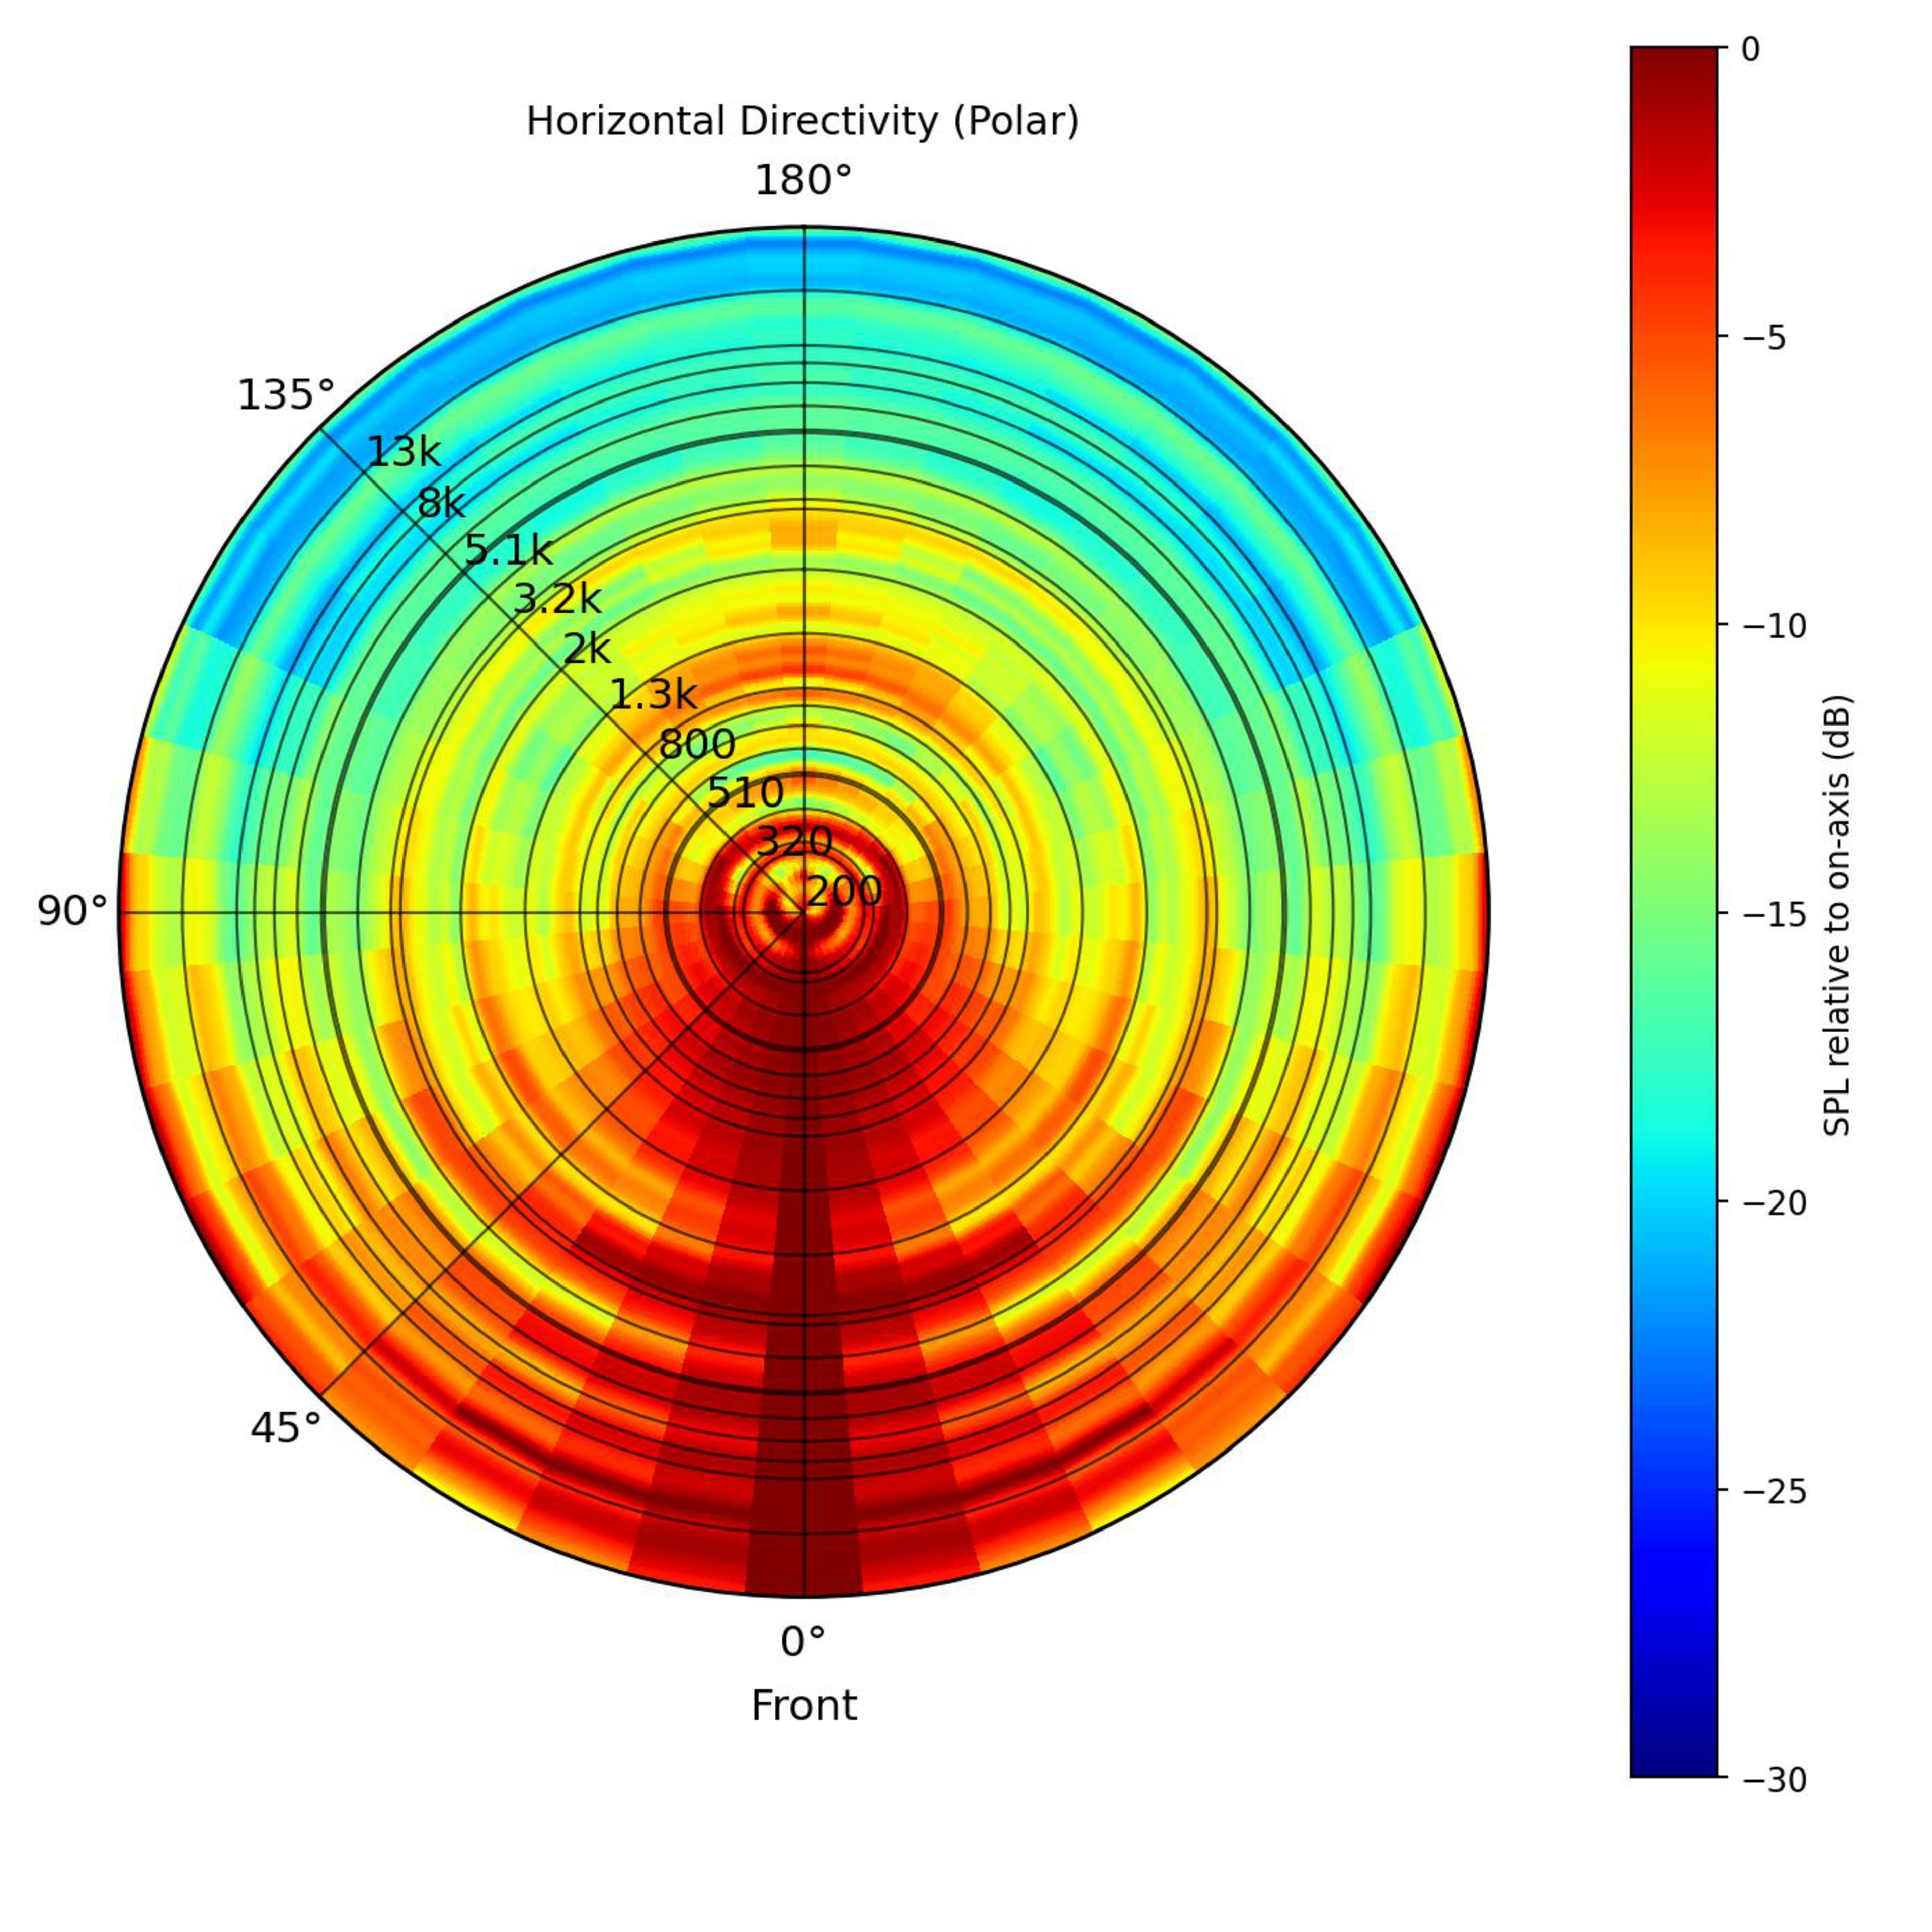
Soundstage is now called Directivity. This name is a closer fit for the data in this box, which is built around Directivity Index and Stereo rather than subjective impressions of width or immersion. In practice, the test shows how much a speaker's sound changes as you move off-axis, like if you're sitting to the side or walking around it, and whether it keeps the left and right channels separate.
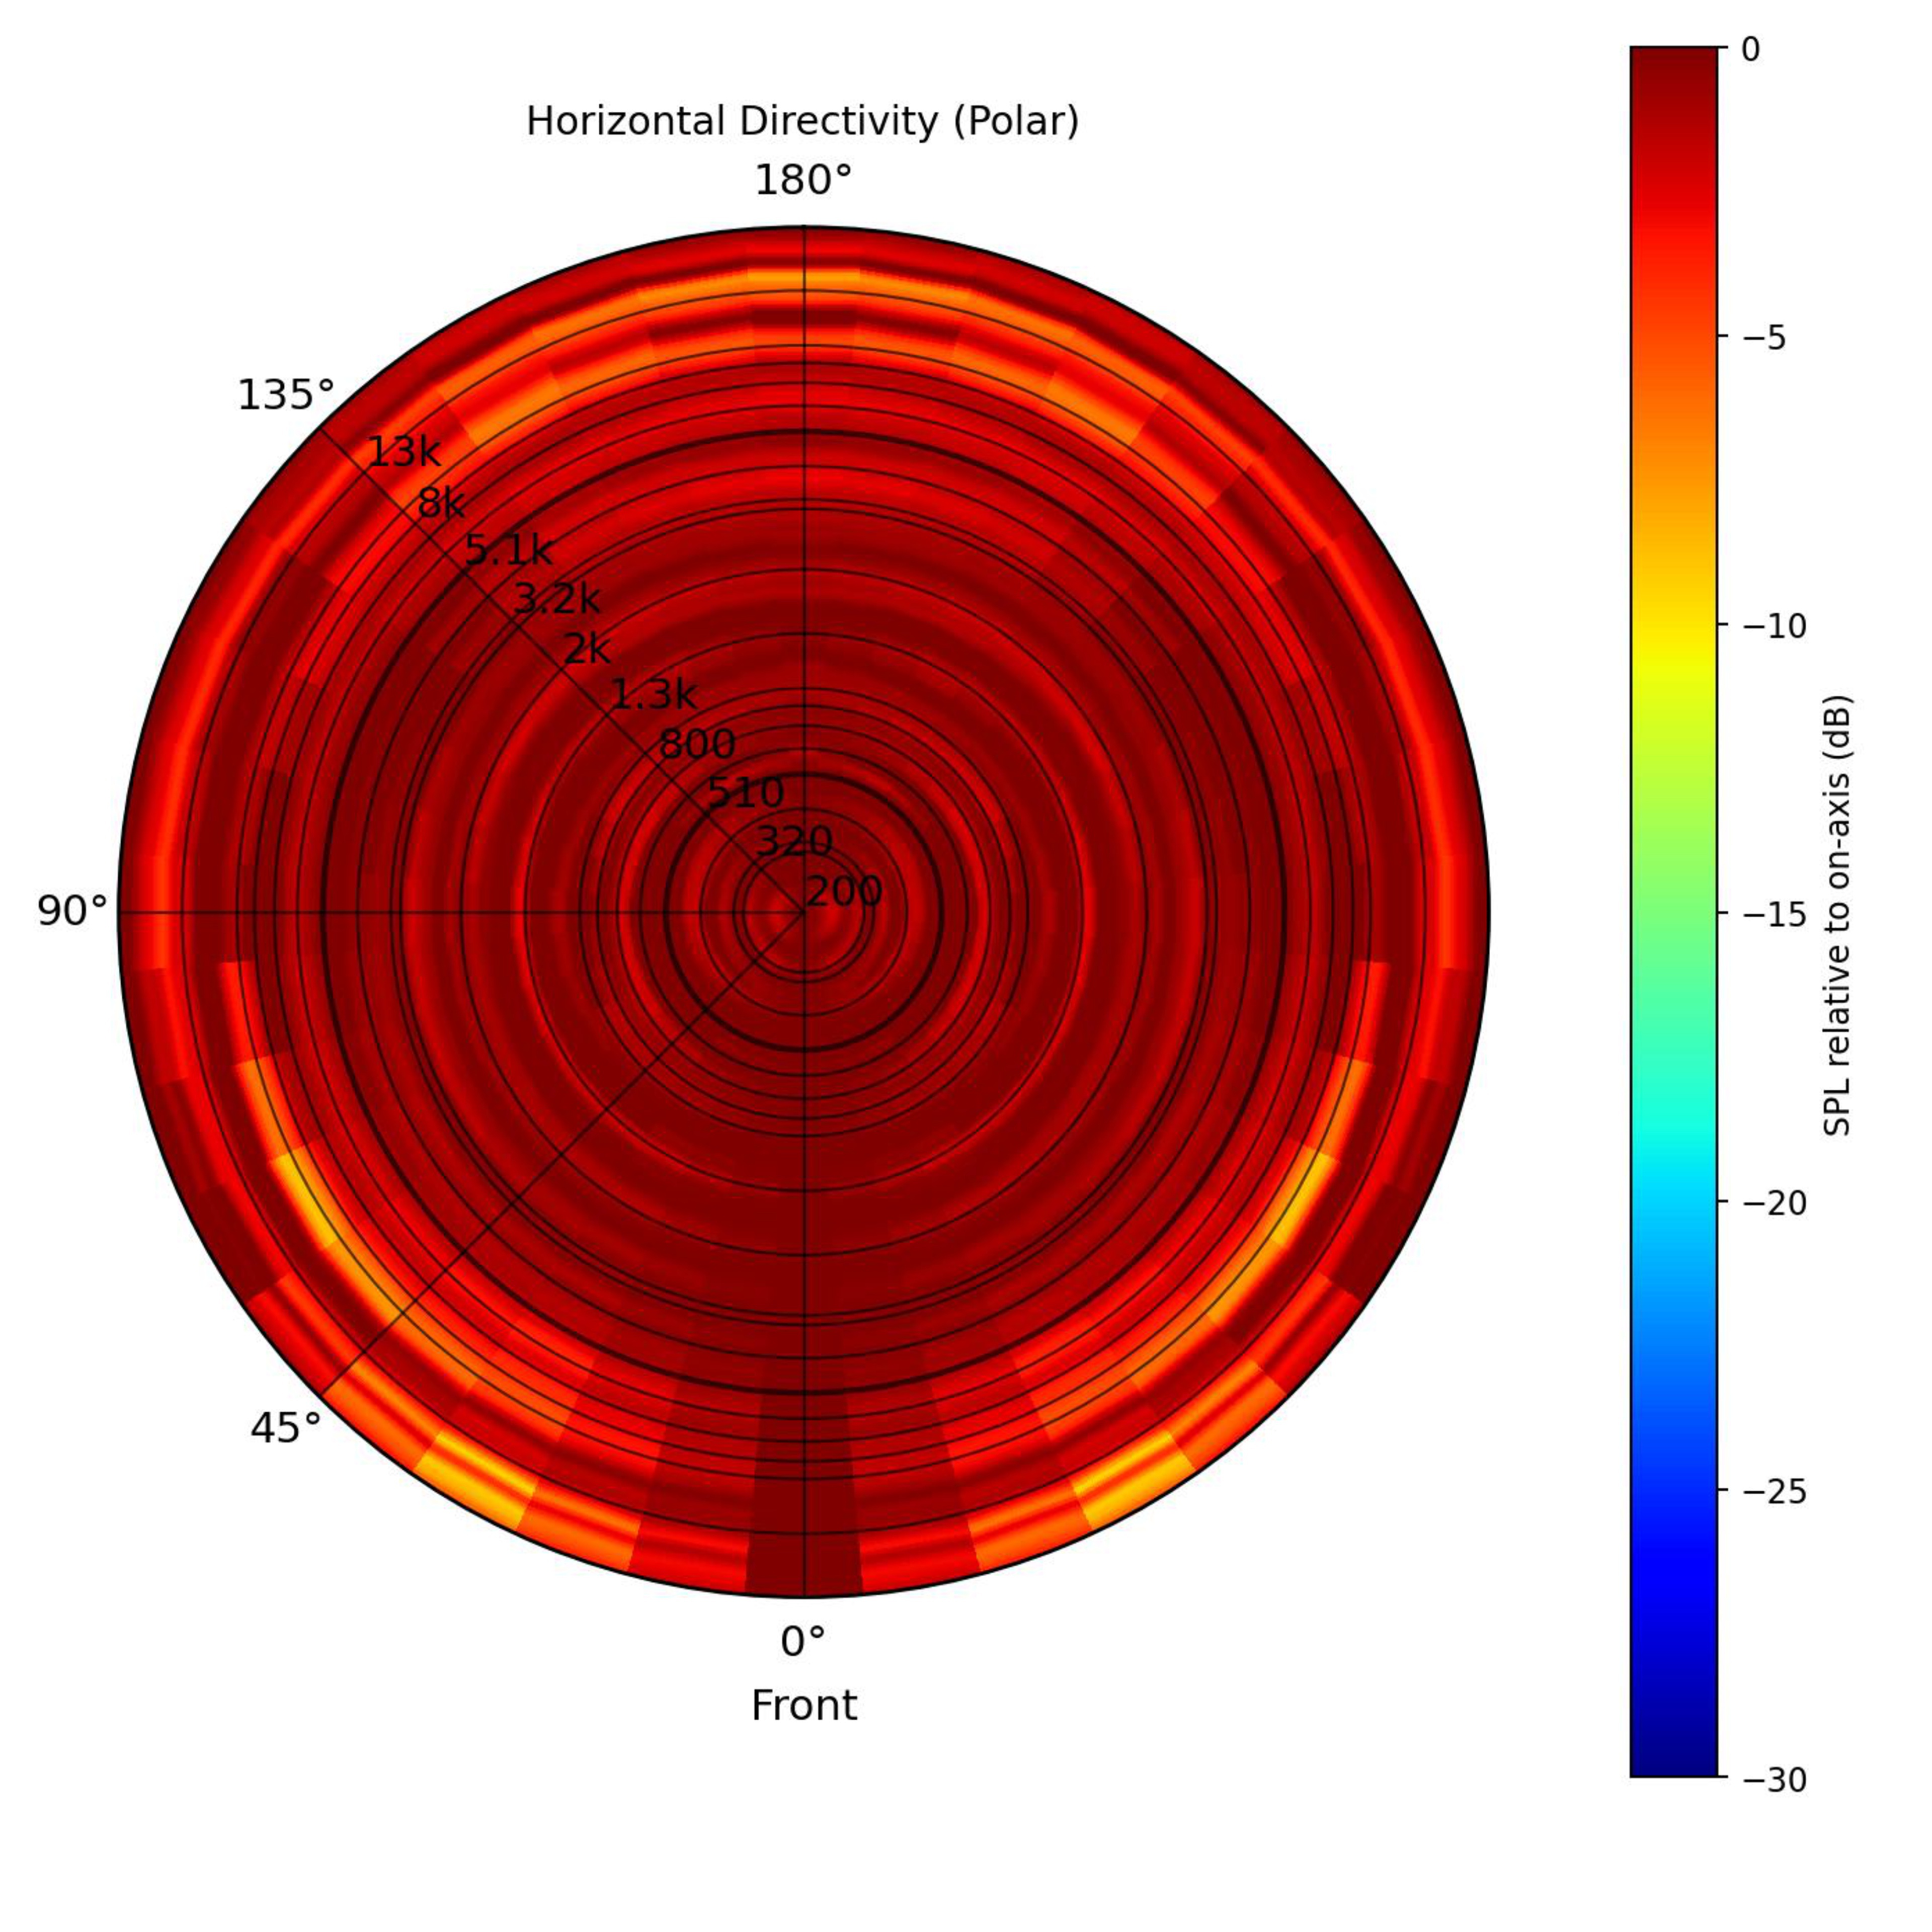
We've also updated how we capture and present these results. Directivity is now measured using the same sine sweep as Frequency Response Accuracy instead of pink noise. The graph has changed, too: instead of only showing a line graph, we now use a circular polar plot. This makes it easier to see how evenly the speaker projects sound around the room and where sound drops off as you move away from the front of the speaker.
 |
 |
Directivity Index now carries more weight because this box is mainly about how consistent a speaker sounds off-axis. But stereo still counts, since separate left and right channels affect reproduction accuracy, especially for sounds like hard-panned guitars and spatial effects like reverb.
| Score Component | Old Weighting | New Weighting |
|---|---|---|
| Directivity Index | 75% | 85% |
| Stereo | 25% | 15% |
Loudness
We've renamed Dynamics to Loudness, since this test focuses on how loud the speaker gets and how much its sound changes at maximum volume.
We now measure Loudness at 1 m using CTA-2034 weighted noise. DRC at Max Volume also compares the speaker's response at maximum volume against its response at 85 dB SPL instead of 76 dB SPL. DRC at Max Volume is now calculated from the speaker's Low-Frequency Extension to 20 kHz, rather than across the full 20 Hz to 20 kHz range. This helps avoid penalizing speakers for compression in frequencies they don't reproduce.
Maximum volume now makes up most of the Loudness score, so the result is easier to read at a glance: higher-scoring speakers get louder. But DRC at Max Volume still counts, since a good speaker should stay clean and controlled when pushed near its limits.
| Score Component | Old Weighting | New Weighting |
|---|---|---|
| SPL @ Max Volume | 60% | 90% |
| DRC @ Max Volume | 40% | 10% |
Usage Scores
We've updated the usage score weightings to reflect the renamed Sound tests: Soundstage has been replaced by Directivity, and Dynamics by Loudness. Since the underlying Sound tests and score weightings have also changed, some usage scores may change even if a speaker's general performance is similar.
What Do You Think?
Our process is iterative, and your feedback is instrumental to our test bench development. If you have comments or questions about the above changes, please reach out to us in the comments, in our Discord server, or via email.
67 Speakers Updated So Far
We are retesting popular models first. So far, the test results for the following models have been converted to the new testing methodology. However, the text might be inconsistent with the new results.
- Amazon Echo Dot Max
- Amazon Echo Studio 2025
- Anker Soundcore 3
- Anker Soundcore Boom 2
- Anker Soundcore Boom 3i
- Anker Soundcore Motion 300
- Anker Soundcore Motion Boom
- Anker Soundcore Motion Boom Plus
- Anker Soundcore Motion X600
- Anker Soundcore Select 4 Go
- Apple HomePod (2nd generation)
- Bang & Olufsen Beosound A1 3rd Gen
- Beats Pill
- Bose Portable Smart Speaker
- Bose S1 Pro+
- Bose SoundLink Flex (2nd Gen)
- Bose SoundLink Max
- Bose SoundLink Micro (2nd Gen)
- Bose SoundLink Plus
- Brane X
- Denon Home 350
- EarFun UBOOM X
- Google Nest Audio
- Harman/Kardon Go + Play 3
- Harman/Kardon Onyx Studio 9
- JBL Authentics 500
- JBL Boombox 3
- JBL Boombox 4
- JBL Charge 6
- JBL Clip 5
- JBL Flip 7
- JBL Go 4
- JBL PartyBox 110
- JBL PartyBox 310
- JBL PartyBox 520
- JBL PartyBox 710
- JBL PartyBox 720
- JBL PartyBox Club 120
- JBL PartyBox Encore Essential 2
- JBL PartyBox Stage 320
- Klipsch GIG XXL
- LG Sound Suite M7
- LG xboom Bounce
- LG xboom Grab
- LG xboom Stage 301
- Marshall Bromley 450
- Marshall Bromley 750
- Marshall Kilburn III
- Marshall Middleton II
- Minirig 4
- Sonos Era 100
- Sonos Era 300
- Sonos Move 2
- Sonos Play
- Sonos Roam 2
- Sony SRS-XB100
- Sony SRS-XV500
- Sony ULT FIELD 3
- Sony ULT FIELD 7
- Sony ULT TOWER 9AC
- Tribit StormBox Blast
- Tribit Stormbox Micro 2
- Ultimate Ears EPICBOOM
- Ultimate Ears HYPERBOOM
- Ultimate Ears MEGABOOM 4
- Ultimate Ears WONDERBOOM 4
- WiiM Sound
27 Speakers Planned To Be Updated
We are also planning to retest the following products over the course of the next few weeks:
- Amazon Echo Studio (1st generation)
- Anker Soundcore 2
- Anker Soundcore Boom 2 Plus
- Anker Soundcore Flare 2
- Anker Soundcore Motion+
- Anker Soundcore Select 2S
- Bose SoundLink Flex
- Bose SoundLink Micro
- Bushnell Wingman HD
- JBL Authentics 200
- JBL Charge 5
- JBL Flip 6
- JBL Grip
- JBL PartyBox 1000
- JBL PartyBox Encore Essential
- JBL Xtreme 3
- JBL Xtreme 4
- Lodge Solar Speaker 4 Series 2
- Marshall Emberton II
- Marshall Middleton
- Marshall Woburn III
- Sonos Five
- Sony ULT FIELD 1
- Sony ULT FIELD 5
- Turtlebox Ranger
- Ultimate Ears BOOM 4
- Ultimate Ears EVERBOOM
