The HDR Color Gamut defines the ranges of colors that a monitor can display in HDR. With monitors improving their HDR performance, it's important to get something that displays a wide range of colors to watch the latest HDR content with realistic colors. Besides the ability to display a wide color gamut, it's also important for the monitor to display them accurately.
We measure the HDR color gamut in two color spaces, DCI-P3 and Rec. 2020, and we publish graphs of the data so you can see how the monitor performs versus an ideal display.
You can learn more about our SDR color gamut testing here.
Test results
When It Matters
Having a monitor that displays a wide range of accurate colors is important for watching any HDR content. HDR, which stands for High Dynamic Range, is a video format that a lot of streaming content, physical media, and games are available in. It introduces a wider range of colors and higher brightness levels than SDR (see SDR vs HDR), improving overall picture quality.
However, a monitor supporting HDR doesn't guarantee good performance, and there are a few factors that impact a display's HDR performance. A high contrast ratio helps it display deep blacks next to bright highlights, and high HDR peak brightness allows highlights to get the brightest they can. Besides that, a wide color gamut lets the monitor display the wide range of colors needed for HDR content and helps provide a more realistic image.
Of course, if you aren't using your monitor for any HDR content, this test isn't relevant to you, but it matters if you do plan on using it for any HDR content, including playing the latest HDR games. If that's the case, check out our recommendation for the best HDR gaming monitors.
Our Tests
We measure the HDR color gamut using a Colorimetry Research CR-100 Colorimeter and Octave software on our testing PC. Using a 10% window size on the screen, Octave displays various colors and measures the color gamut this way. It can then generate a graph of the monitor's color gamut compared to an ideal gamut and calculate the gamut as a percentage. We measure the DCI-P3 and Rec. 2020 color spaces, and although there are other color spaces, like the wider Rec. 2100, these two are the most common in HDR content.
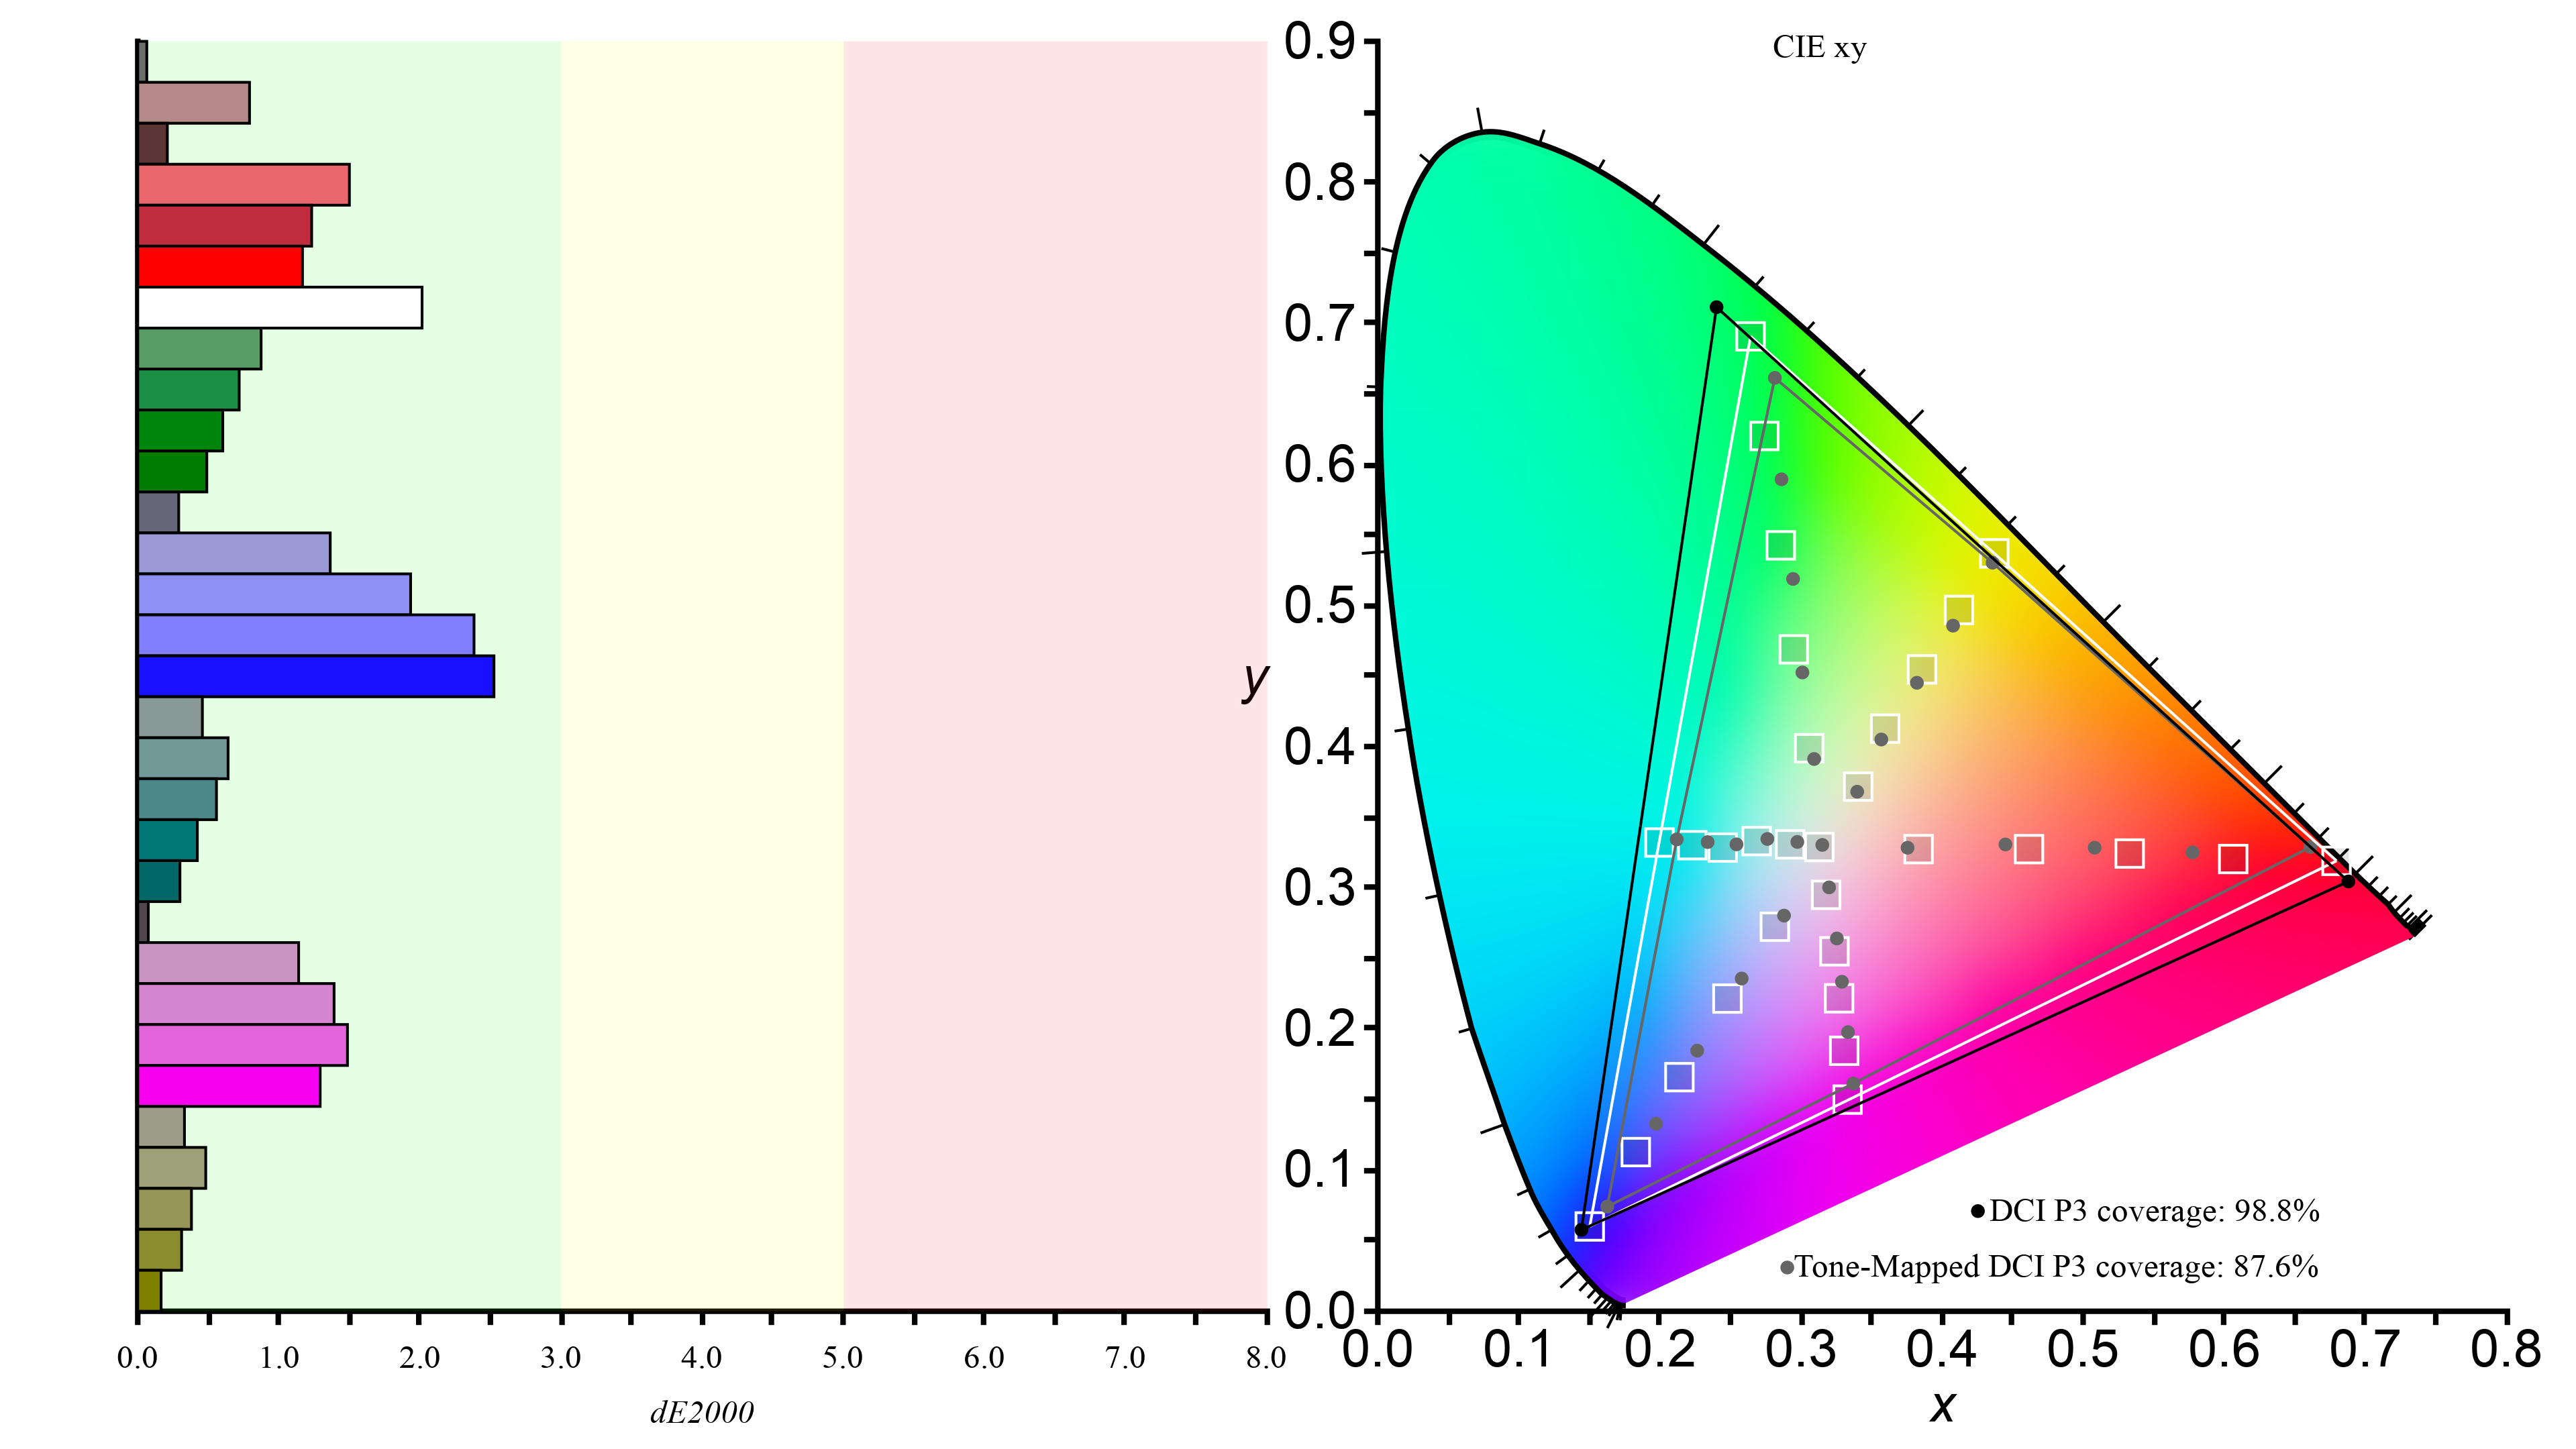
DCI-P3 Coverage xy
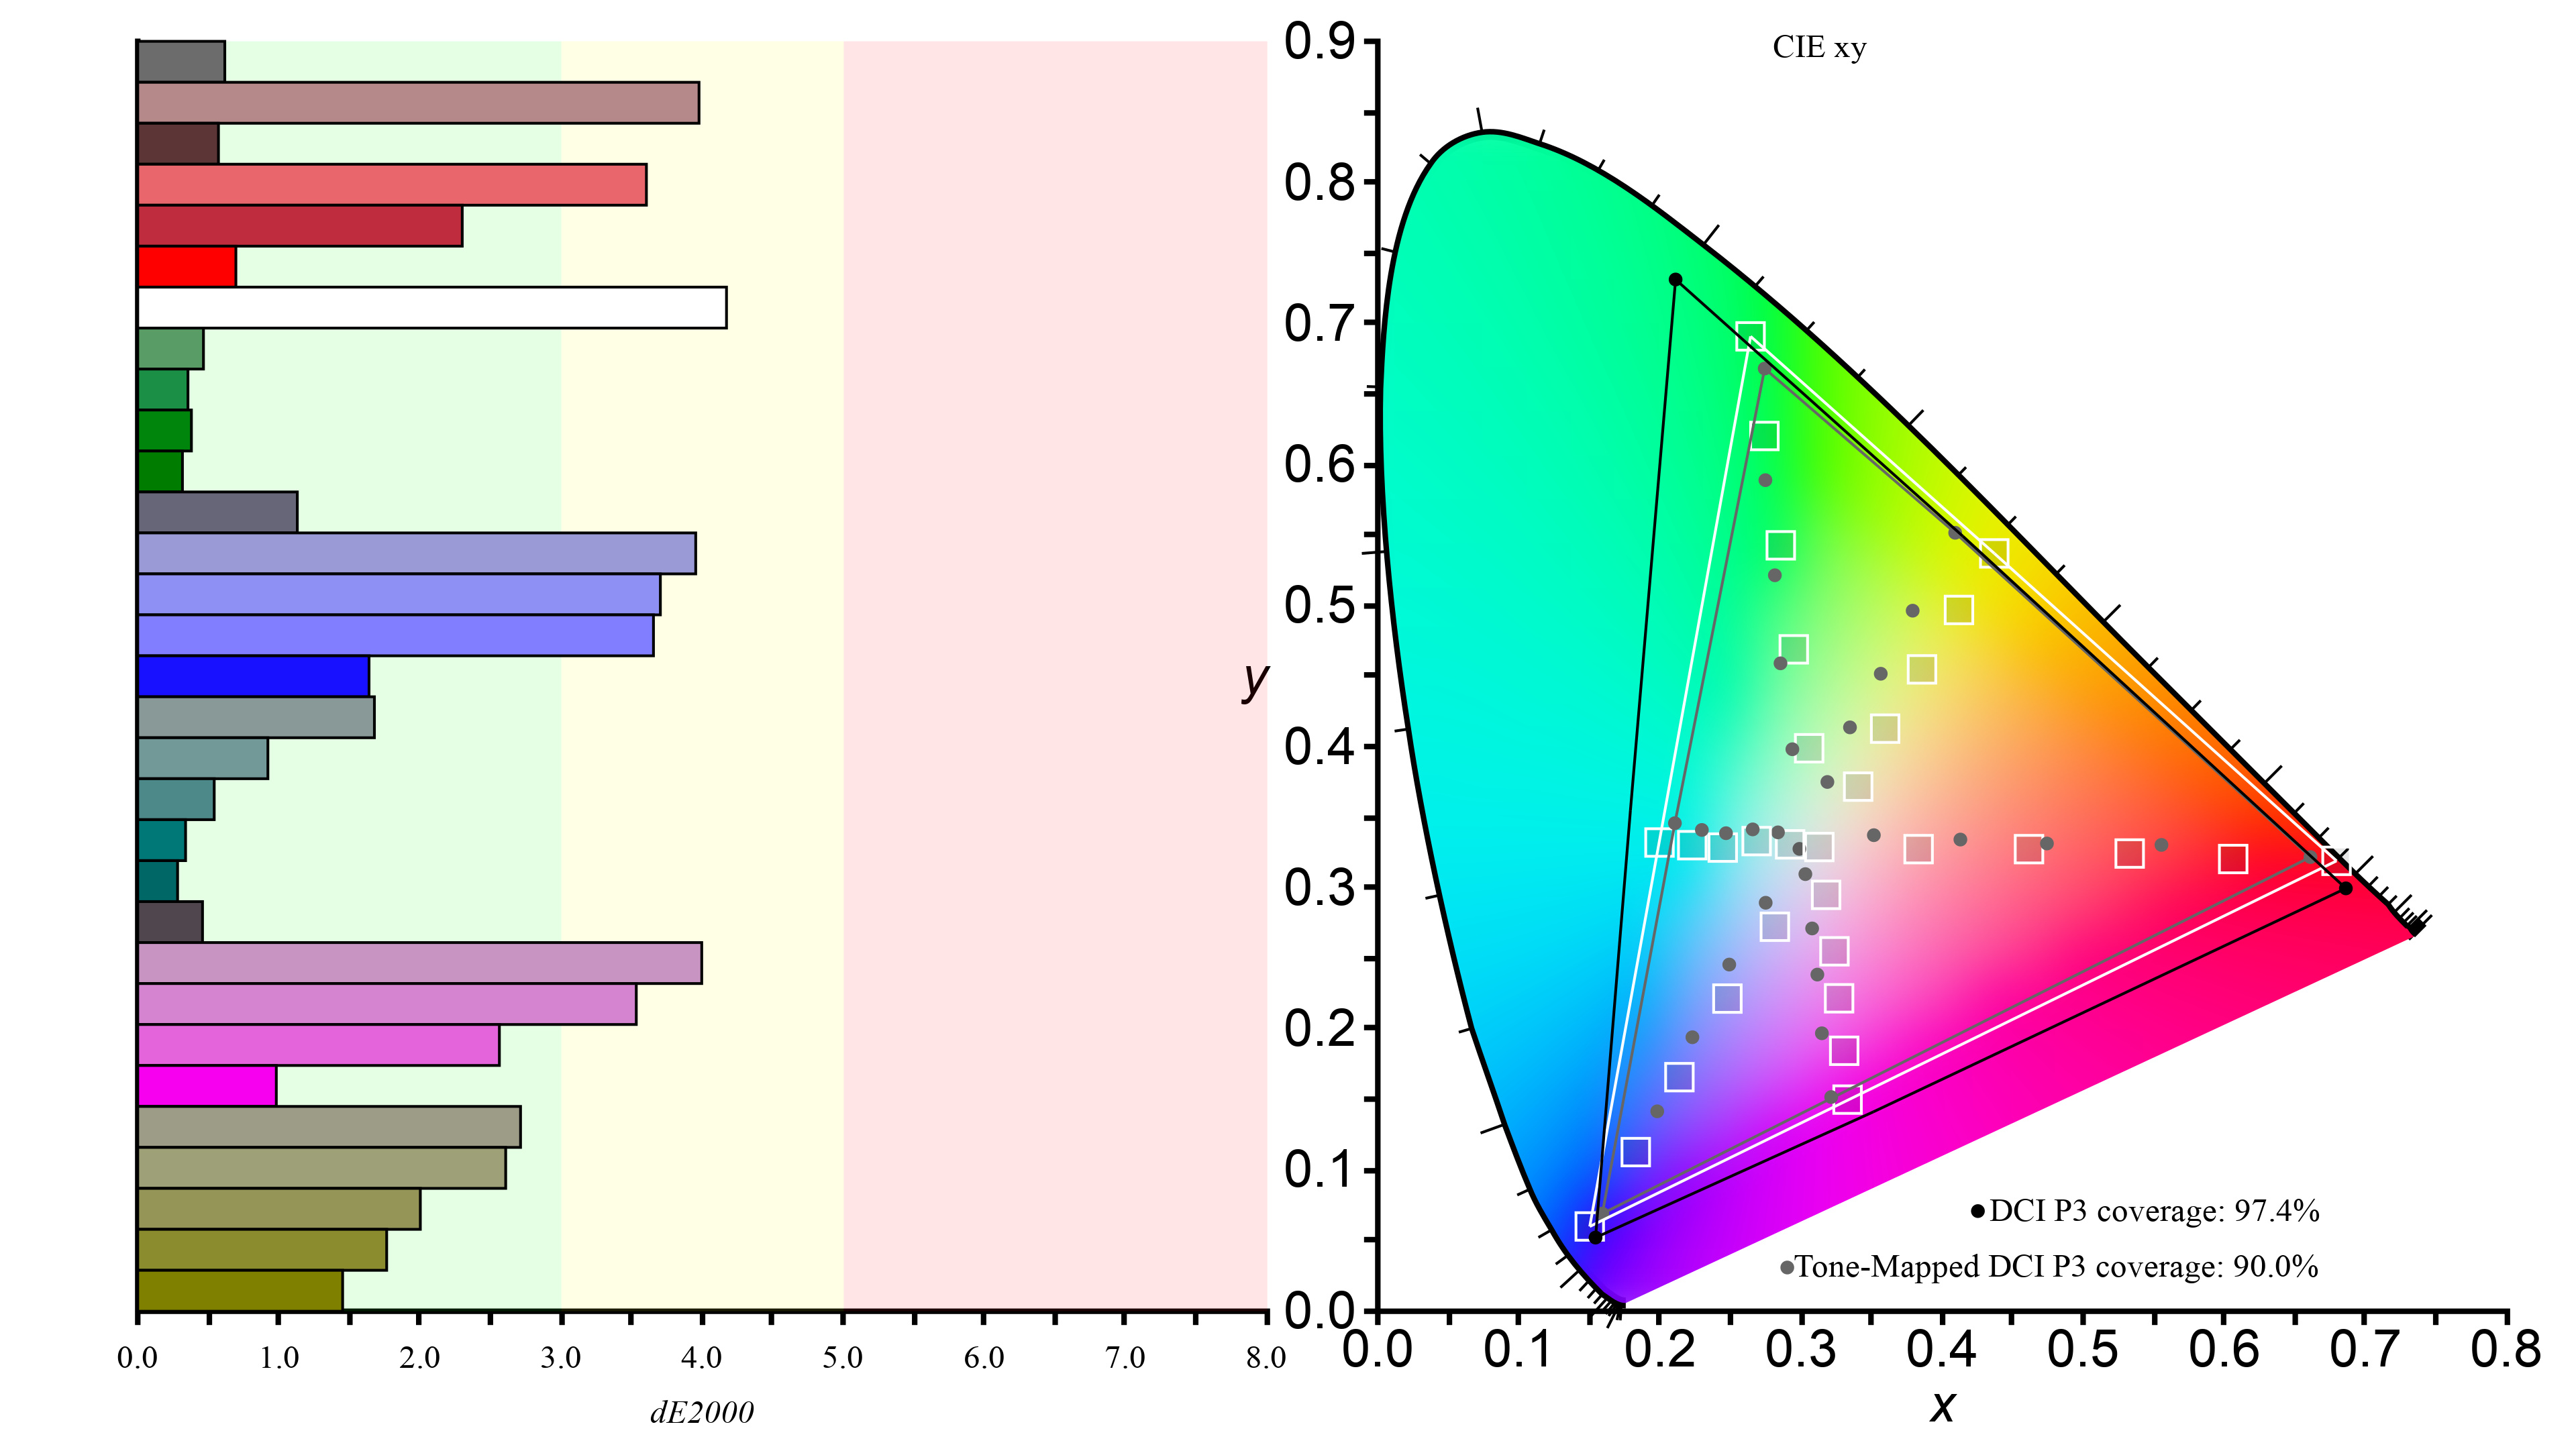
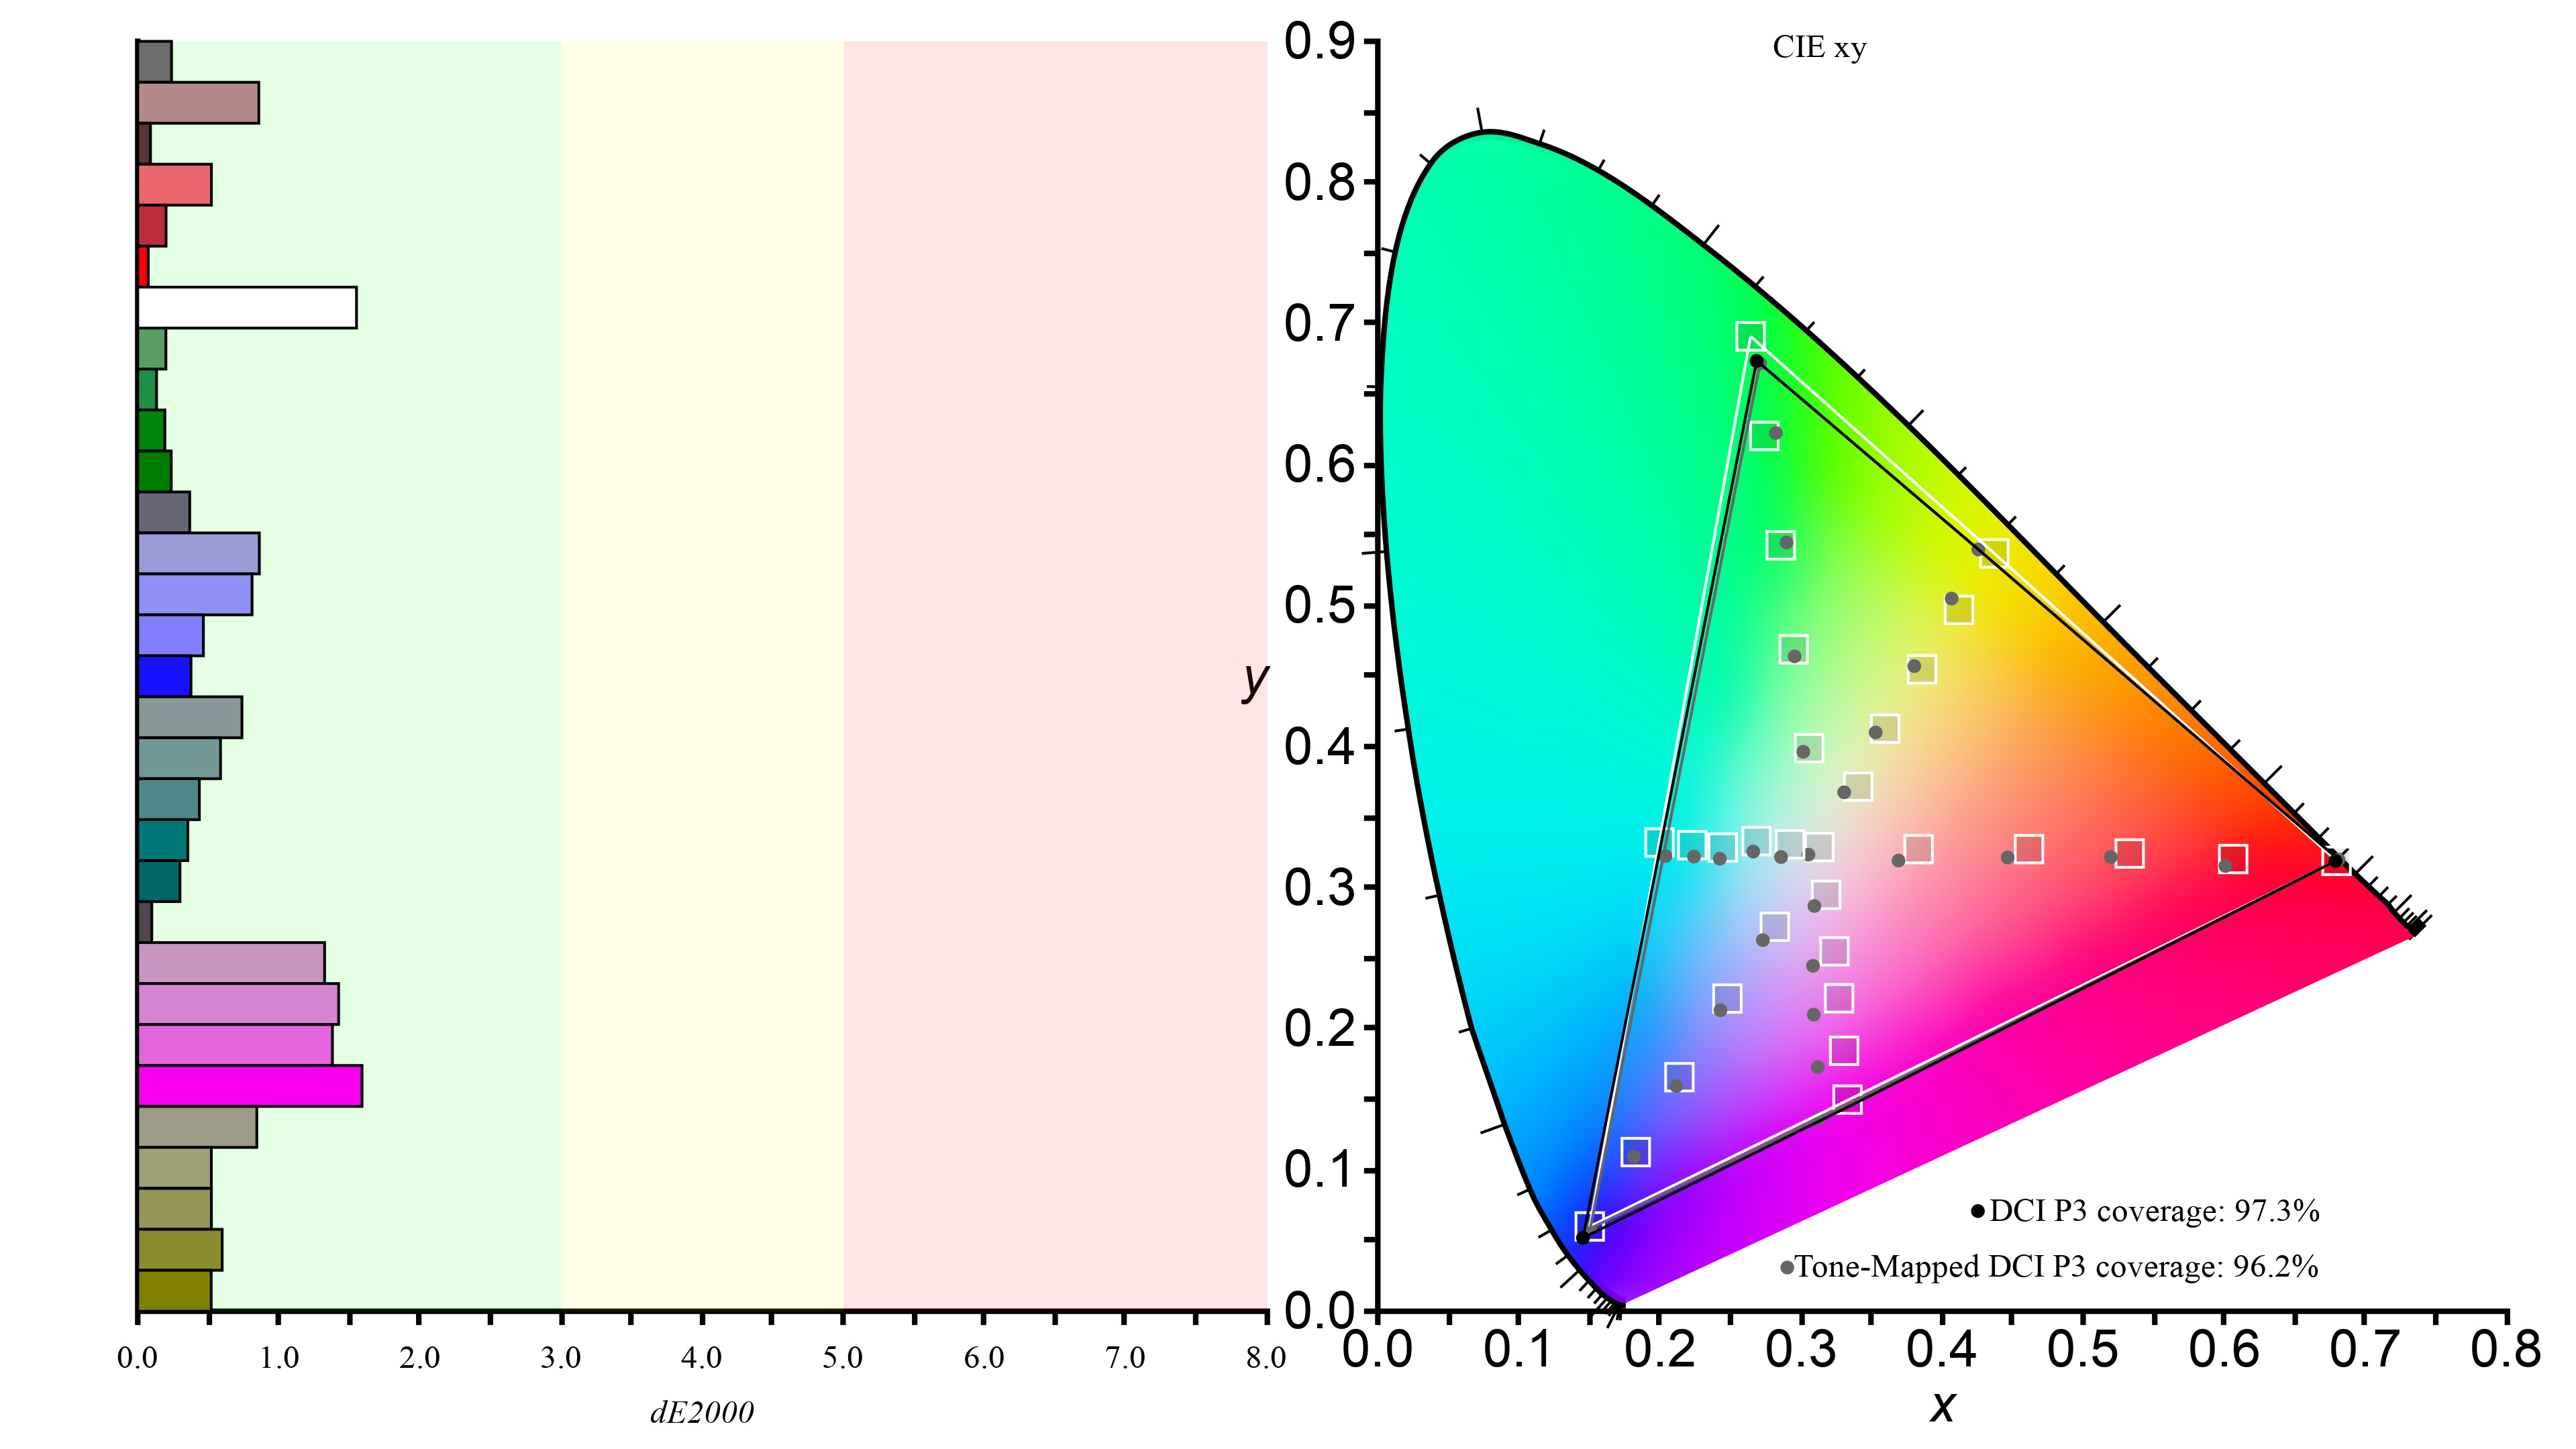
The DCI-P3 color space is the most common color space in HDR content. It's important for the monitor to be able to effectively display the gamut's full range of colors if you watch content that uses this color space. The results are plotted on graphs that have a few components. There's an entire area of colors, which is the CIE 1931 color space that represents the limit of colors that humans can perceive, and inside that, you can see where the DCI-P3 color space is, which is represented by the white triangle. The black triangle is the monitor's color space, and ideally, the black and white triangles match up.
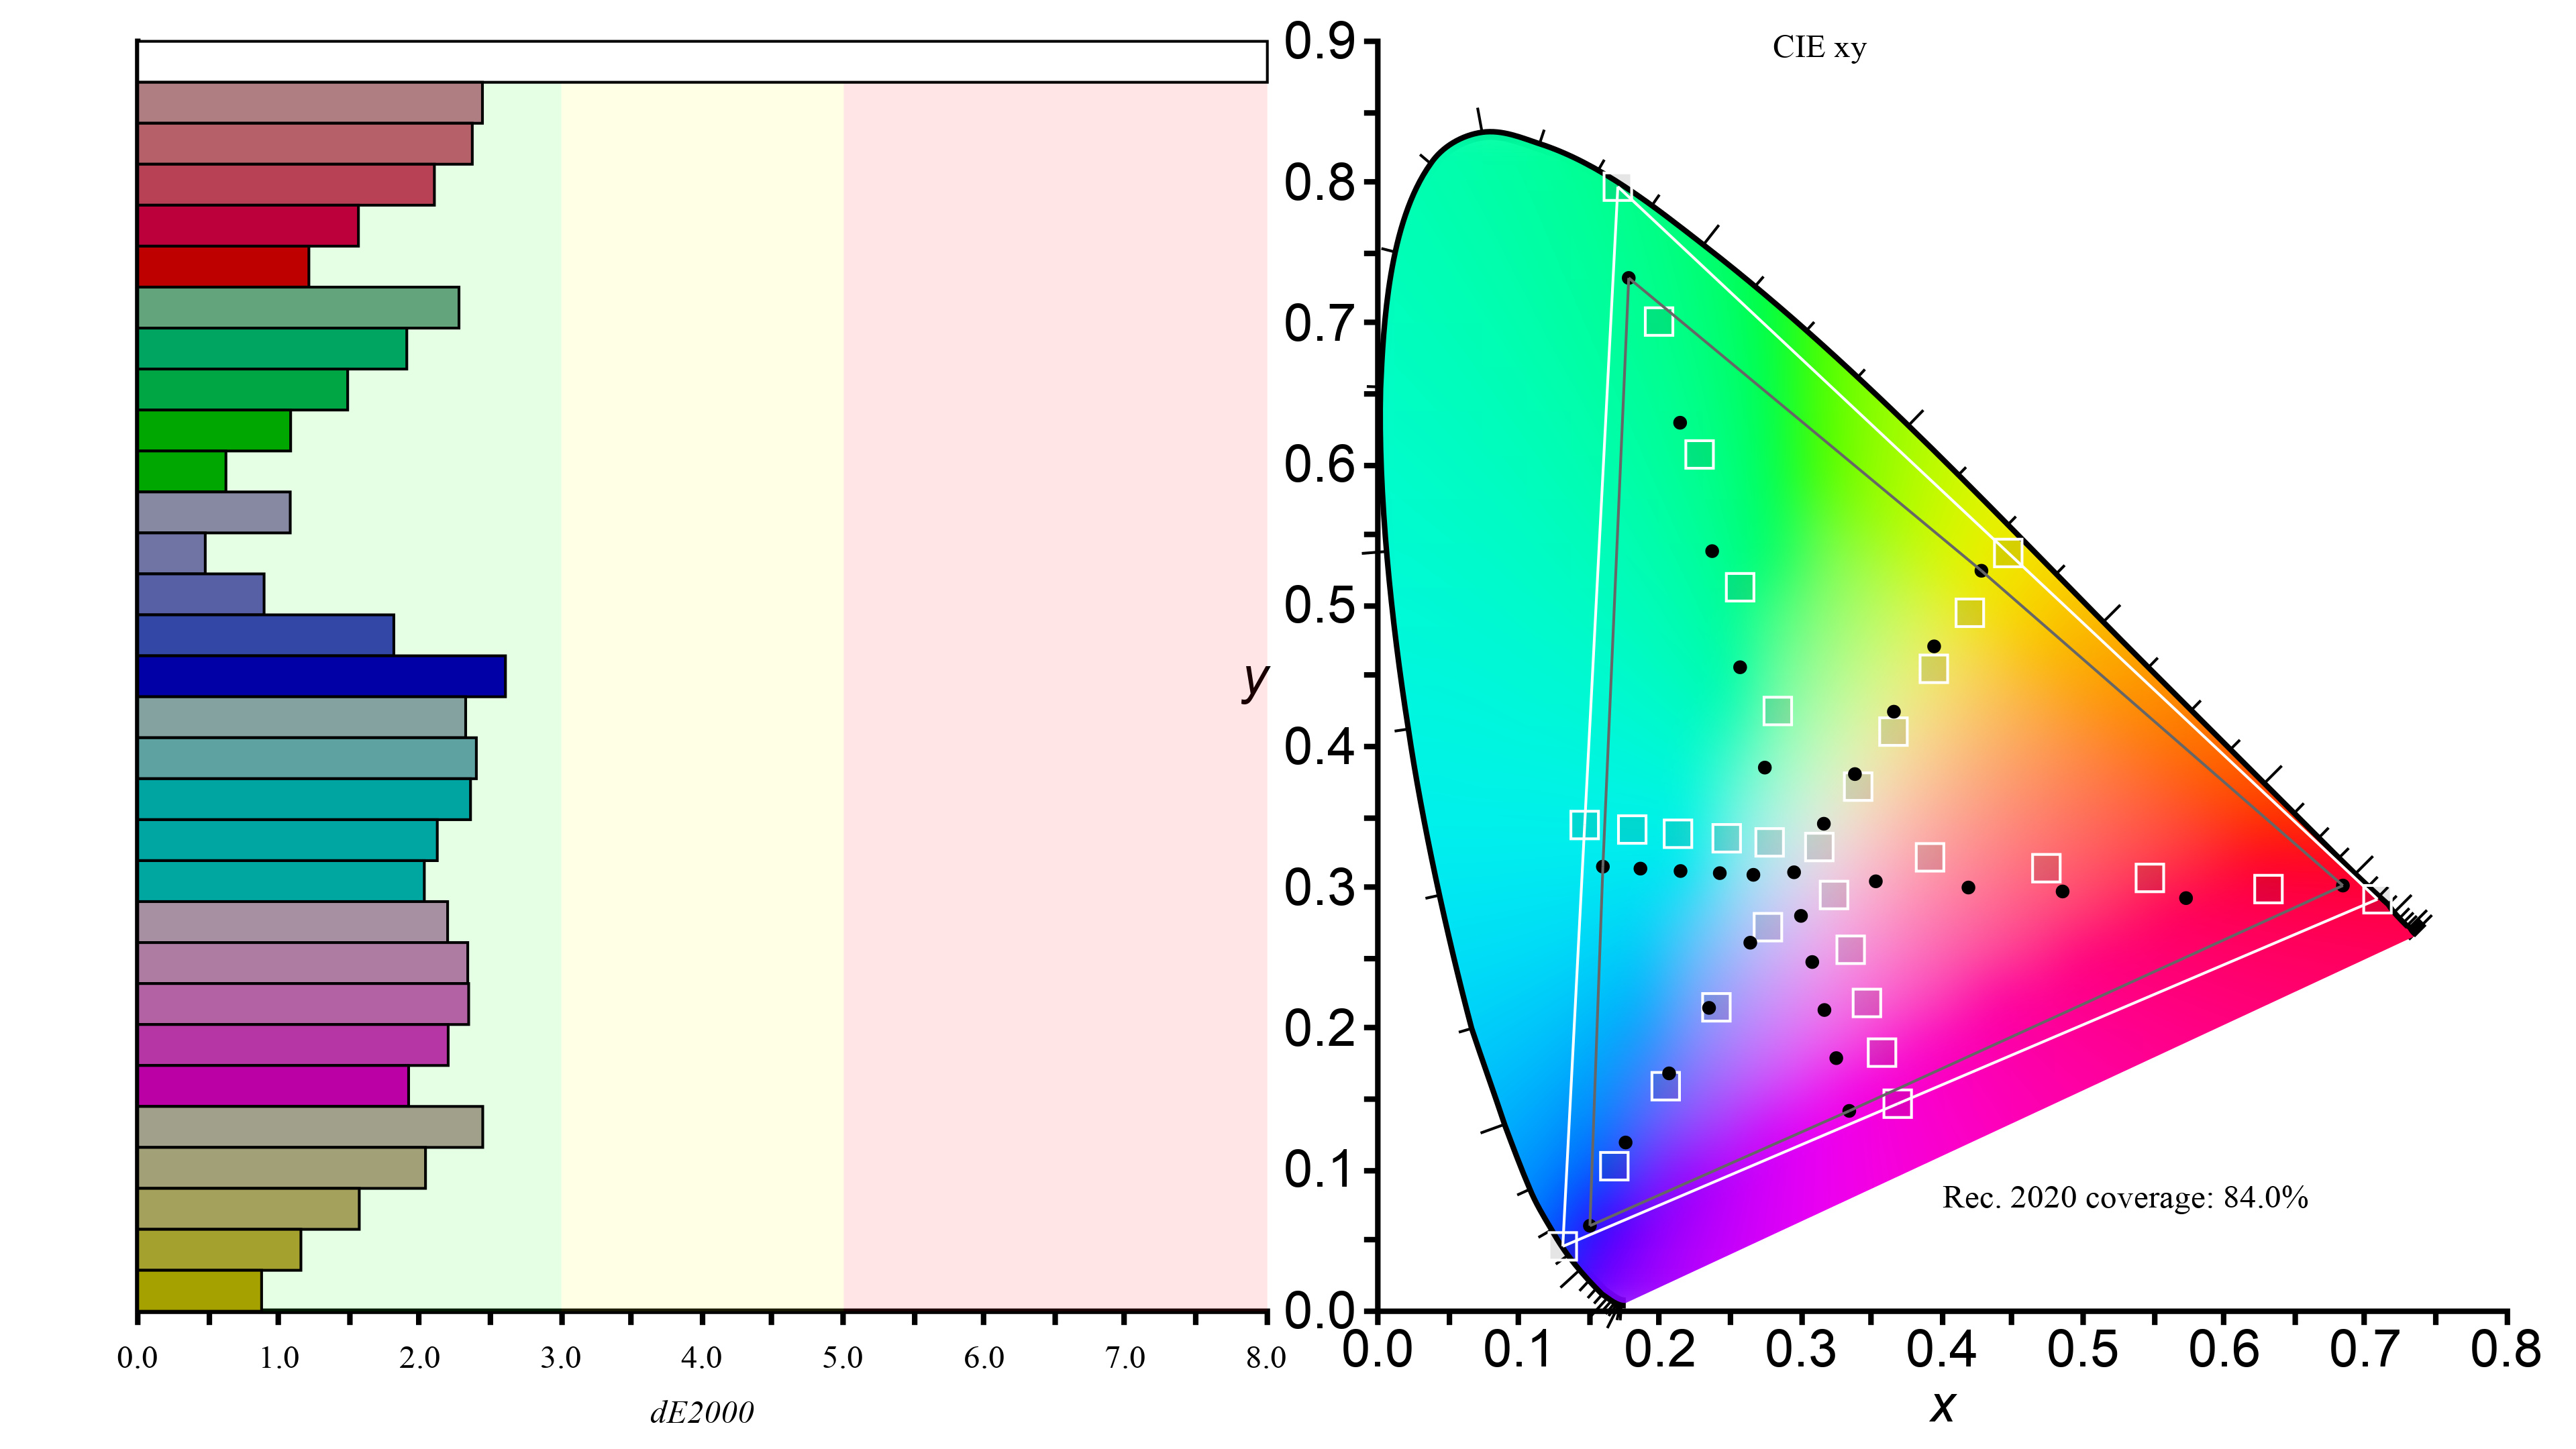
Below are two examples of good and bad color spaces. You can see that the monitor on the left fails to fill out the entire white triangle, meaning it can't display saturated colors well. On the other hand, the monitor on the right displays the entire range of colors almost perfectly.
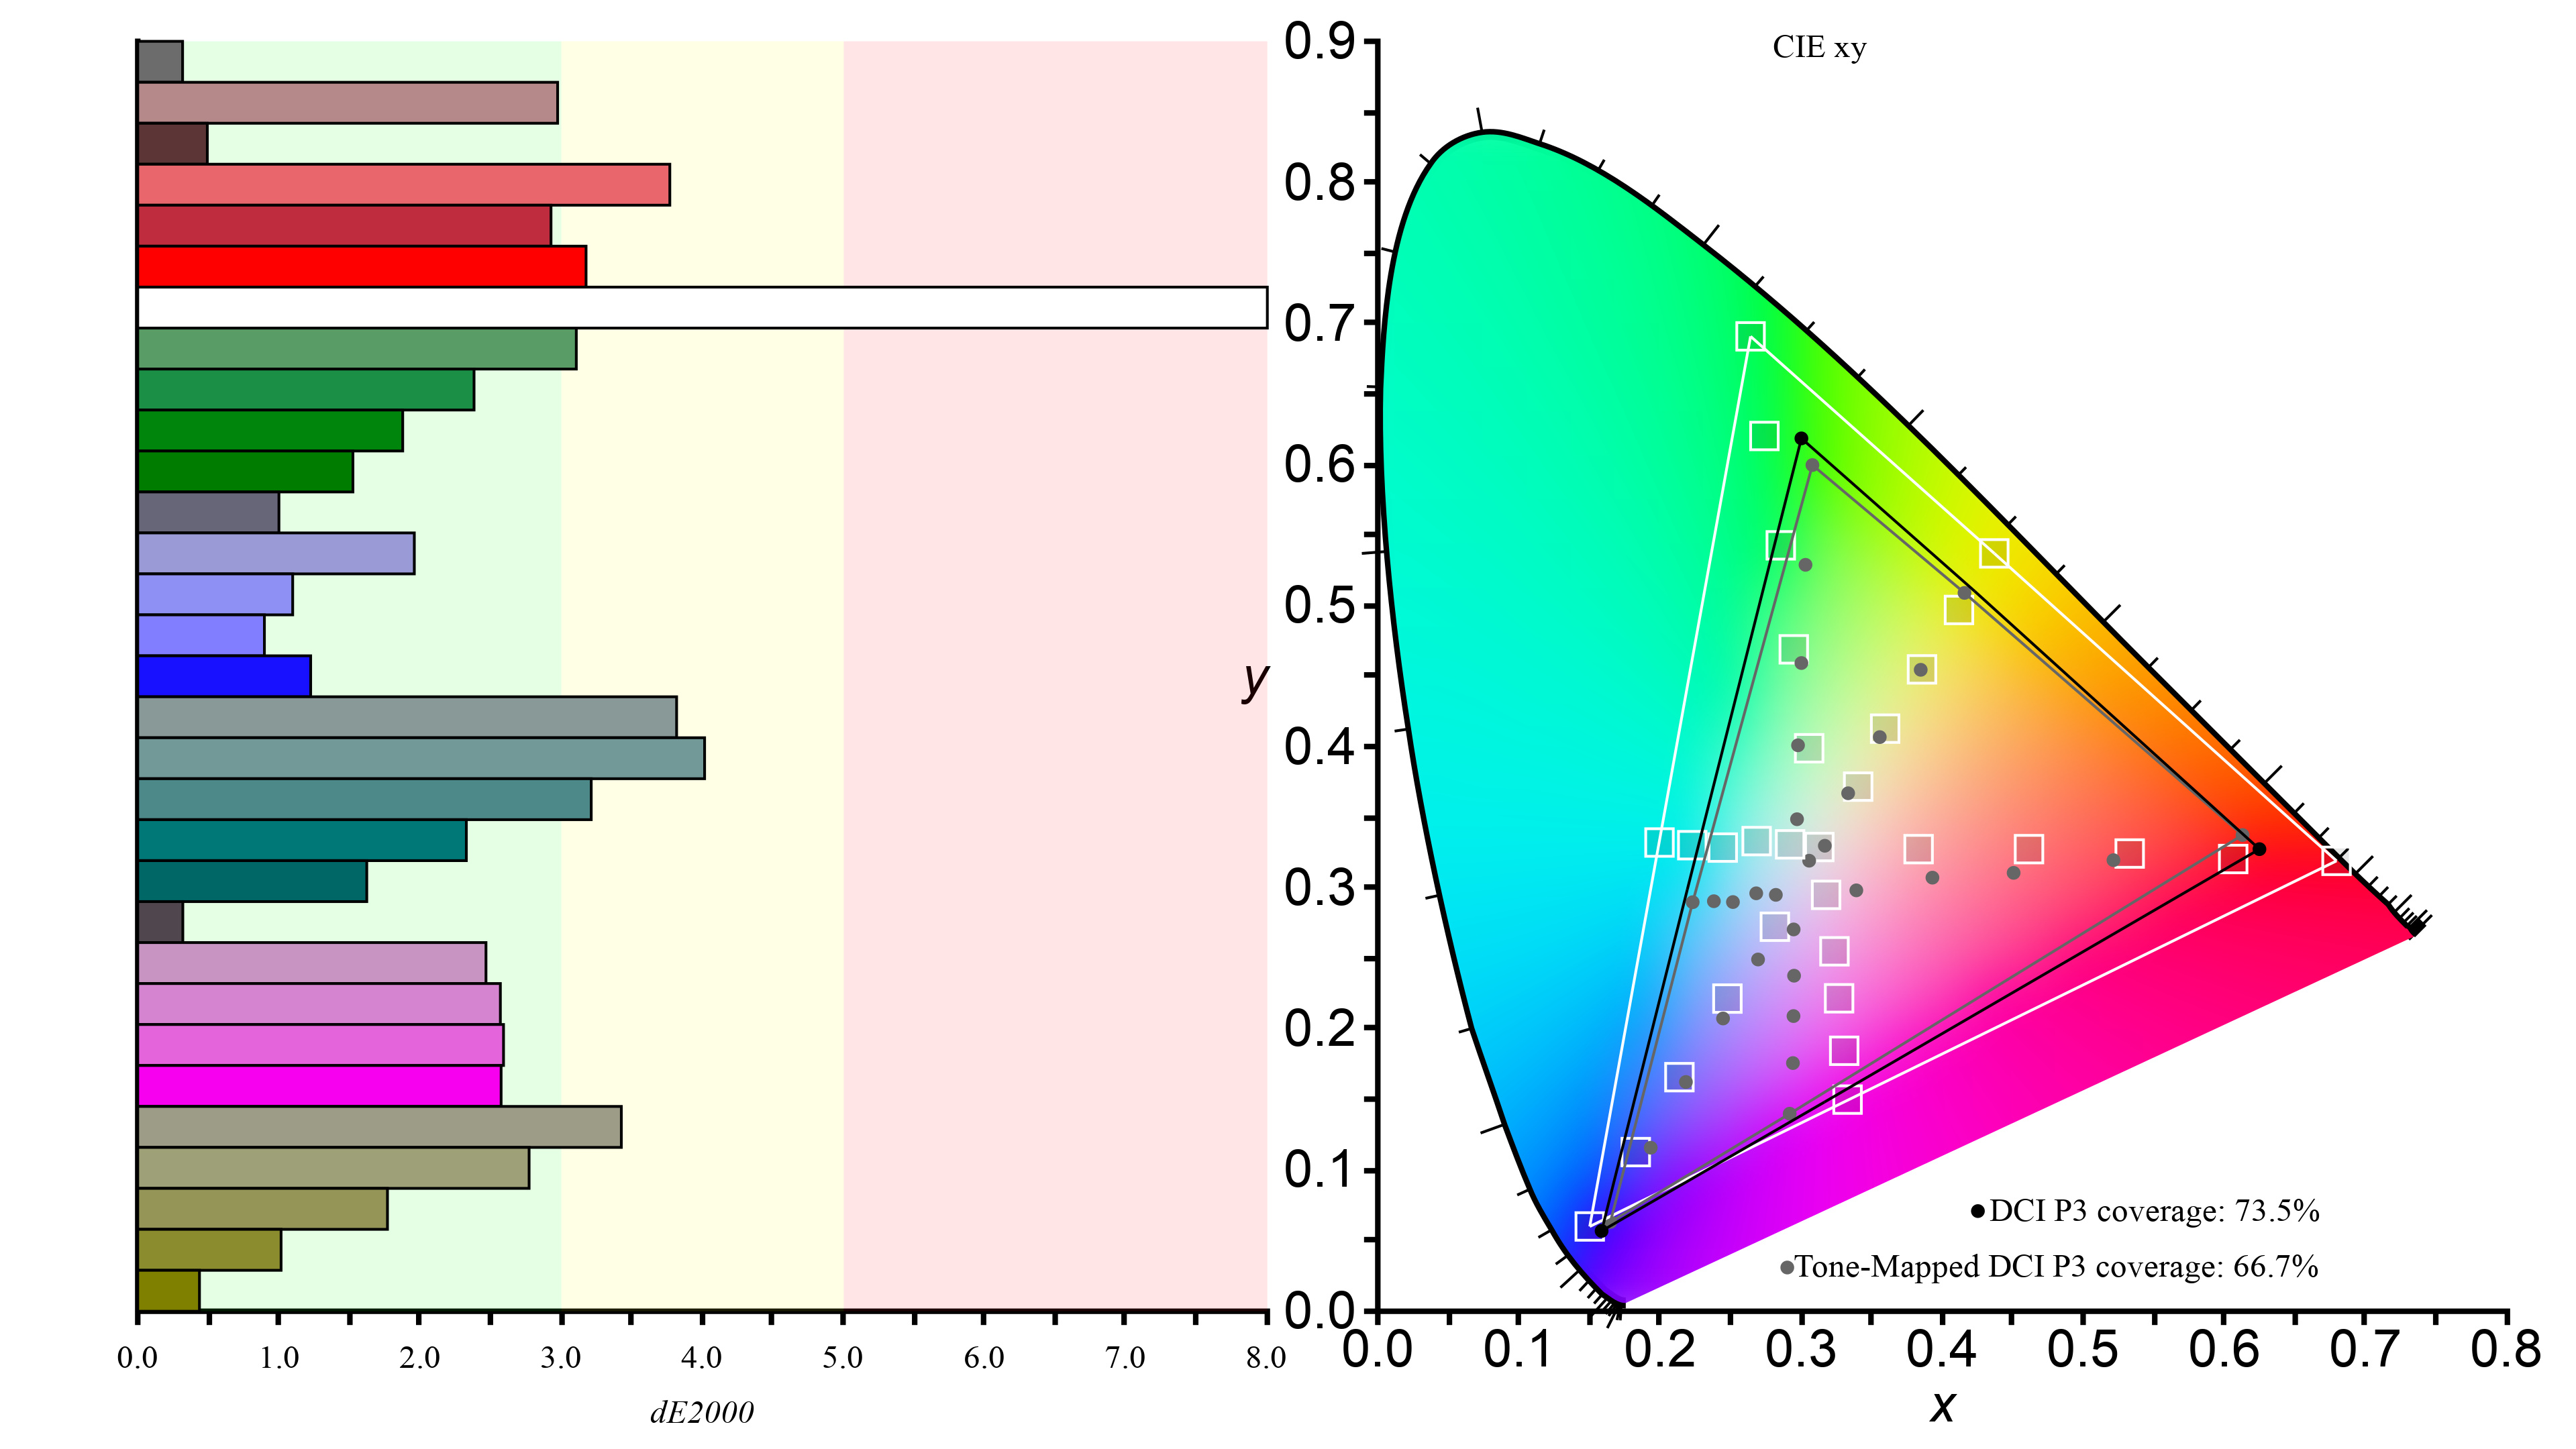
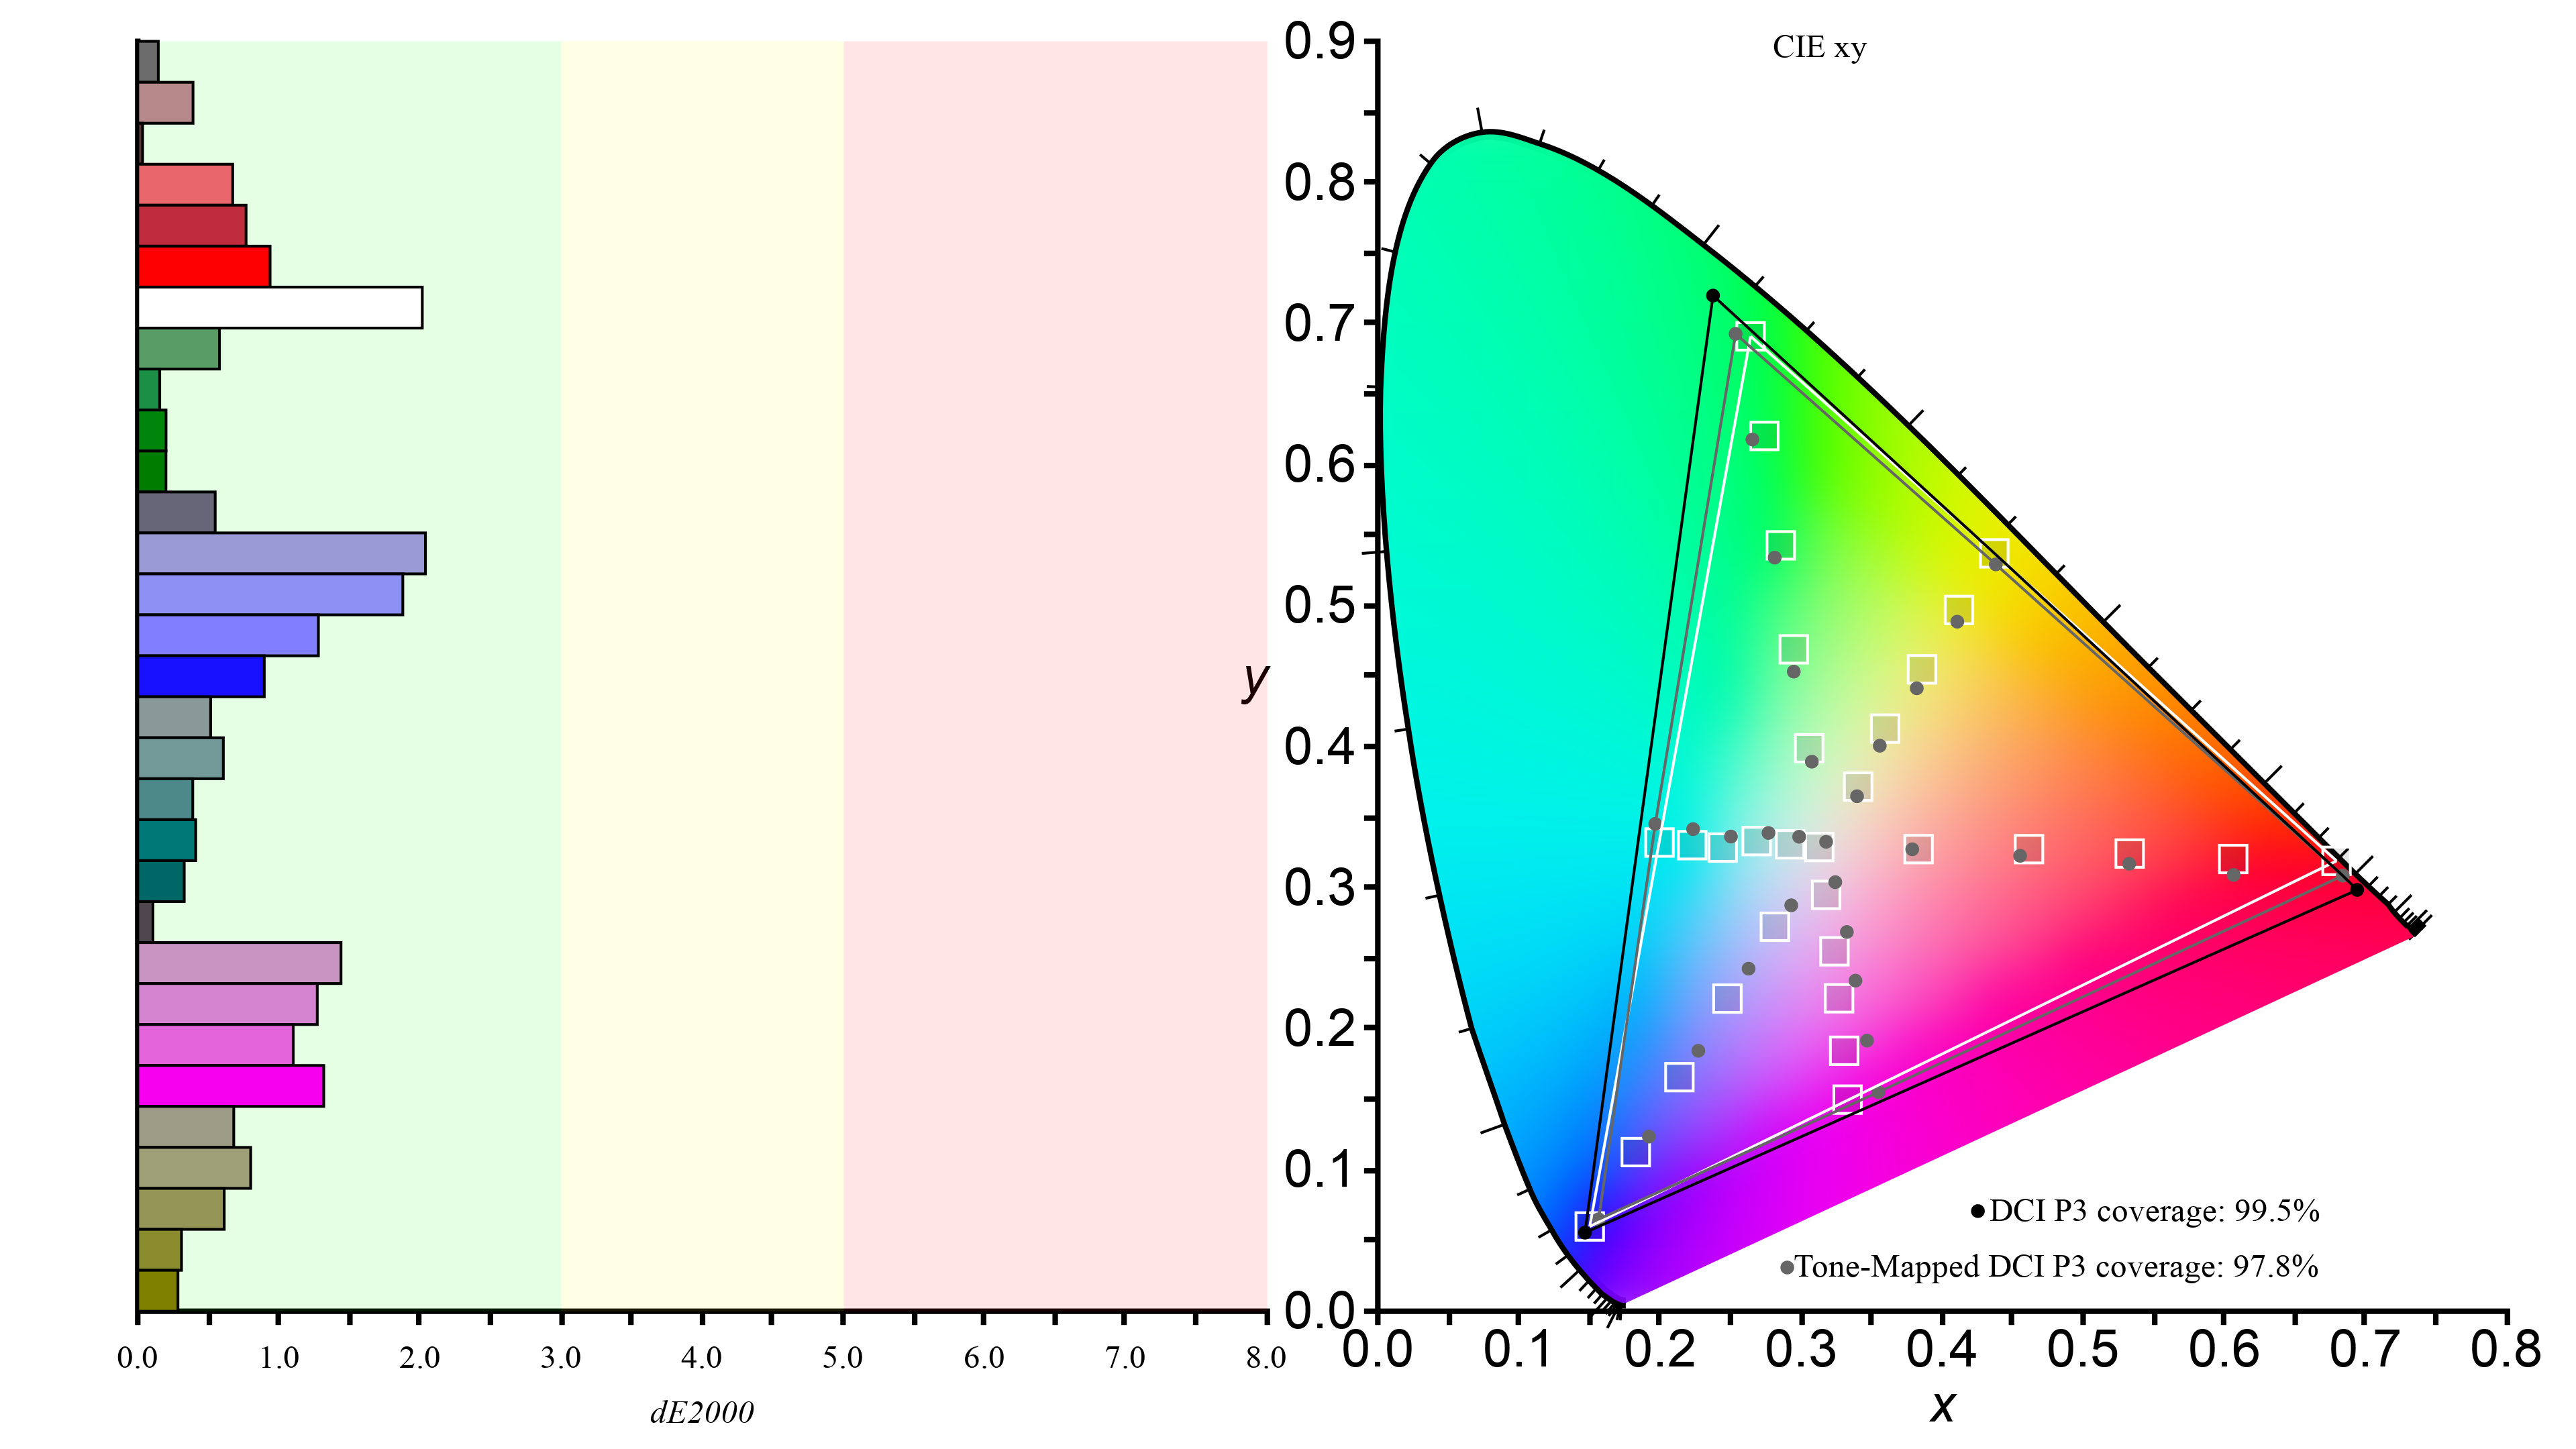
Tone-Mapped DCI-P3 Coverage
Another component of the graphs is the tone-mapped coverage. Tone mapping occurs when the display transforms the color gamut of the source material to match the capabilities of the display. If a monitor can't display bright, saturated colors for content that displays more colors than just the DCI-P3 color space, it needs to use tone mapping to properly display them while maintaining gradation and keeping details. A monitor with good tone mapping at least keeps details better than a monitor with worse tone mapping, which would lose those details.
Tone mapping is represented with the gray triangle in the color gamut, and there are gray dots that represent how the monitor displays each tested color versus an ideal display, which is represented with the white squares. Ideally, those gray squares are perfectly placed within those white squares.
Below, you can see two monitors with the same gamut coverage but different tone mapping. The monitor on the left really struggles to maintain details with accurate colors. The bar graph on the left also represents the deviation of each color versus an ideal display, so you can see that the monitor on the left is mainly inaccurate with red, blue, cyan, and white. Although we don't officially list the tone mapping coverage as a percentage in the review, you can still see them in the graphs.
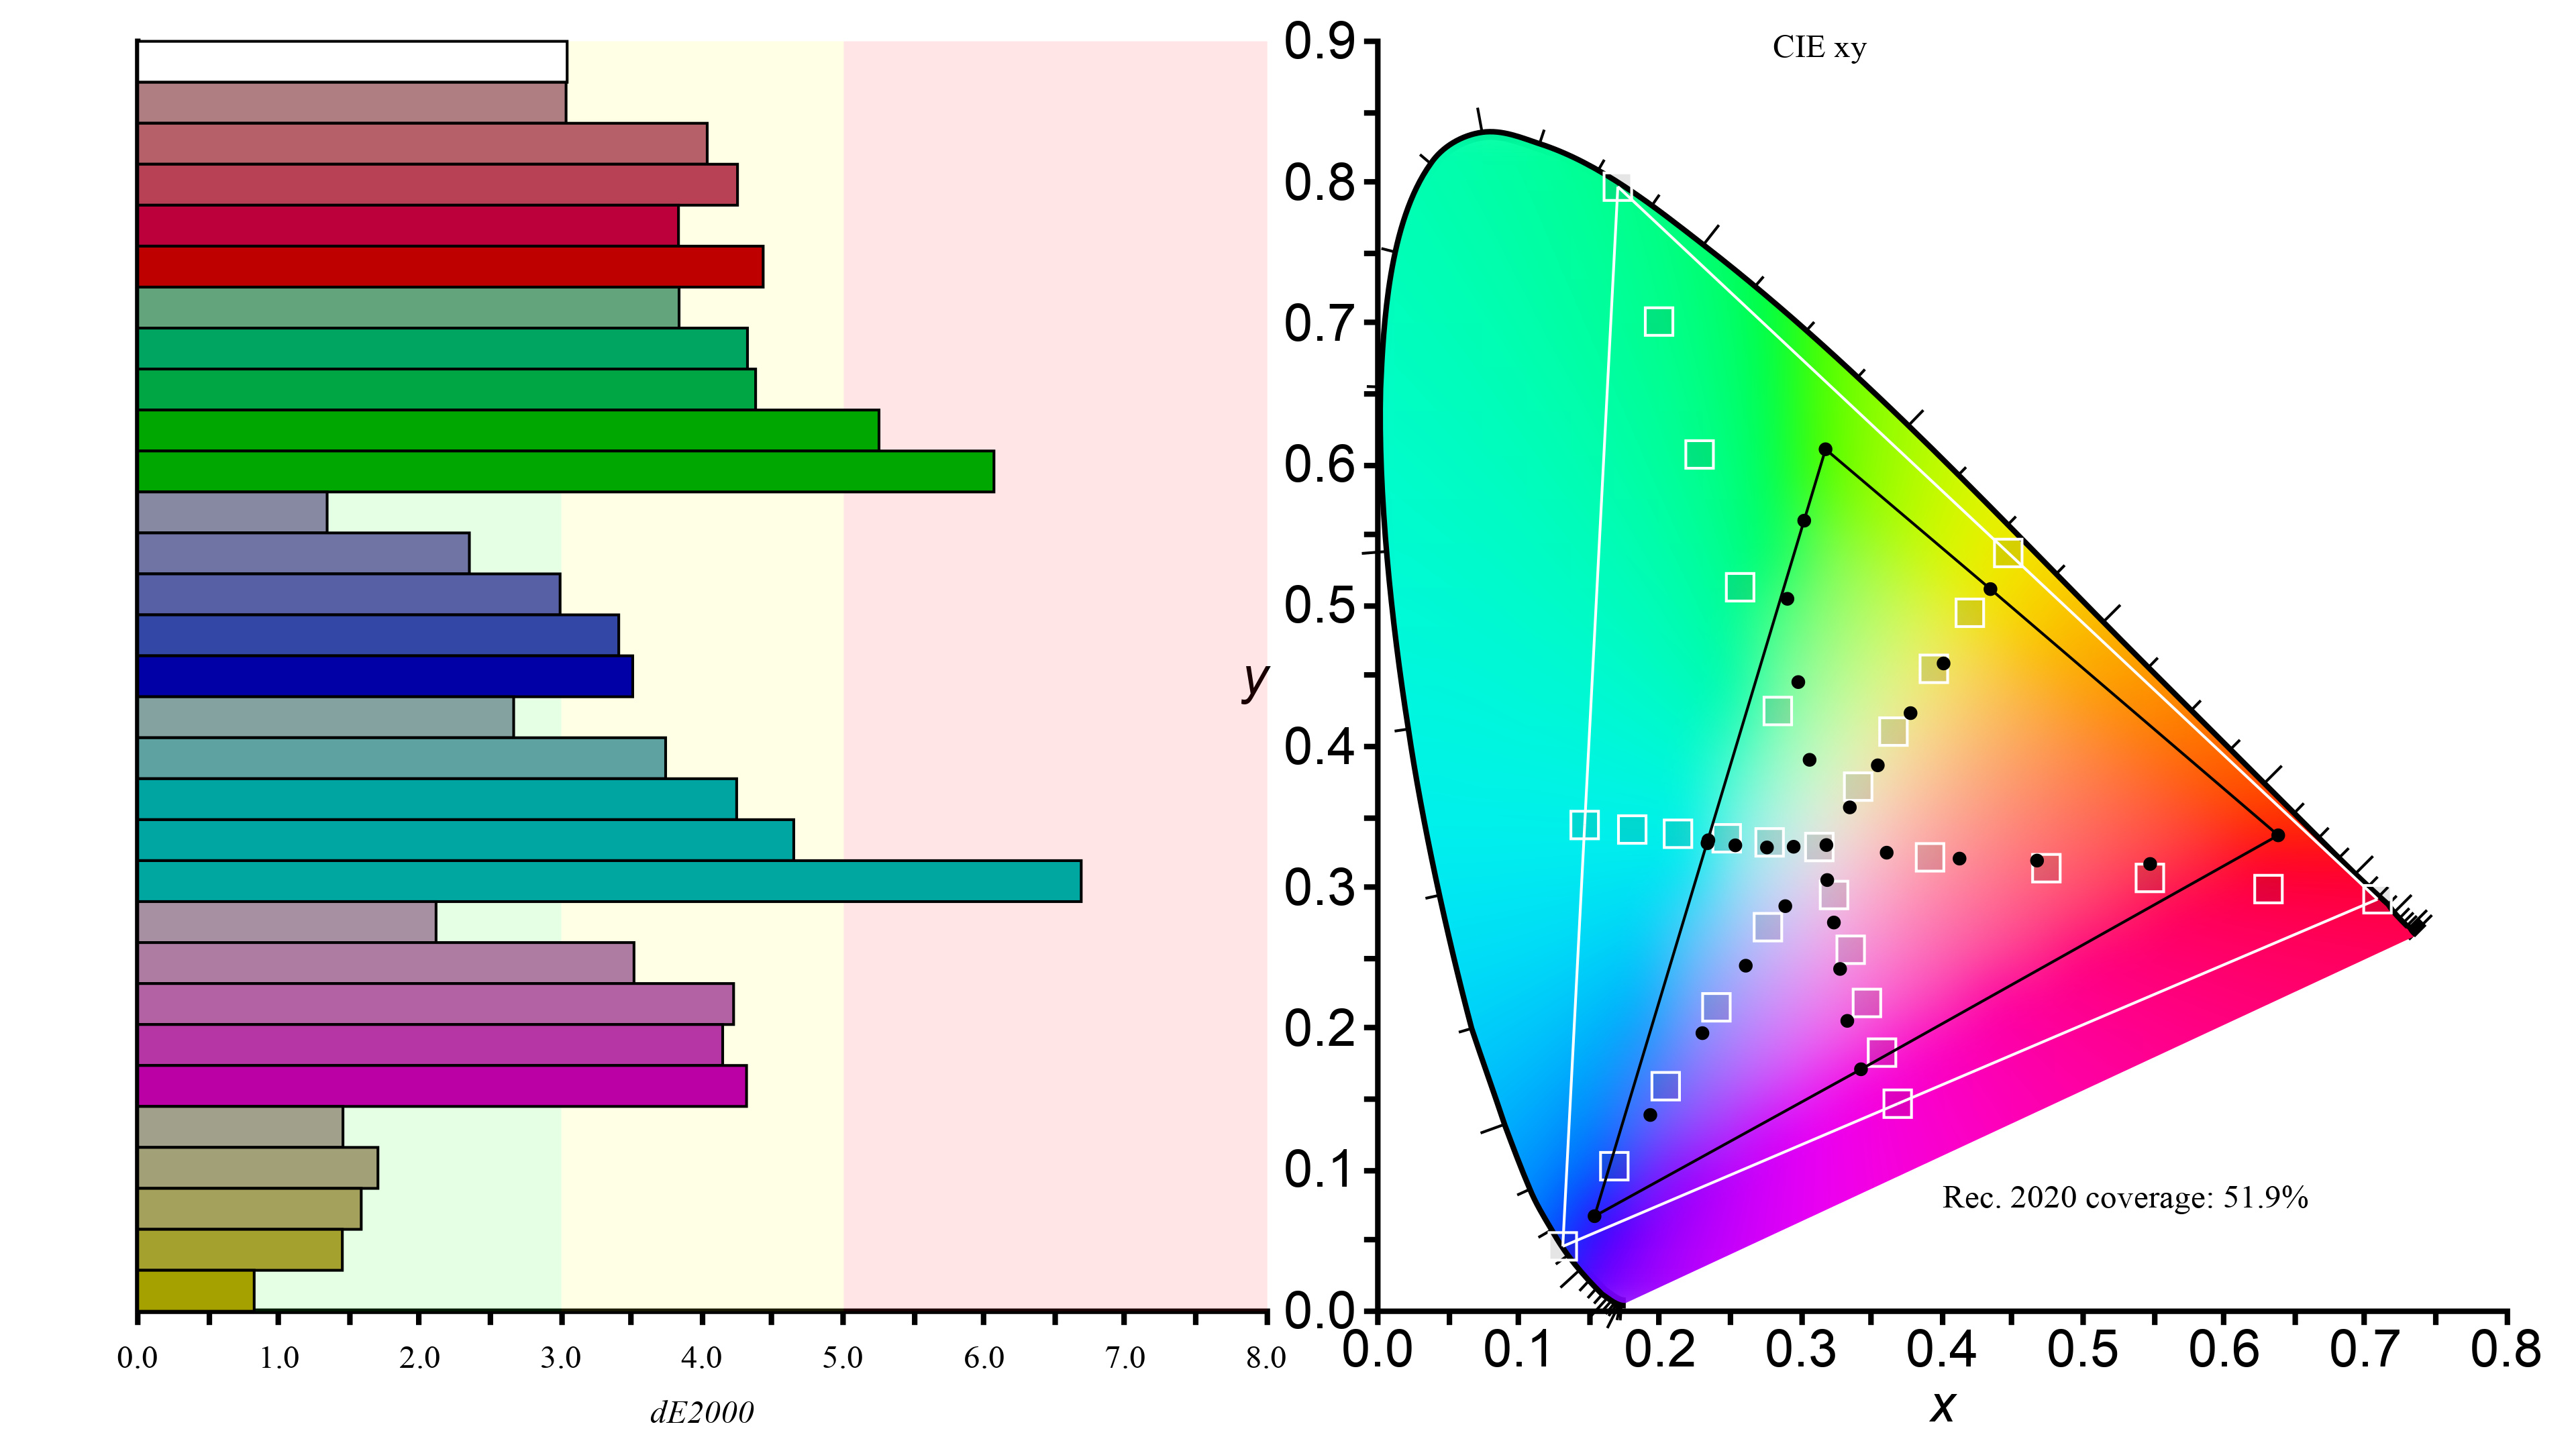
Rec. 2020 Coverage xy
We repeat the same testing in the Rec. 2020 color space, which is a wider color space that's slowly being used in more HDR content. Most monitors can't display as many colors in this color space as in the DCI-P3 color space.
The Rec. 2020 graph is presented the same way as in DCI-P3, with the white triangle as the ideal coverage and the black triangle as the measured color space of the monitor. Unlike in DCI-P3, we don't calculate the tone-mapped coverage, but you can still see how the monitor displays each color versus its target, and the bar graph on the left shows each color's standard deviation.
Wide Color Gamut
A monitor is considered to have a wide color gamut if it has more than 60% coverage in the Rec. 2020 color space. While it's more important to look at the individual test results for each color space, having this yes or no classification at least helps you determine whether a monitor has a wide enough color gamut for most HDR content.
Additional Information
Color Gamut VS Color Volume
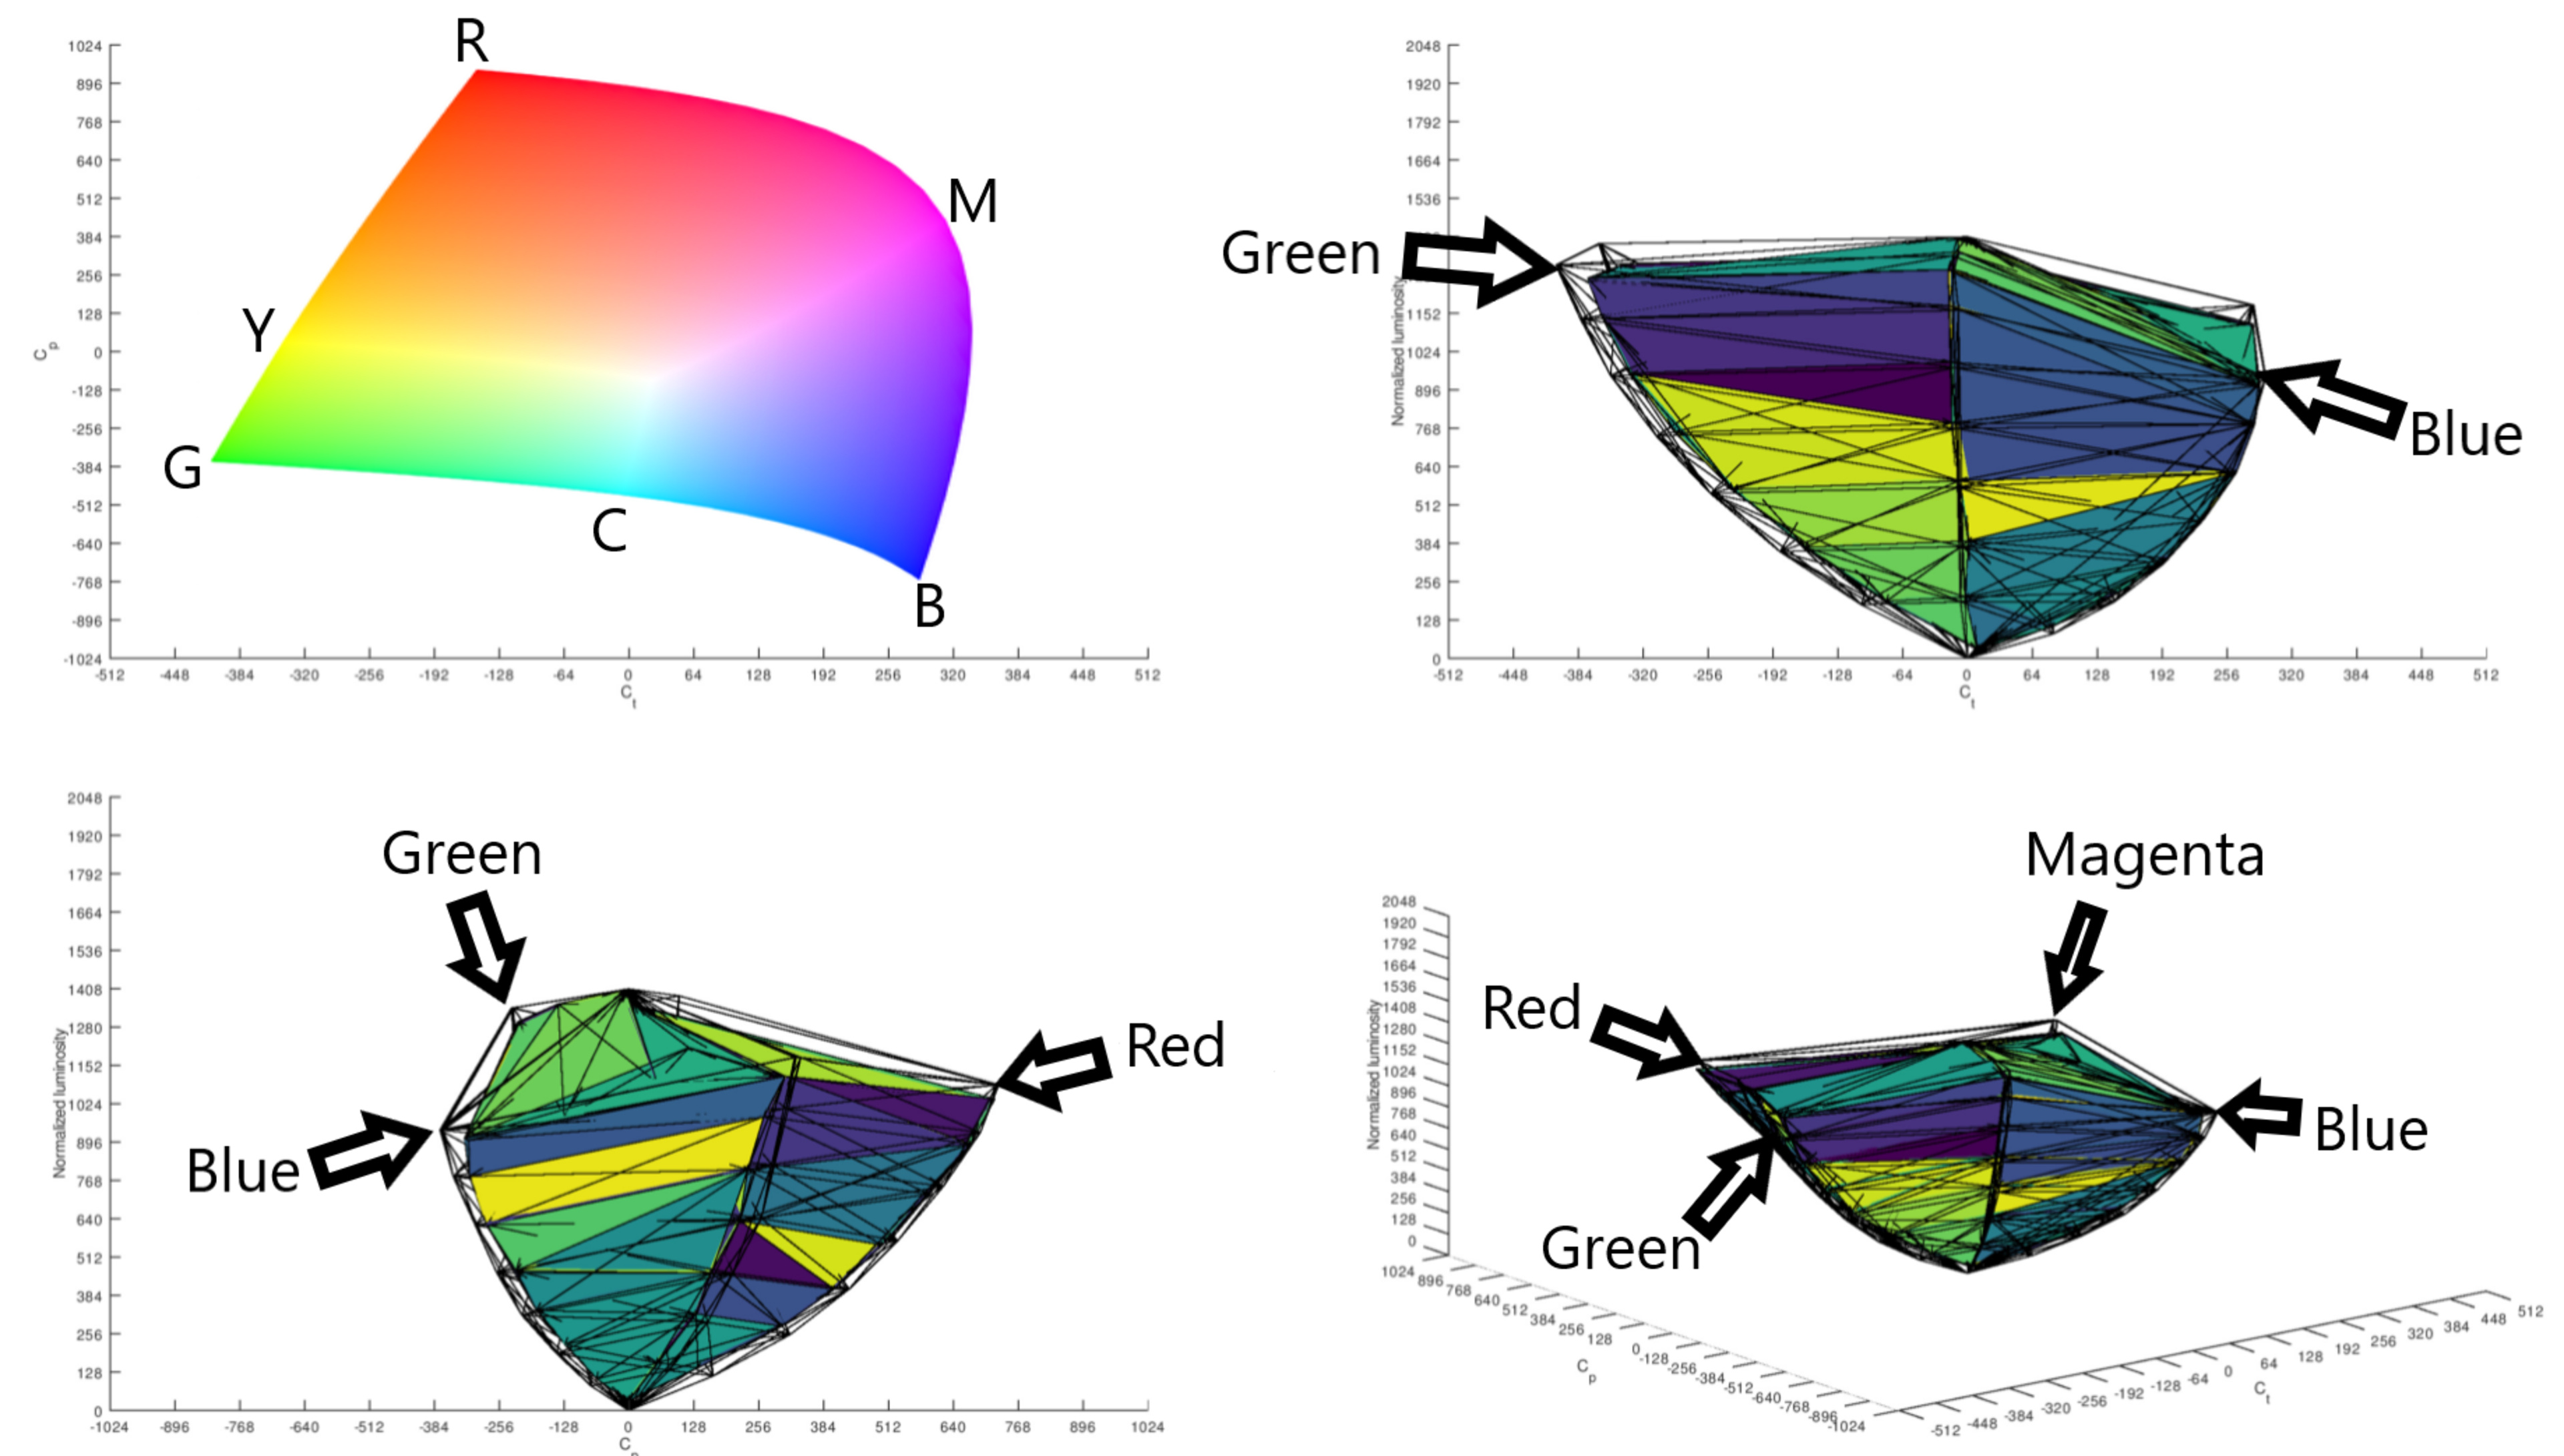
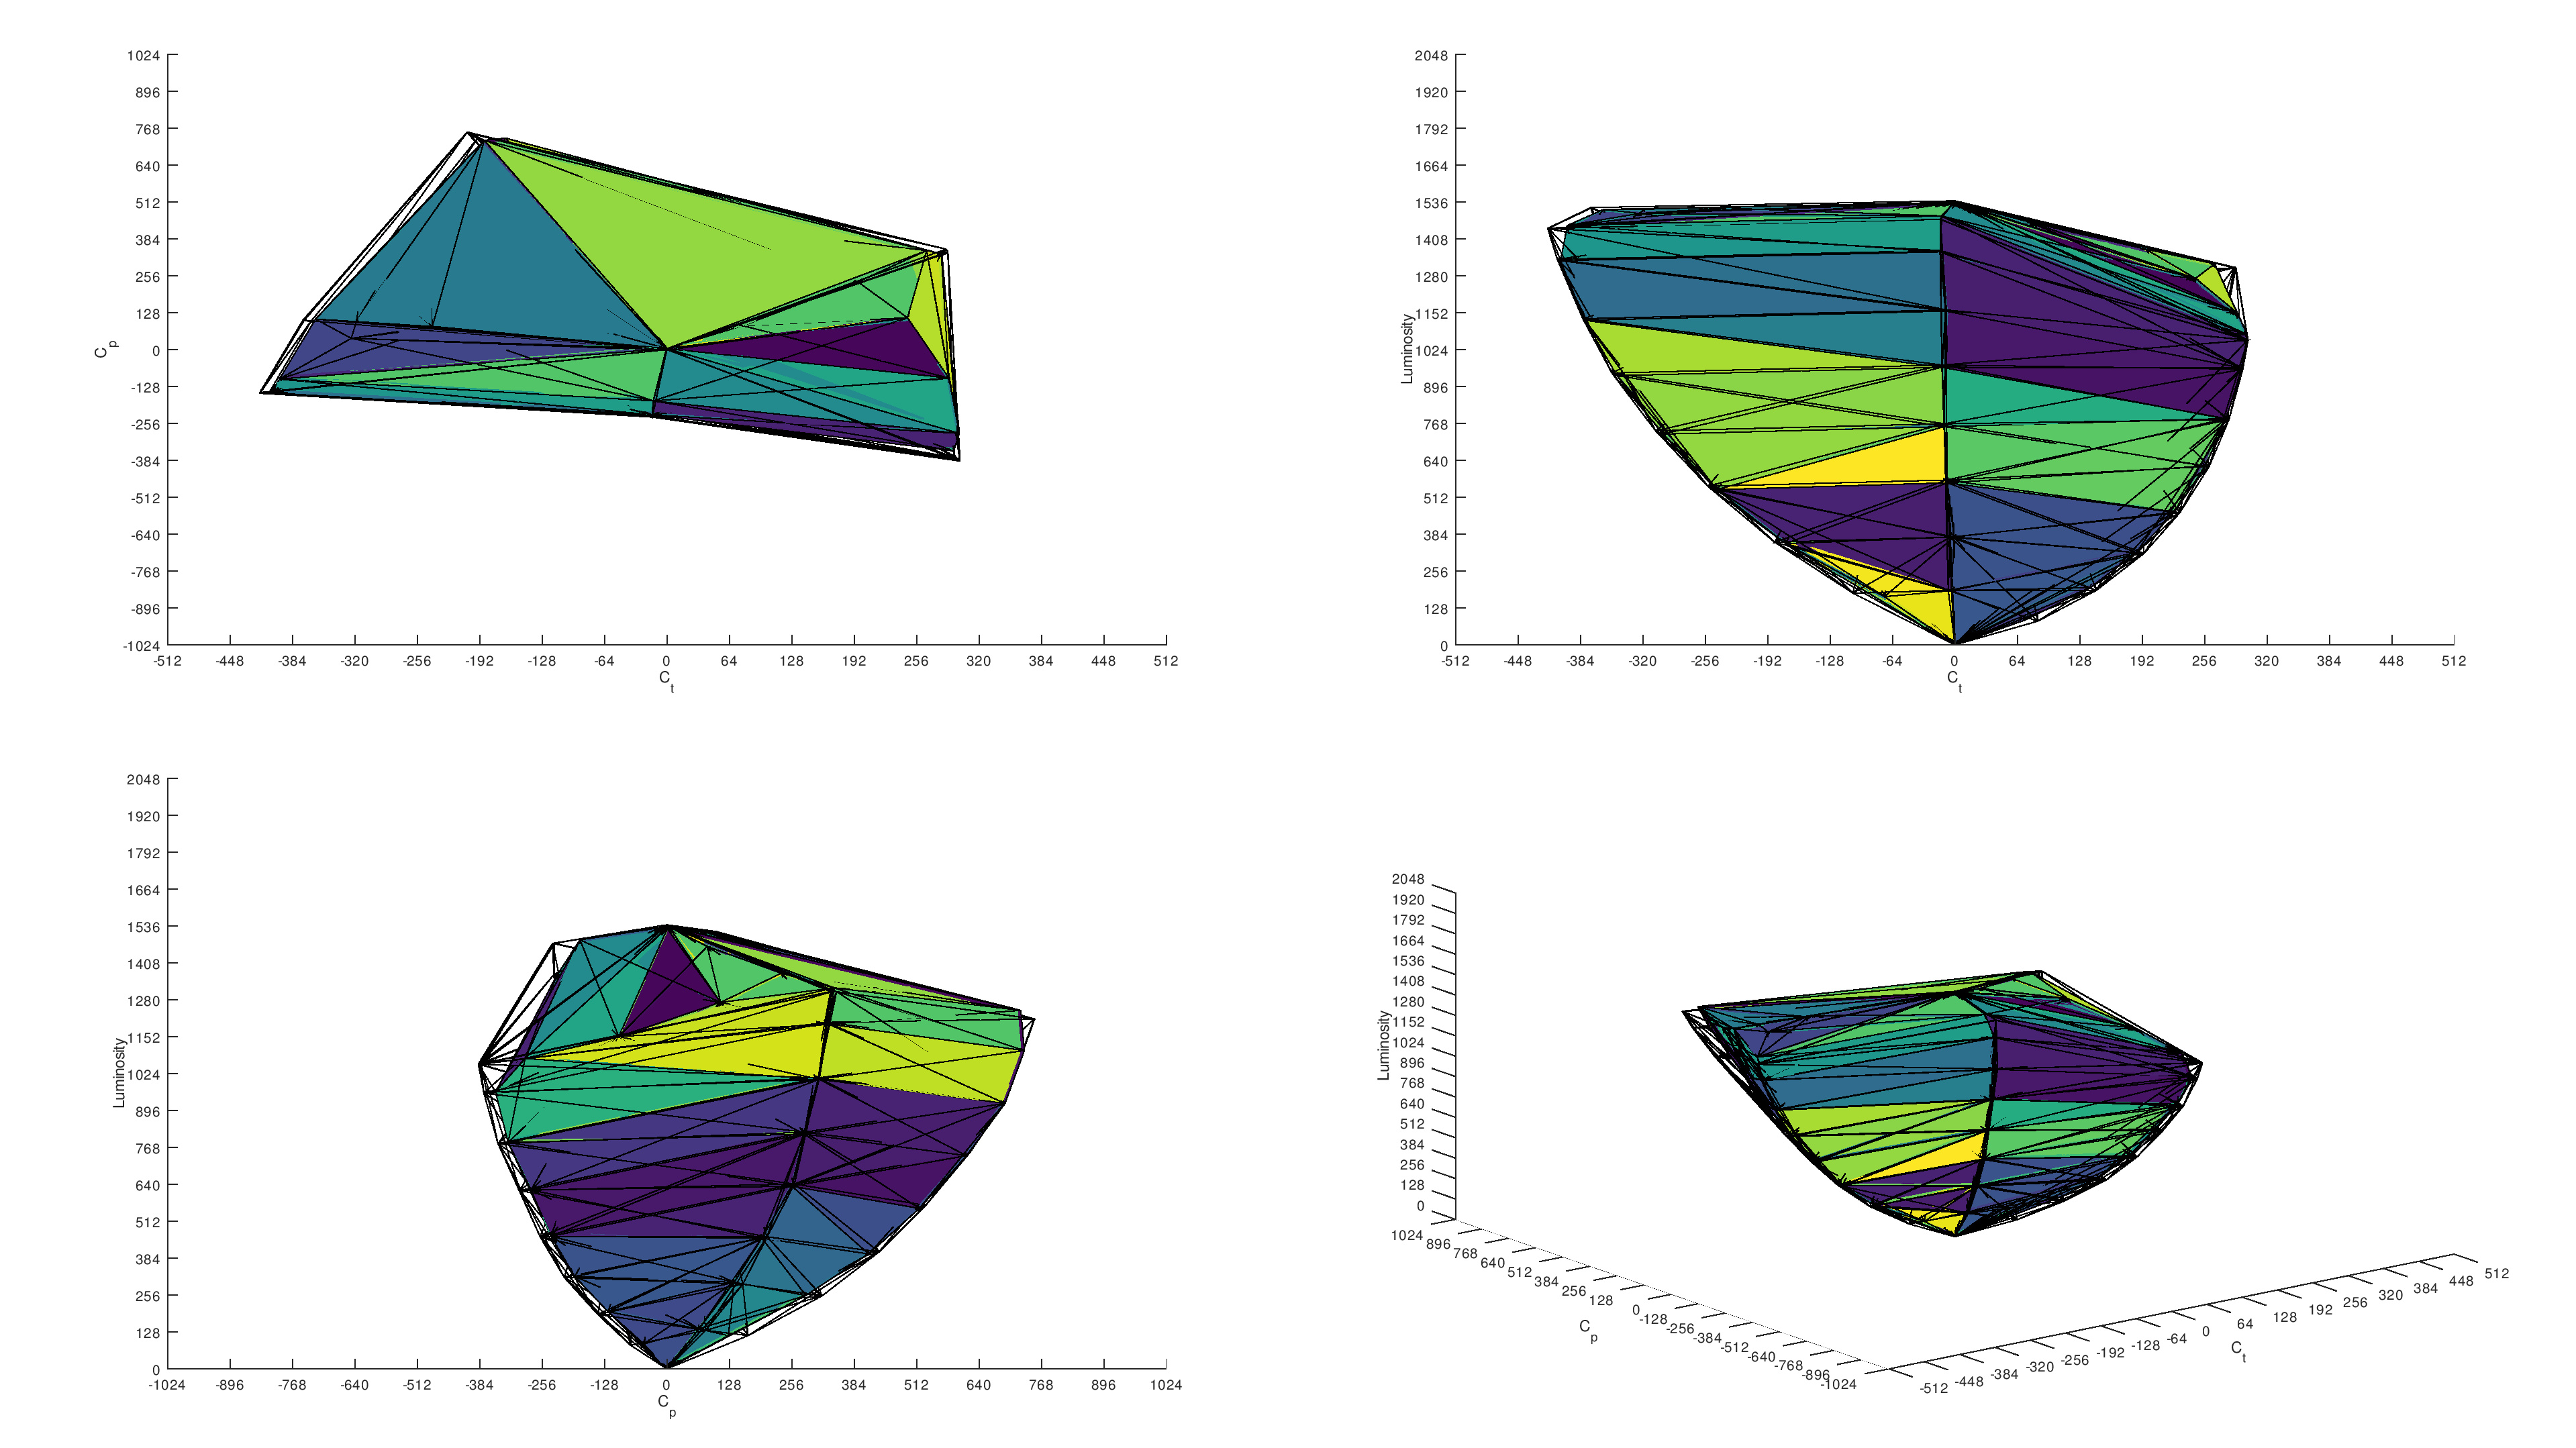
Another way we measure a monitor's HDR performance is with its color volume. This is related to the color gamut because it represents the amount of colors a monitor displays, but it instead shows at which brightness levels it can display those colors. Looking at the color volume bubbles below, these are a representation of colors from dark shades to bright shades, and a color gamut is simply the range of colors at a certain level of the bubble (think of the color gamut as a slice of cheese in your color volume sandwich). Understanding what the color volume bubbles represent can be challenging, but you can see a diagram explaining them here.
We measure the color gamut with a 75% stimulus, which is the slice of the color volume bubble at 75% of its luminosity axis, which you can see in the top right and bottom graphs. Having both a good color gamut and color volume is important for watching HDR content so that images look realistic with colors that are vivid.
How To Get The Best Results
While there's no way to physically improve the color gamut of your display, using certain picture modes can help it display a wider range of colors accurately. In each review, we identify which picture mode we used for testing, which tends to be the most accurate mode, so you can use this as a baseline. However, choosing the best picture mode for your needs is entirely personal, so you should choose another mode if you don't like the colors in our suggested picture mode. Some monitors have vivid picture modes that increase brightness and oversaturate colors at the cost of image accuracy, so this can be a good choice if you don't mind that trade-off.
Benefits Of Quantum Dot Displays
If you truly care about getting a monitor with a wide color gamut, it's worth getting a monitor that uses quantum dot technology. You can either find these as LED-backlit monitors, also known as QLED, or QD-OLEDs, which are increasing in popularity with monitors. They include a quantum dot layer in their panel, increasing their color gamut versus non-quantum displays for a more realistic image. While you can find more of these displays with TVs than with monitors, many high-end monitors are starting to include this technology, so it's important to know that you'd just have to pay a bit more if you want that. Examples include the QLED Samsung Odyssey Neo G8 S32BG85 and the QD-OLED Dell Alienware AW3225QF.
You can learn more about QLED vs OLED vs LED in TVs here.
Conclusion
The HDR color gamut on monitors defines how many colors it displays. We measure this in the DCI-P3 color space that's commonly used in most HDR content and in the wider Rec. 2020 color space. We then calculate the coverage as a percentage of the entire gamut, and we also publish graphs so that you can see how accurate colors are. Having a monitor with good gamut coverage is important for any type of HDR content, as it means it displays the wide range of colors that HDR content needs. Monitors with quantum dot filters, like QLEDs and QD-OLEDs, tend to have the widest color gamuts and are the best options if this is important for your use.