- 4.0%sRGB Gamut Area xy
- 3.0%White Balance dE (Avg.)
- 3.0%Color dE (Avg.)
Color accuracy defines how well a monitor can reproduce colors and shades as intended. Having an accurate monitor is also important for any sort of content creation, like photo or video editing. Most people won't notice slightly inaccurate colors, but it's distracting when colors are very inaccurate. You could have the best-performing monitor with the latest features, but if the color accuracy is off, you won't see content the way it should be seen.
We measure color accuracy on a monitor twice: once pre-calibration, only changing a few settings, and a second time after a full calibration. Since full calibrations could cost a lot, it's important to get a monitor with great out-of-the-box color accuracy if you're using it for color-sensitive work like photo editing.
If you're looking for a specific monitor, check out our recommendations for the best monitors for photo editing, the best monitors for video editing, and the best monitors for graphic design.
Test results
Test Methodology Coverage
We've measured Color Accuracy since our initial Test Bench 1.0 in October 2017. However, tests and scores were changed as of Test Bench 1.2 in April 2022, so scores and results are only comparable on Test Benches 1.2 and newer. Learn more about how our test benches and scoring system work.
| Tests | 1.0 | 1.1 | 1.2 and newer |
|---|---|---|---|
| Picture Mode | ✅ | ✅ | ✅ |
| sRGB Gamut Area xy | ❌ | ❌ | ✅ |
| White Balance dE | ✅ | ✅ | ✅ |
| Color Temperature | ✅ | ✅ | ✅ |
| Gamma | ✅ | ✅ | ✅ |
| Color dE | ✅ | ✅ | ✅ |
| Measured Brightness | ✅ | ✅ | ✅ |
| Brightness Locked | ❌ | ❌ | ✅ |
| RGB/Gamma/Brightness Settings | ✅ | ✅ | ✅ |
| ICC Profile | ❌ | ❌ | ✅ |
When It Matters
Color accuracy is important for pretty much any type of content, as inaccurate images can be distracting. While most people won't notice slight inaccuracies, it's easier to see them if you're a content creator that requires accurate colors, meaning the level of tolerance changes from person to person. Having an accurate monitor without any sort of calibration is also important if you don't want to pay for a full calibration. However, most monitors are extremely accurate with a full calibration, so the differences between monitors are harder to tell.
 |
 |
Our Tests
We measure a monitor's accuracy twice: before and after a full calibration. We don't measure the accuracy straight out of the box, but instead, we change a few settings and measure the different picture modes to see which one is the most accurate. We use a Colorimetry CR-100 Colorimeter connected to a PC with the CalMAN software installed, which automatically measures the accuracy of different picture modes. Then, we publish the suggested picture mode that's the most accurate according to the sRGB color space. If a monitor has an sRGB mode, we'll use that as the suggested picture mode unless it's extremely inaccurate and worse than other modes.
We don't only measure the color accuracy, but we measure the white balance, gamma, and color temperature, all of which have an important effect on the overall accuracy. We also publish which settings were used and at what brightness we measured the display.
Picture Mode (Pre-Calibration)
Although we measure the accuracy of all the available picture modes a monitor has, we only publish the results from our recommended one. This is the one that provides the best accuracy according to the sRGB color space. For monitors that have a dedicated sRGB mode, we usually recommend it, but there are some cases where the sRGB mode is less accurate than another mode.
The exact names of the modes differ from brand to brand. However, we don't use the same mode across models from the same brand, and we simply choose the most accurate one for that model.
sRGB Gamut Area xy
> 90%
< 110%
The sRGB color space is the most common color space used in most web content, and it's the standard to which we measure the accuracy. It's one of the more basic color spaces and isn't nearly as wide as others, meaning it's easier to reach full coverage. However, some monitors do this by oversaturating their colors past the limits, which can be noticeable if you're working in the sRGB color space and want the most accurate monitor possible.
We measure the sRGB gamut area coverage as a percentage. The ideal monitor has 100% coverage, while one that oversaturates its colors has a percentage higher than 100. Some monitors undersaturate colors instead, meaning they cover less of the color space than required.
Below you can see two examples of monitors that undersaturate (left) and oversaturate (right) the sRGB color space. To read the graph, you can look at the squares that represent the ideal value and compare them to the colored dots, which is the measured value. The sRGB color space is the triangle between the squares, so any dot past that means it oversaturates colors.
| 92.5% sRGB Gamut Coverage | 155.0% sRGB Gamut Coverage |
|---|---|
 |
 |
White Balance dE
White balance dE defines how well a monitor can display different shades of gray, which range from white to black. We test 17 different shades of gray, from 0% (black) to 100% gray (white) at increments of about 6%, and the CalMAN software automatically calculates the average standard deviation (dE) between the different shades. The lower the dE, the better.
In the grayscales below, you can see what a bad white balance dE (left) looks like versus a good one (right). The picture on the left has visible red banding in the 70% and 80% shades of gray, and this affects the overall picture quality.
 |
 |
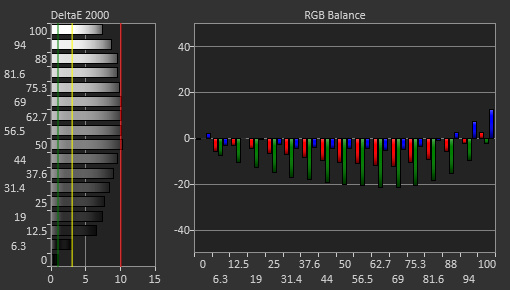
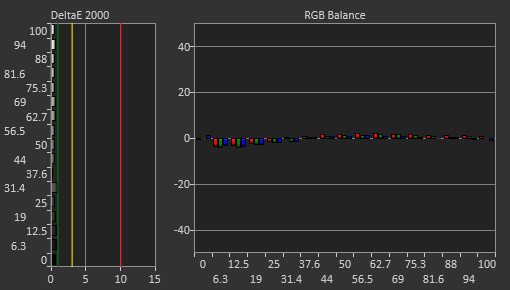
We also include a graph of the white balance so you can see the detailed results for each shade of gray. The bars on the left represent the dE of each shade of gray, with bigger bars meaning worse. On the graph on the right, you can see where the white balance is off. Because white is made of red, green, and blue subpixels on all at the same time, this measurement is to show which color the monitor is displaying the most. For the monitor on the left below, it's not showing enough green for each shade of gray.
| White Balance dE: 8.58 | White Balance dE: 0.59 |
|---|---|
 |
 |
Color Temperature
A monitor's color temperature tells us how cool or warm the image is. A warm color temperature results in a red tint, while a cold temperature has a blue tint. The target for this test is 6500 K, and anything above is too cold, while anything below is too hot. However, most people don't notice a difference until it's about 400 K above or below the target.
While we don't have an exact graph to show the color temperature, you can see the effects of the color temperature in the color gamut graph. If you look at the monitor on the left that has a warm color temperature, you can see that most colors are shifted towards red. It's the opposite with the monitor on the right, as most colors shift towards blue.
| 5,681 K Color Temperature | 8,063 K Color Temperature |
|---|---|
 |
 |
Gamma
Gamma is the brightness of an image within different shades. This is different from the luminosity/brightness of the monitor, which doesn't impact color accuracy. Our test targets an sRGB curve, which has an average of 2.2, and when followed properly, scenes are displayed at their proper brightness. So that means if you're watching a video and there are shadows, you'll see those shadows as the creator intended. If it's too dark, you might not see details in those shadows. If it's too bright, details will be overbrightened.
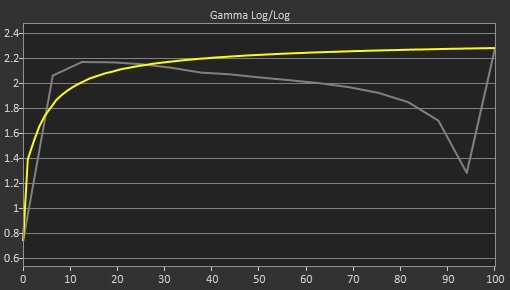
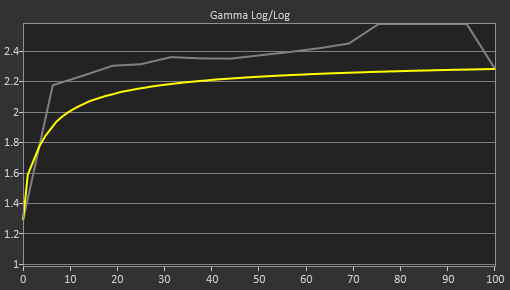
The gamma graph is easy to read as the yellow line represents the sRGB curve, and the gray line is the monitor's gamma. The x-axis at the bottom is the shades from dark to bright. Having the monitor being above the gamma means it's too dark, and below the target means the image is too bright. The final value in the review is an average over the entire gamma curve, and the ideal value is 2.2. While some monitors can have a value of exactly 2.2, it doesn't mean they follow the target perfectly over the entire curve.
With the monitors below, the one on the left is too bright for most content, particularly midtones and bright scenes. As for the monitor on the right, all content is too dark.
| Gamma: 1.96 | Gamma: 2.44 |
|---|---|
 |
 |
Color dE
The color dE is similar to the white balance dE, but instead of measuring shades of gray, it measures different colors within the sRGB color space. We measure to see how accurately it displays these colors at a 75% stimulus at points of 20%, 40%, 60%, 80%, 95%, and 100% saturation for each color. The final dE is the average of all inaccuracies at different points.
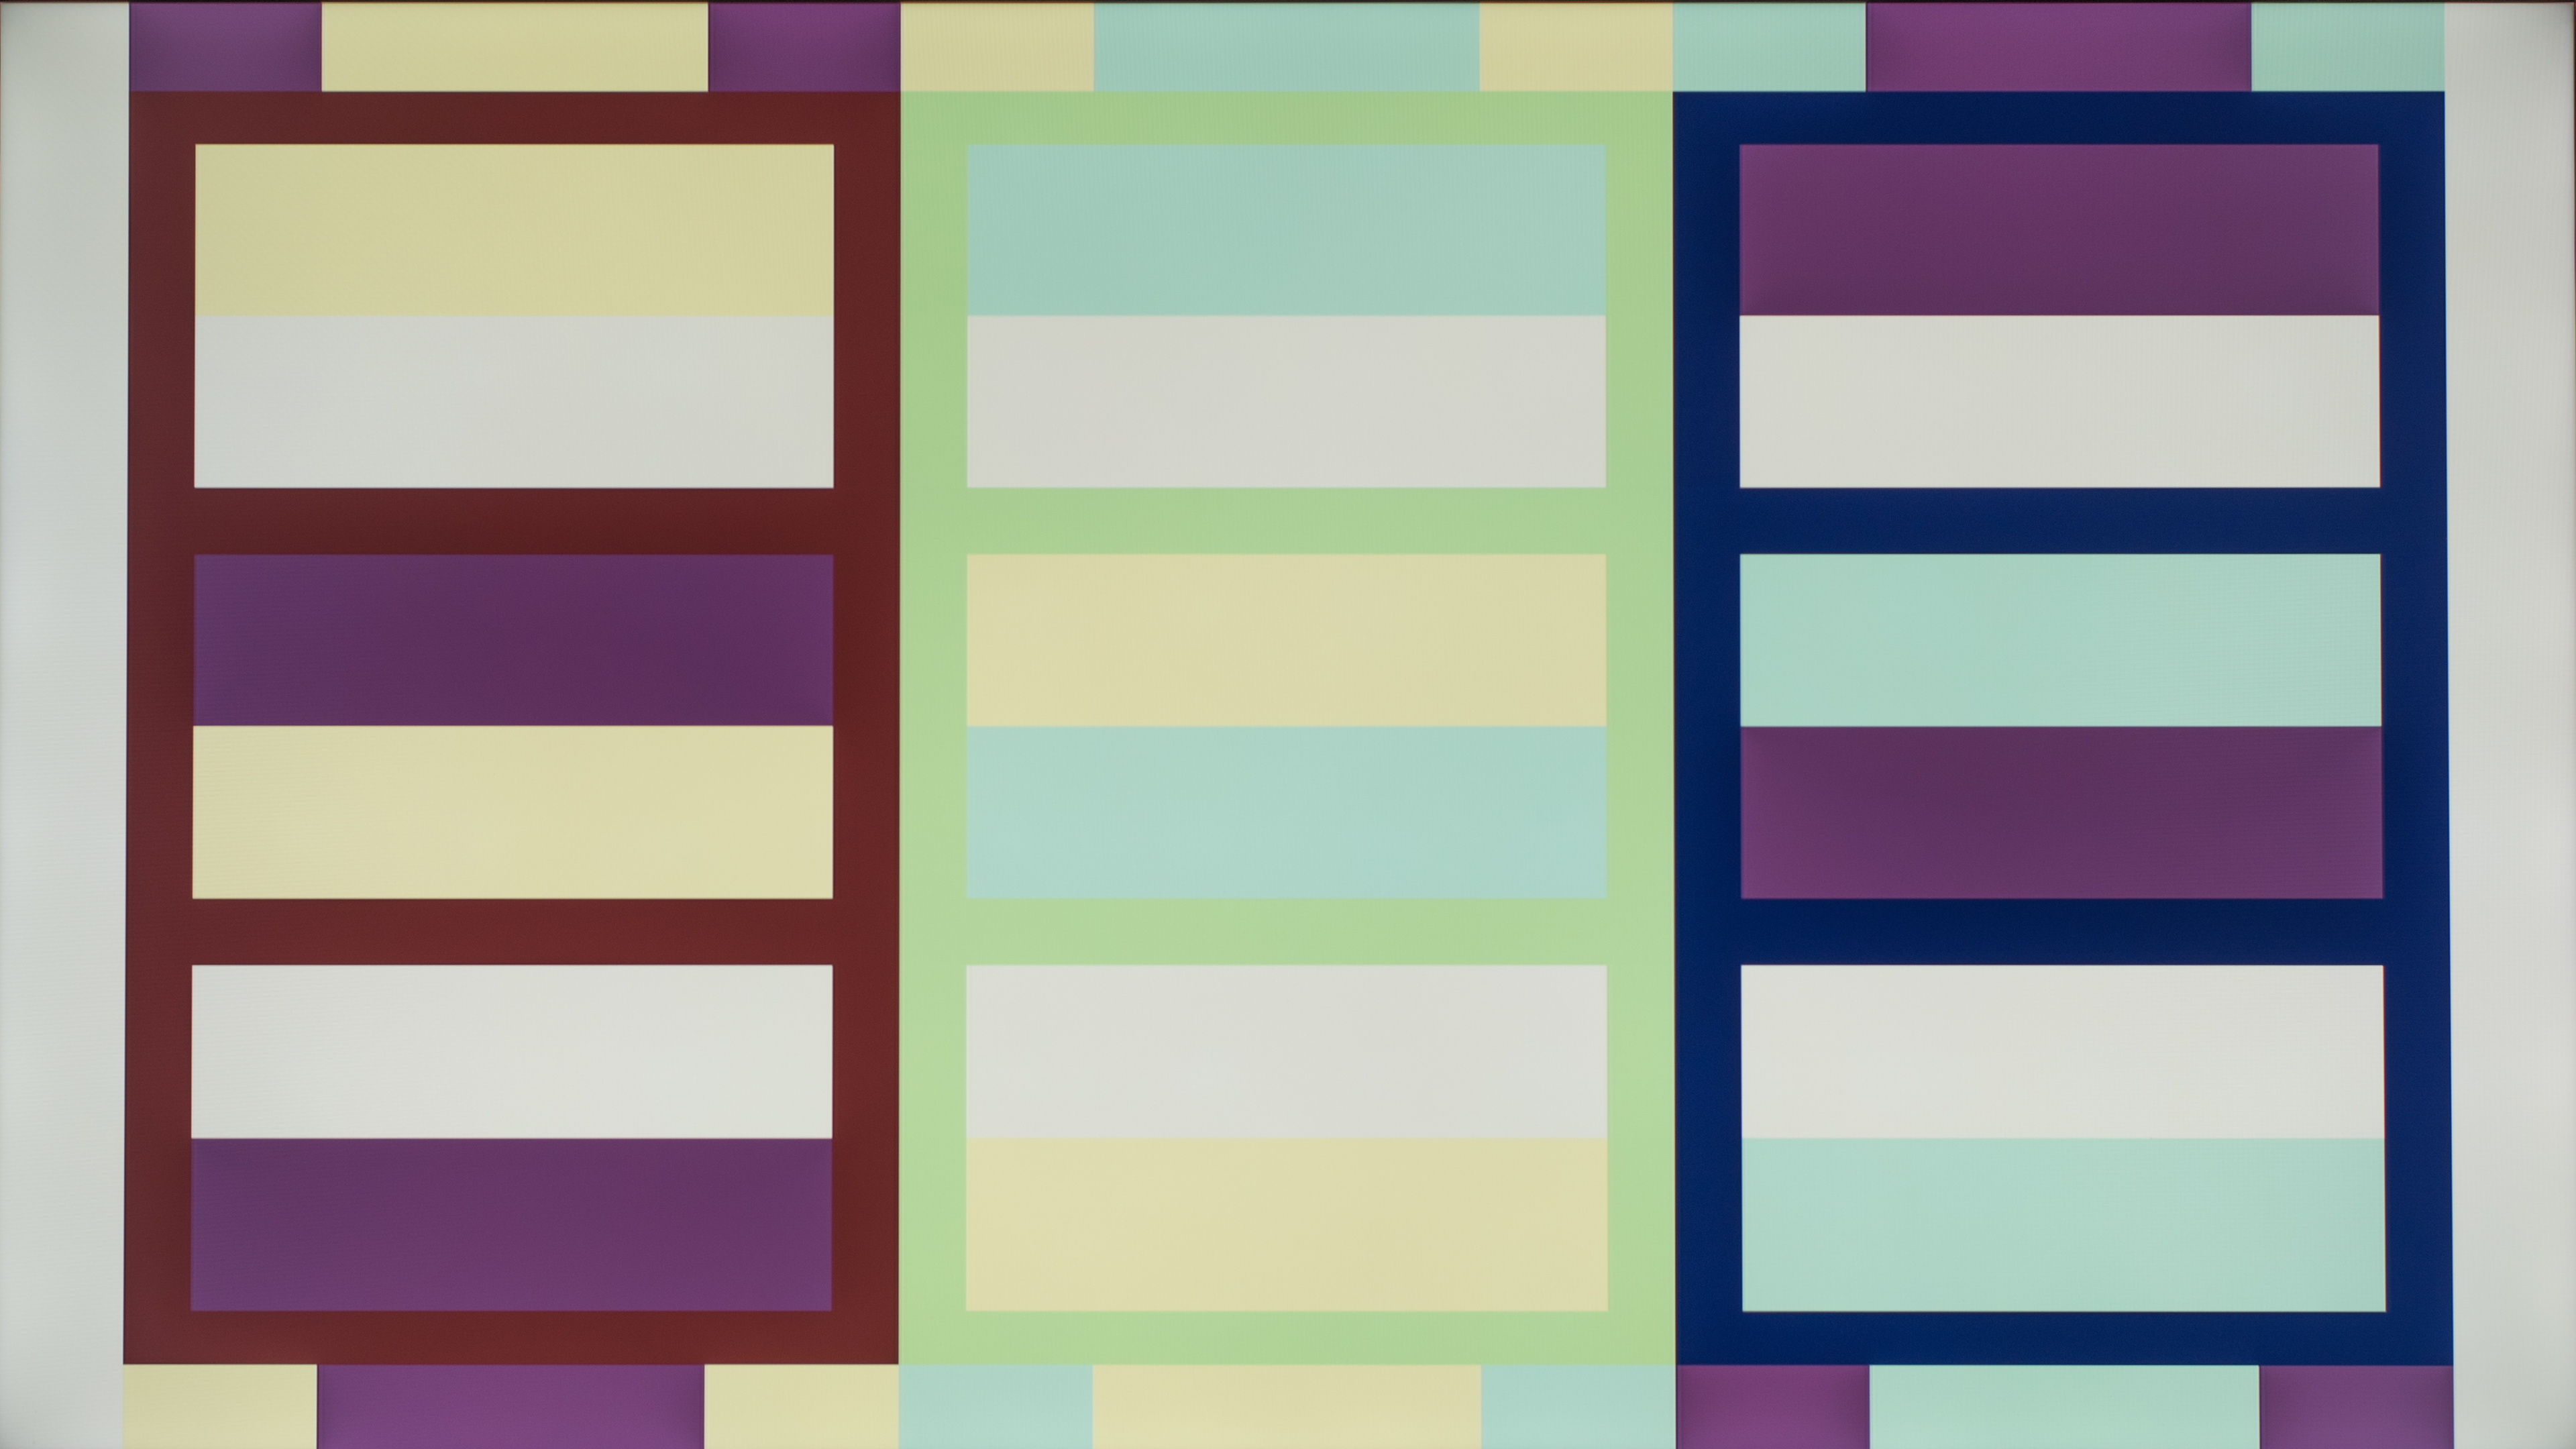
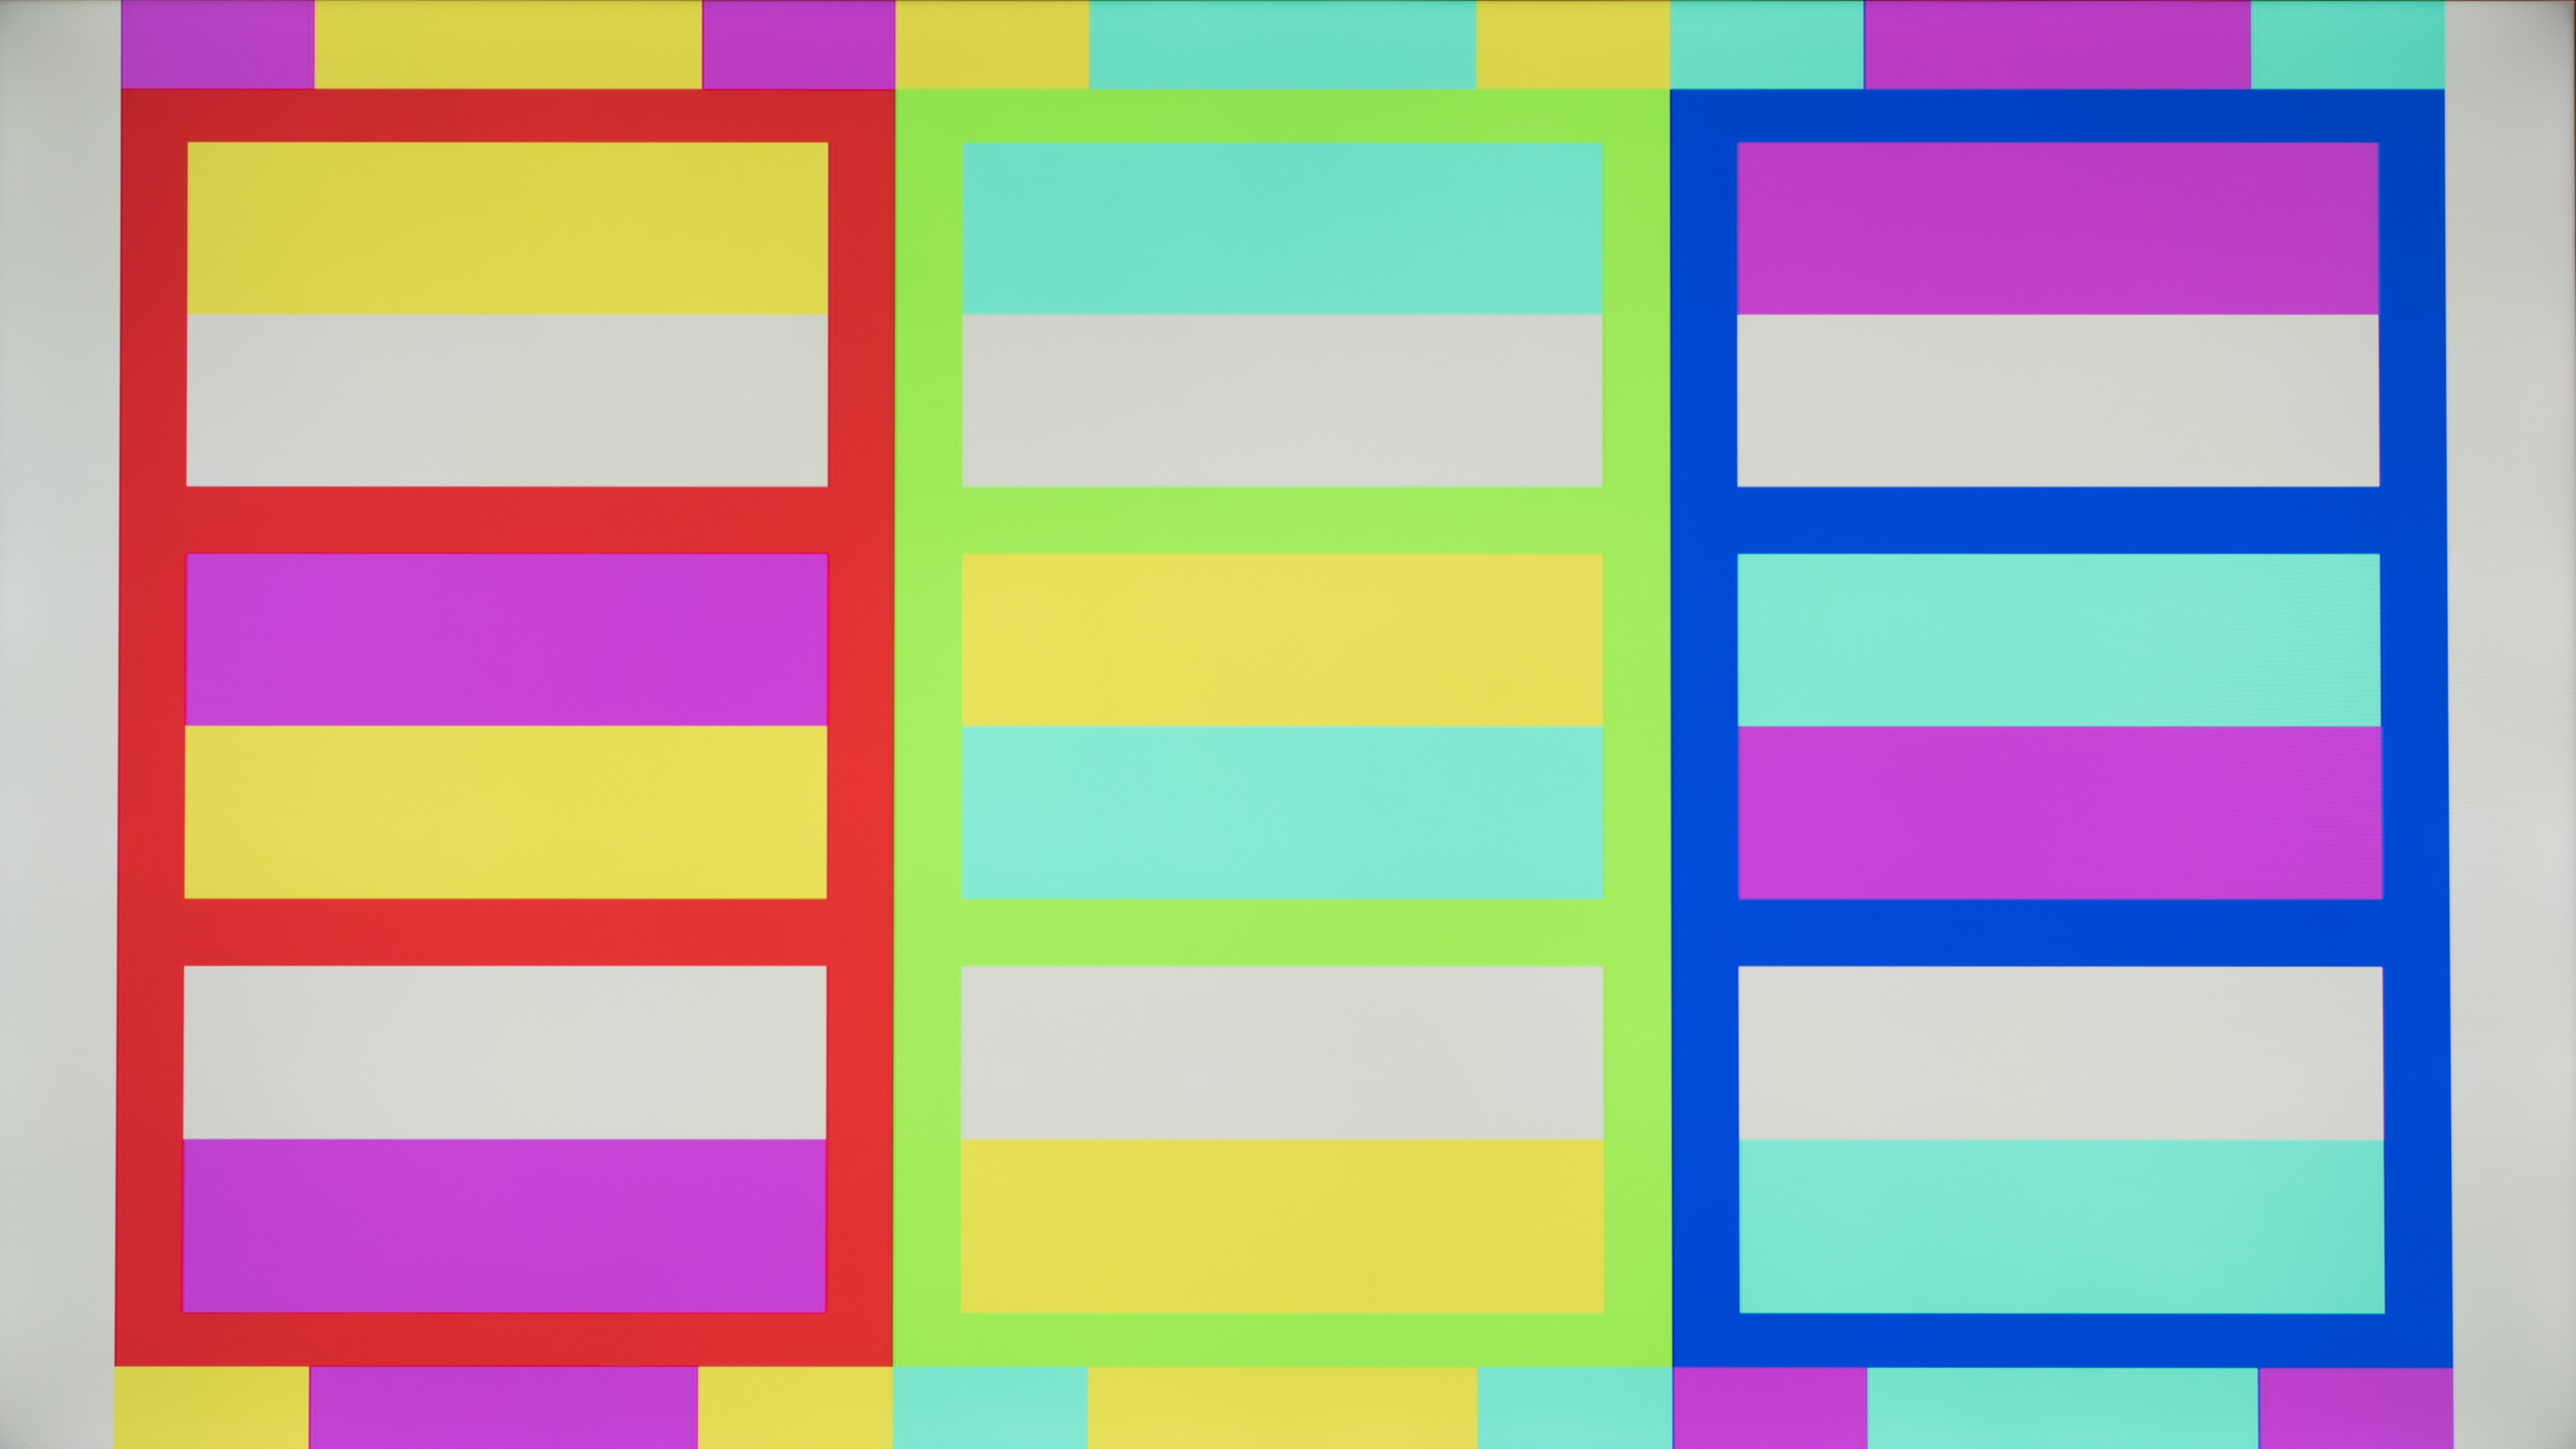
In the graphs below, the target value for each color is represented by the square within the sRGB color space, and the dot represents the color that the monitor actually displays. You can also see the dE of each individual color with the bars on the left side. Having bad color accuracy can also mean it has a bad color temperature and oversaturated colors, as they're all connected. You can see that's the case with the monitor on the left below, while the one on the right displays colors nearly perfectly, and the color temperature, white balance, and gamut coverage on that monitor are also all nearly perfect.
| Color dE: 5.63 | Color dE: 0.42 |
|---|---|
 |
 |
Measured Brightness
We measure the brightness of the display during our pre-calibration and post-calibration measurements to show how bright it is in the most accurate picture mode. We aim for a brightness of 100 cd/m2 during the calibration process. While this value isn't important for most monitors as you can adjust the brightness, which doesn't affect the overall picture quality, there are some monitors whose brightness setting is locked in the sRGB picture mode. In that case, it's important to know the brightness of the display in sRGB so that when you're using the mode, you know exactly how bright it is.
Brightness Locked
As mentioned, some monitors with an sRGB picture mode disable the brightness setting when in sRGB. We include whether or not you can adjust the setting.
Tested Settings
The accuracy isn't exactly measured right when we take it out of the box, but rather, we change a few settings. Most of the settings are left at their default, but some need changing. The settings in the pre-calibration box are meant as a reference for the settings used in the post-calibration box, so you can see how much was needed to change for an accurate image.
- Contrast setting: The contrast setting changes the level of the whites, which could help brighten an image. Most of the time, it's left at its default.
- RGB Setting: With some monitors, you can change the individual values of the Red, Green, and Blue colors if you find that the colors are off. We normally leave it at the default for the pre-calibration measurement but change it for the calibration.
- Gamma Setting: Some monitors have different gamma settings, so we set it at the setting that should follow the sRGB target the most. You can adjust this setting to your liking if you don't like the target.
- Brightness Setting: This setting is which brightness setting the monitor was tested on.
Post-Calibration
- 4.0%sRGB Gamut Area xy
- 3.0%White Balance dE (Avg.)
- 3.0%Color dE (Avg.)
We fully calibrate the monitor using CalMAN, and we repeat the testing process as from before calibration. We measure the color dE, white balance dE, gamma, and color temperature after a full calibration to the 6500K white point. This shows you how accurate the colors are after a full calibration, but most monitors more or less have the same results here, and full calibrations can be costly.
During calibration, we adjust the settings until we find the best image possible. However, we try to avoid making extreme changes because it could affect something else, like changing the white balance too much might hurt the color accuracy. We don't aim for the best results in the individual tests, but rather the best overall image. The same idea applies for adjusting colors or the white balance. We don't want to fix one shade of white if it means another shade is more inaccurate.
You'll see the same tests as in the pre-calibration box, so it's good to compare the different results and settings. However, we also include the ICC profile that CalMan generates. This profile is meant for our unit only, and because each unit requires different calibration values, we don't suggest you use it on your monitor, even if it's the same model.
Below you can see how a full calibration impacts the accuracy of the Dell Alienware AW2726DM.
 |
 |
Additional Information
One thing to remember is that accuracy can vary between units due to manufacturing tolerances. This means you may buy a monitor with different colors than ours. However, these differences are usually insignificant, and you'll only notice them if you measure the accuracy.
dE = 'Color Difference'
For the white balance and color tests, dE is a calculation in the difference from the displayed color versus the target. If there are no inaccuracies at all, the dE would be 0, but it's almost impossible to have no inaccuracy.
Not everyone is impacted by these inaccuracies the same way. We all see colors differently, and our eyes perceive differences in unique ways. The measurement doesn't tell you what exact color the monitor produces either; if it's supposed to display red but has a dE of 2, we don't know if it's closer to orange or pink. However, this test is an objective measurement to show how accurate and inaccurate certain monitors are.
You can see the table below to know when the differences in color, white balance, gamma, and color temperature become noticeable.
| Test | Imperfections unnoticeable | Noticeable to professionals | Noticeable to enthusiasts | Noticeable to everyone |
|---|---|---|---|---|
| Color dE | <1 | 1-3 | 3-5 | 5+ |
| White balance dE | <1 | 1-3 | 3-5 | 5+ |
| Gamma difference | <0.05 | 0.05-0.1 | 0.1-0.2 | 0.2+ |
| Color temperature difference | <100 K | 100-400 K | 400-1,000 K | 1000 K+ |
When To Use The SRGB Mode
While we tend to recommend using the sRGB picture mode for monitors that have one, you don't need to always use it. These modes usually lock out certain color settings, so if you want to have access to those settings, use another mode, even if it means it's less accurate. The sRGB picture mode is really ideal if you're a photo editor or content creator and you need to see the most accurate colors possible.
Color Accuracy VS Color Gamut
We also measure a monitor's SDR color gamut, which defines the range of colors it displays in the sRGB and Adobe RGB color spaces. We measure this after a full calibration, so the test isn't about accuracy, but rather its gamut coverage in each color space. Because of this, the post-calibration results are similar to the SDR color gamut results for the sRGB color space, which you can see below with the ASUS ROG Swift OLED PG27UCDM. That said, the color gamut test is more important if you're a photo editor and you want to know the range of colors it displays in the sRGB and Adobe RGB color spaces.
 |
 |
How To Get The Best Results
To get the most accurate colors possible, you'll need to pay extra for a full calibration or have the proper equipment. These could get costly and might even cost as much as the monitor itself. Changing the picture mode and adjusting the brightness levels to your liking will be good enough for most people. At the end of the day, what you consider accurate may not be the same for someone else, so always adjust the settings to your liking.
We also don't suggest copying an ICC profile from any external source. As each monitor requires different calibration values, even for units of the same model, applying someone else's ICC profile can make your picture quality look worse.
Learn more about adjusting your monitor's settings.
Conclusion
Color accuracy tells us how well a monitor can display colors and shades of white and gray. Whether you're a photo editor or simply sitting back to watch your favorite videos or play games, color accuracy is important, and you want to view content as the creator intended. We measure the colors, white balance, color temperature, and gamma before and after a full calibration. Since full calibrations are costly and produce similar results between each monitor, the pre-calibration results are more important for most people.