There's a lot of chatter about the harmful effects of blue light from our phones and tablets, but do TVs emit blue light? Studies have shown that exposure to blue light emitted from displays could cause numerous health issues, from discomfort and eye damage to changes in the circadian rhythm that controls our sleep patterns. To better understand how TVs might impact eye health, we took spectral measurements of 83 recent TVs to precisely determine how much blue light TVs actually emit. Turns out, a significant portion of the blue light emitted by LED TVs falls within the wavelength range that might be harmful to your eyes. OLEDs are a bit better, but we found that they emit more light within the range that might impact our circadian rhythm.
Why Blue Light Matters
Before we get into the actual results, let's talk about blue light. What is it, how TVs use it, and why it matters.
What Is Blue Light?
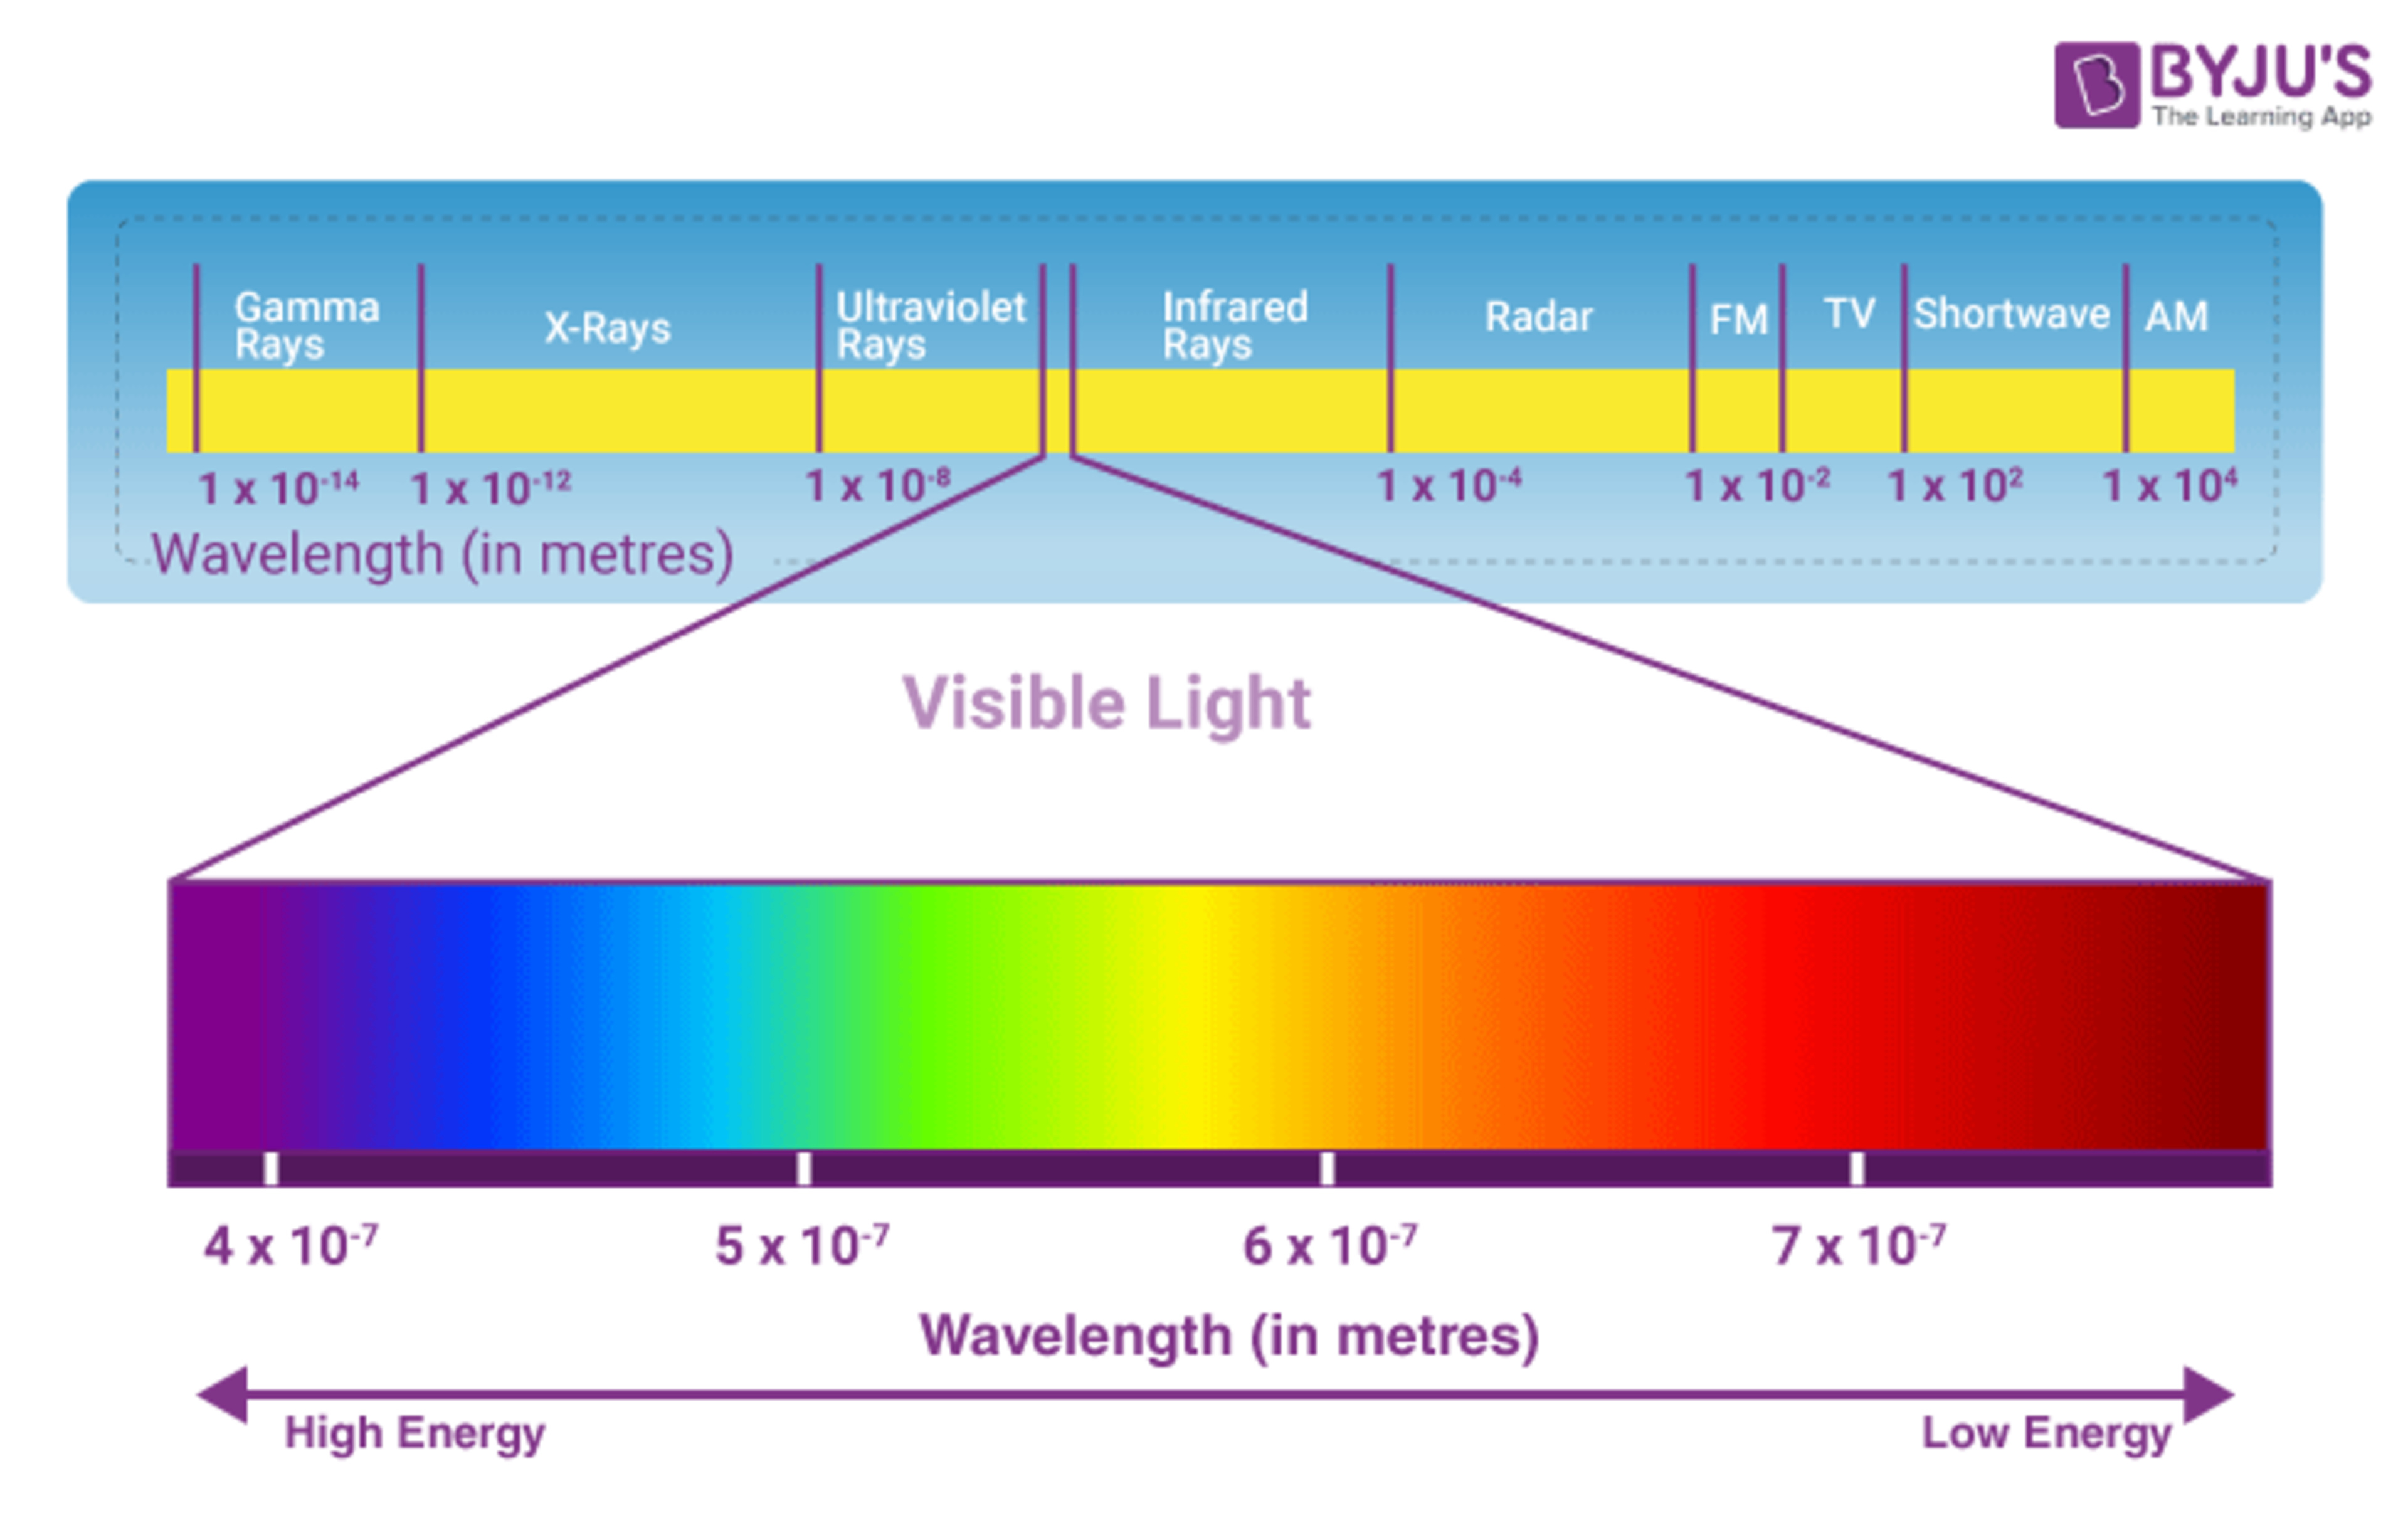
When we talk about blue light, we're referring to a range of the visible light spectrum with a wavelength of around 380 to 500 nanometers. Blue light has one of the shortest wavelengths in the visible light spectrum, and because shorter wavelengths carry more energy than longer ones, it's one of the highest-energy colors in the visible spectrum. Red and green have longer wavelengths, and they're less energetic. Below you can see the entire electromagnetic spectrum, with the range of visible light shown beneath it. It spans from high-energy gamma rays to low-energy AM radio signals, and the visible-light spectrum is only a small portion of it. Although blue light doesn't have as much energy as more harmful forms we can't see, like X-rays, it still has more energy than most other colors.
Is Blue Light Harmful?
While exposure to blue light is necessary to control our body's internal clock, many studies have sought to determine whether exposure to blue light from screens has negative effects. The amount of blue light from your TV is minimal compared to the sun's, and studies are split on just how much damage it causes to the eye, or even whether there's any damage at all.
There are two main ways blue light might impact our health, and the effects depend on the specific wavelength of light. Higher energy blue light with a wavelength between 415 and 455nm has been shown to be the most likely to cause eye damage. Blue light within that range can pass directly through the cornea and lens to the retina, which can cause short-term issues such as dry eyes and general discomfort. Some studies have shown(1, 2) that long-term exposure to such light might cause greater issues like cataracts or age-related macular degeneration. Scientists aren't universally agreed on the potential harmful effects of blue light, though(1,2).
While there's still debate about the effect of blue light on the eye, there's more of a consensus on how blue light affects your sleep. Studies have shown(1, 2, 3) that blue light in the 460-480nm range can cause our circadian melatonin rhythm to reset, suppressing the body's release of melatonin, which can disrupt the body's internal sleep schedule. According to the Sleep Foundation, constant exposure to blue light at bedtime can lead to many negative health impacts, including metabolic disorders and various mental health disorders, including depression. Most portable electronic devices have a night mode, which reduces the amount of blue light they produce so you can safely use them before bed without affecting your sleep cycle.
Do TV Screens Emit Blue Light?
Now that we've explained what blue light is and why certain wavelengths may be harmful, what does this have to do with your TV? Well, let's talk about how most TVs make light. Although most TVs use red, green, and blue subpixels to produce the image you see on the screen, the part of the TV that emits light doesn't actually make each of those colors directly. The vast majority of wide color gamut LED TVs on the market only create blue light in their backlight. Most of the time, this is a good thing, as high-energy blue light is optimal for conversion to other colors through the use of color filters or quantum dot color converters.
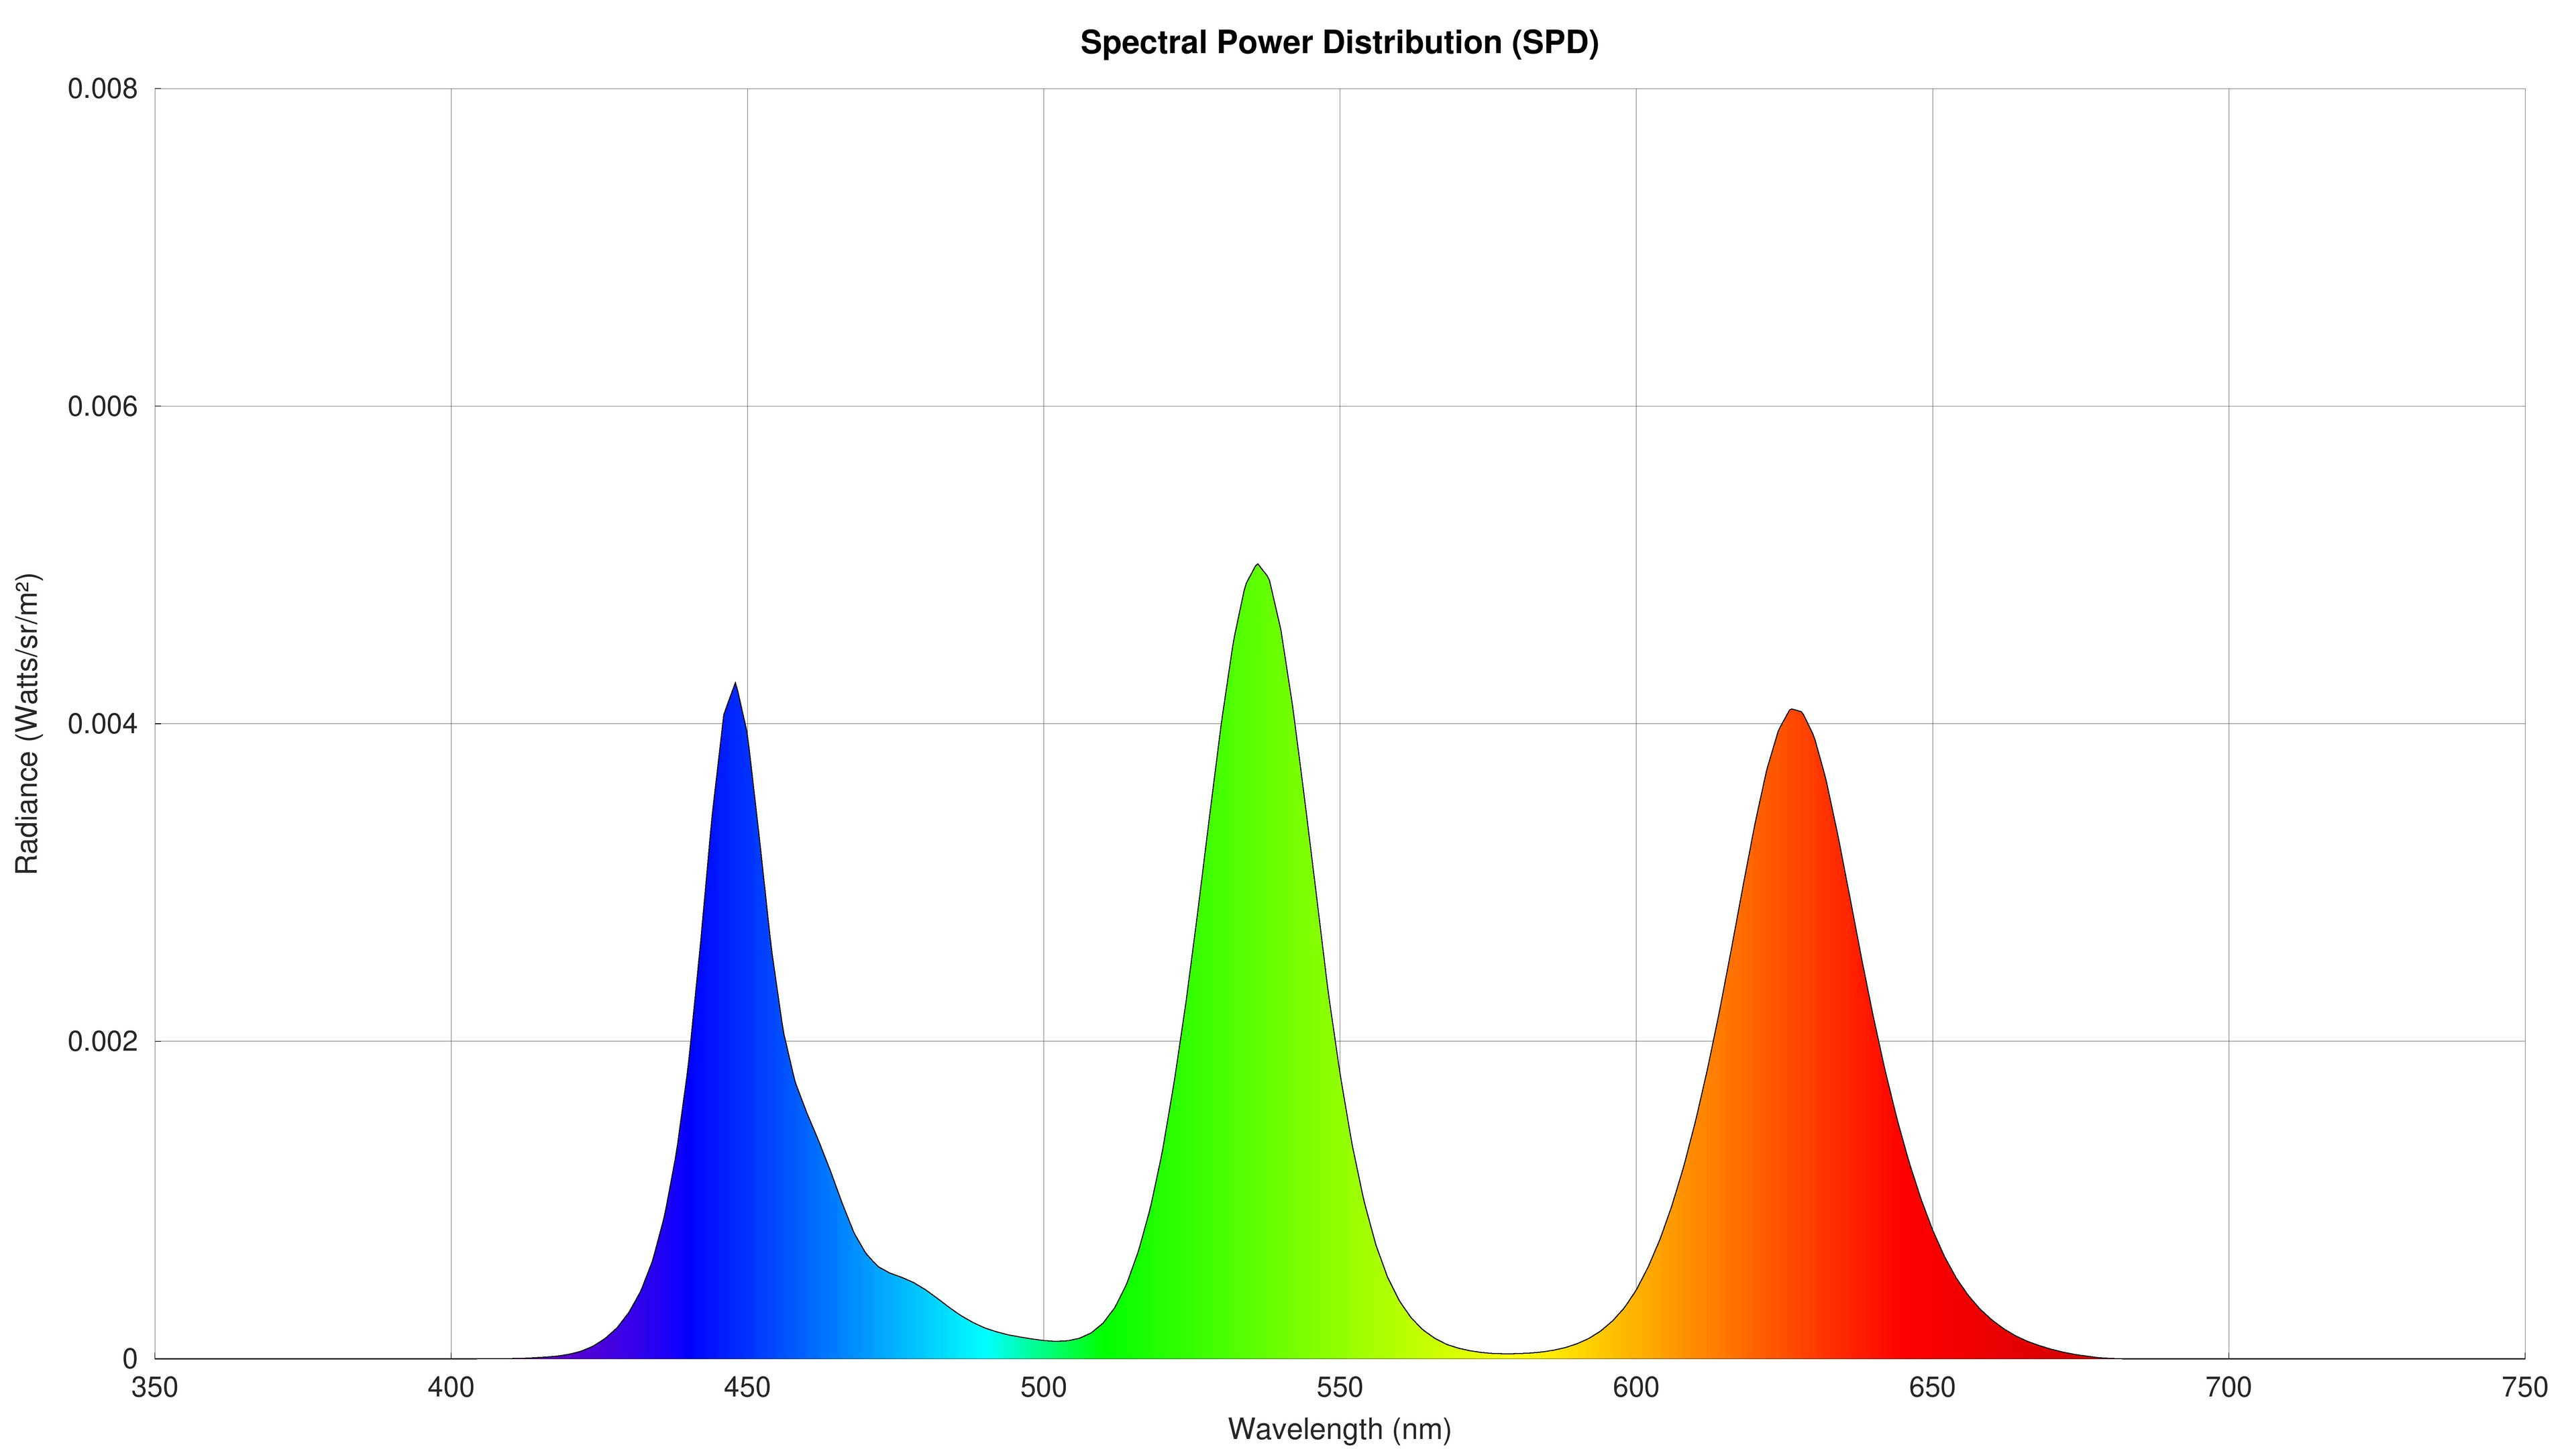
Some TVs, especially lower-end models, use white LEDs instead, which they simply pass through red, green, and blue color filters to produce the required colors. Although the LEDs' light appears white, the base LED is still blue, and it's a phosphor that converts some of the blue light to other colors to create white light. Not all of the blue light is converted, though, and there is usually a very strong blue light emission peak, which we can see in their spectral power distribution graphs (SPD).
 |
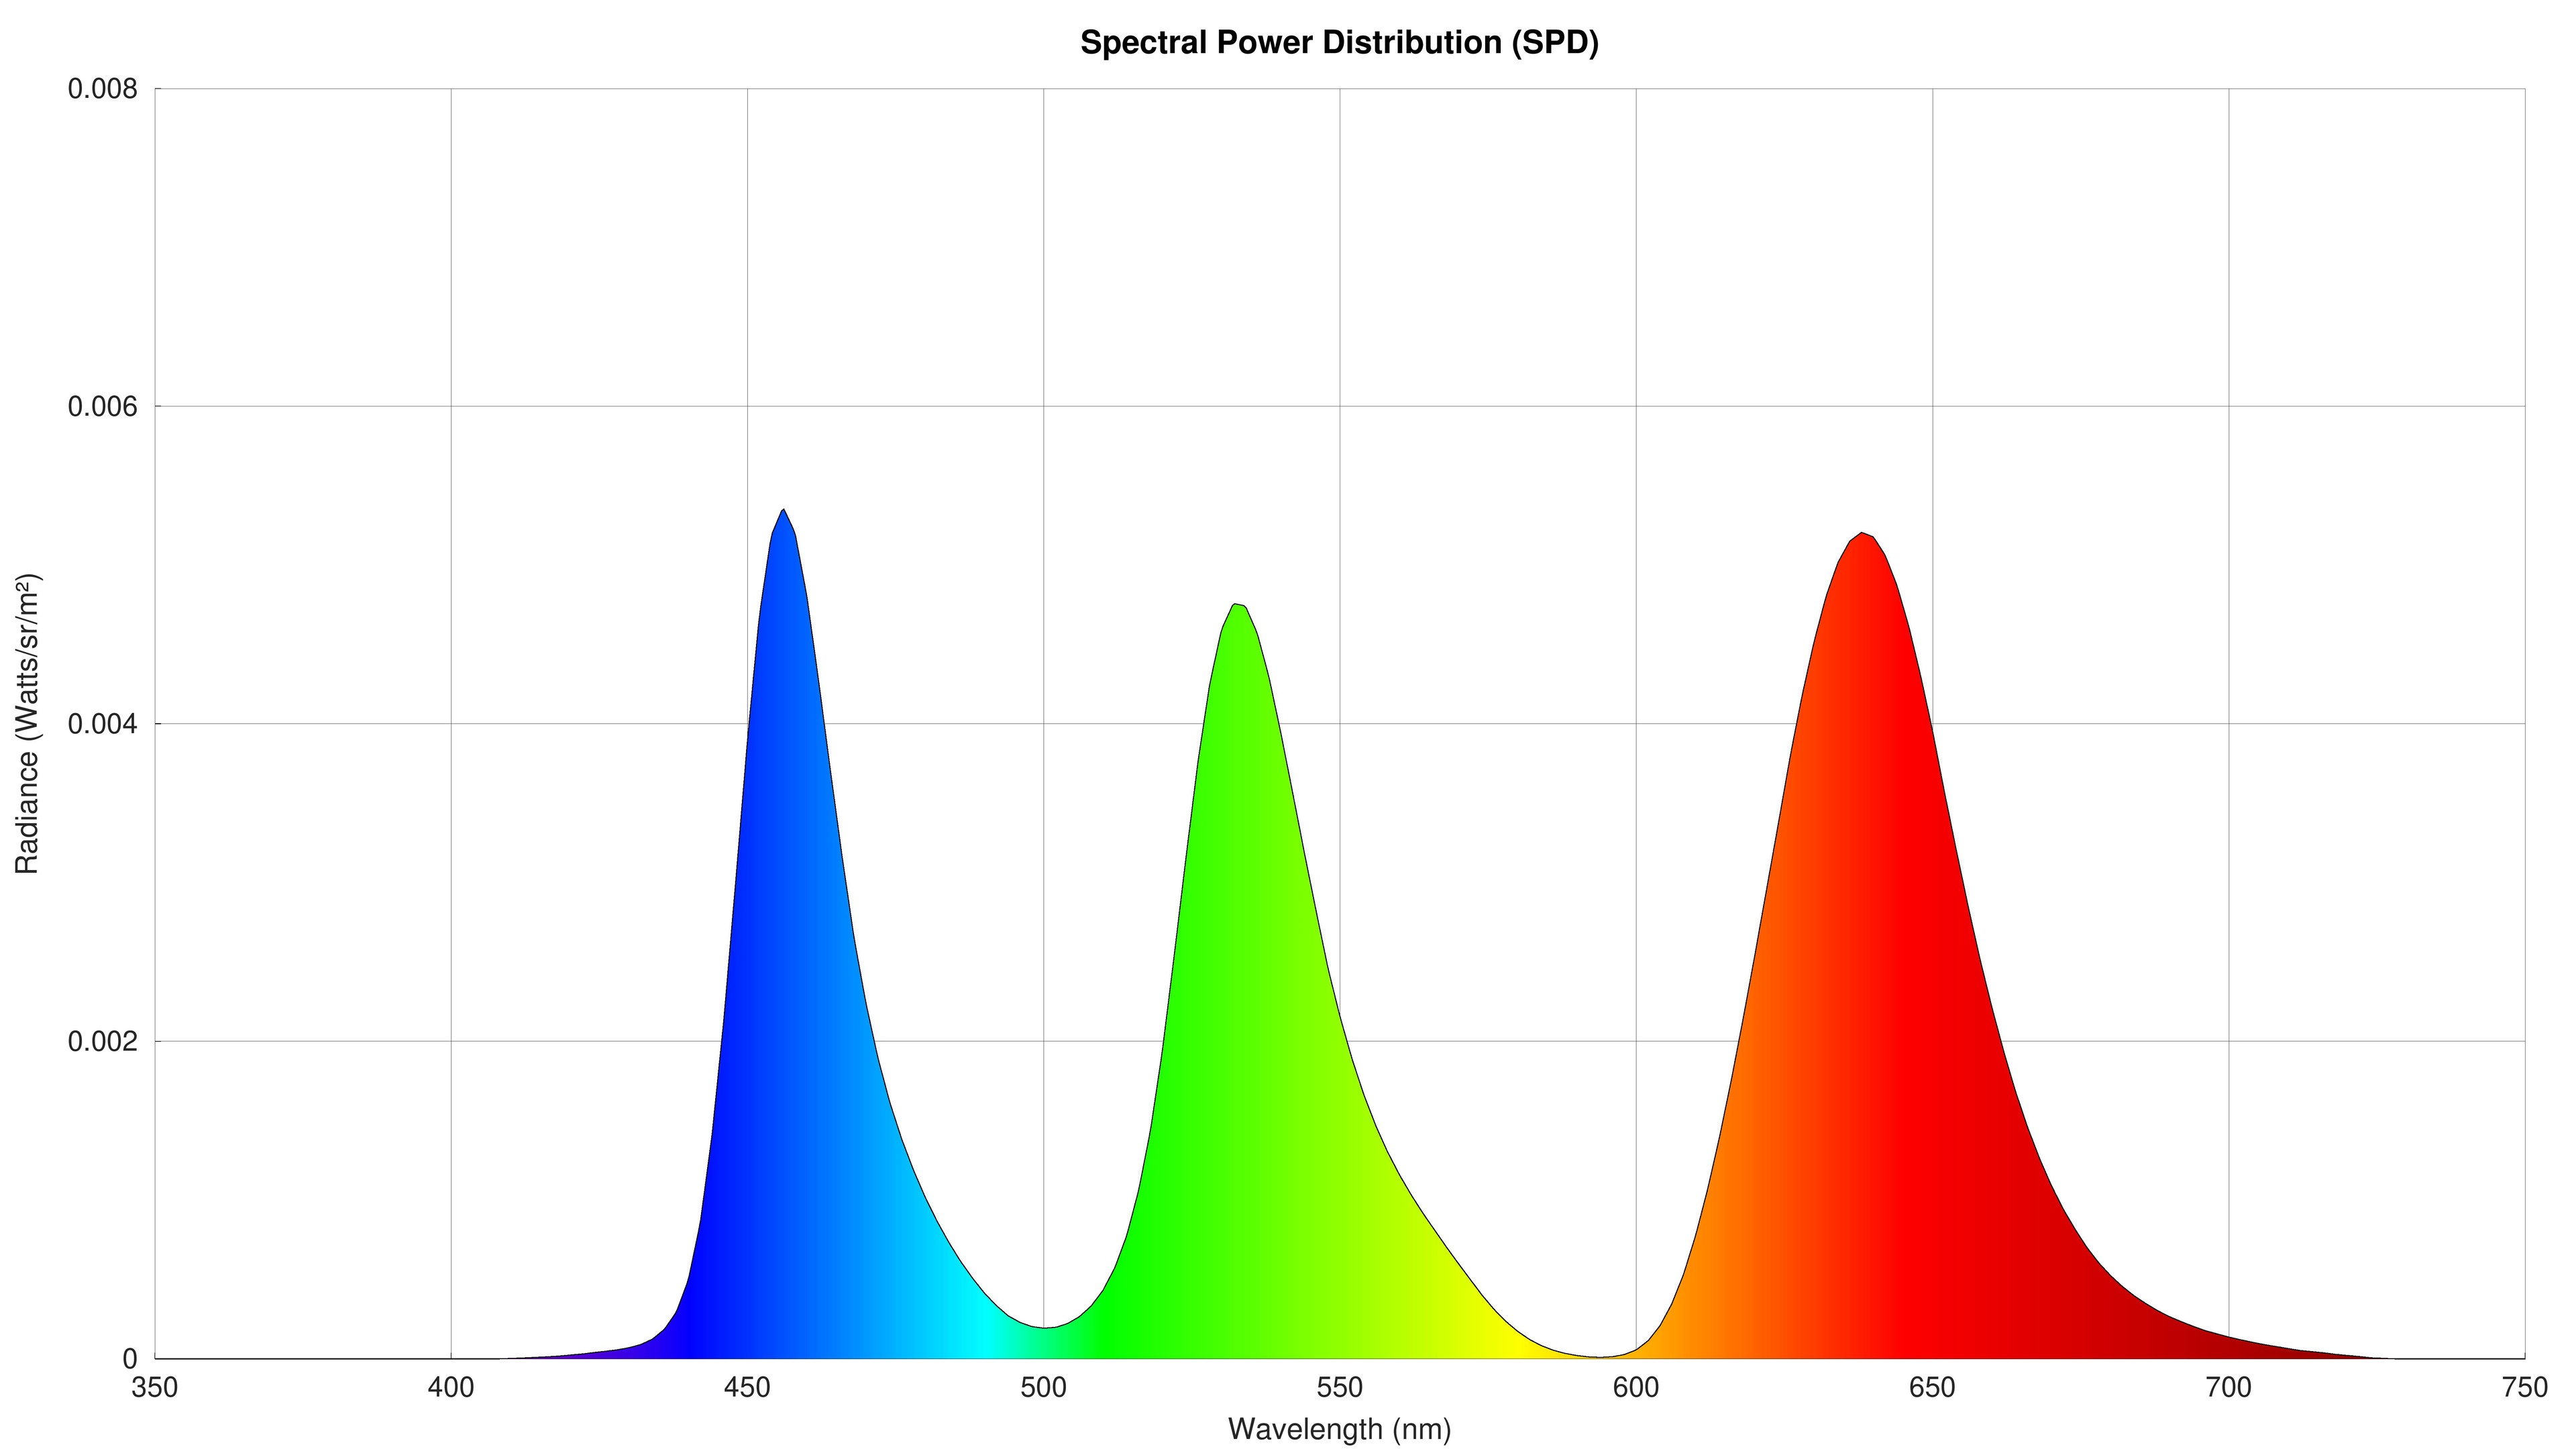 |
OLED TVs are a bit different, and they fall into two main types: WOLED and QD-OLED. WOLED models use a stack of light-emitting OLED materials that produce white light, which then passes through color filters to produce the red, green, and blue colors used for each sub-pixel. QD-OLEDs are a bit different, though, as with LED technology above, they produce blue light at the source and then pass that light through red and green quantum dots to create those color channels. Regardless of their internal structures, as shown in the example SPDs above, both OLED technologies exhibit a strong blue spectral peak.
The end result is that no matter how a TV actually creates light, whether it's blue or white, it still produces blue light. The blue light produced by TVs plays an important role in your TV's color accuracy, so manufacturers can't simply eliminate it. It's also not easy to simply adjust the blue light output to a more optimal wavelength, and this hasn't really been a focus for most TV manufacturers in recent years.
TV Blue Light Investigation
The goal of this investigation is to determine just how much blue light TVs produce, and how much of that falls in the harmful range. We'll compare and contrast OLED and LED technology, but we're not looking to compare individual models. Since blue light is just one component of how a TV produces colors, we're not looking at this in terms of colorimetry, either.
Test Setup
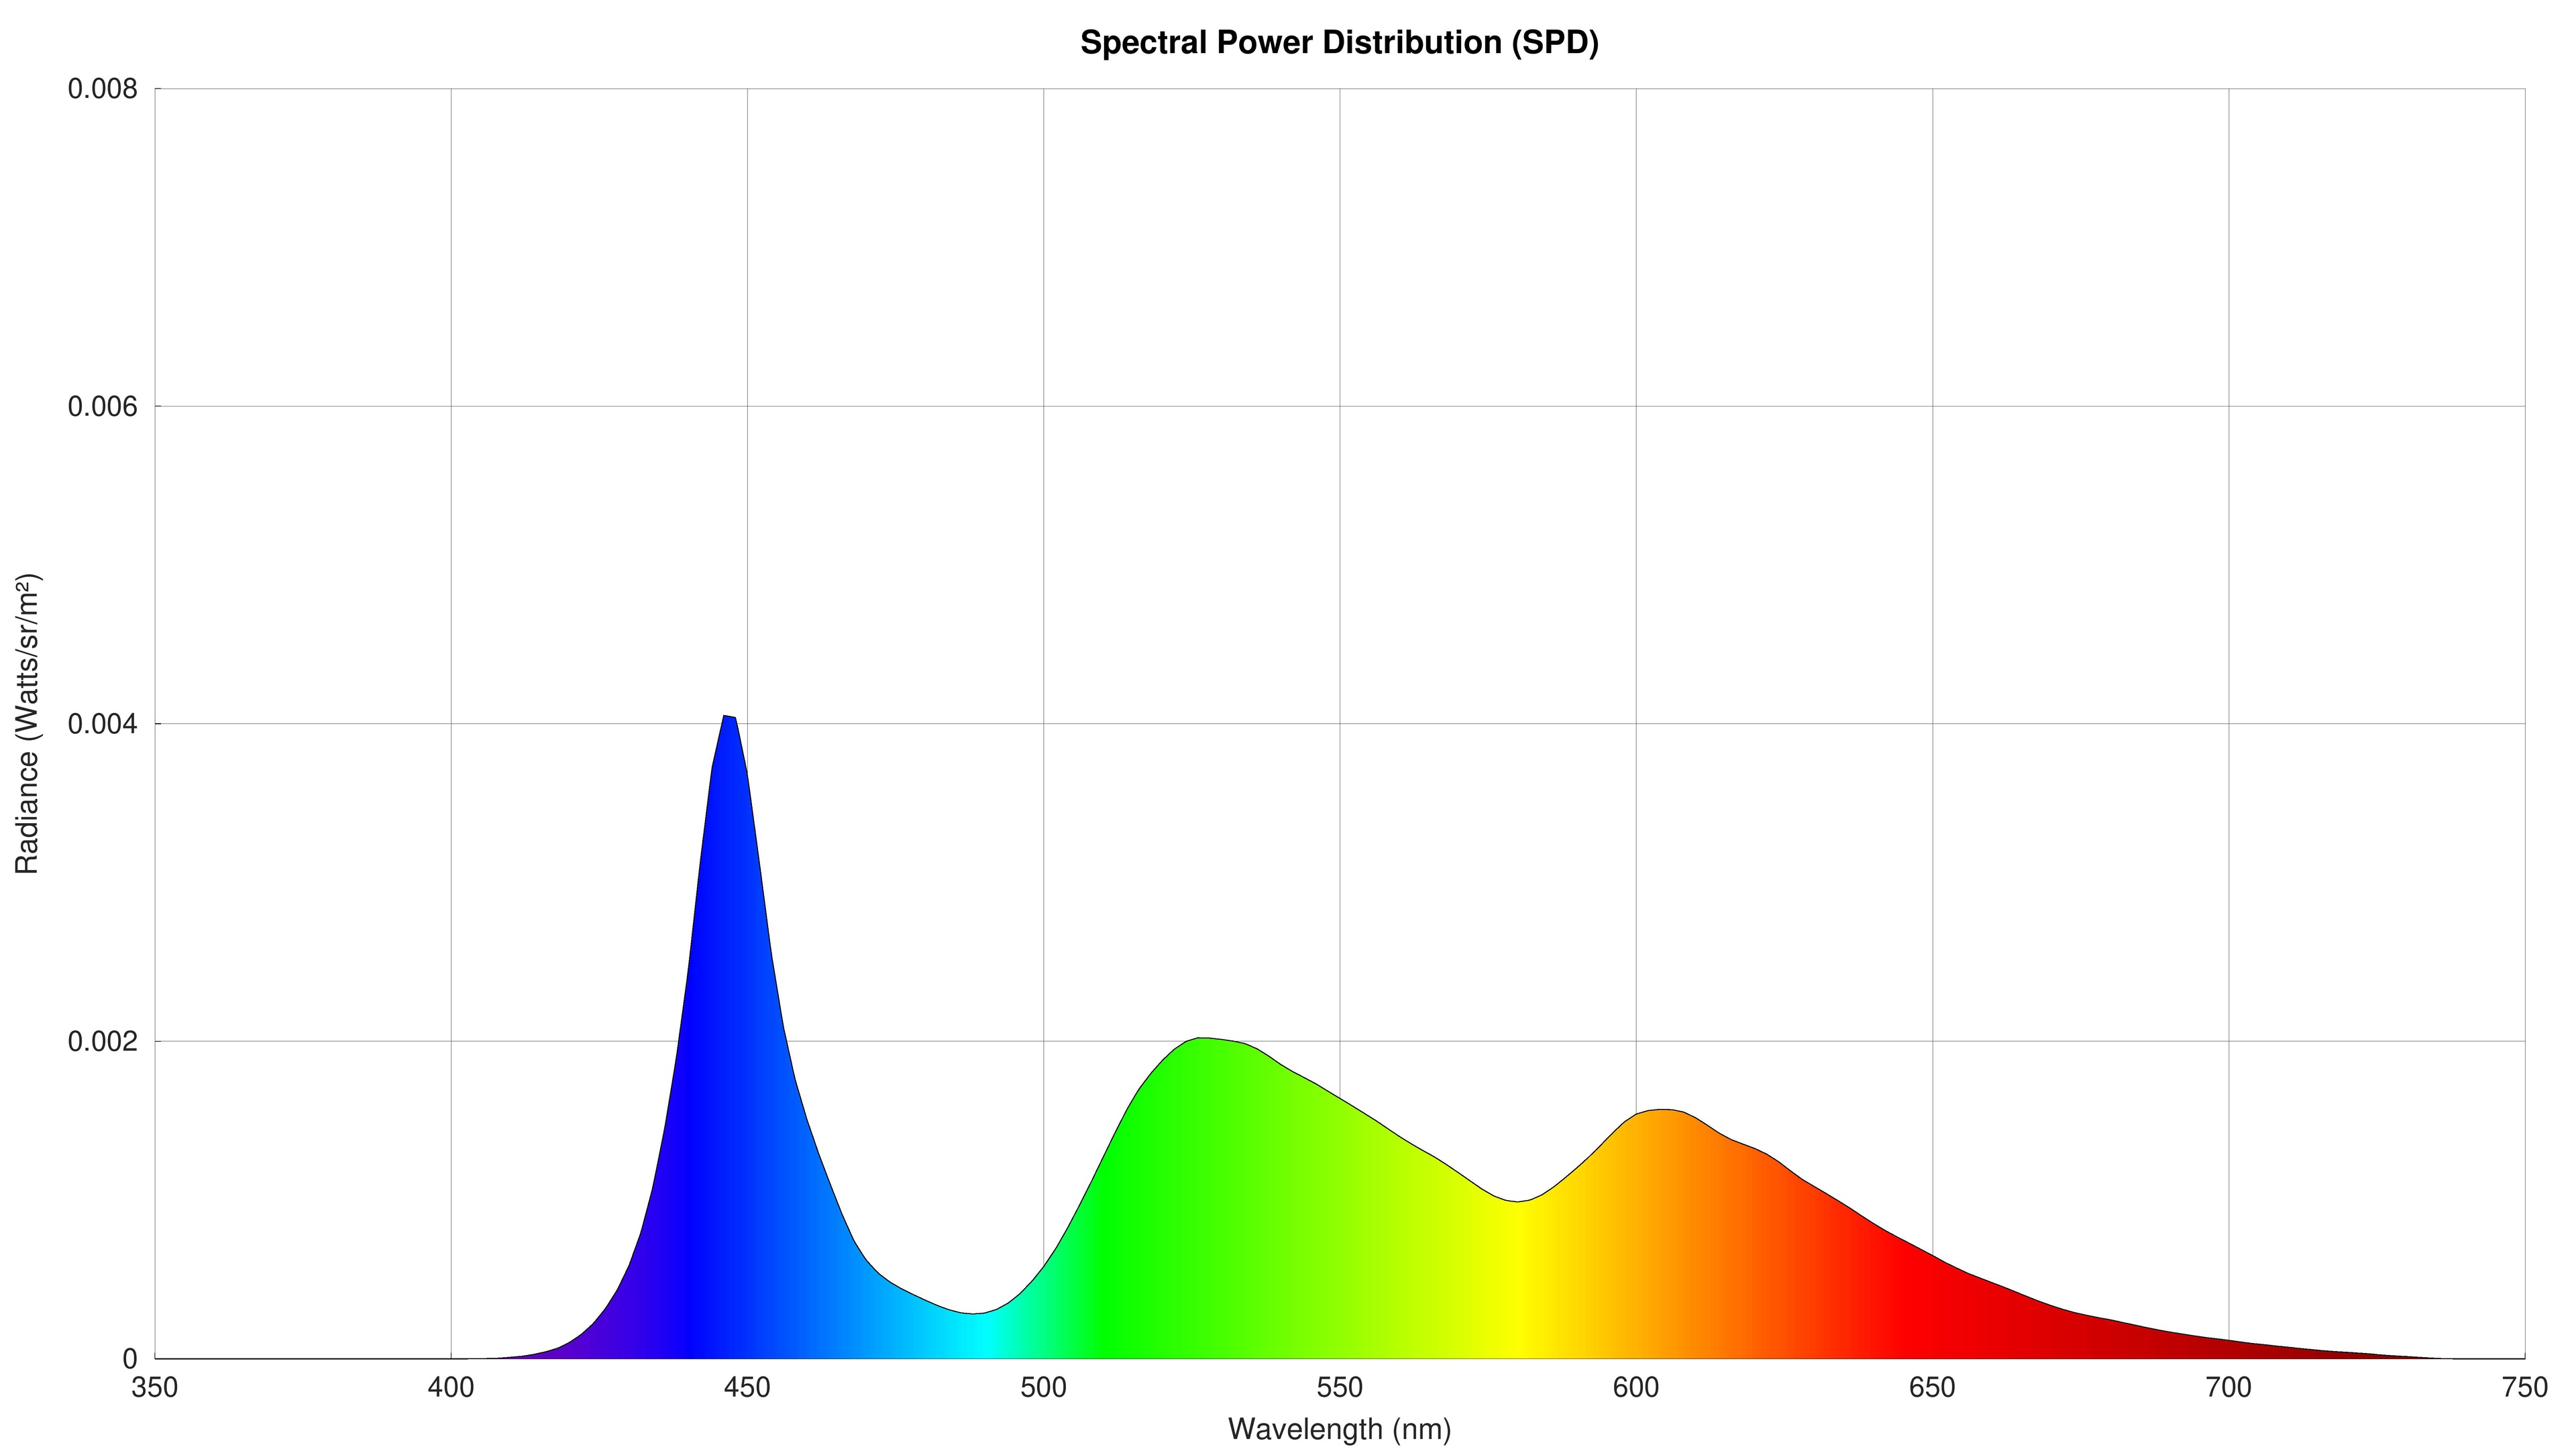
To understand how much blue light a TV produces, we're using a chart called the spectral power distribution. This chart shows the radiance, or intensity, of each wavelength of light emitted by a TV while displaying a white slide after calibrating it to 100 nits. We measure the radiance from the TV using a Colorimetry Research CR-250. This tool measures the power of light radiated by the TV from 380-780nm in increments of 2nm. When we plot this information into a chart, we get the SPD chart shown above. Normally, this chart is used to examine factors like color separation and the width of each peak, as narrower peaks usually result in better colors. For this article, though, we'll be taking a slightly different approach to the SPD.
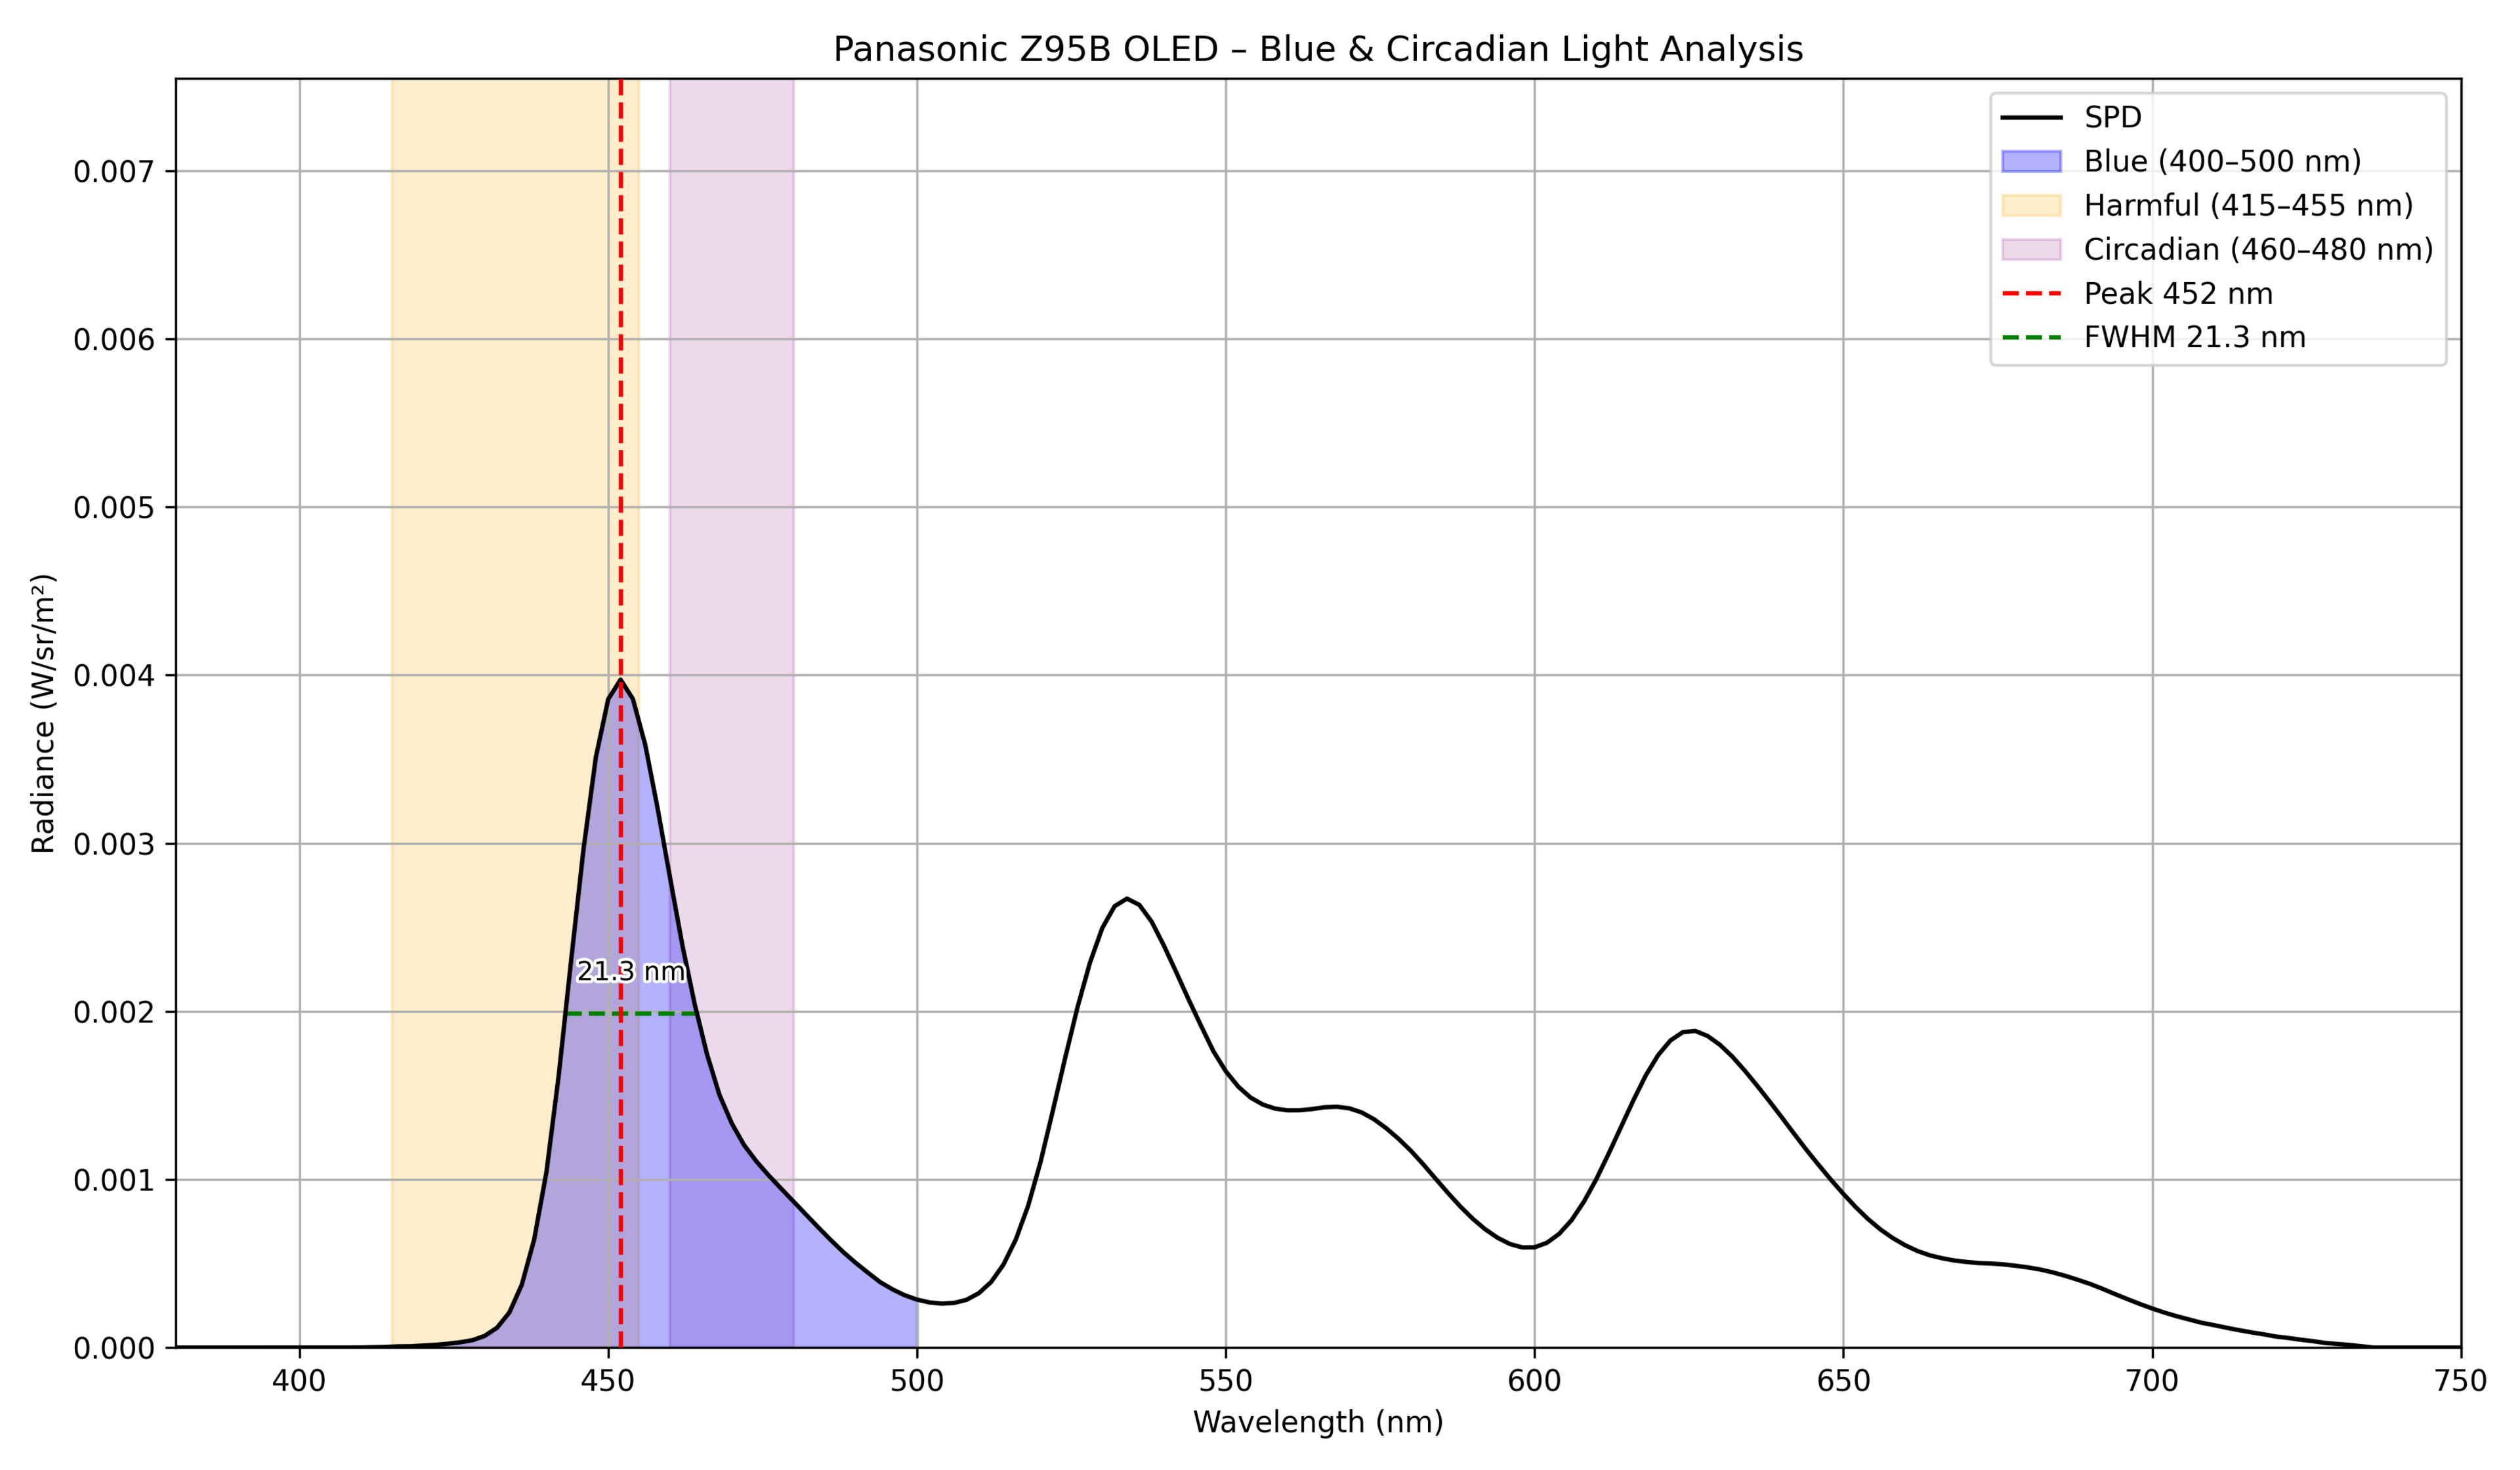
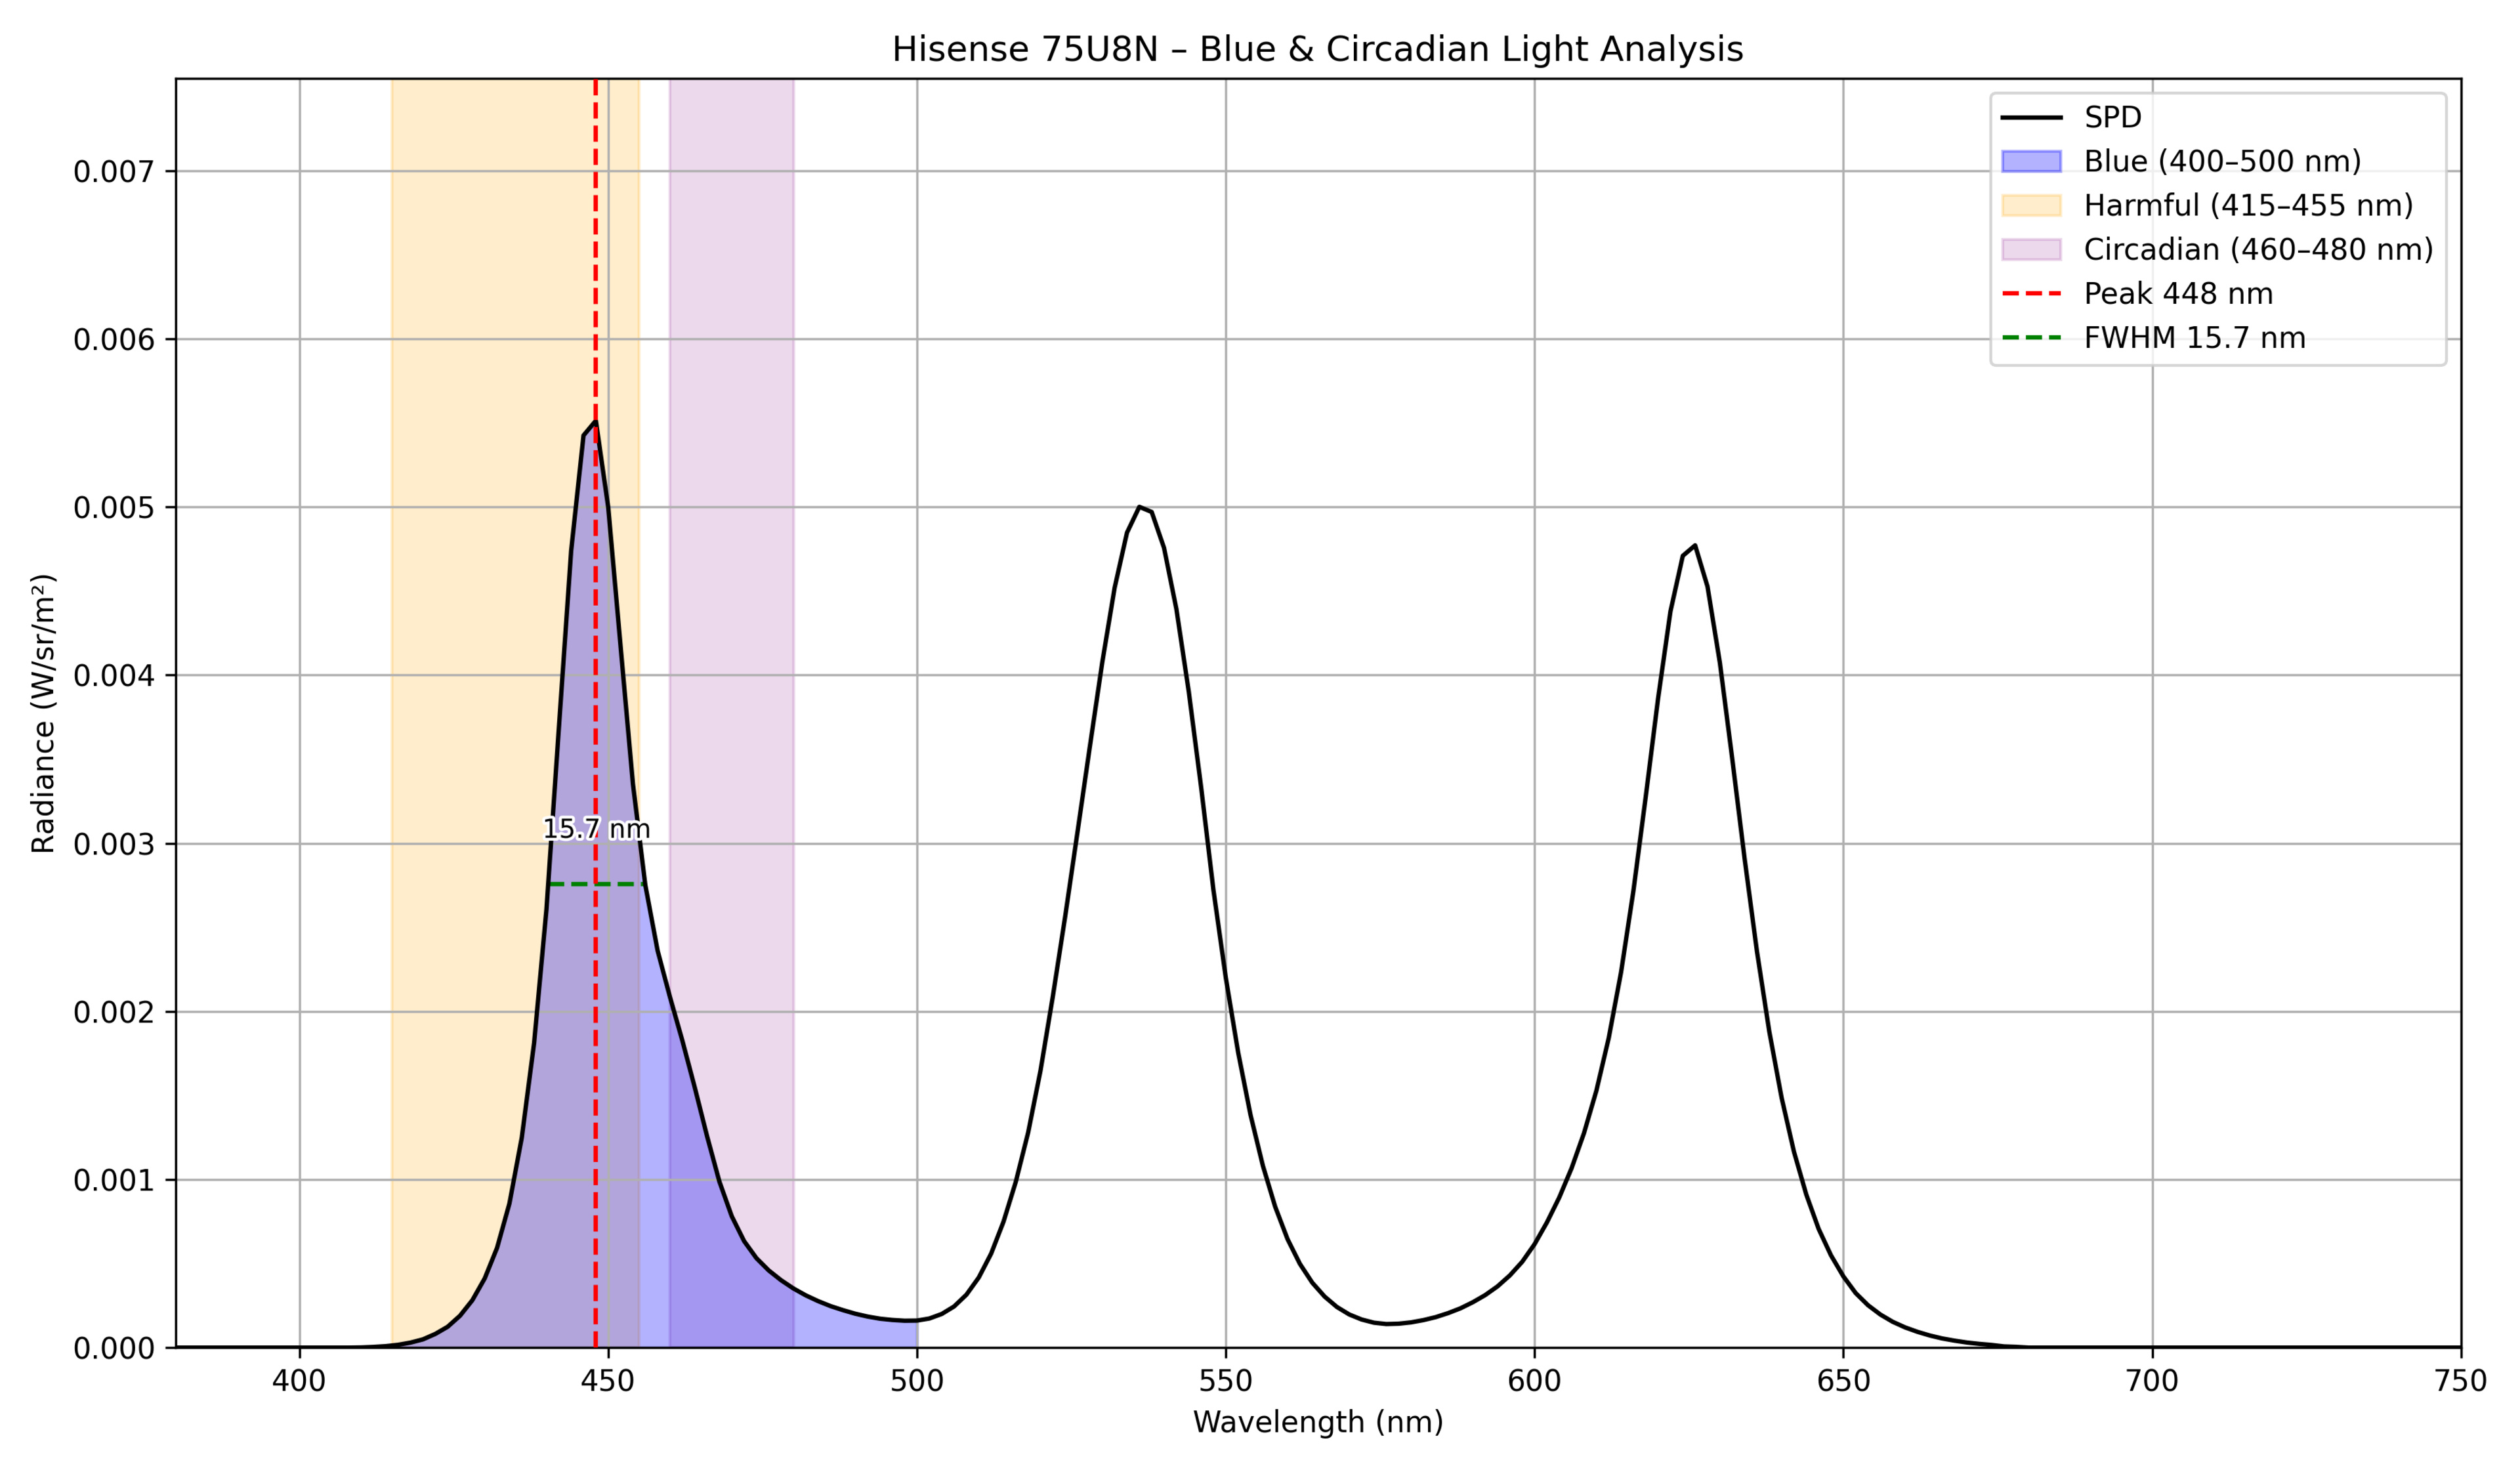
Instead of our usual SPD chart, we're processing the data differently to focus it on the areas we care about for this study. We start by focusing on the area of the chart between 400-500nm, which is highlighted in blue under the curve. From there, we break the data down into two sections. The first column, highlighted in beige, shows the 415-455nm range of blue light that can be harmful to your eyes. The second column, highlighted in purple, shows the 460-480nm range of light that affects your circadian rhythm.
Using data analysis software, we calculate the wavelength of the peak of the blue spike (dotted red line) and the full width at half maximum (FWHM) for the blue spike (dotted green line). The FWHM is a useful analysis tool that tells us how precise the blue peak is. Finally, we calculate the total area under the curve for the 400-500nm range to tell us how much blue is there, and then determine how much of that blue light falls within each of our two target zones.
Below are the results for the 83 TVs we've tested on our 2.0.1 and 2.1 test methodologies. We've separated them by LED and OLED models, as there's a significant difference in how these two display technologies perform.
LED TV Results
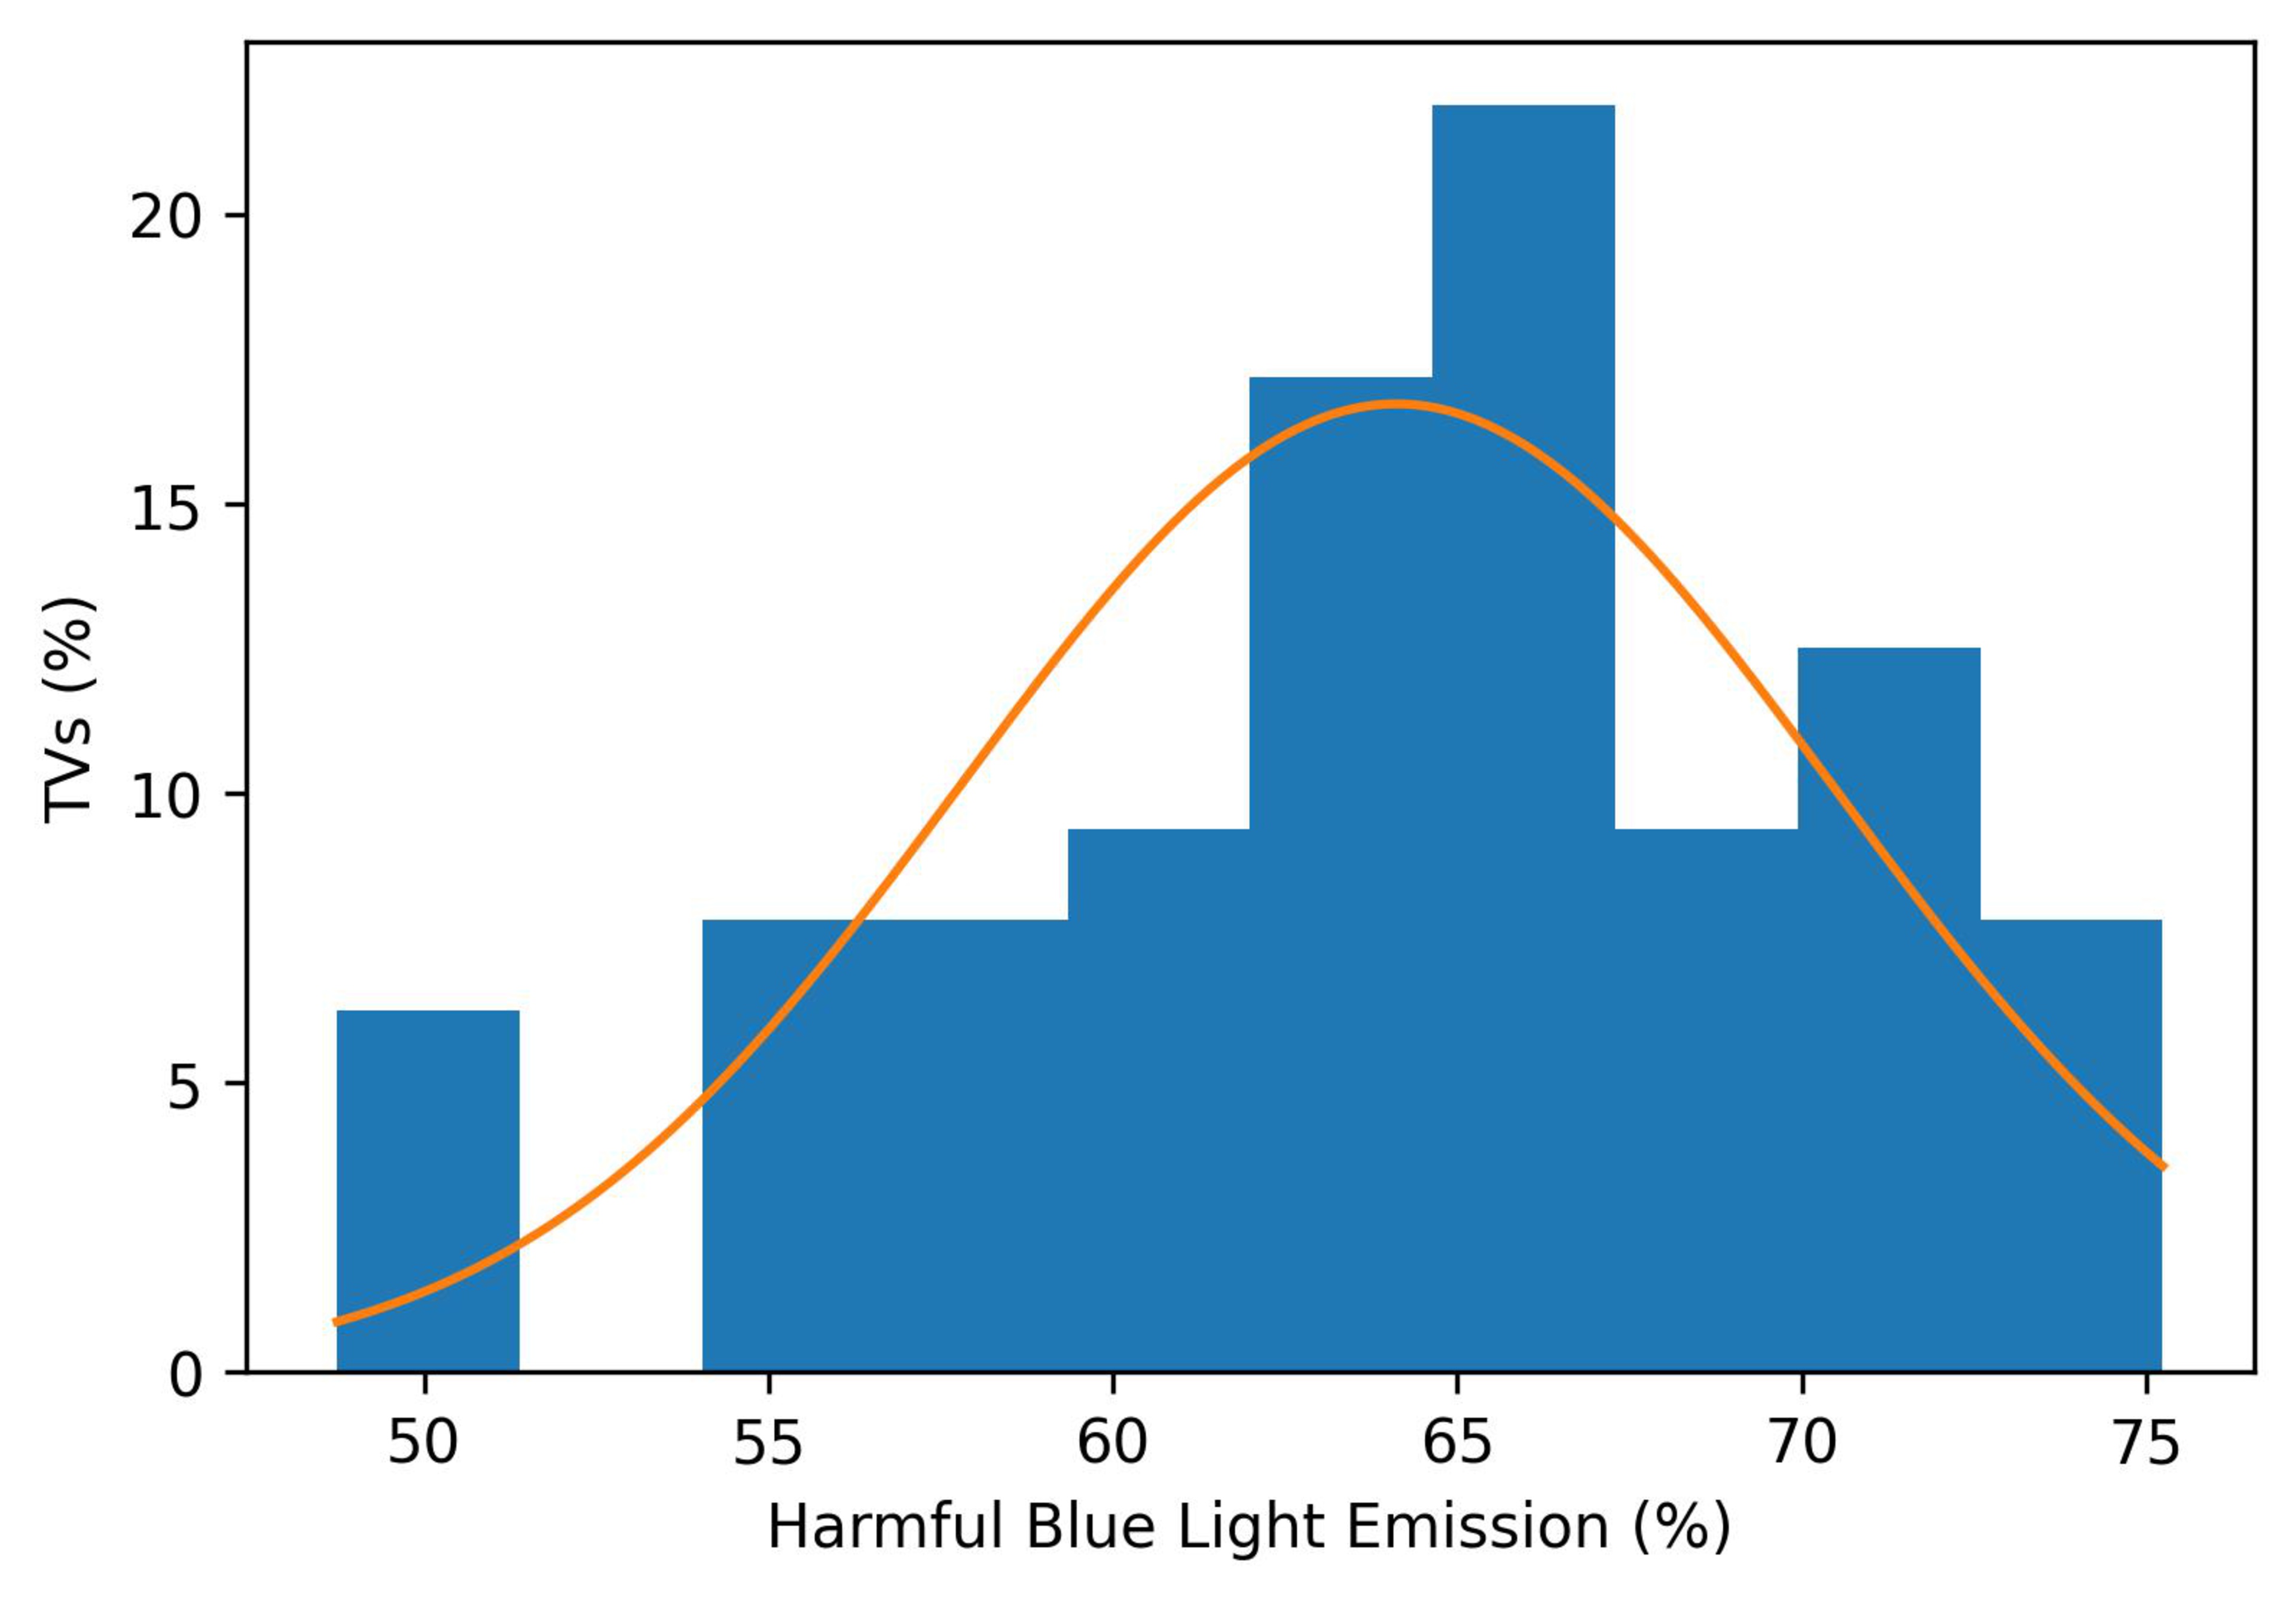
Looking at the data from the 64 TVs with LED backlights, we can see a few interesting trends. With an average of 64% of blue light falling within the "harmful" zone, it's clear that LED TVs emit a lot of light within the harmful range. There's a lot of variation, though, as the amount of harmful blue light ranges between 48% and 75%. The impact on circadian rhythm seems minor, averaging only 17%.
Looking at the exact wavelength used for the blue peak, there are no real surprises there. Most TVs emit blue light centered at around 446-448nm, which is within the fairly wide optimal excitation range for quantum dots. The FWHM is also very consistent, with the vast majority of TVs producing a clearly defined spectral peak with FWHM of about 16nm.
You can see the full data below:
| Product | Spectral Power Distribution | Blue Peak Wavelength (nm) | Full Width At Half Maximum (nm) | Harmful Range (415-455nm) (%) | Circadian System Range (460-480nm) (%) | Total Blue Output Power (W/sr/m²) |
|---|---|---|---|---|---|---|
| Amazon Fire TV Omni Mini-LED Series | 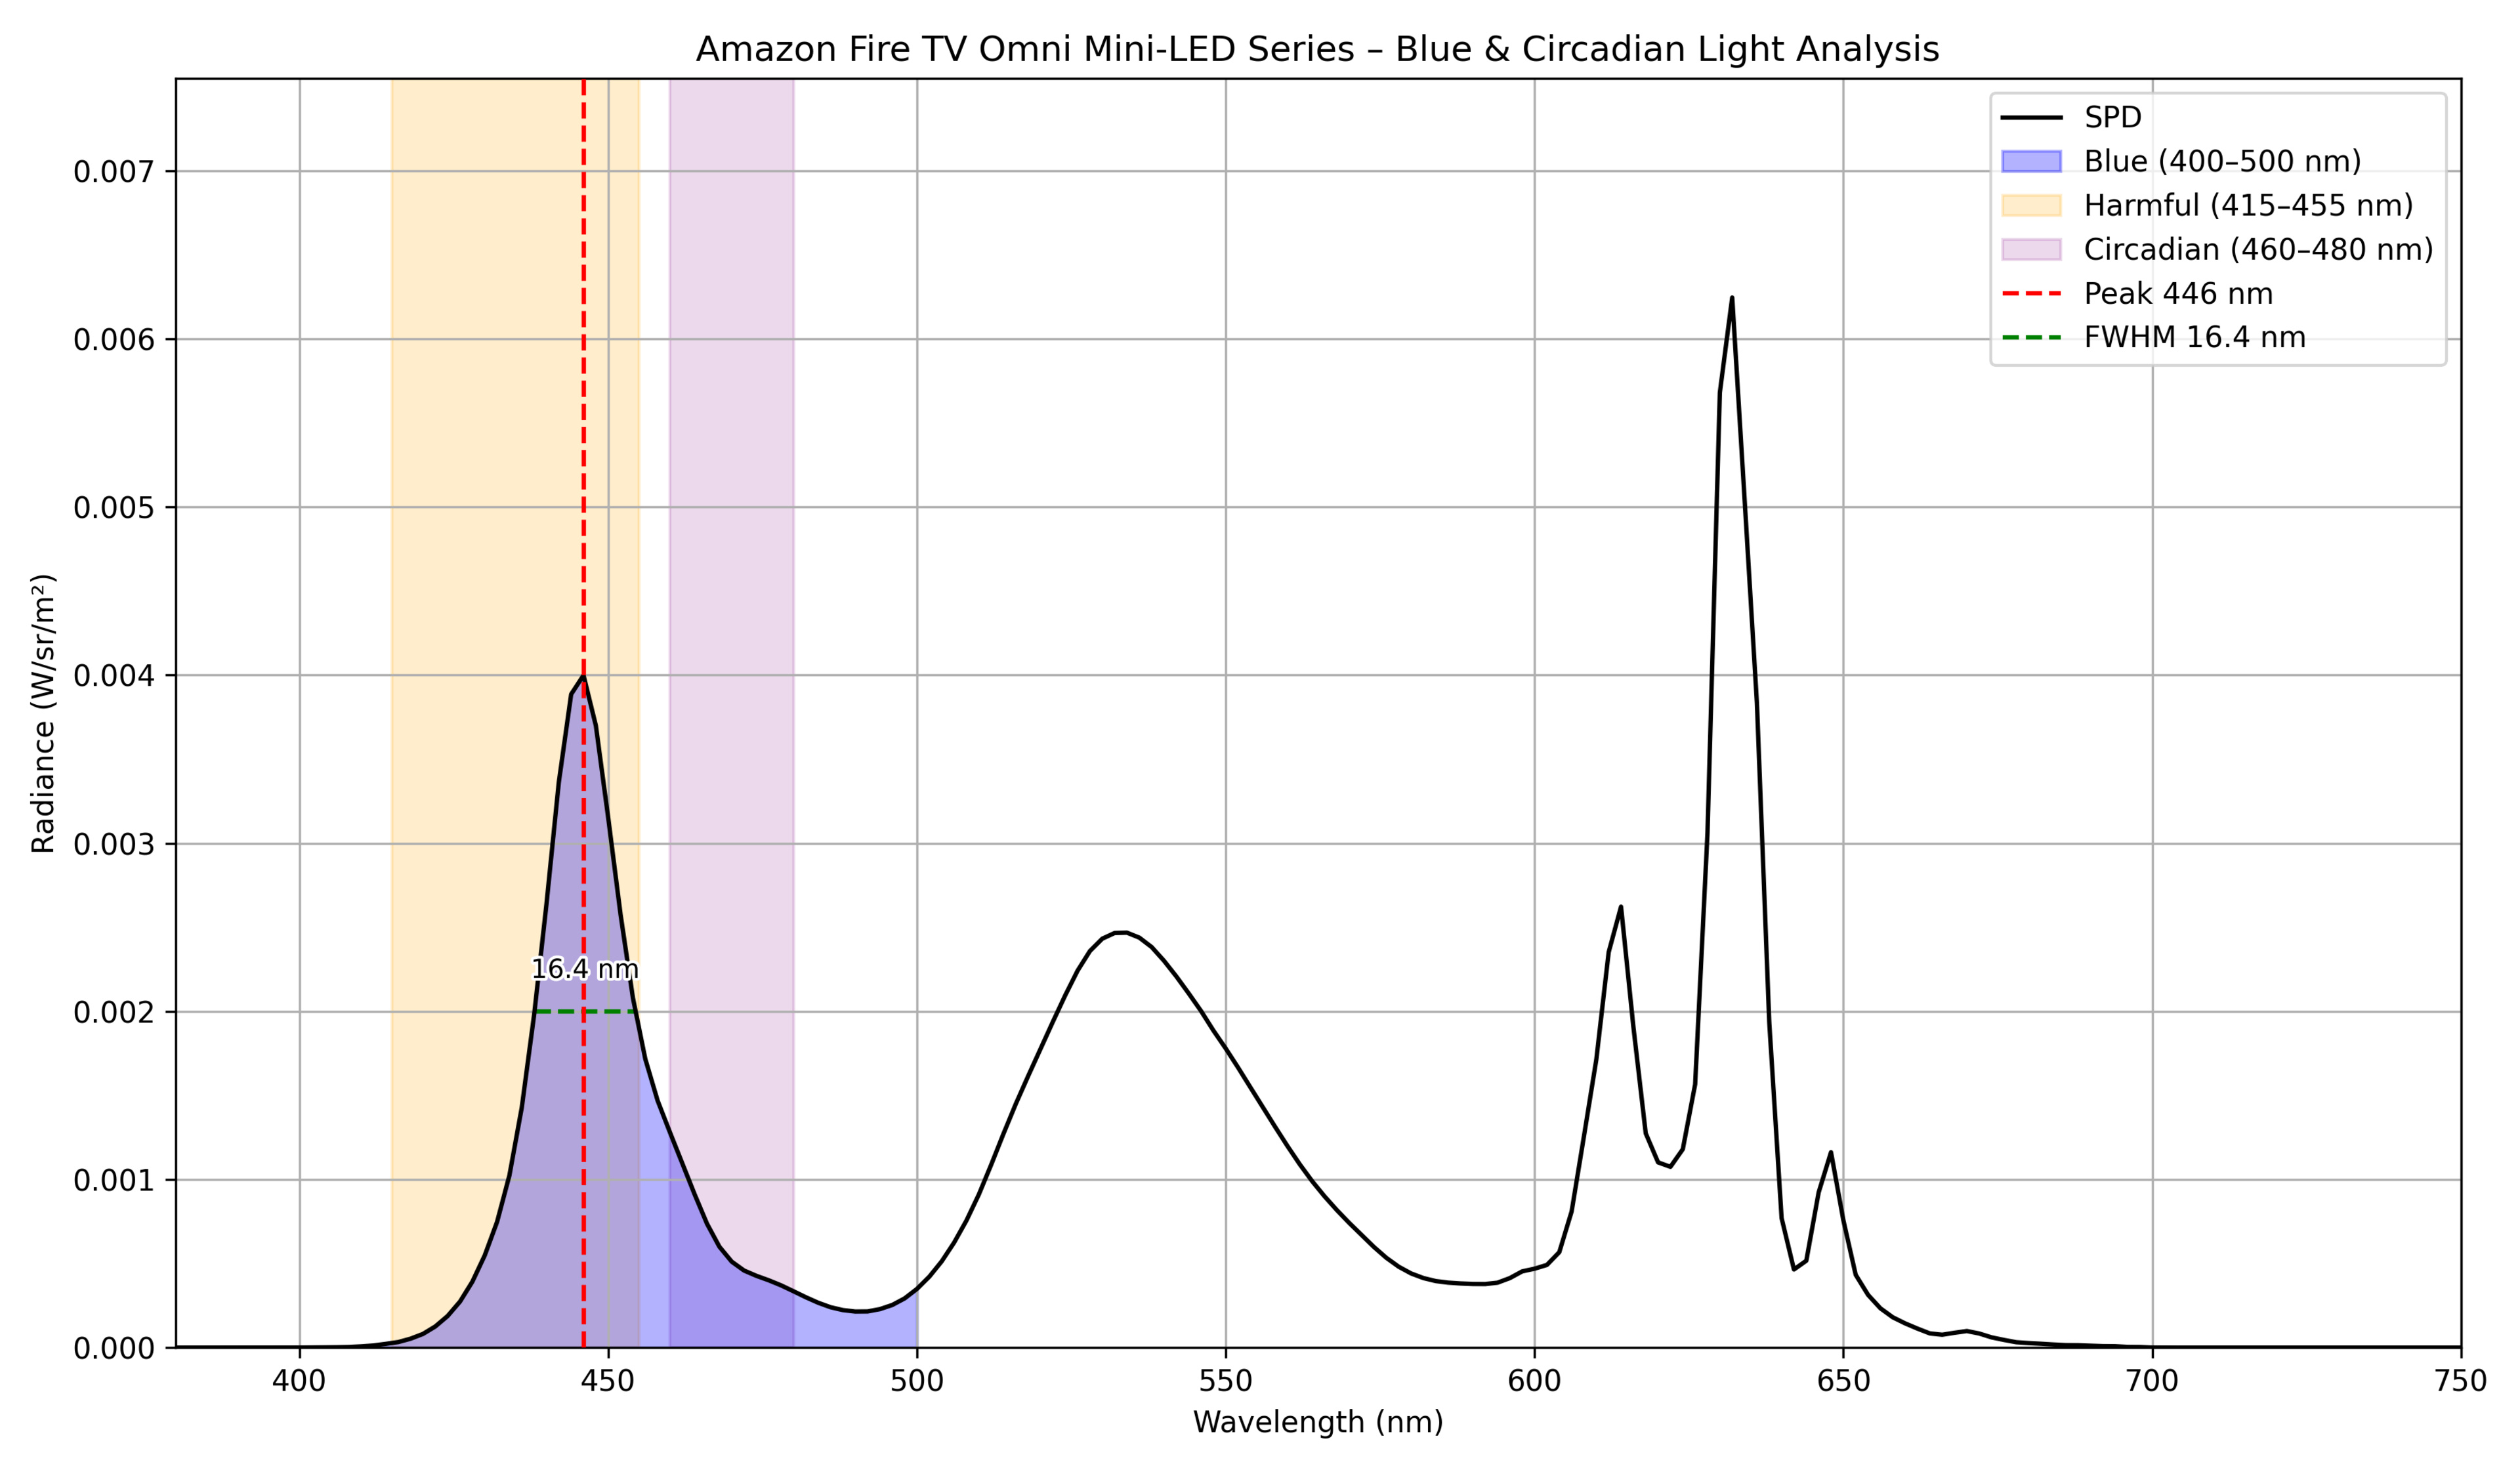 |
446 | 16.4 | 69.3 | 14.03 | 0.090079 |
| Hisense 100U8QG |  |
446 | 15.5 | 68.67 | 14.01 | 0.091164 |
| Hisense 75U8N | |
448 | 15.7 | 66.16 | 16.57 | 0.116408 |
| Hisense 98QD5QG |  |
446 | 16.2 | 67.14 | 15.08 | 0.093869 |
| Hisense A7N | 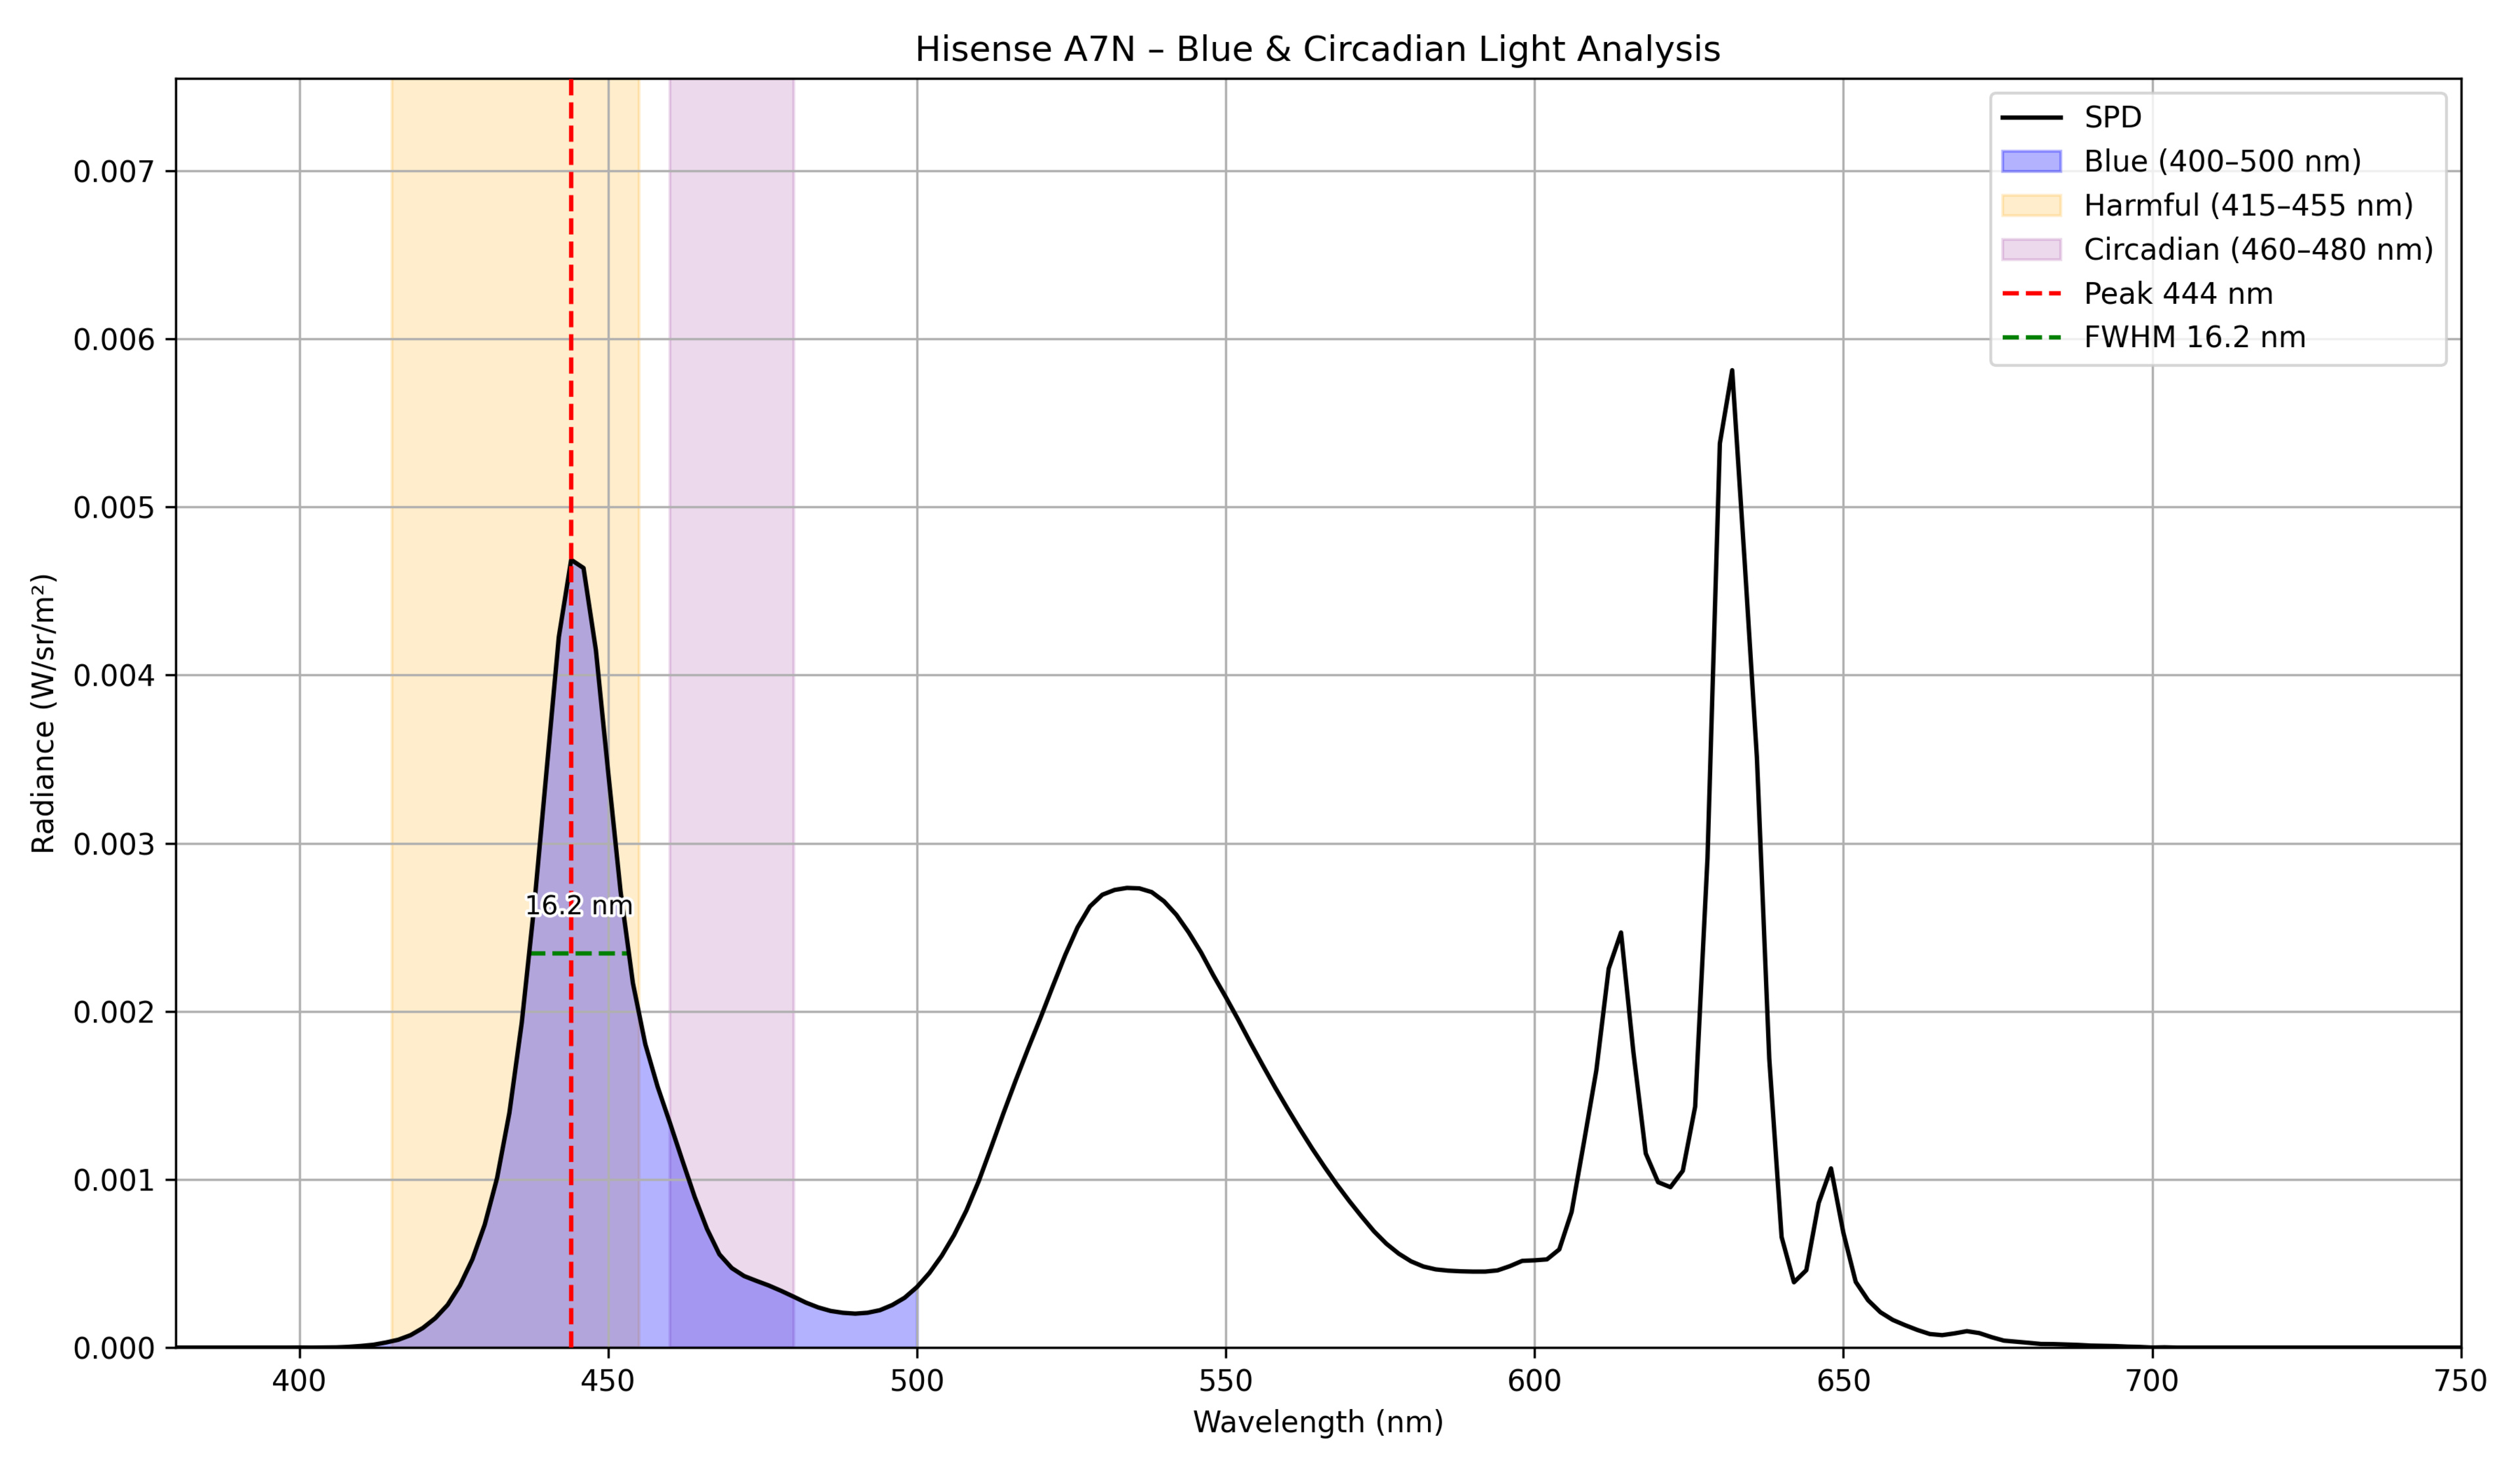 |
444 | 16.2 | 73.23 | 11.88 | 0.10262 |
| Hisense CanvasTV 2024 |  |
444 | 16.2 | 71.33 | 12.76 | 0.104838 |
| Hisense QD6QF |  |
448 | 16.8 | 65.71 | 15.81 | 0.100591 |
| Hisense QD7N | 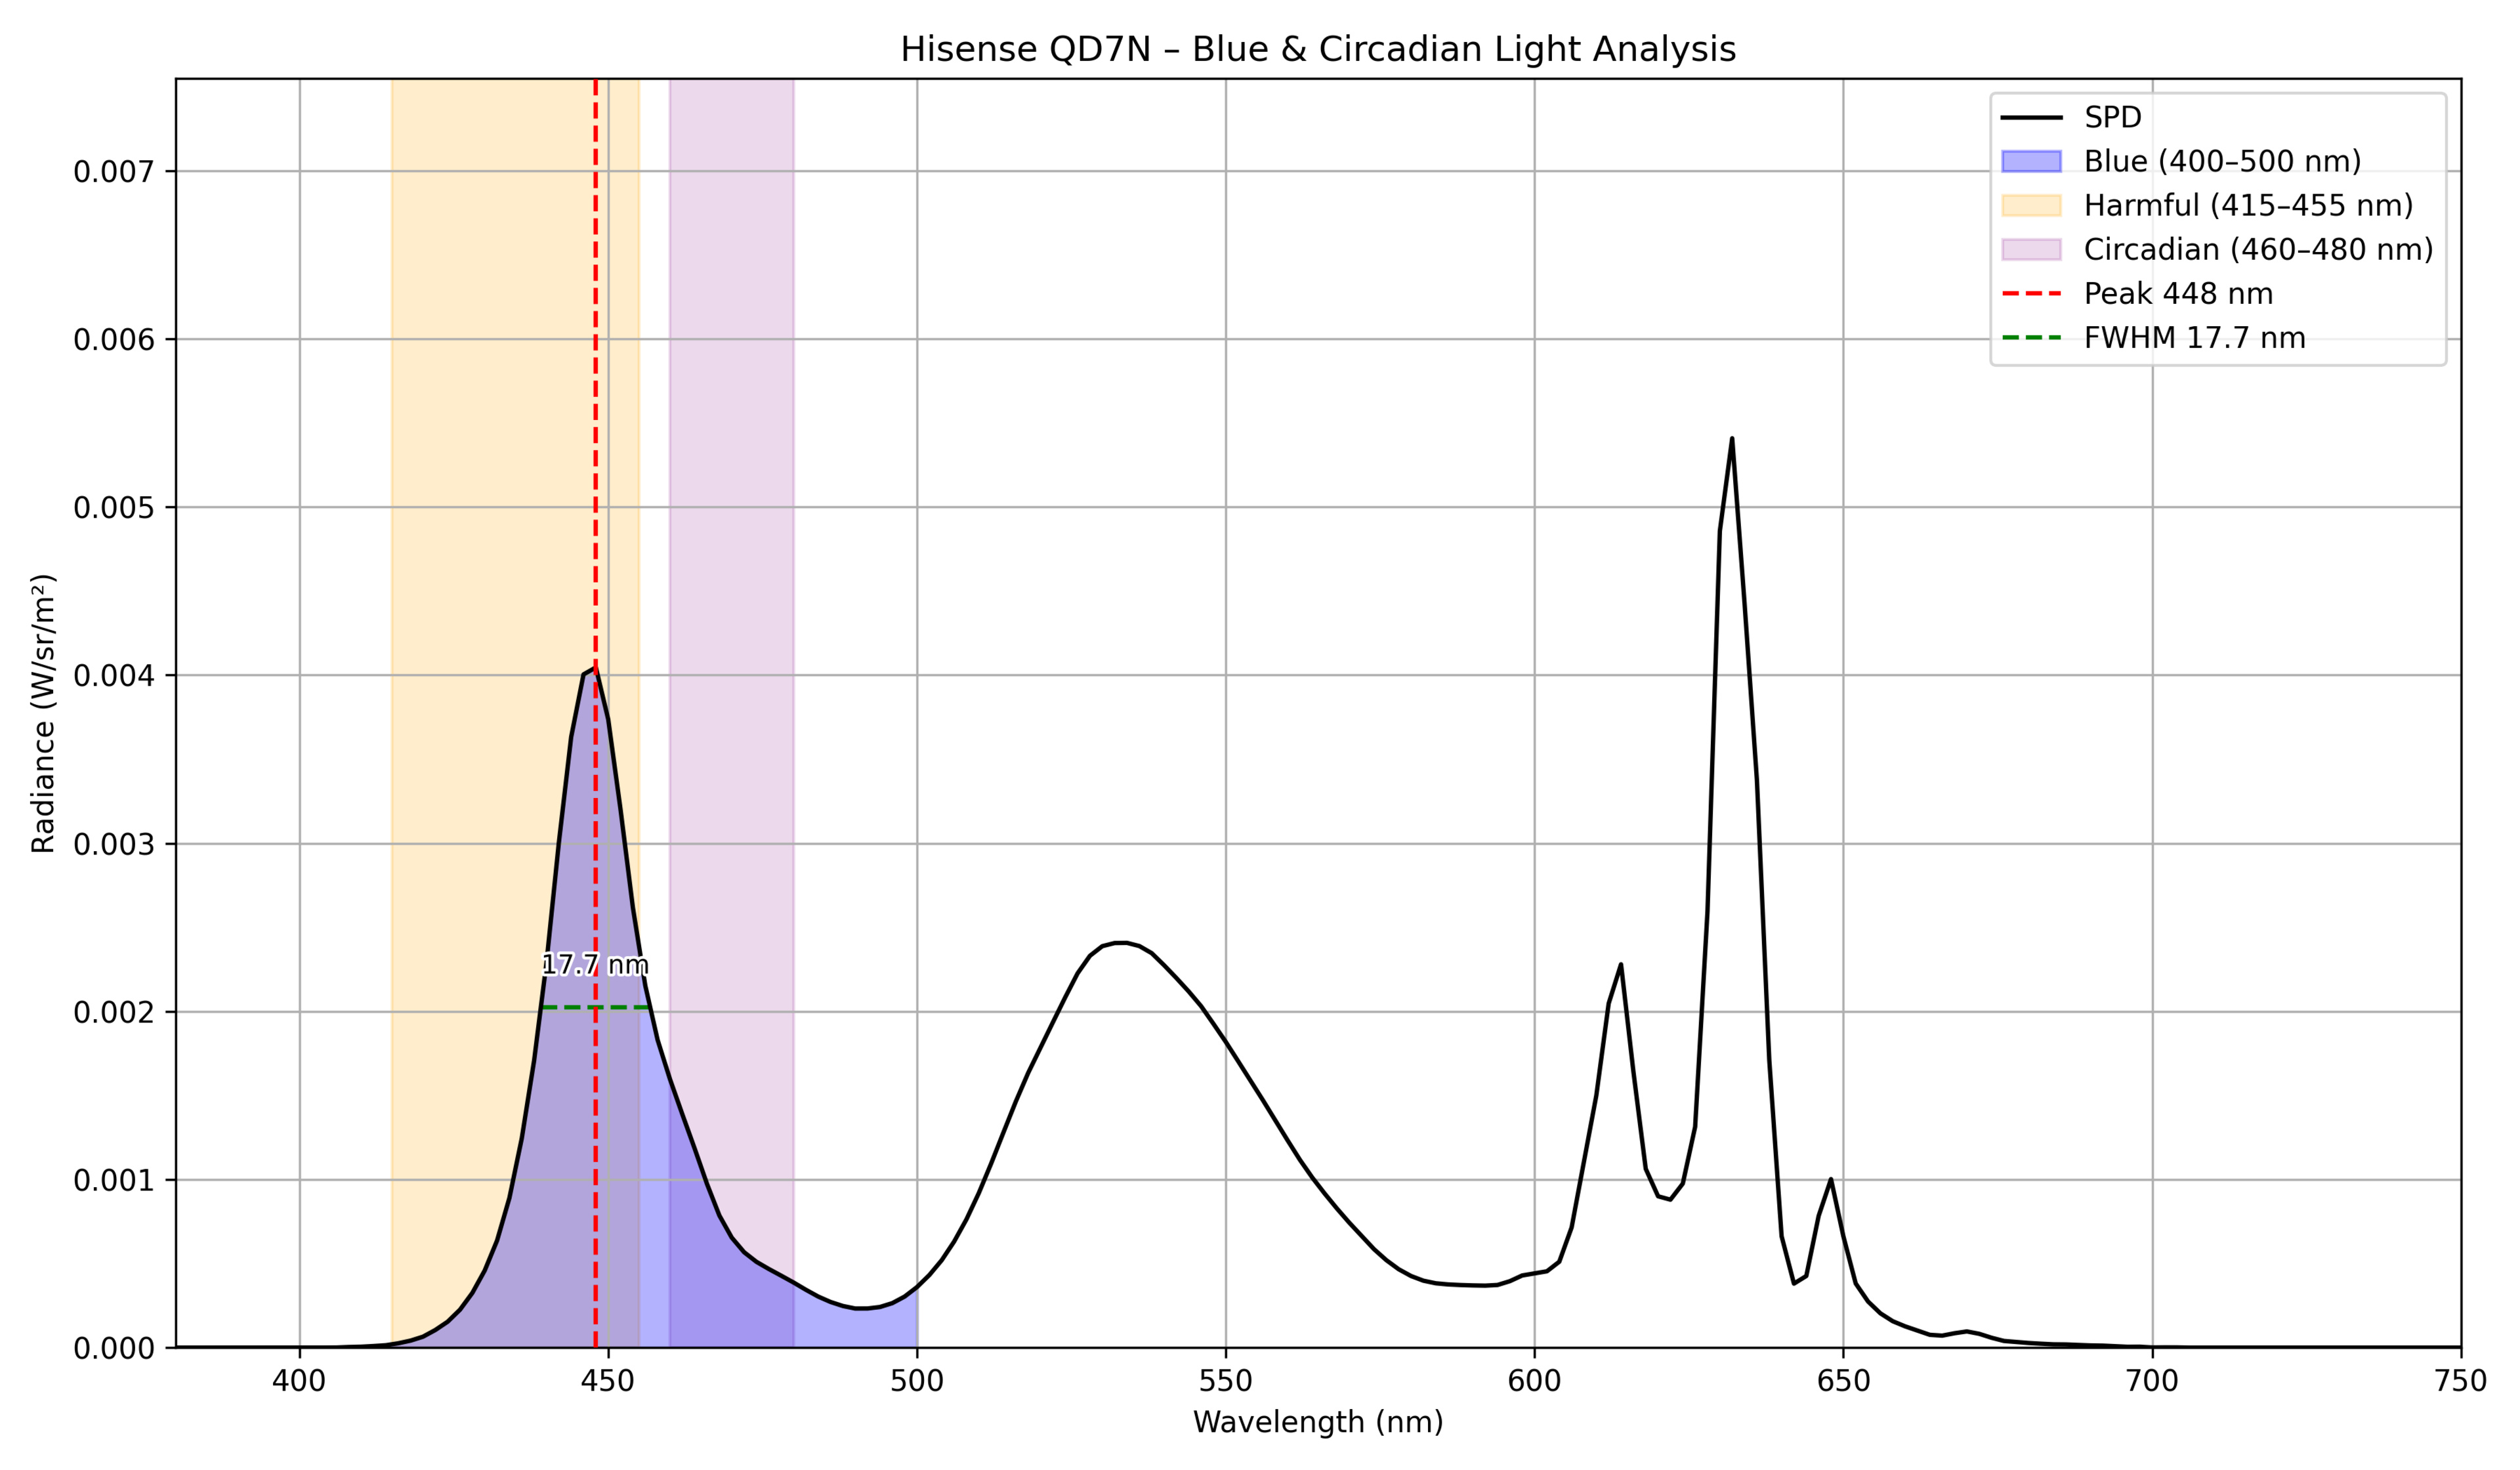 |
448 | 17.7 | 64.78 | 16.57 | 0.095974 |
| Hisense QD7QF |  |
448 | 17 | 65.95 | 15.61 | 0.095143 |
| Hisense U65QF | 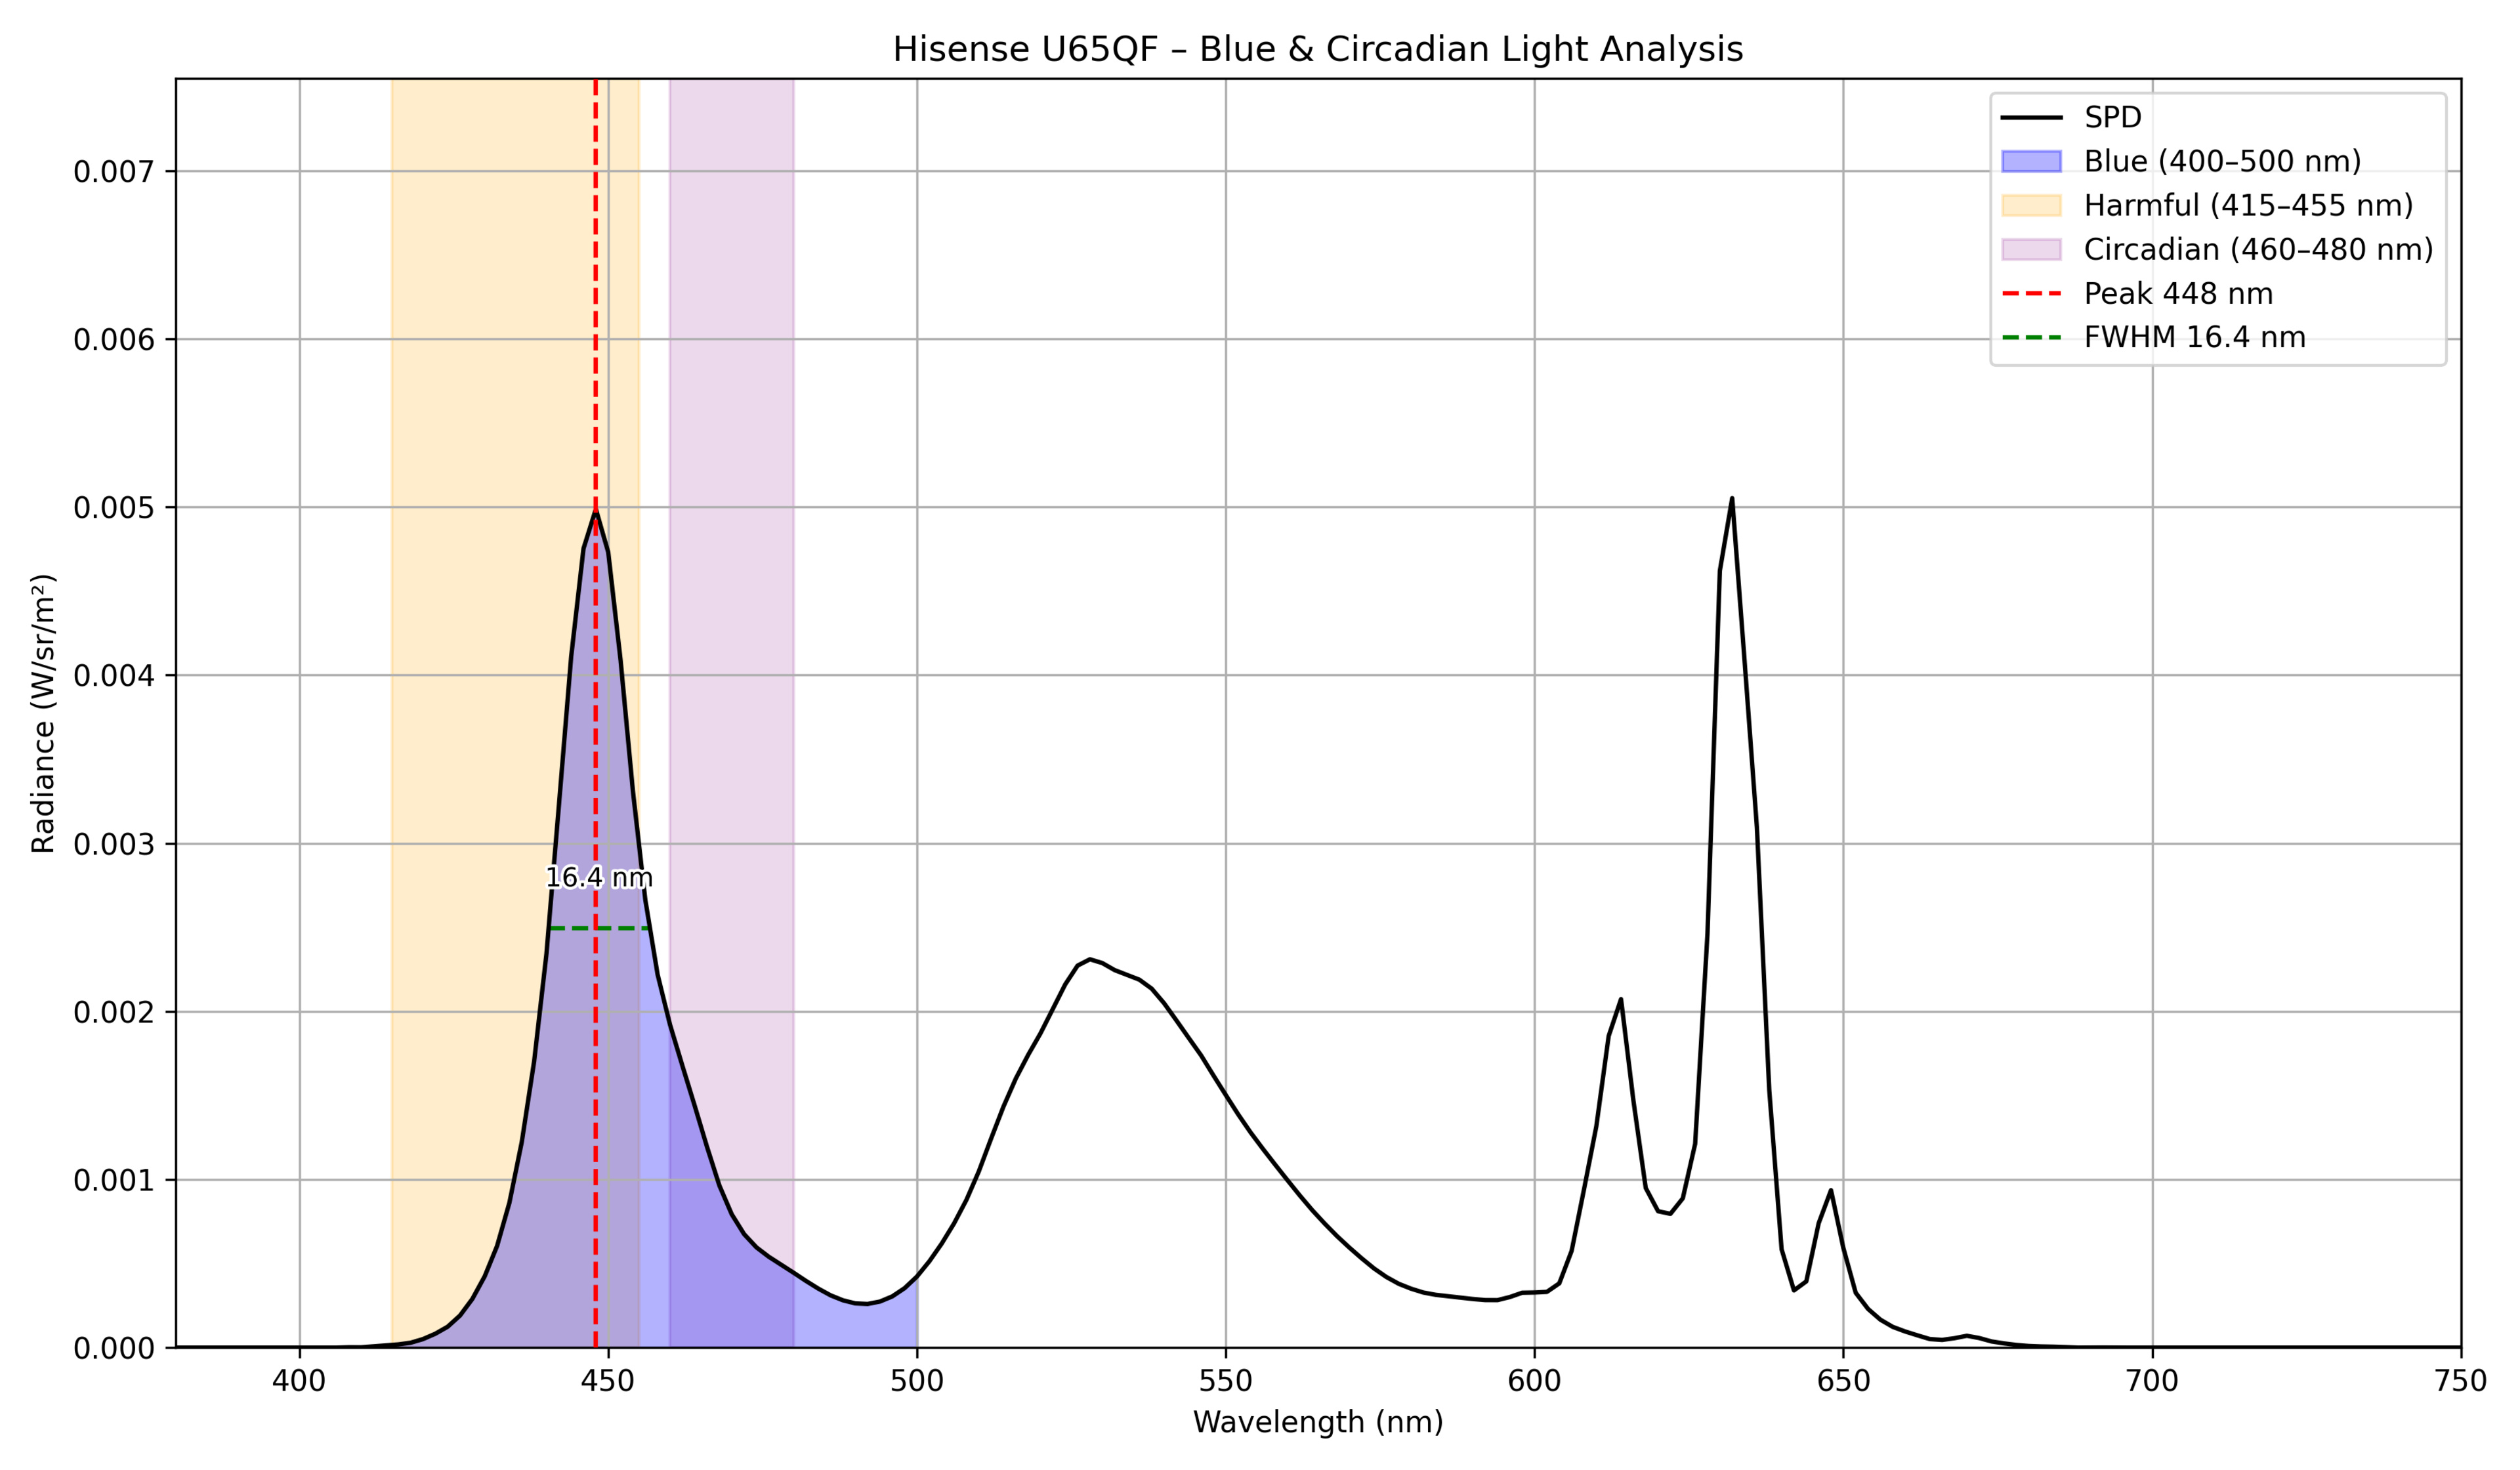 |
448 | 16.4 | 63.58 | 17.12 | 0.111601 |
| Hisense U6N | 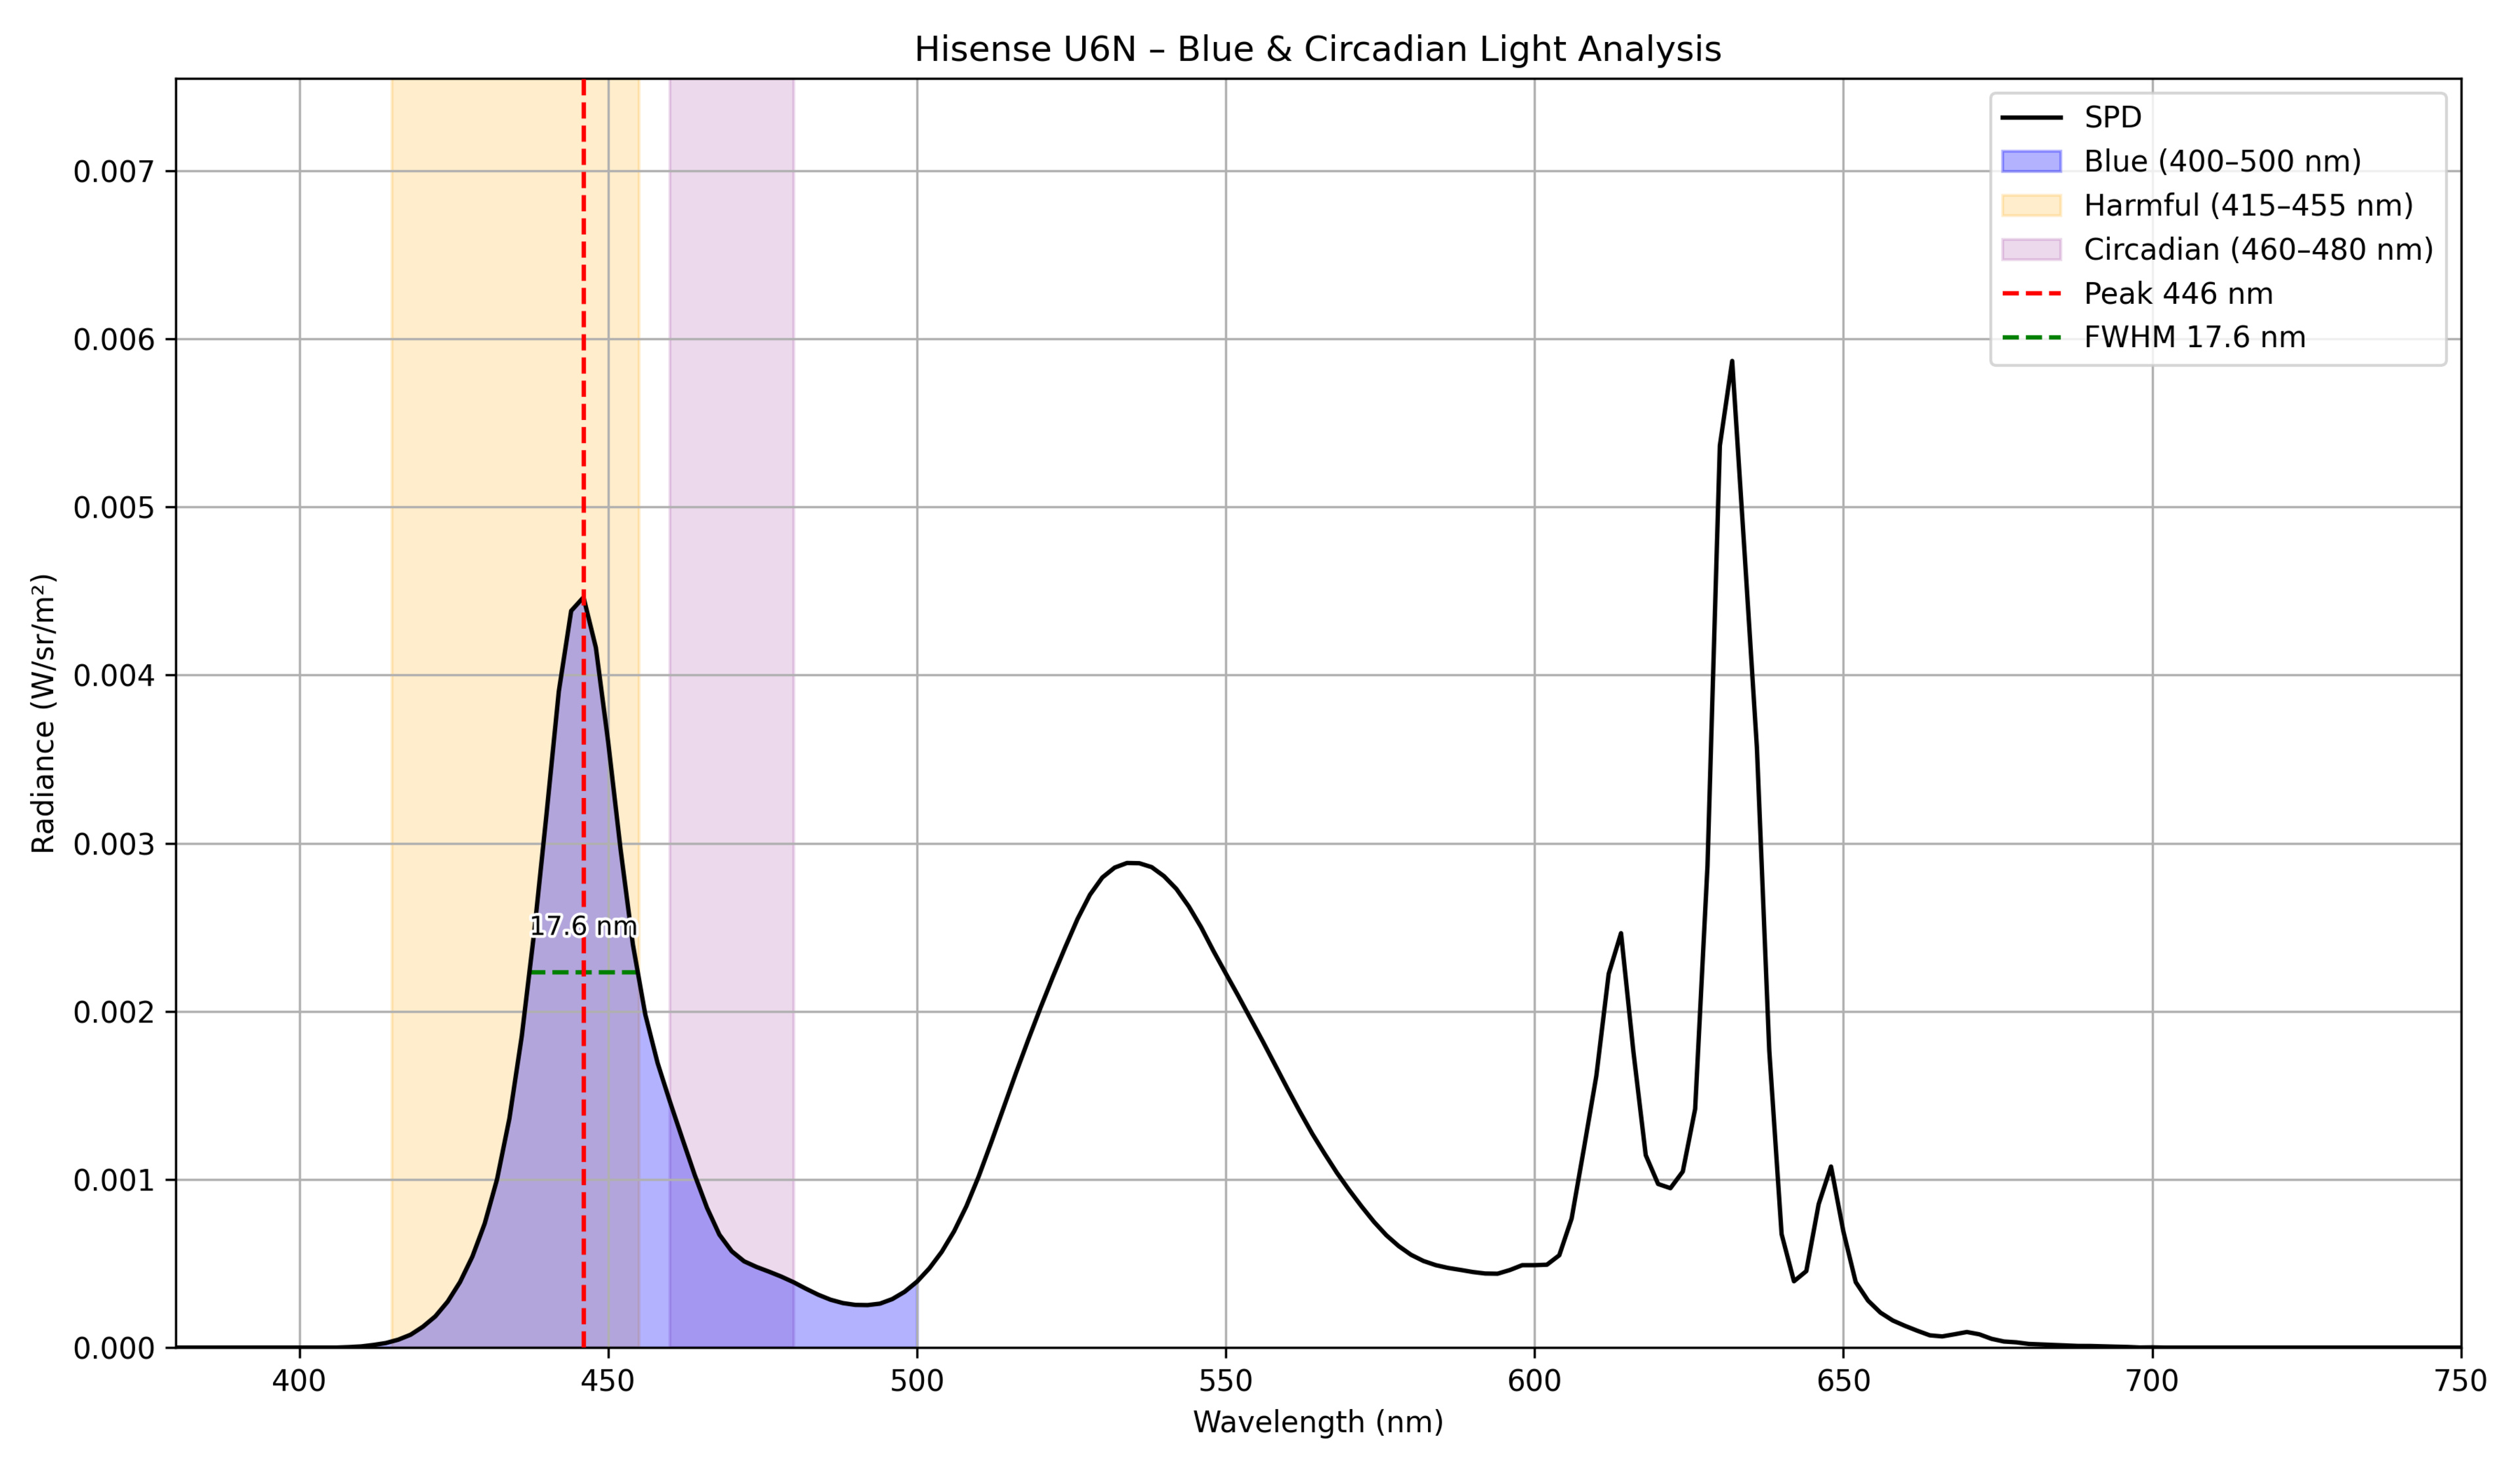 |
446 | 17.6 | 69.99 | 13.55 | 0.105401 |
| Hisense U75QG | 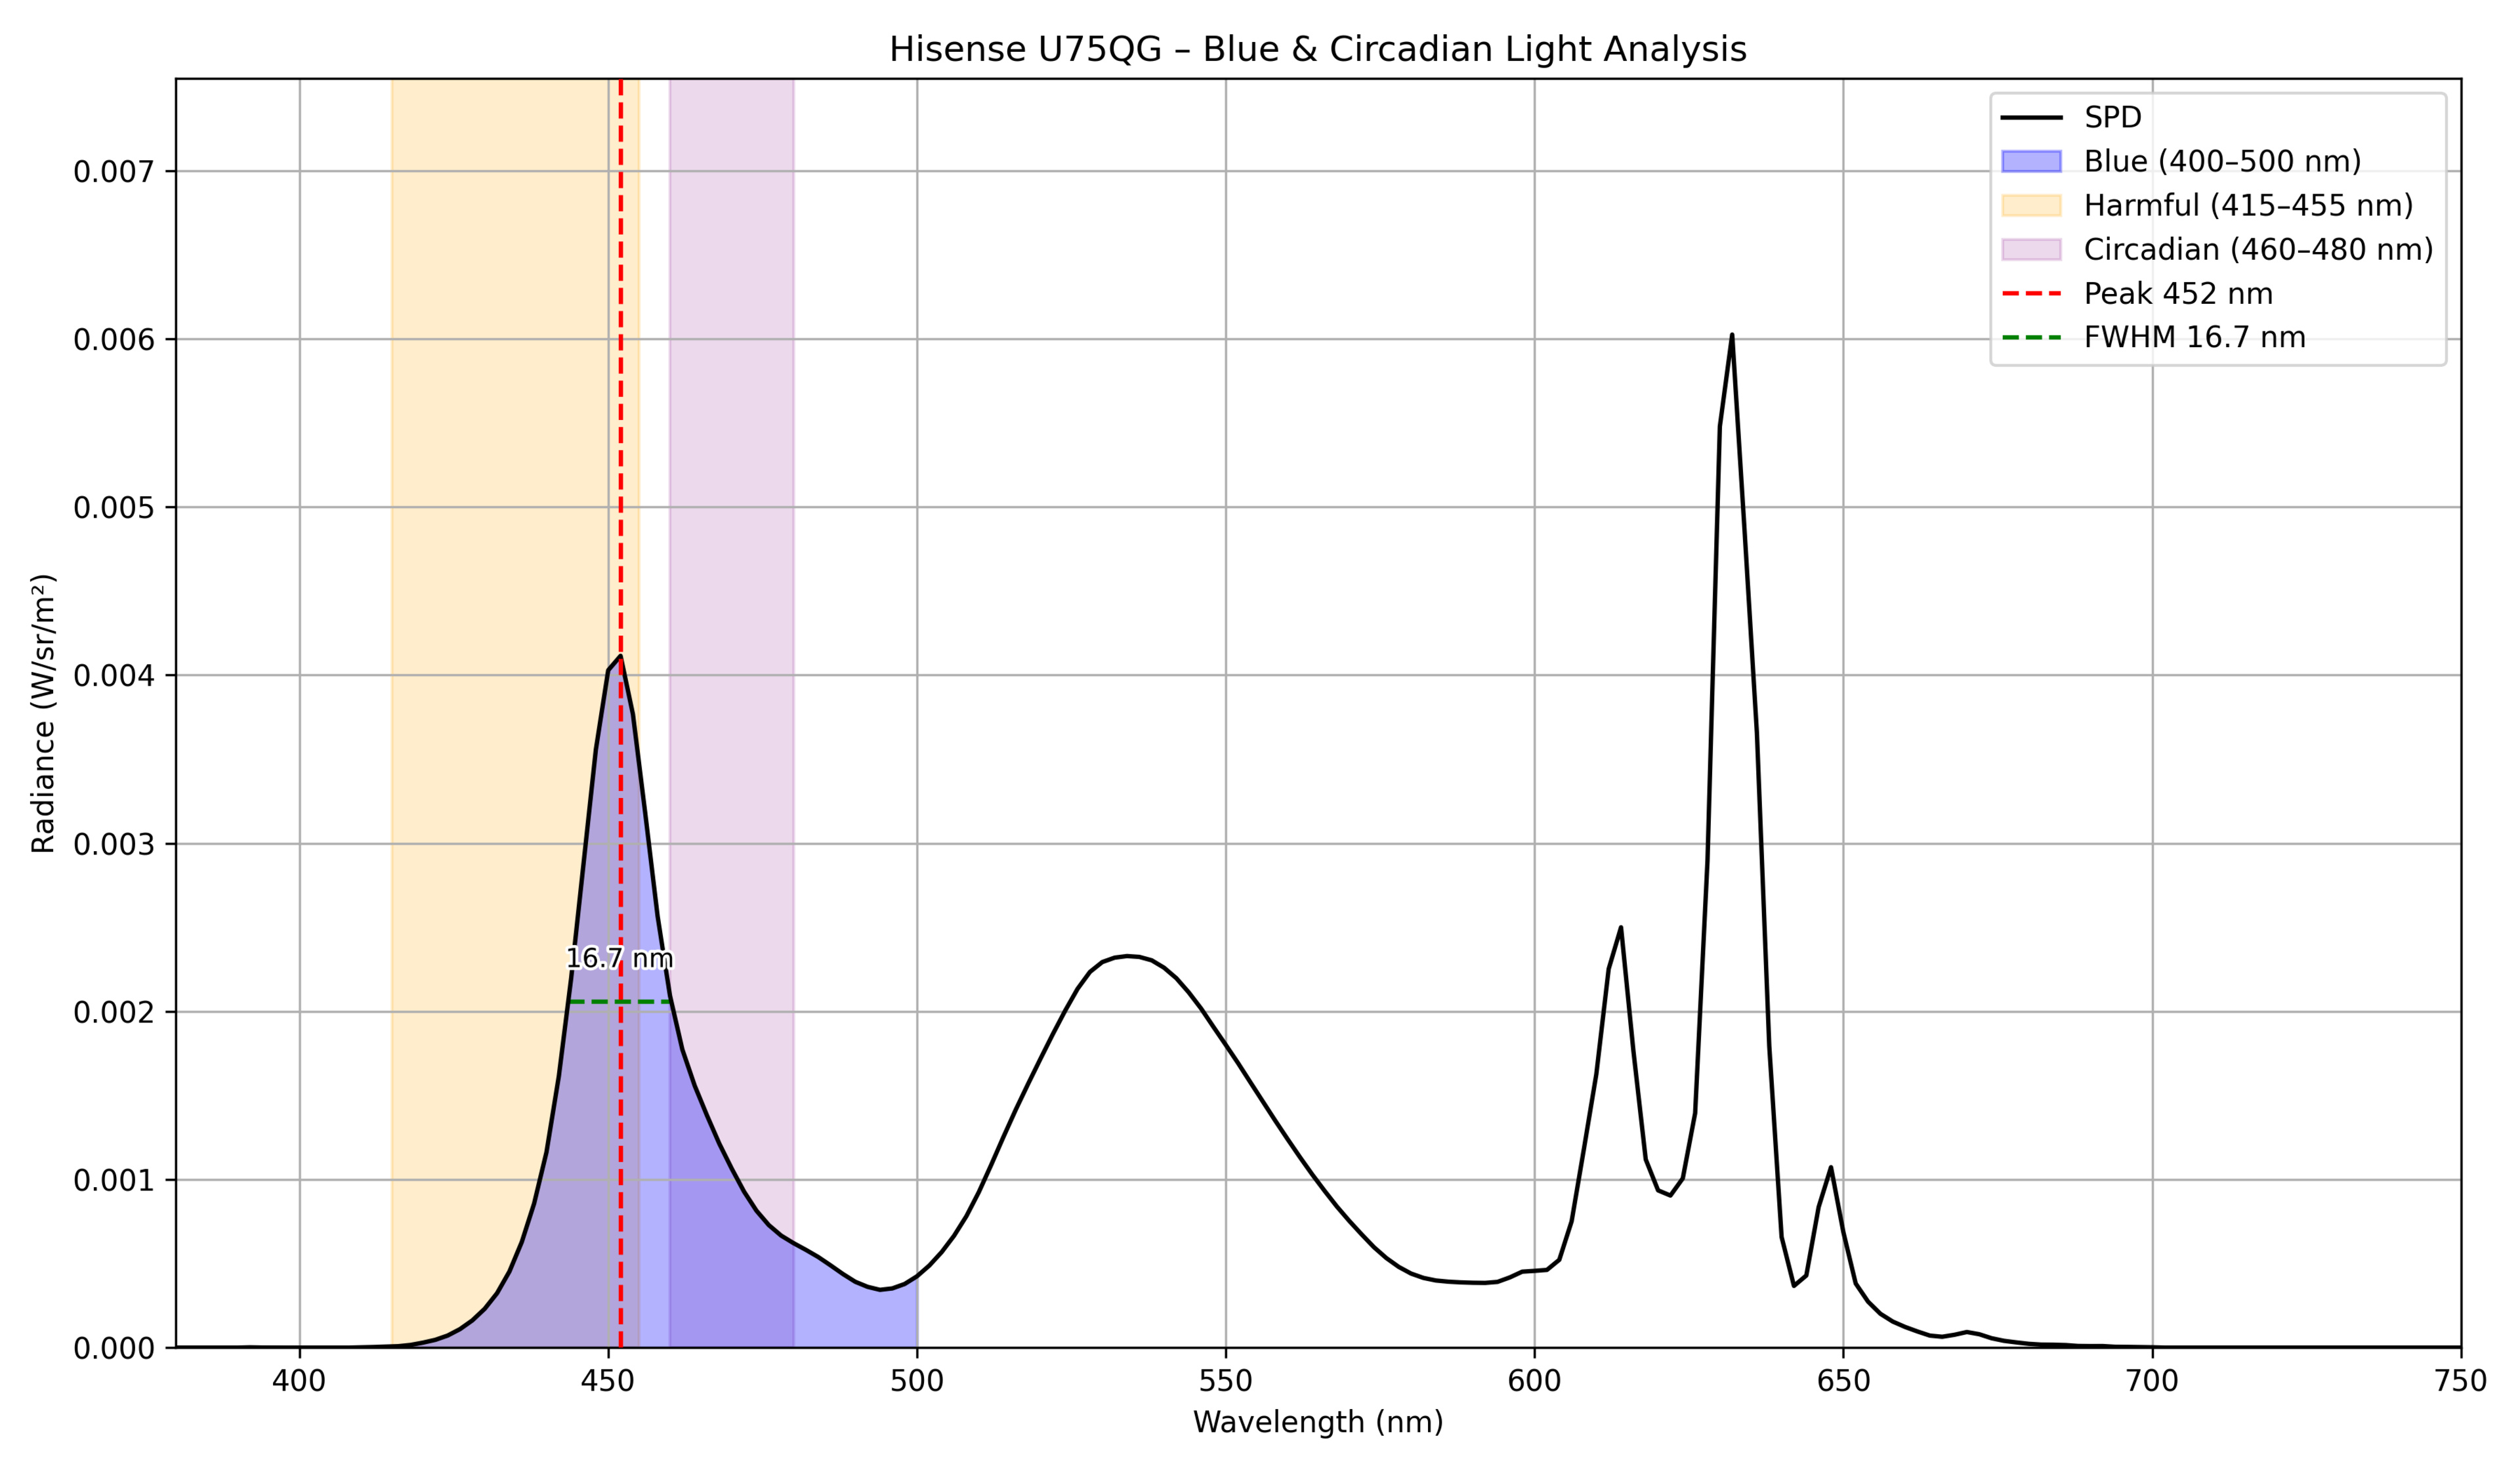 |
452 | 16.7 | 49.79 | 23.46 | 0.097879 |
| Hisense U7N | 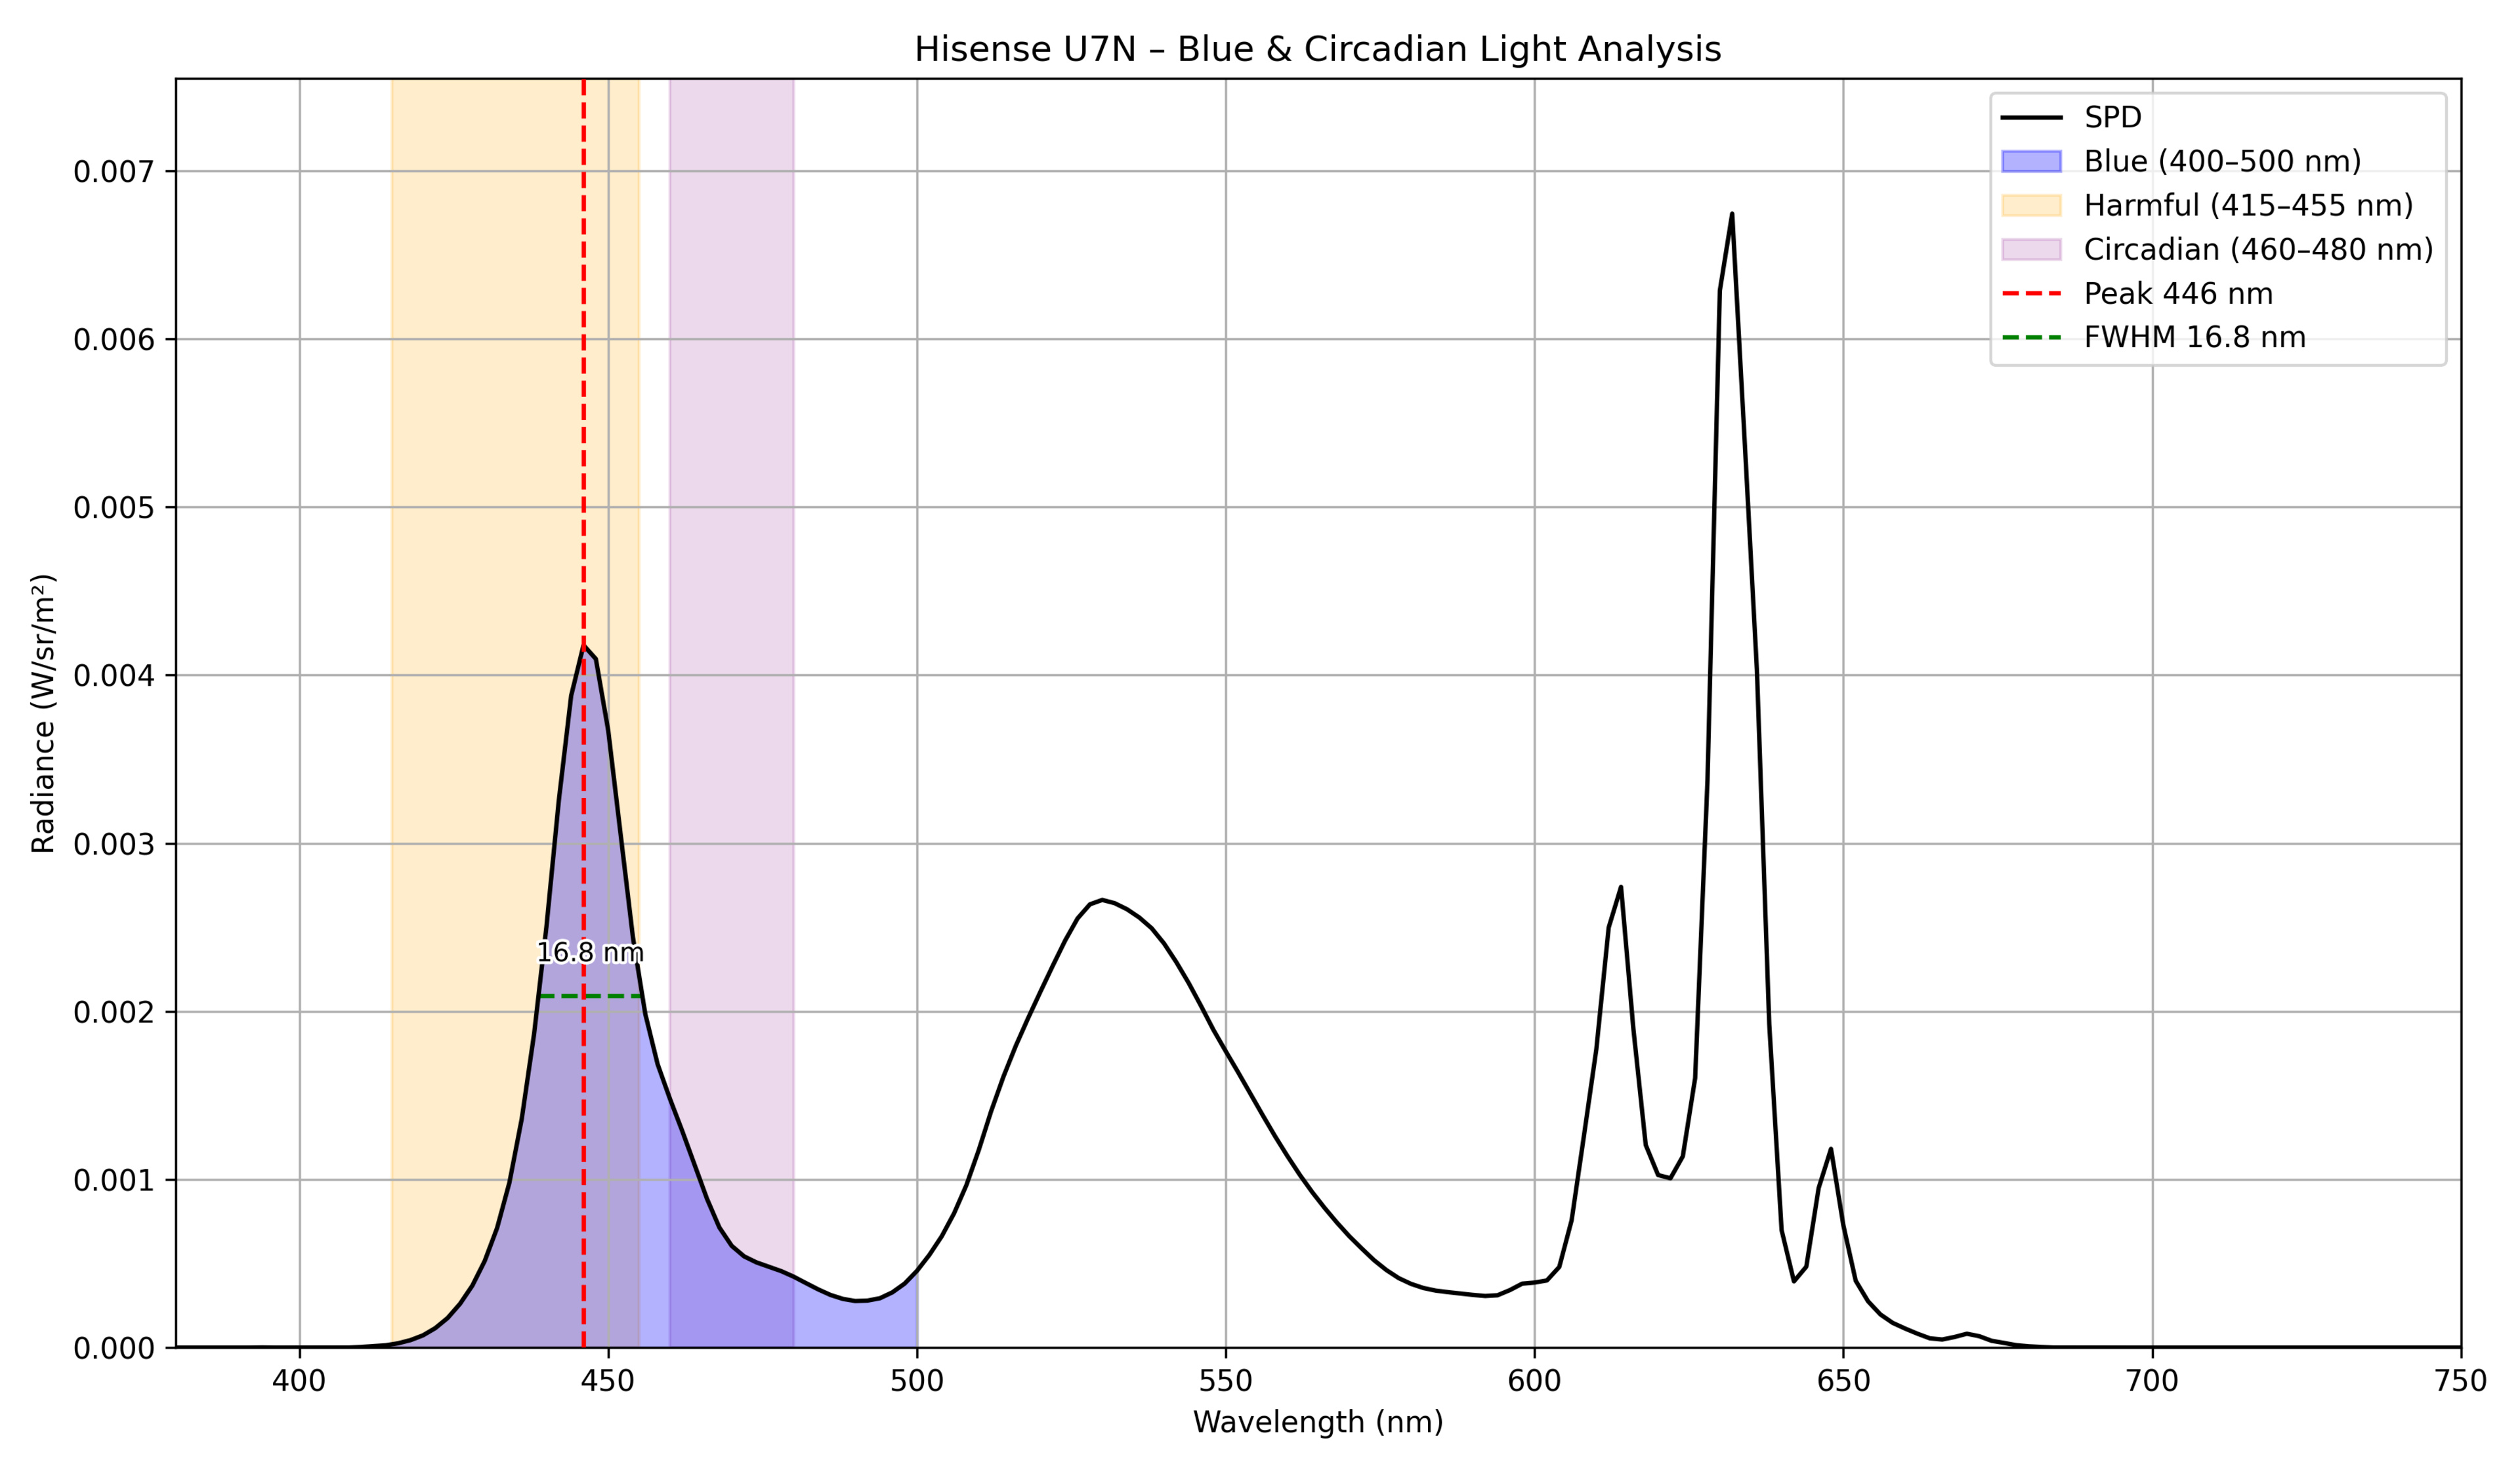 |
446 | 16.8 | 66.2 | 15.38 | 0.097727 |
| Hisense U8N | 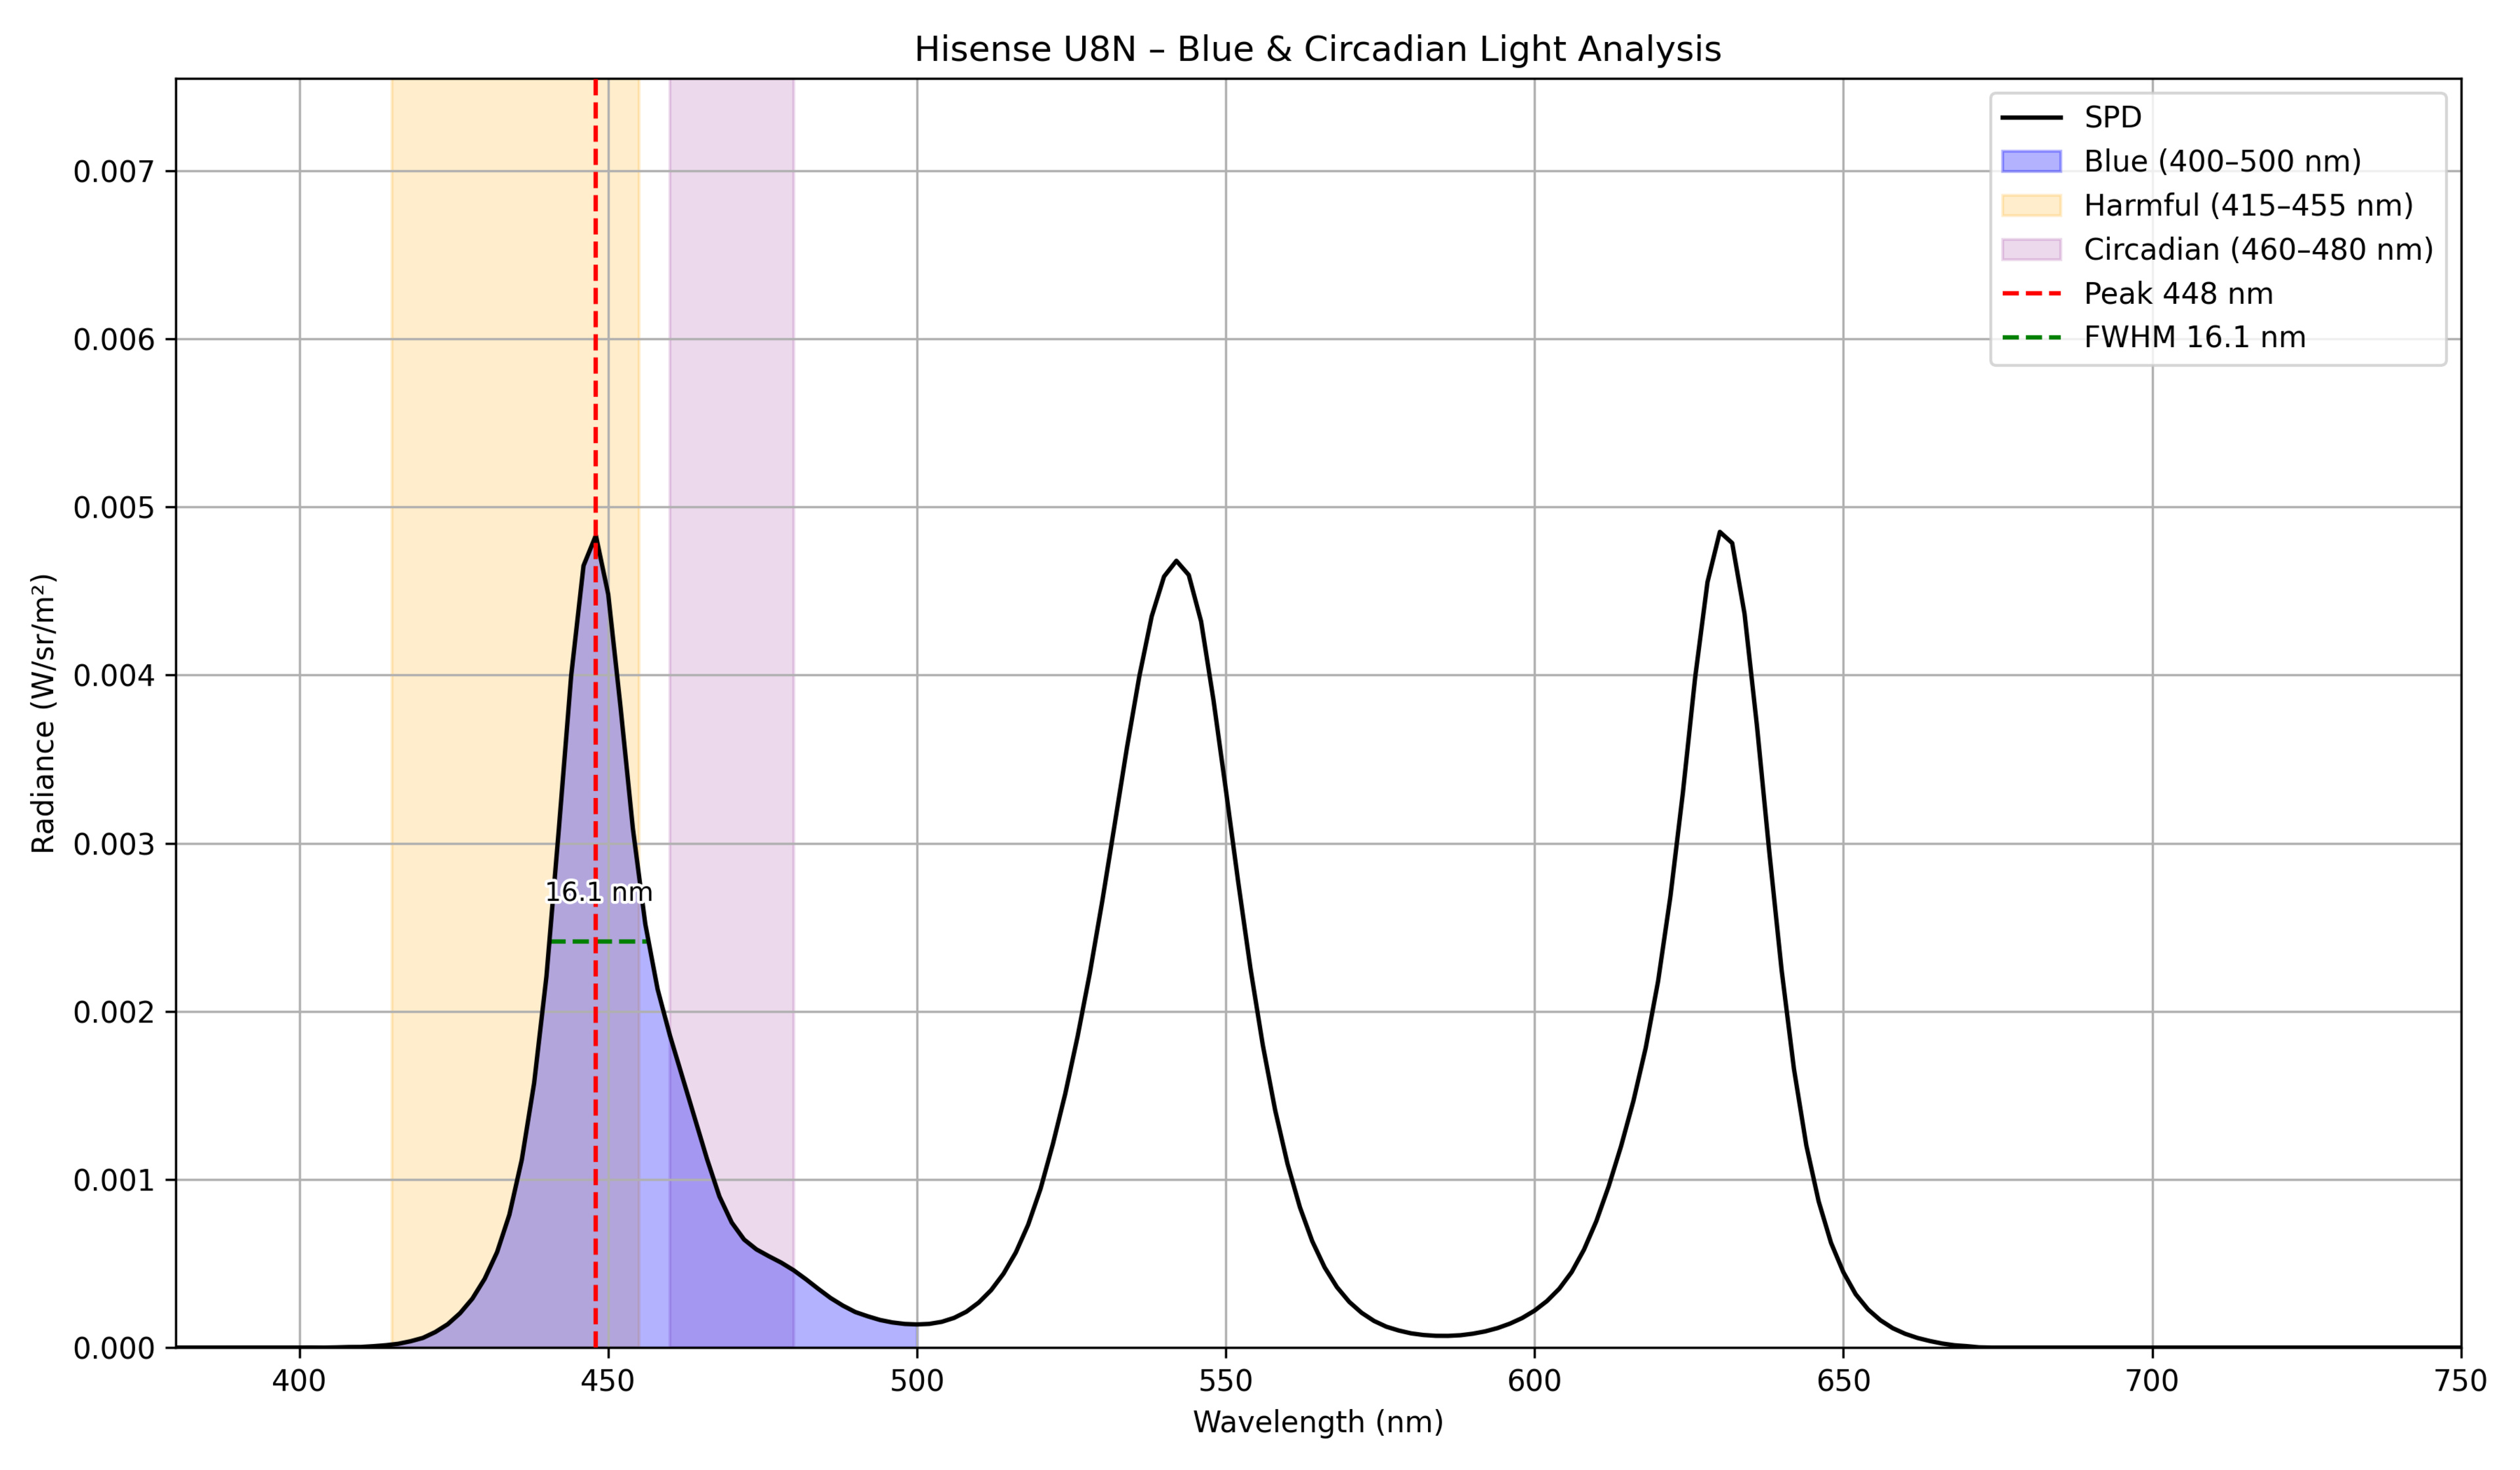 |
448 | 16.1 | 64.33 | 17.42 | 0.105386 |
| Hisense U8QG | 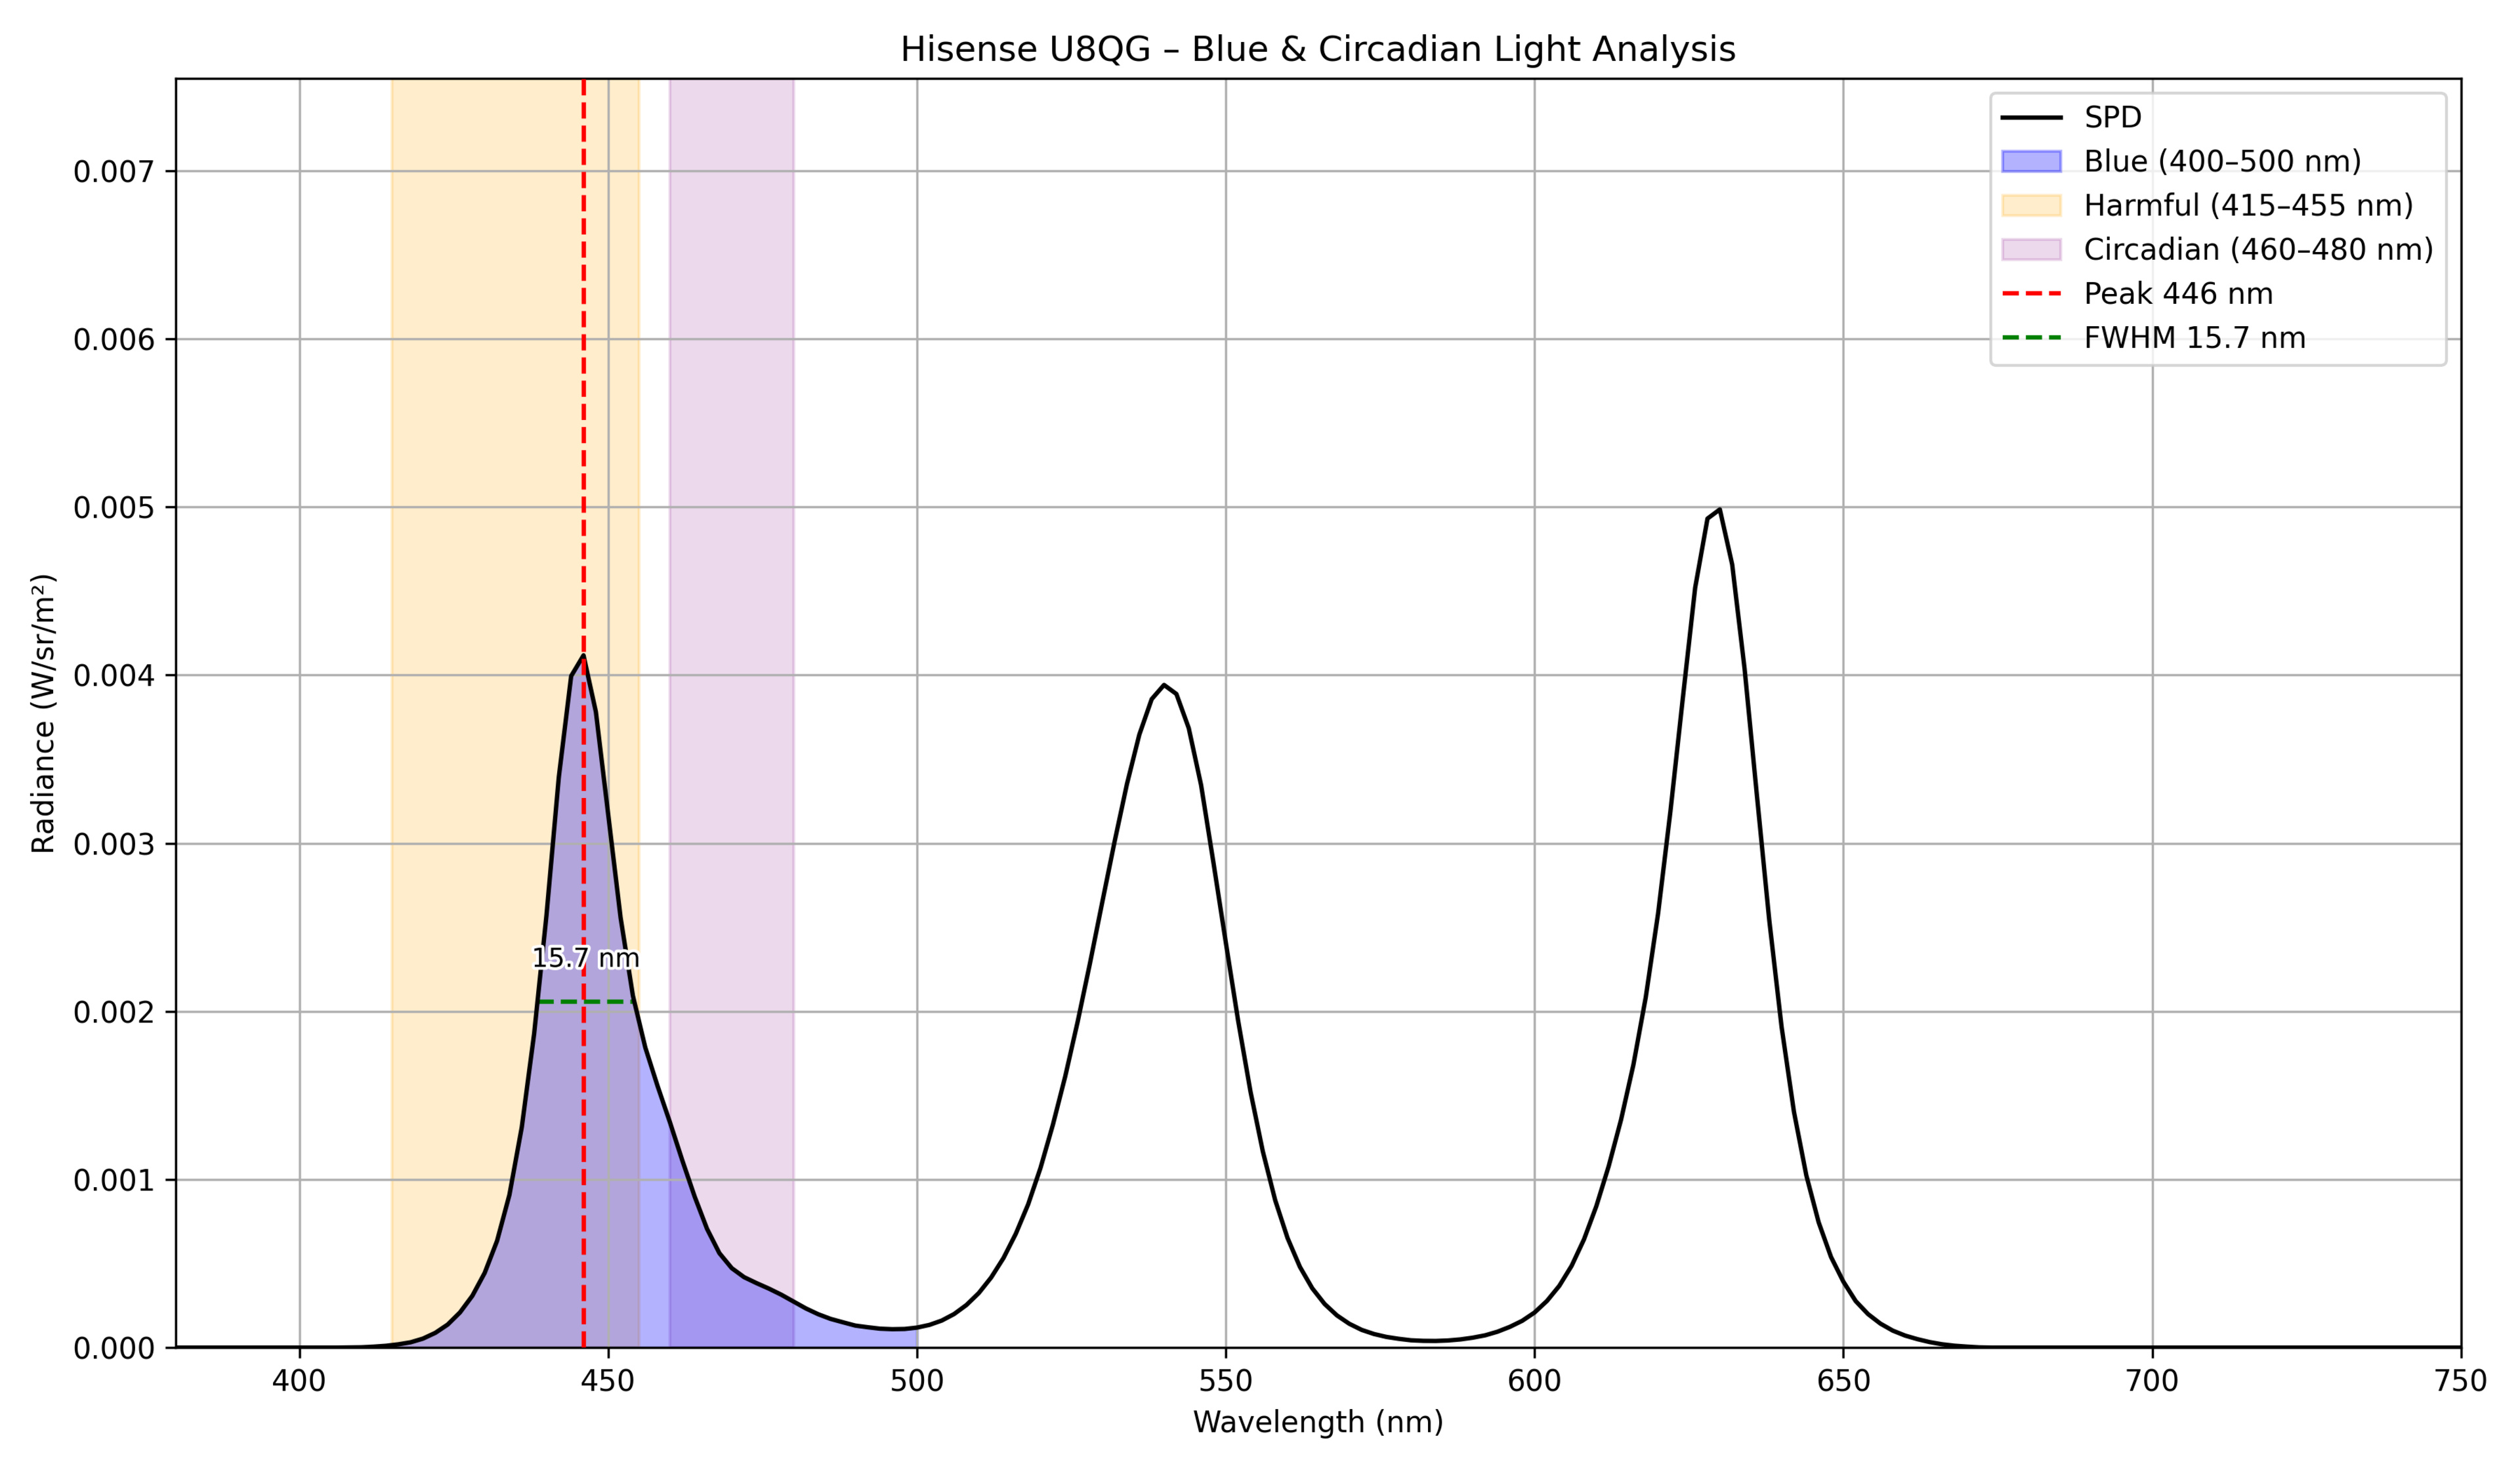 |
446 | 15.7 | 70.78 | 13.93 | 0.086574 |
| Hisense U9N |  |
448 | 16.3 | 64.88 | 16.94 | 0.095286 |
| LG QNED85A | 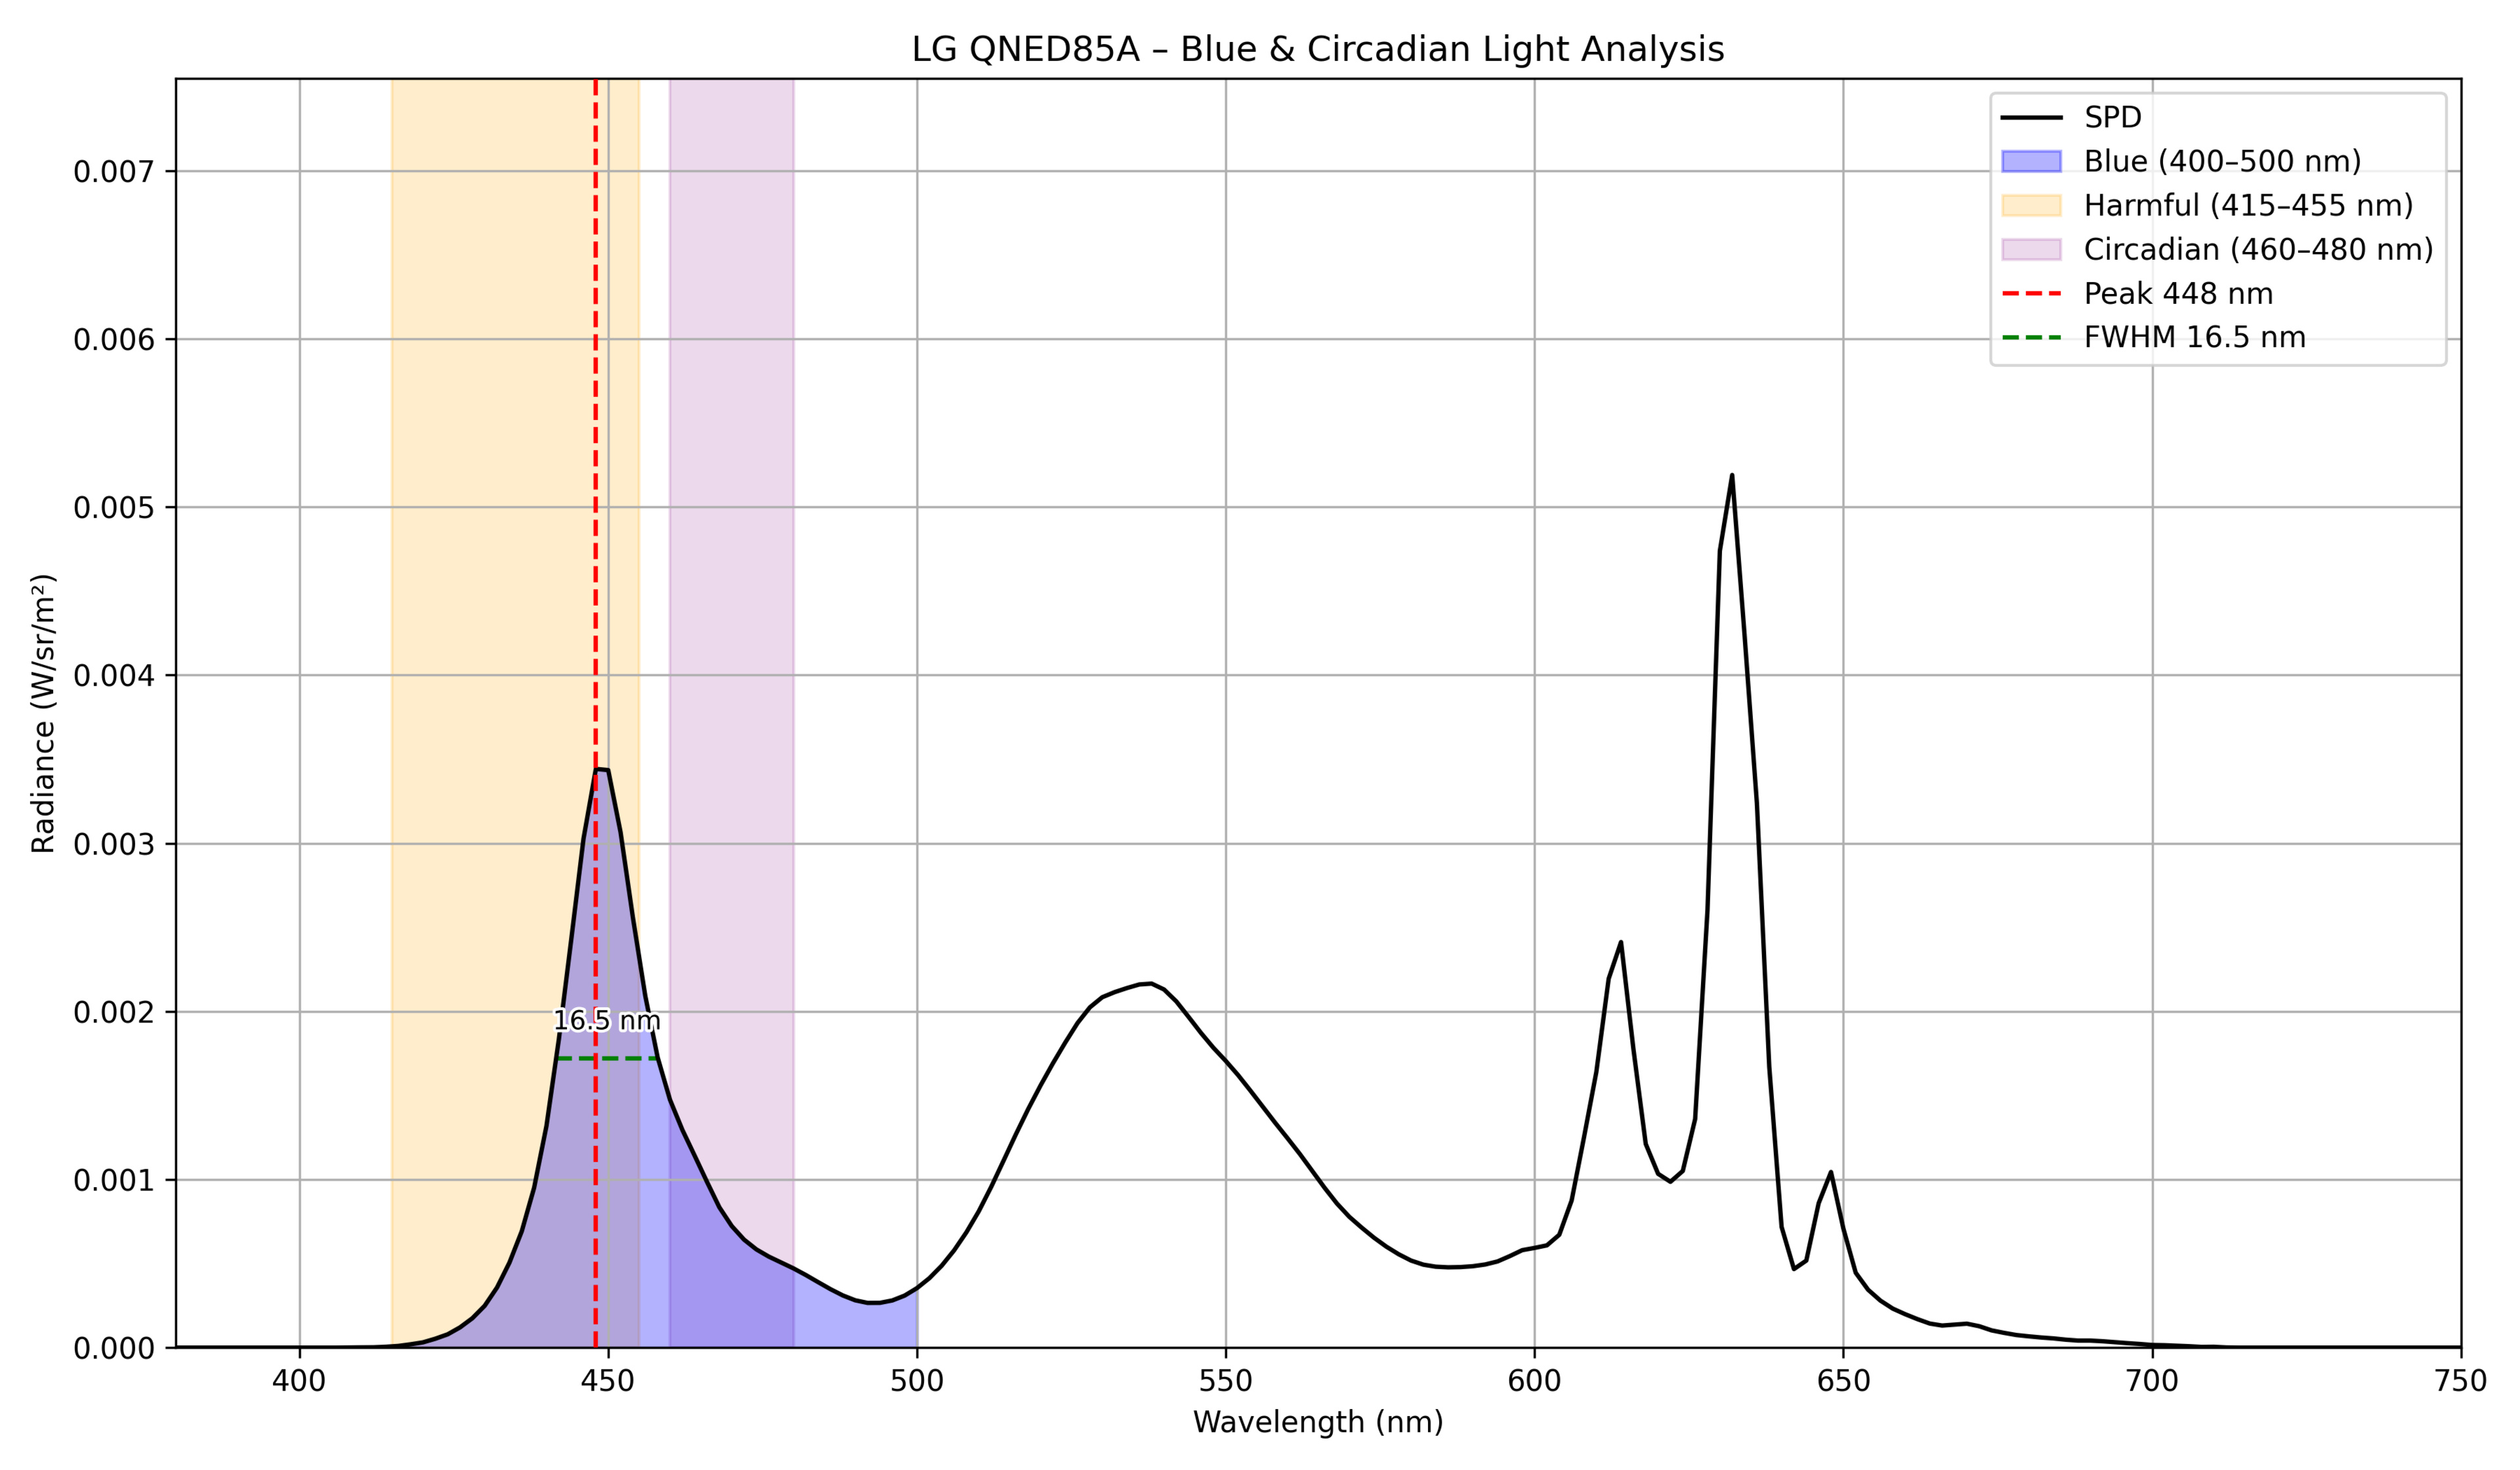 |
448 | 16.5 | 57.04 | 20.35 | 0.080865 |
| LG QNED90T | 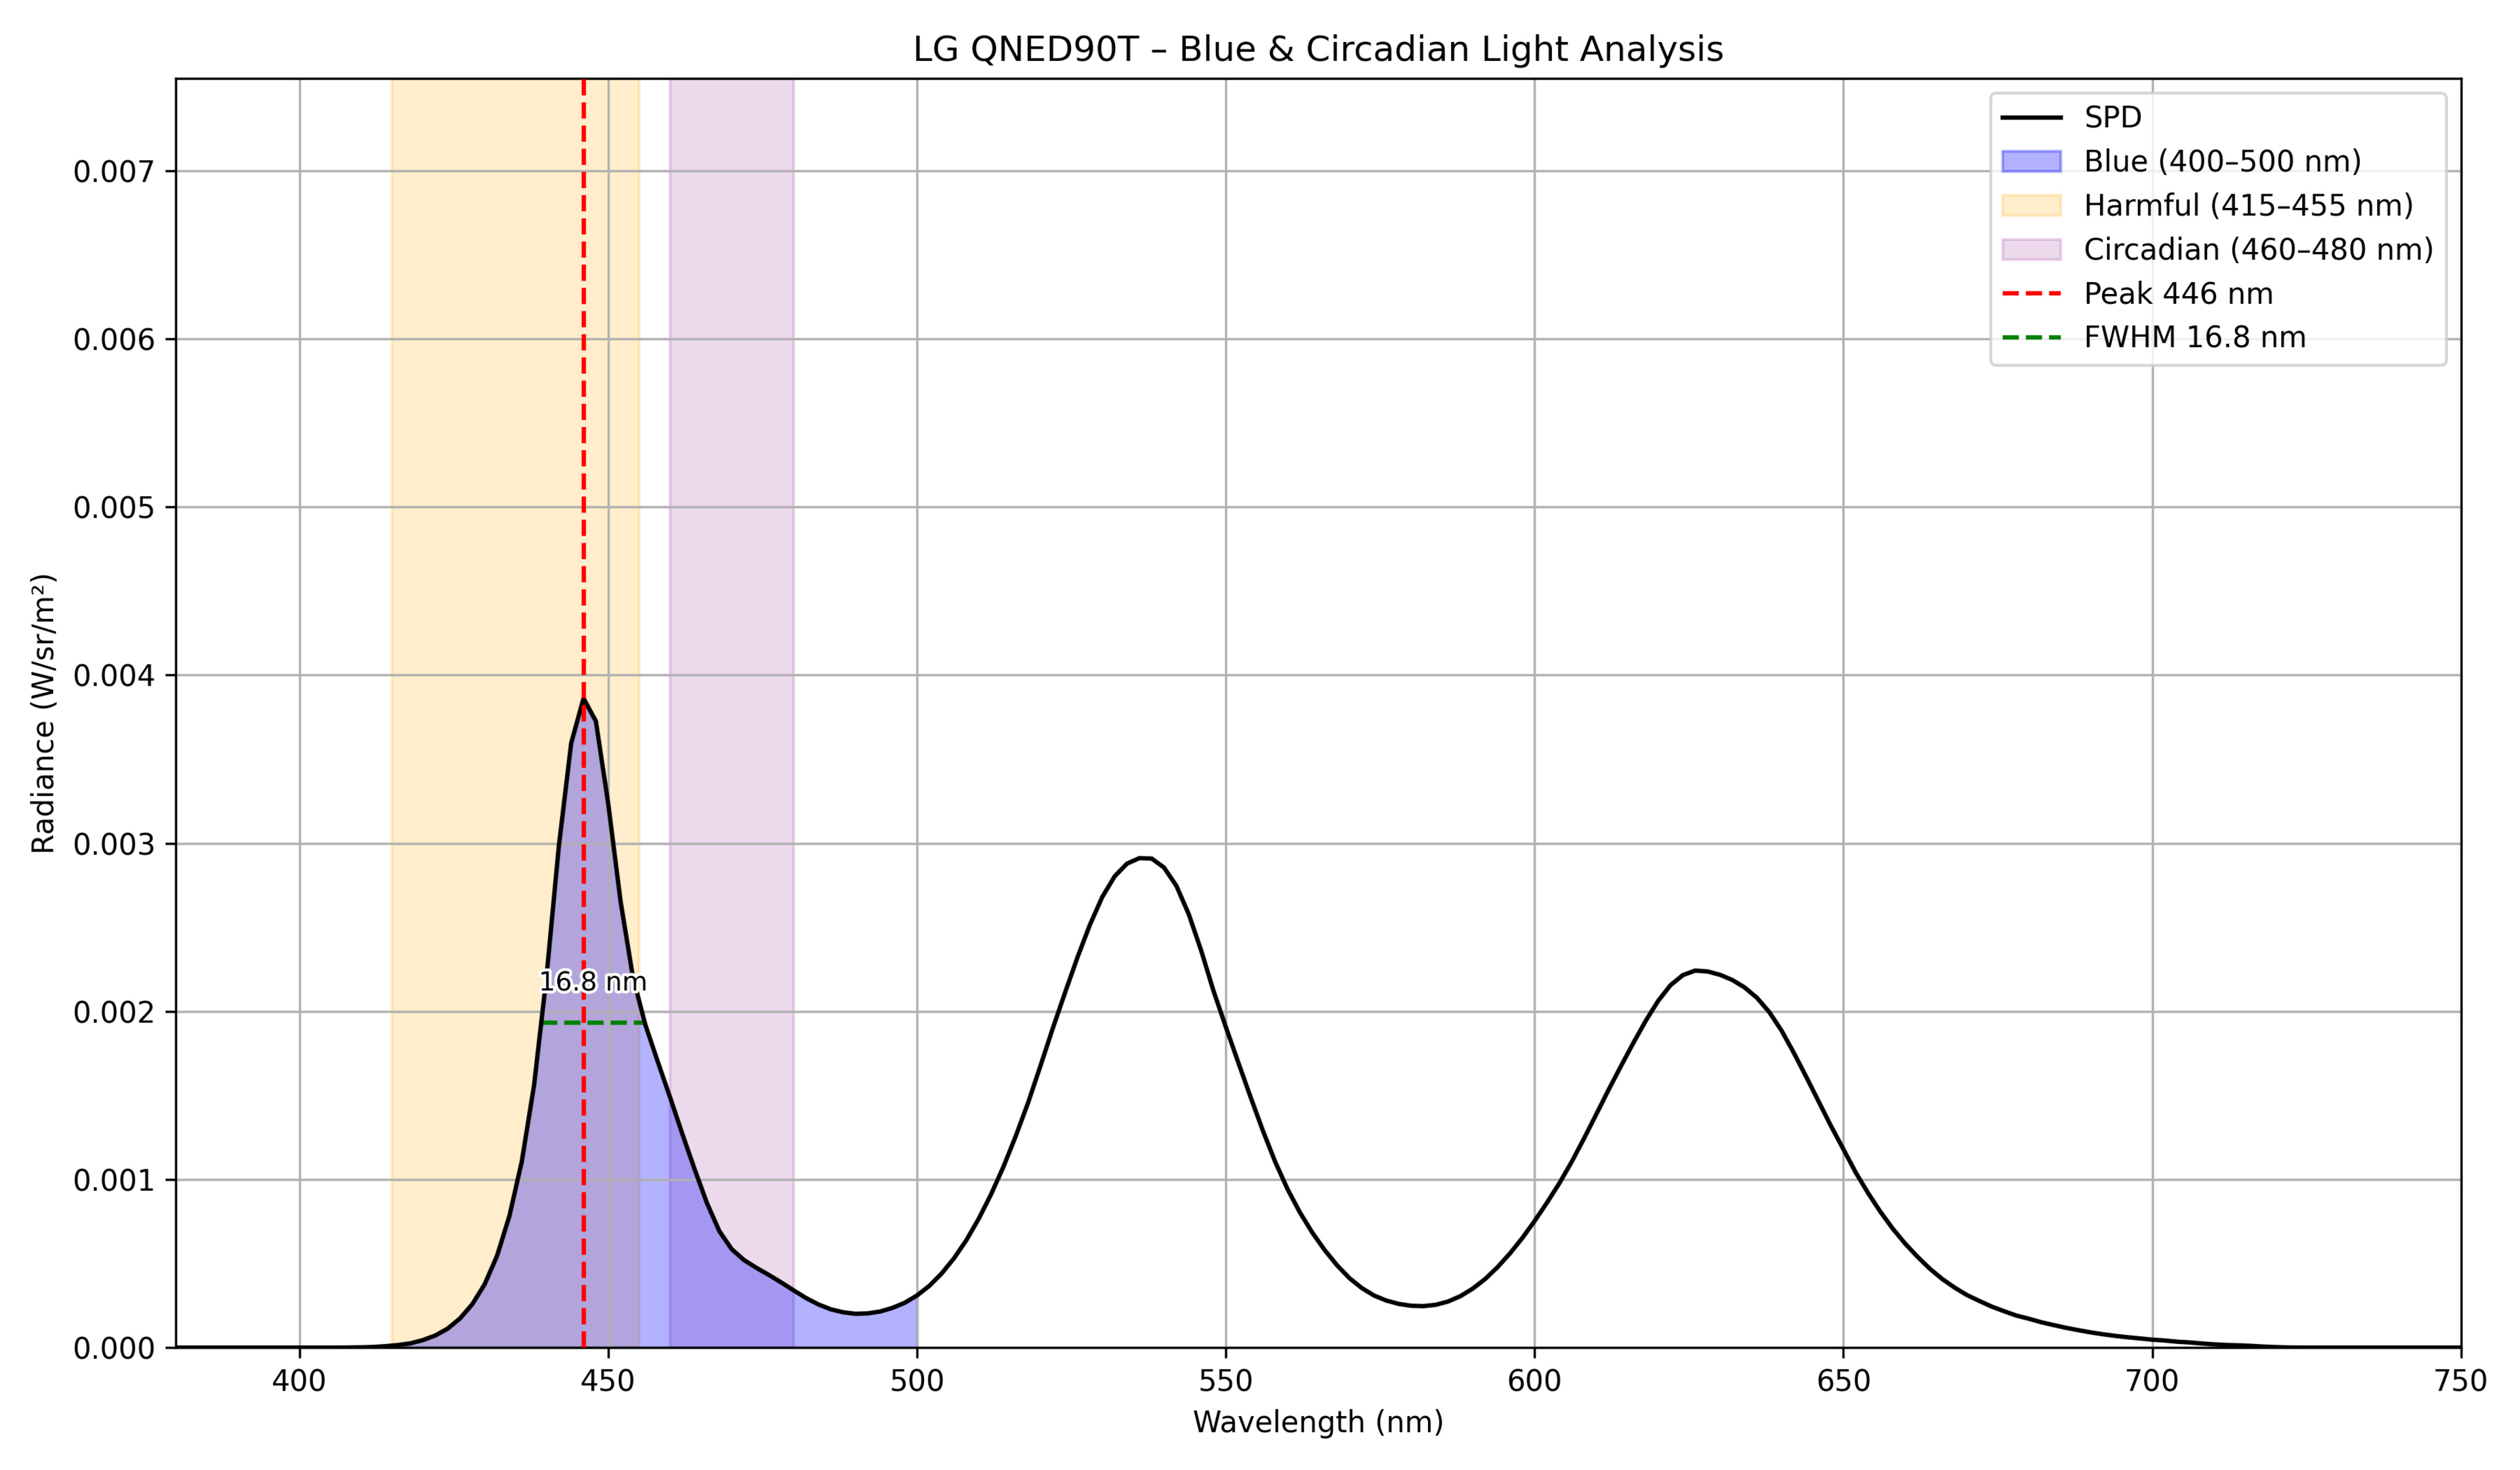 |
446 | 16.8 | 65.27 | 16.52 | 0.087129 |
| LG QNED92A | 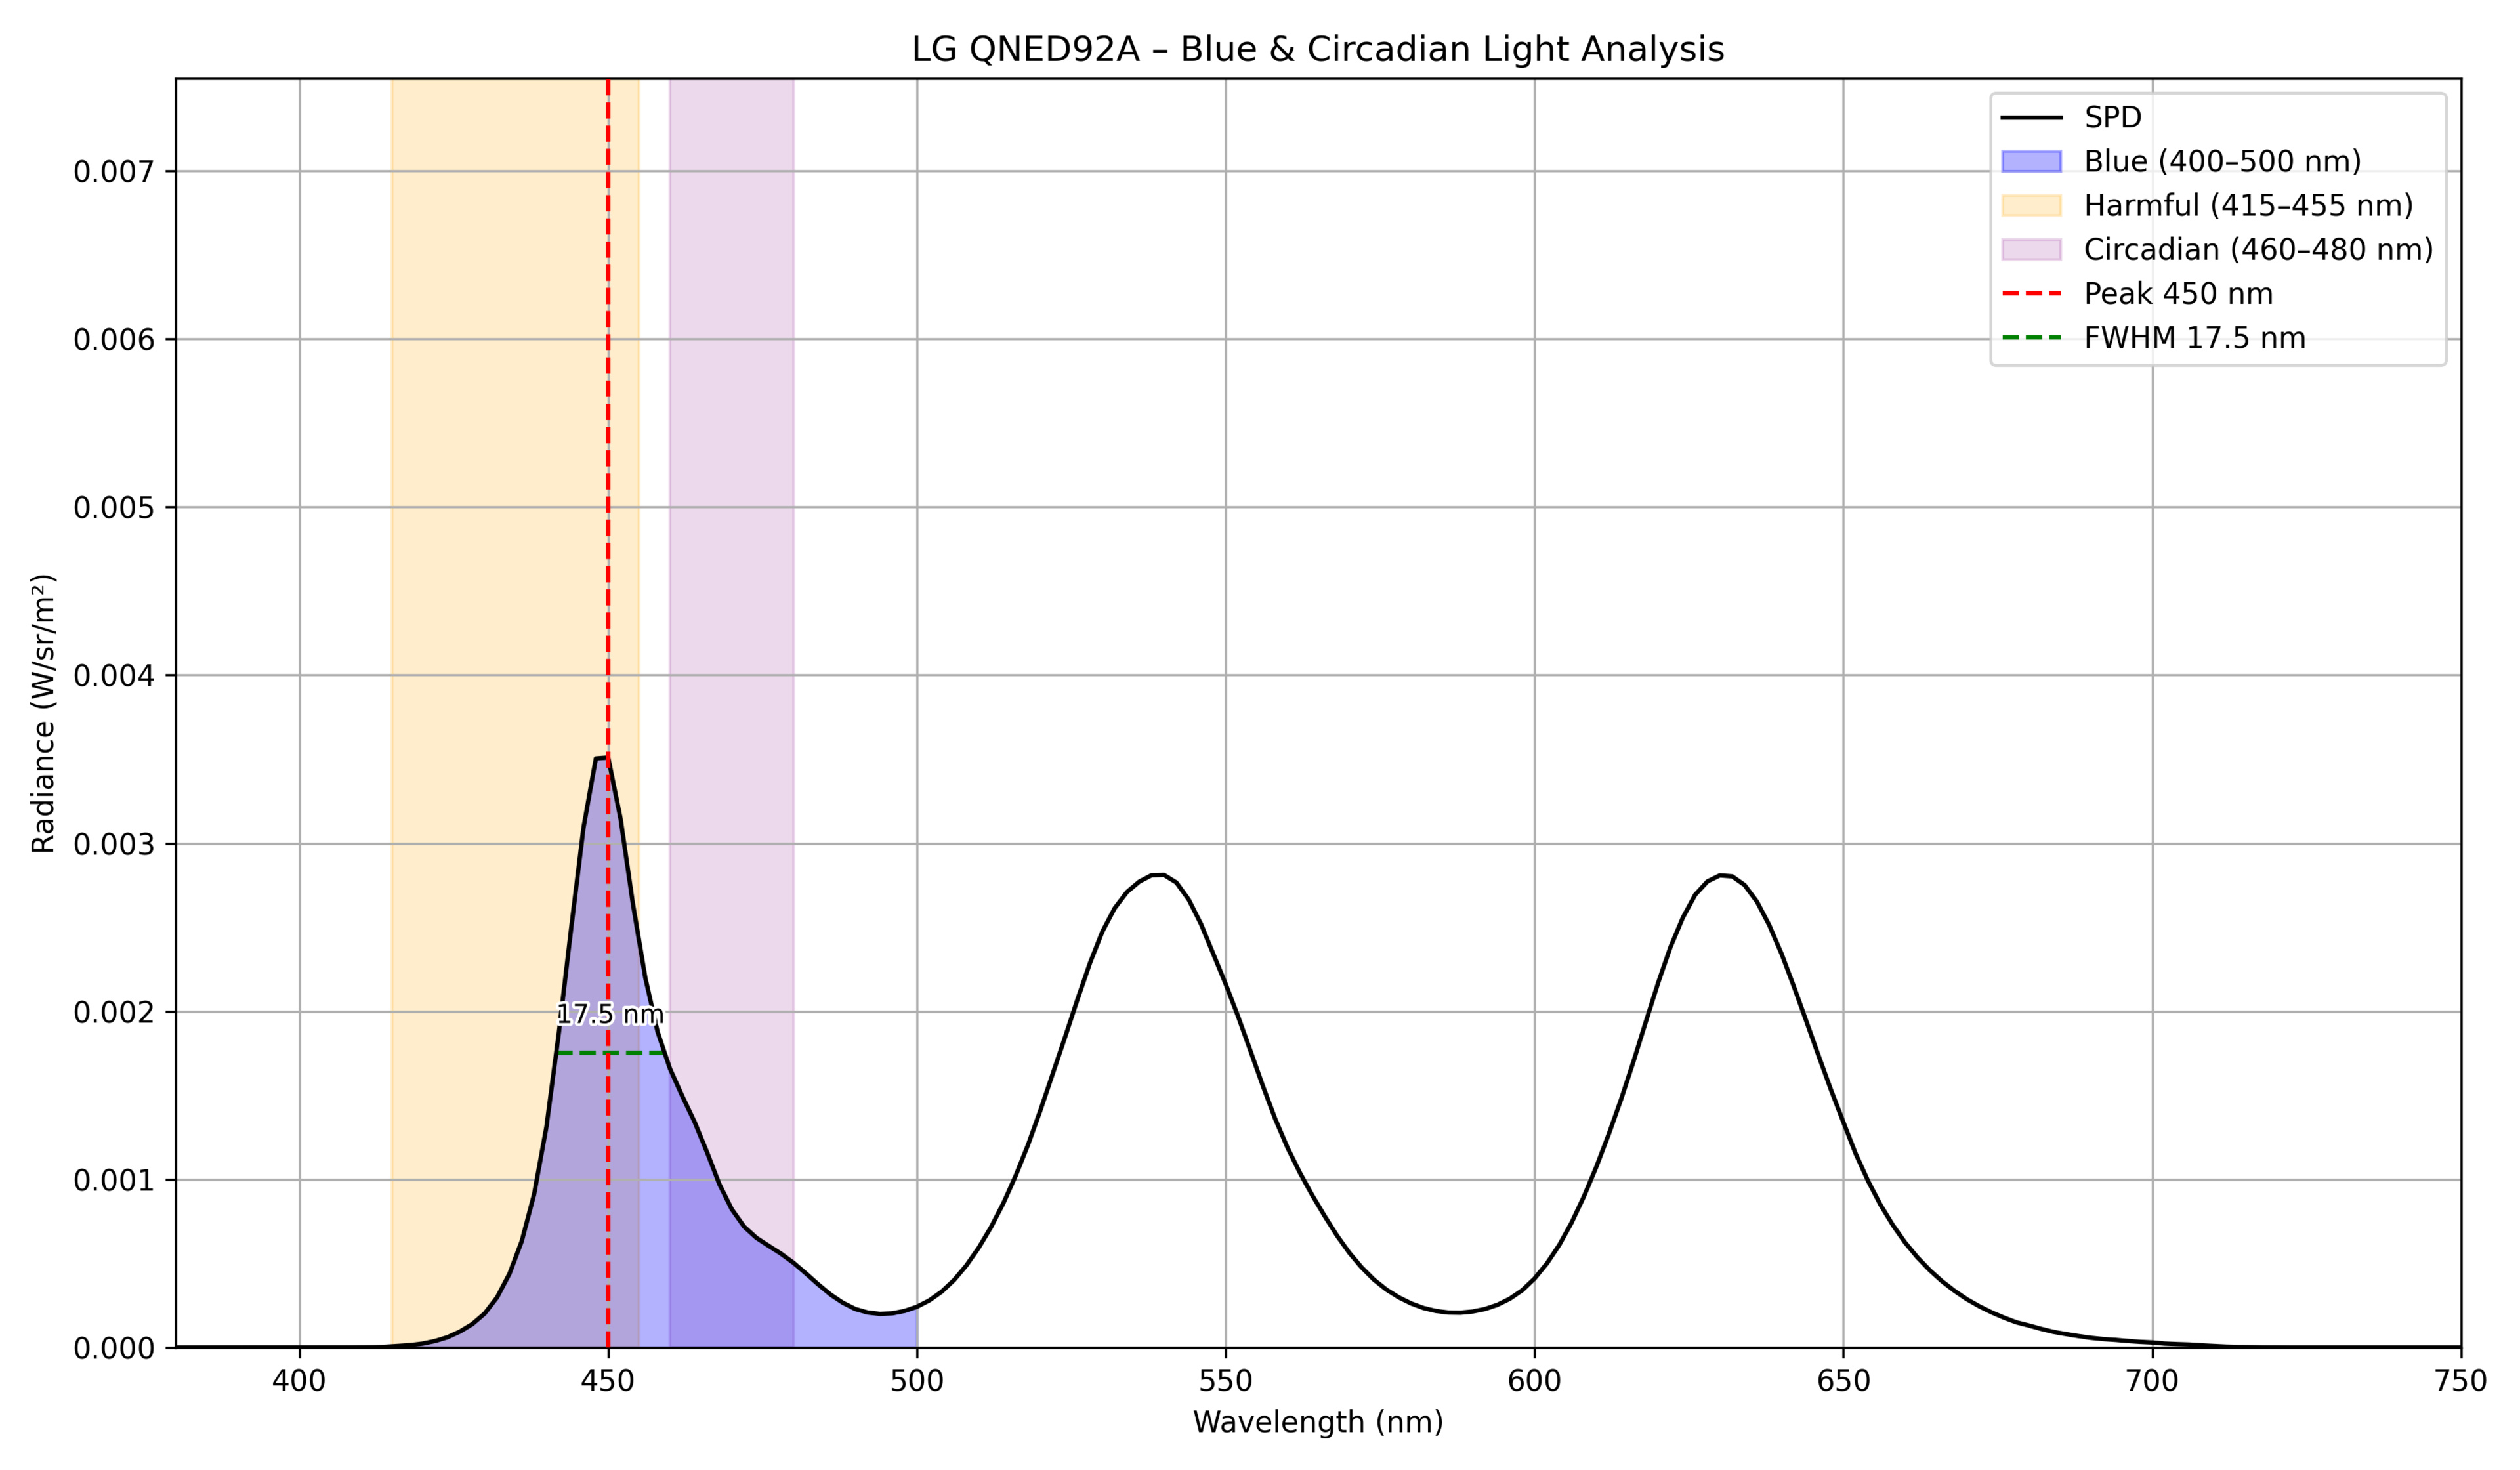 |
450 | 17.5 | 55.56 | 22.62 | 0.083207 |
| LG UA77 | 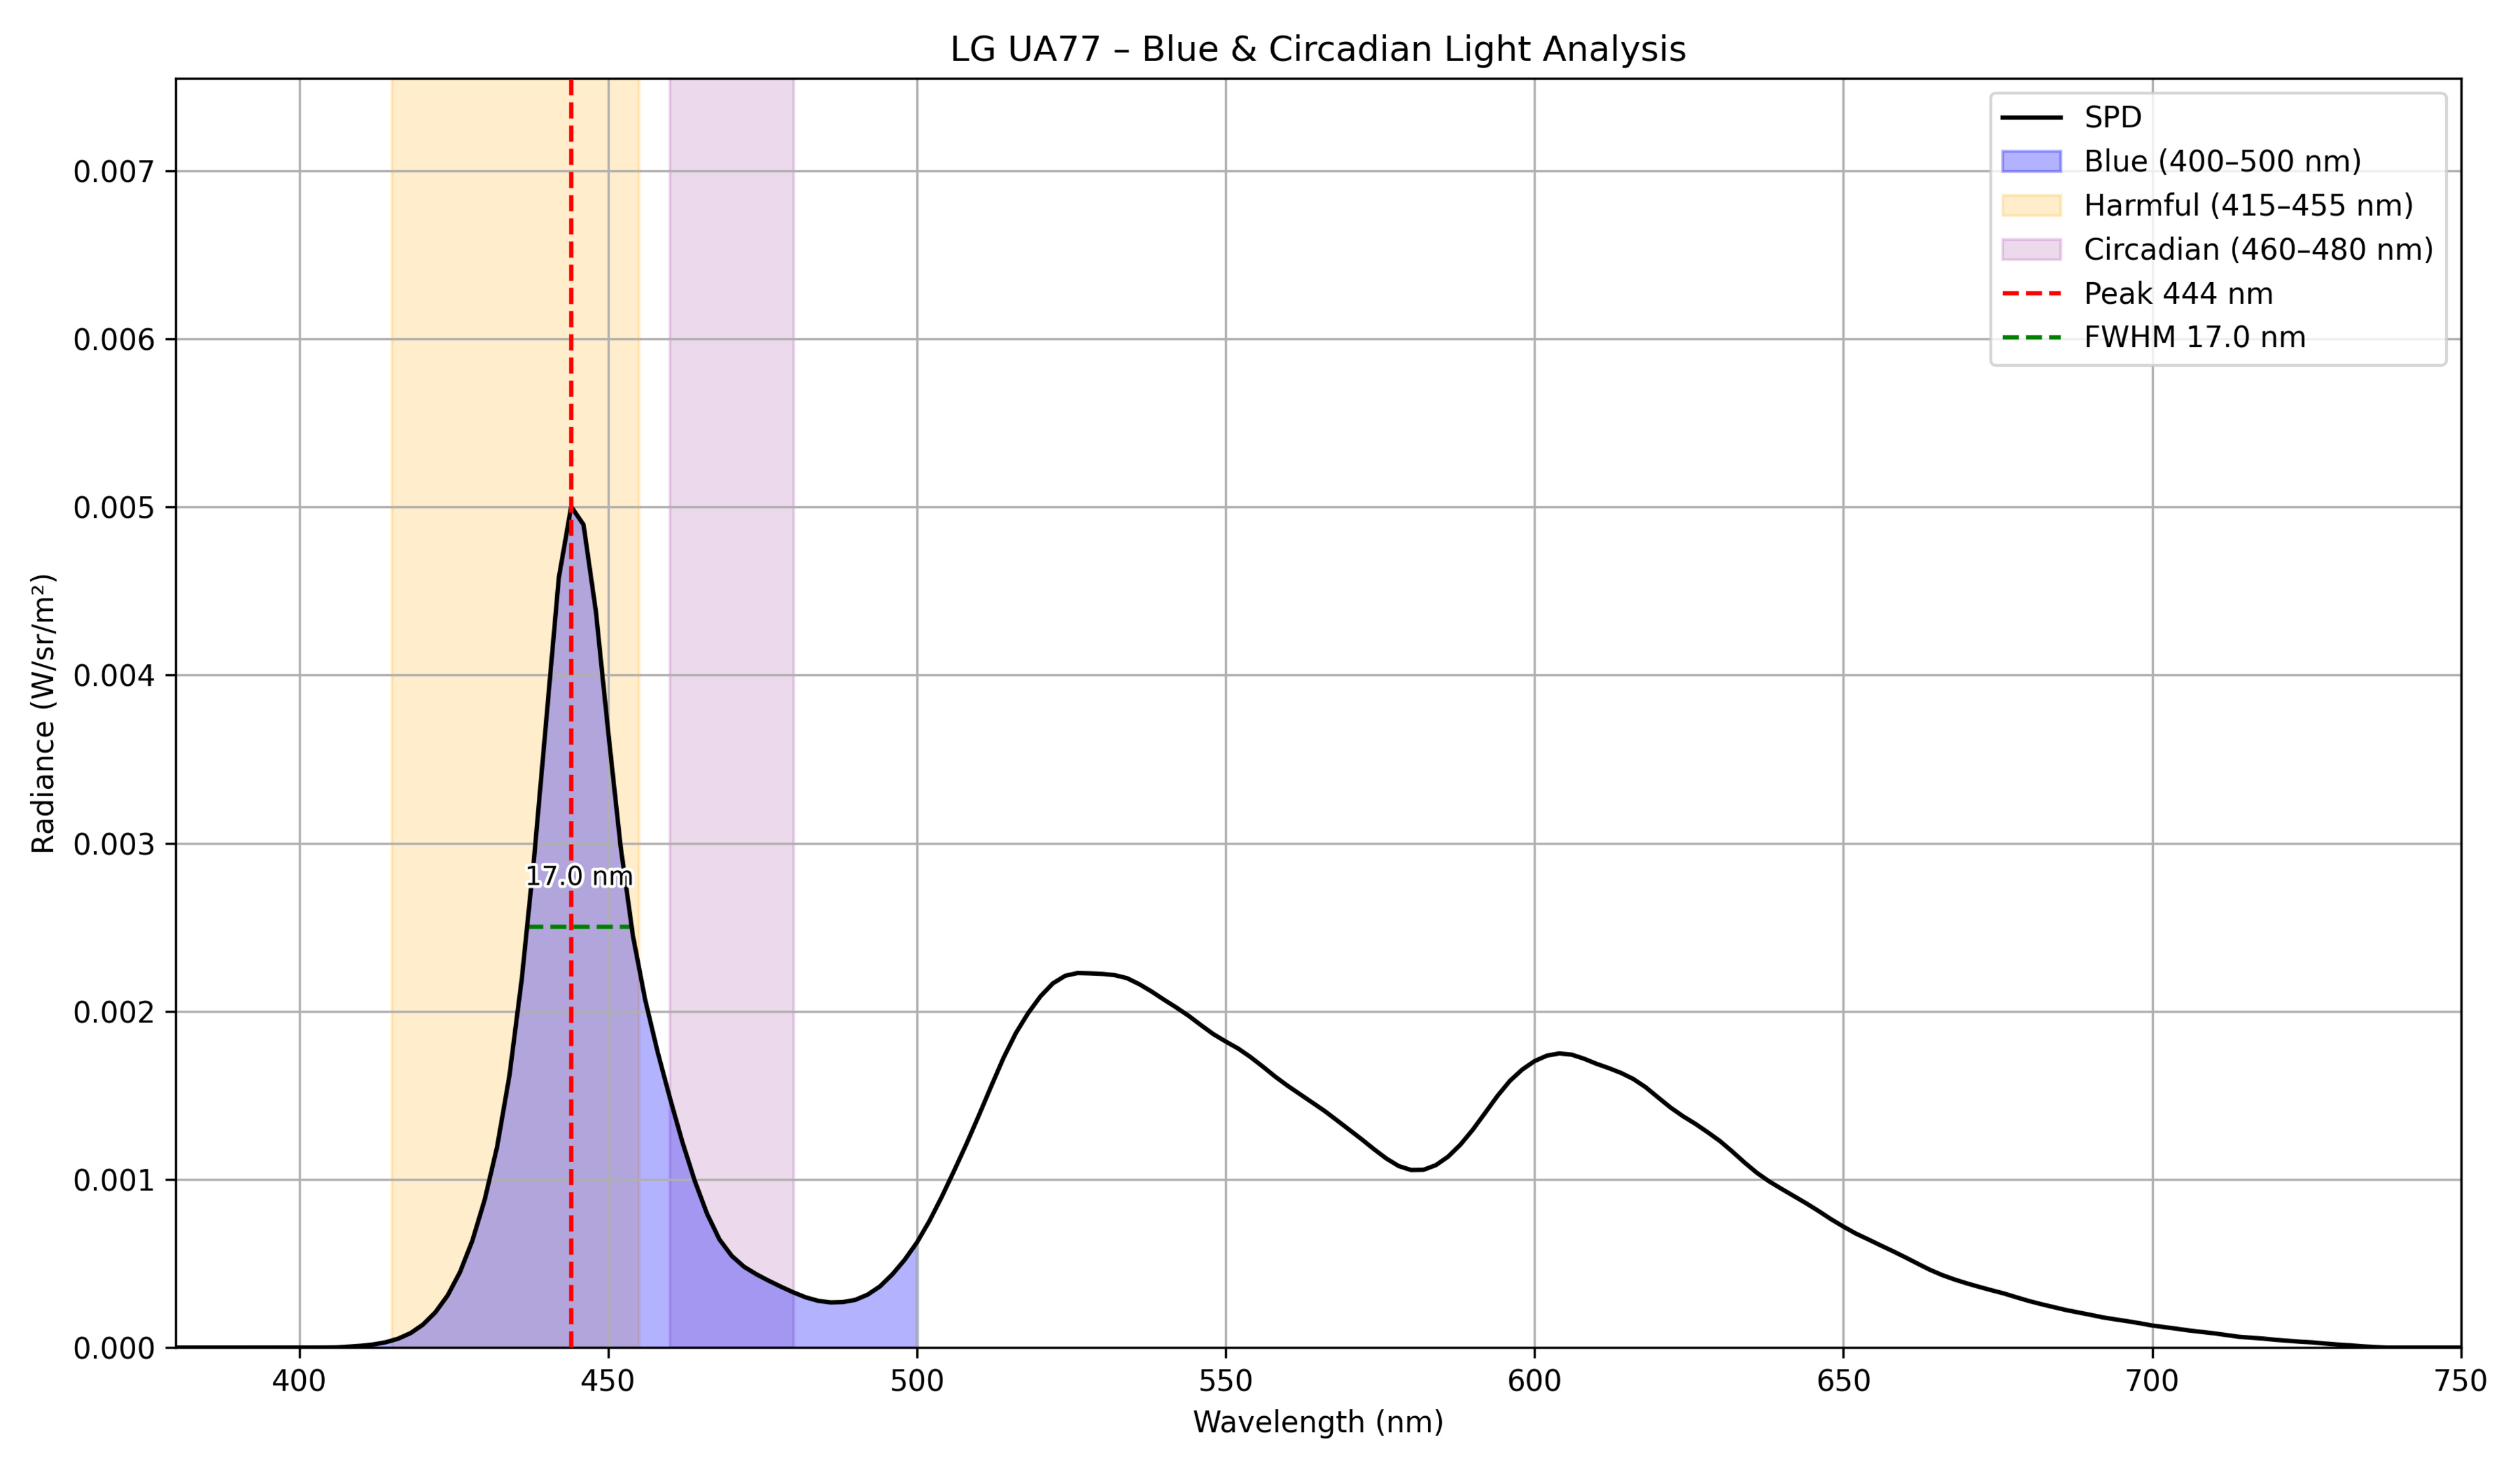 |
444 | 17 | 71.76 | 11.84 | 0.114634 |
| LG UT75 |  |
446 | 18 | 65.72 | 15.06 | 0.099116 |
| Panasonic W70B |  |
448 | 16 | 65.33 | 15.09 | 0.1073 |
| Panasonic W95A | 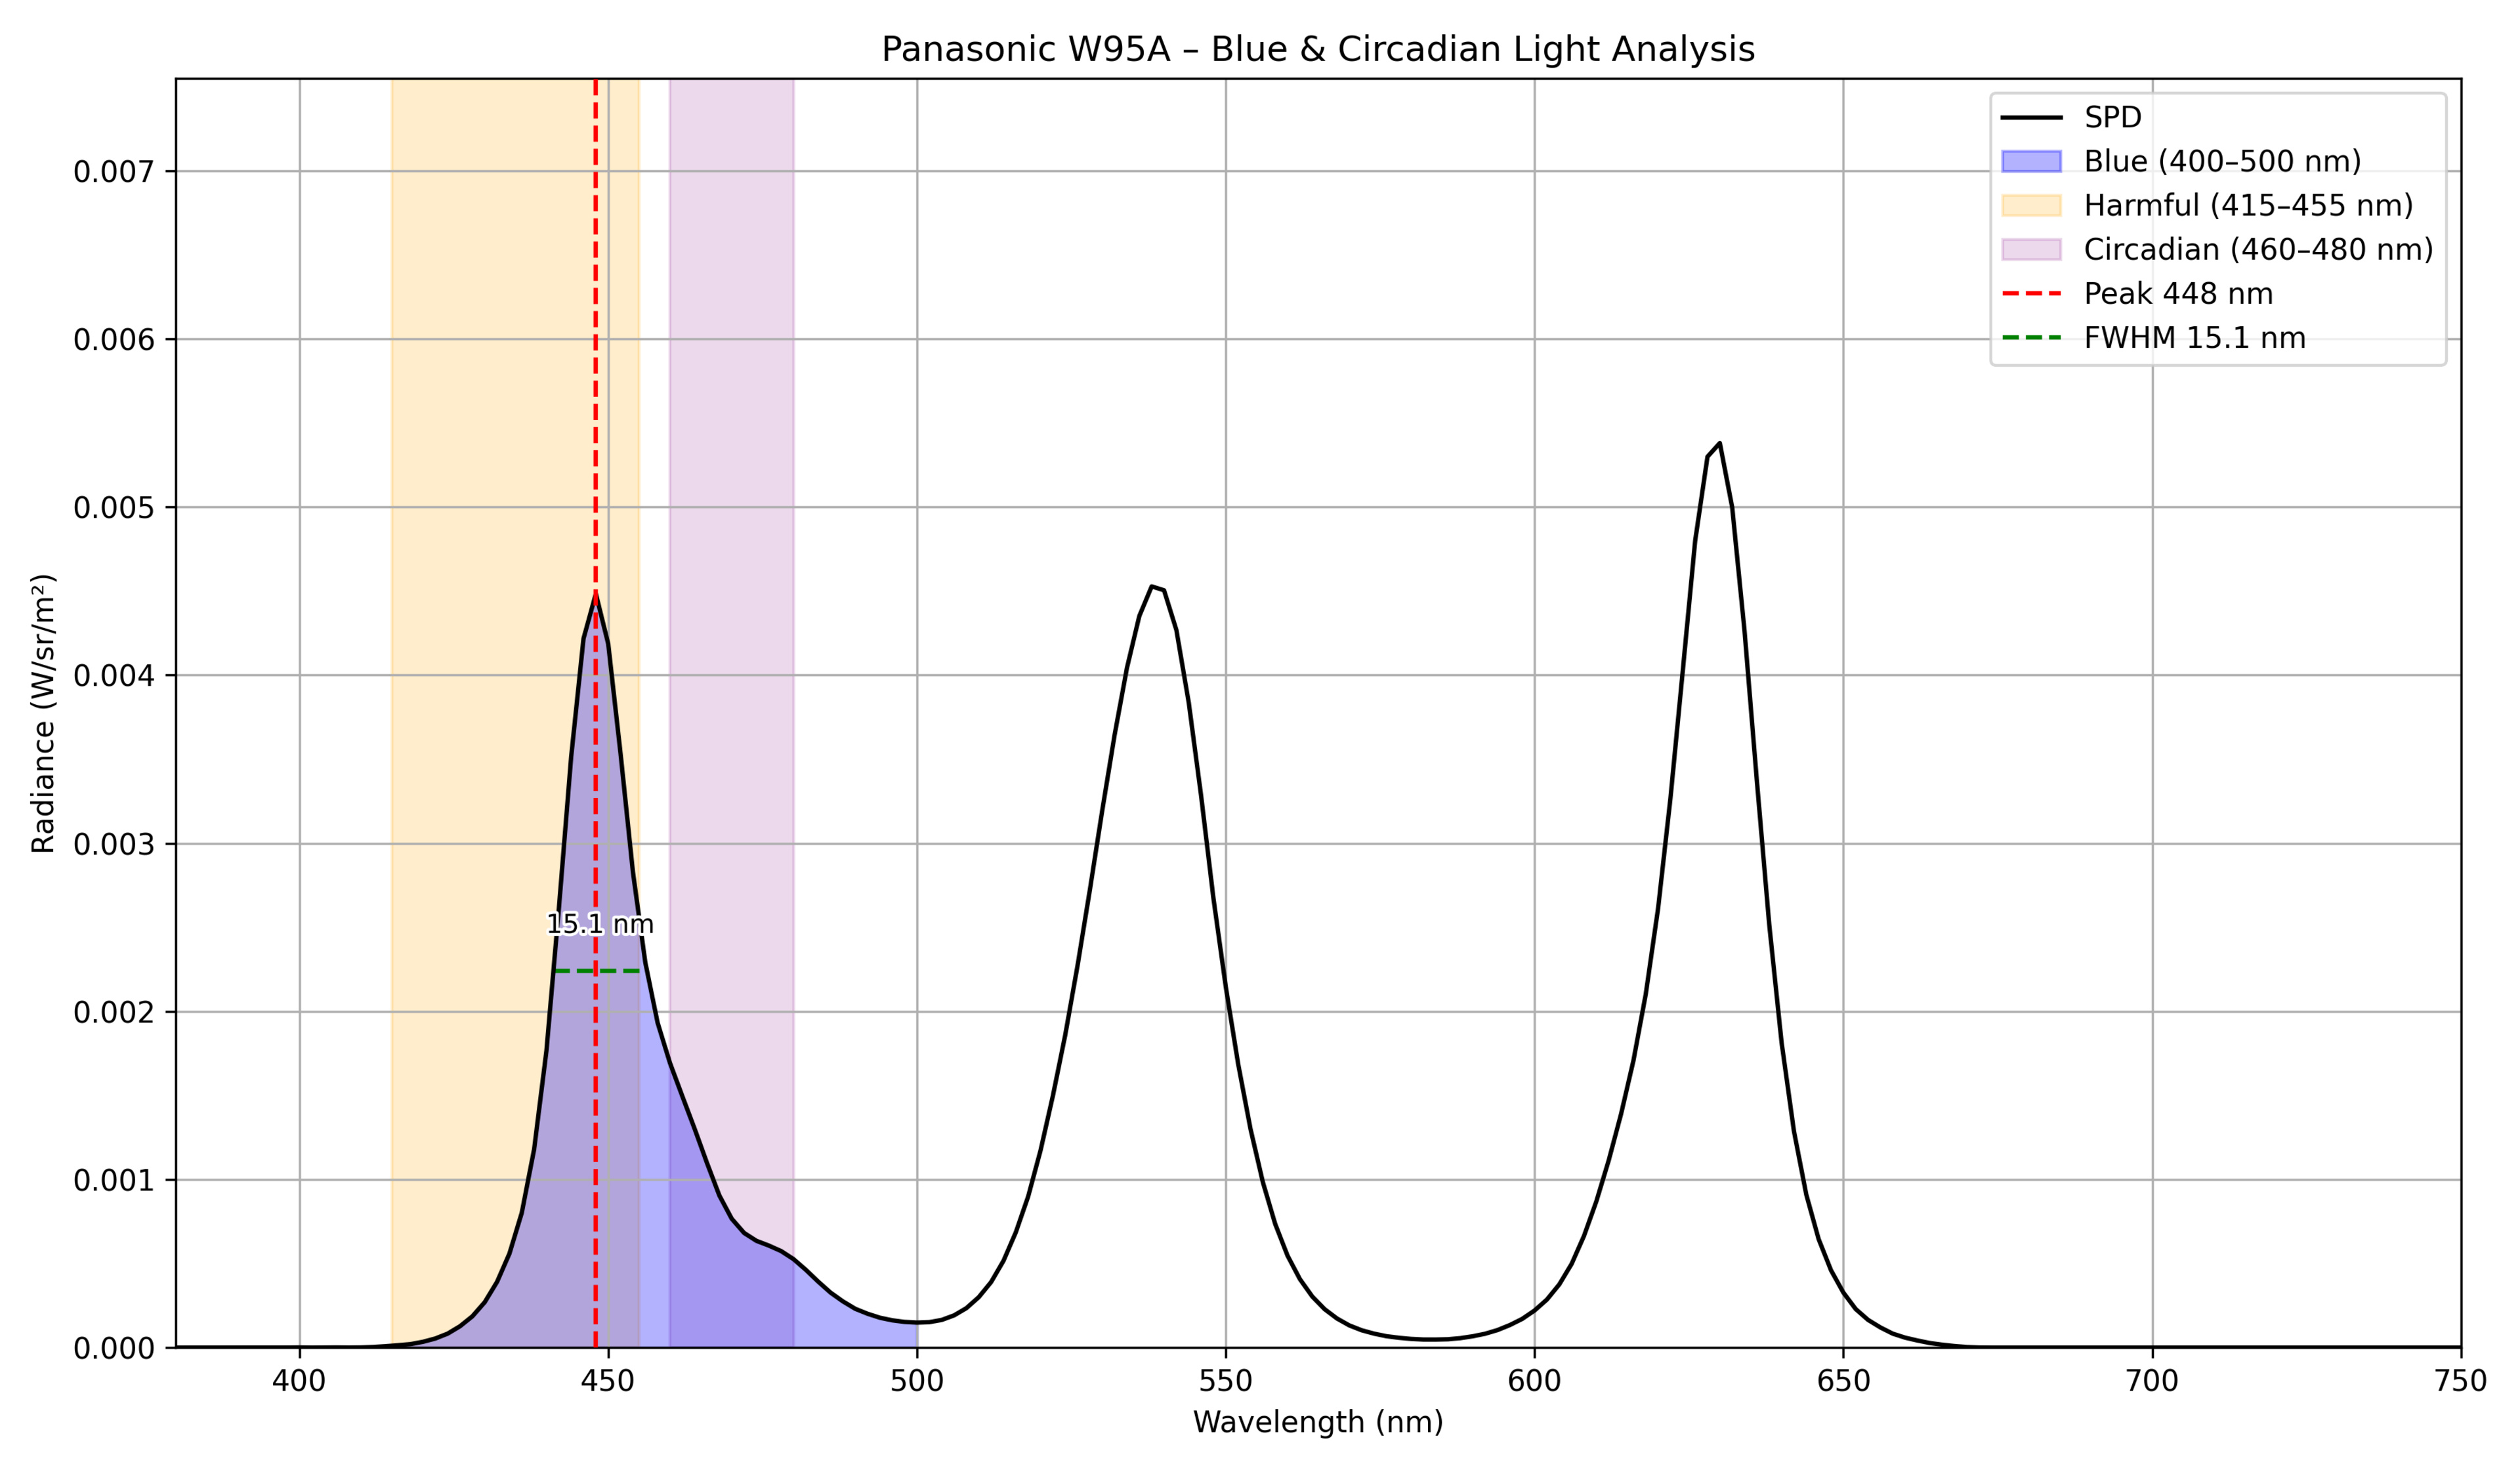 |
448 | 15.1 | 61.54 | 19.17 | 0.095677 |
| Roku Pro Series 2025 | 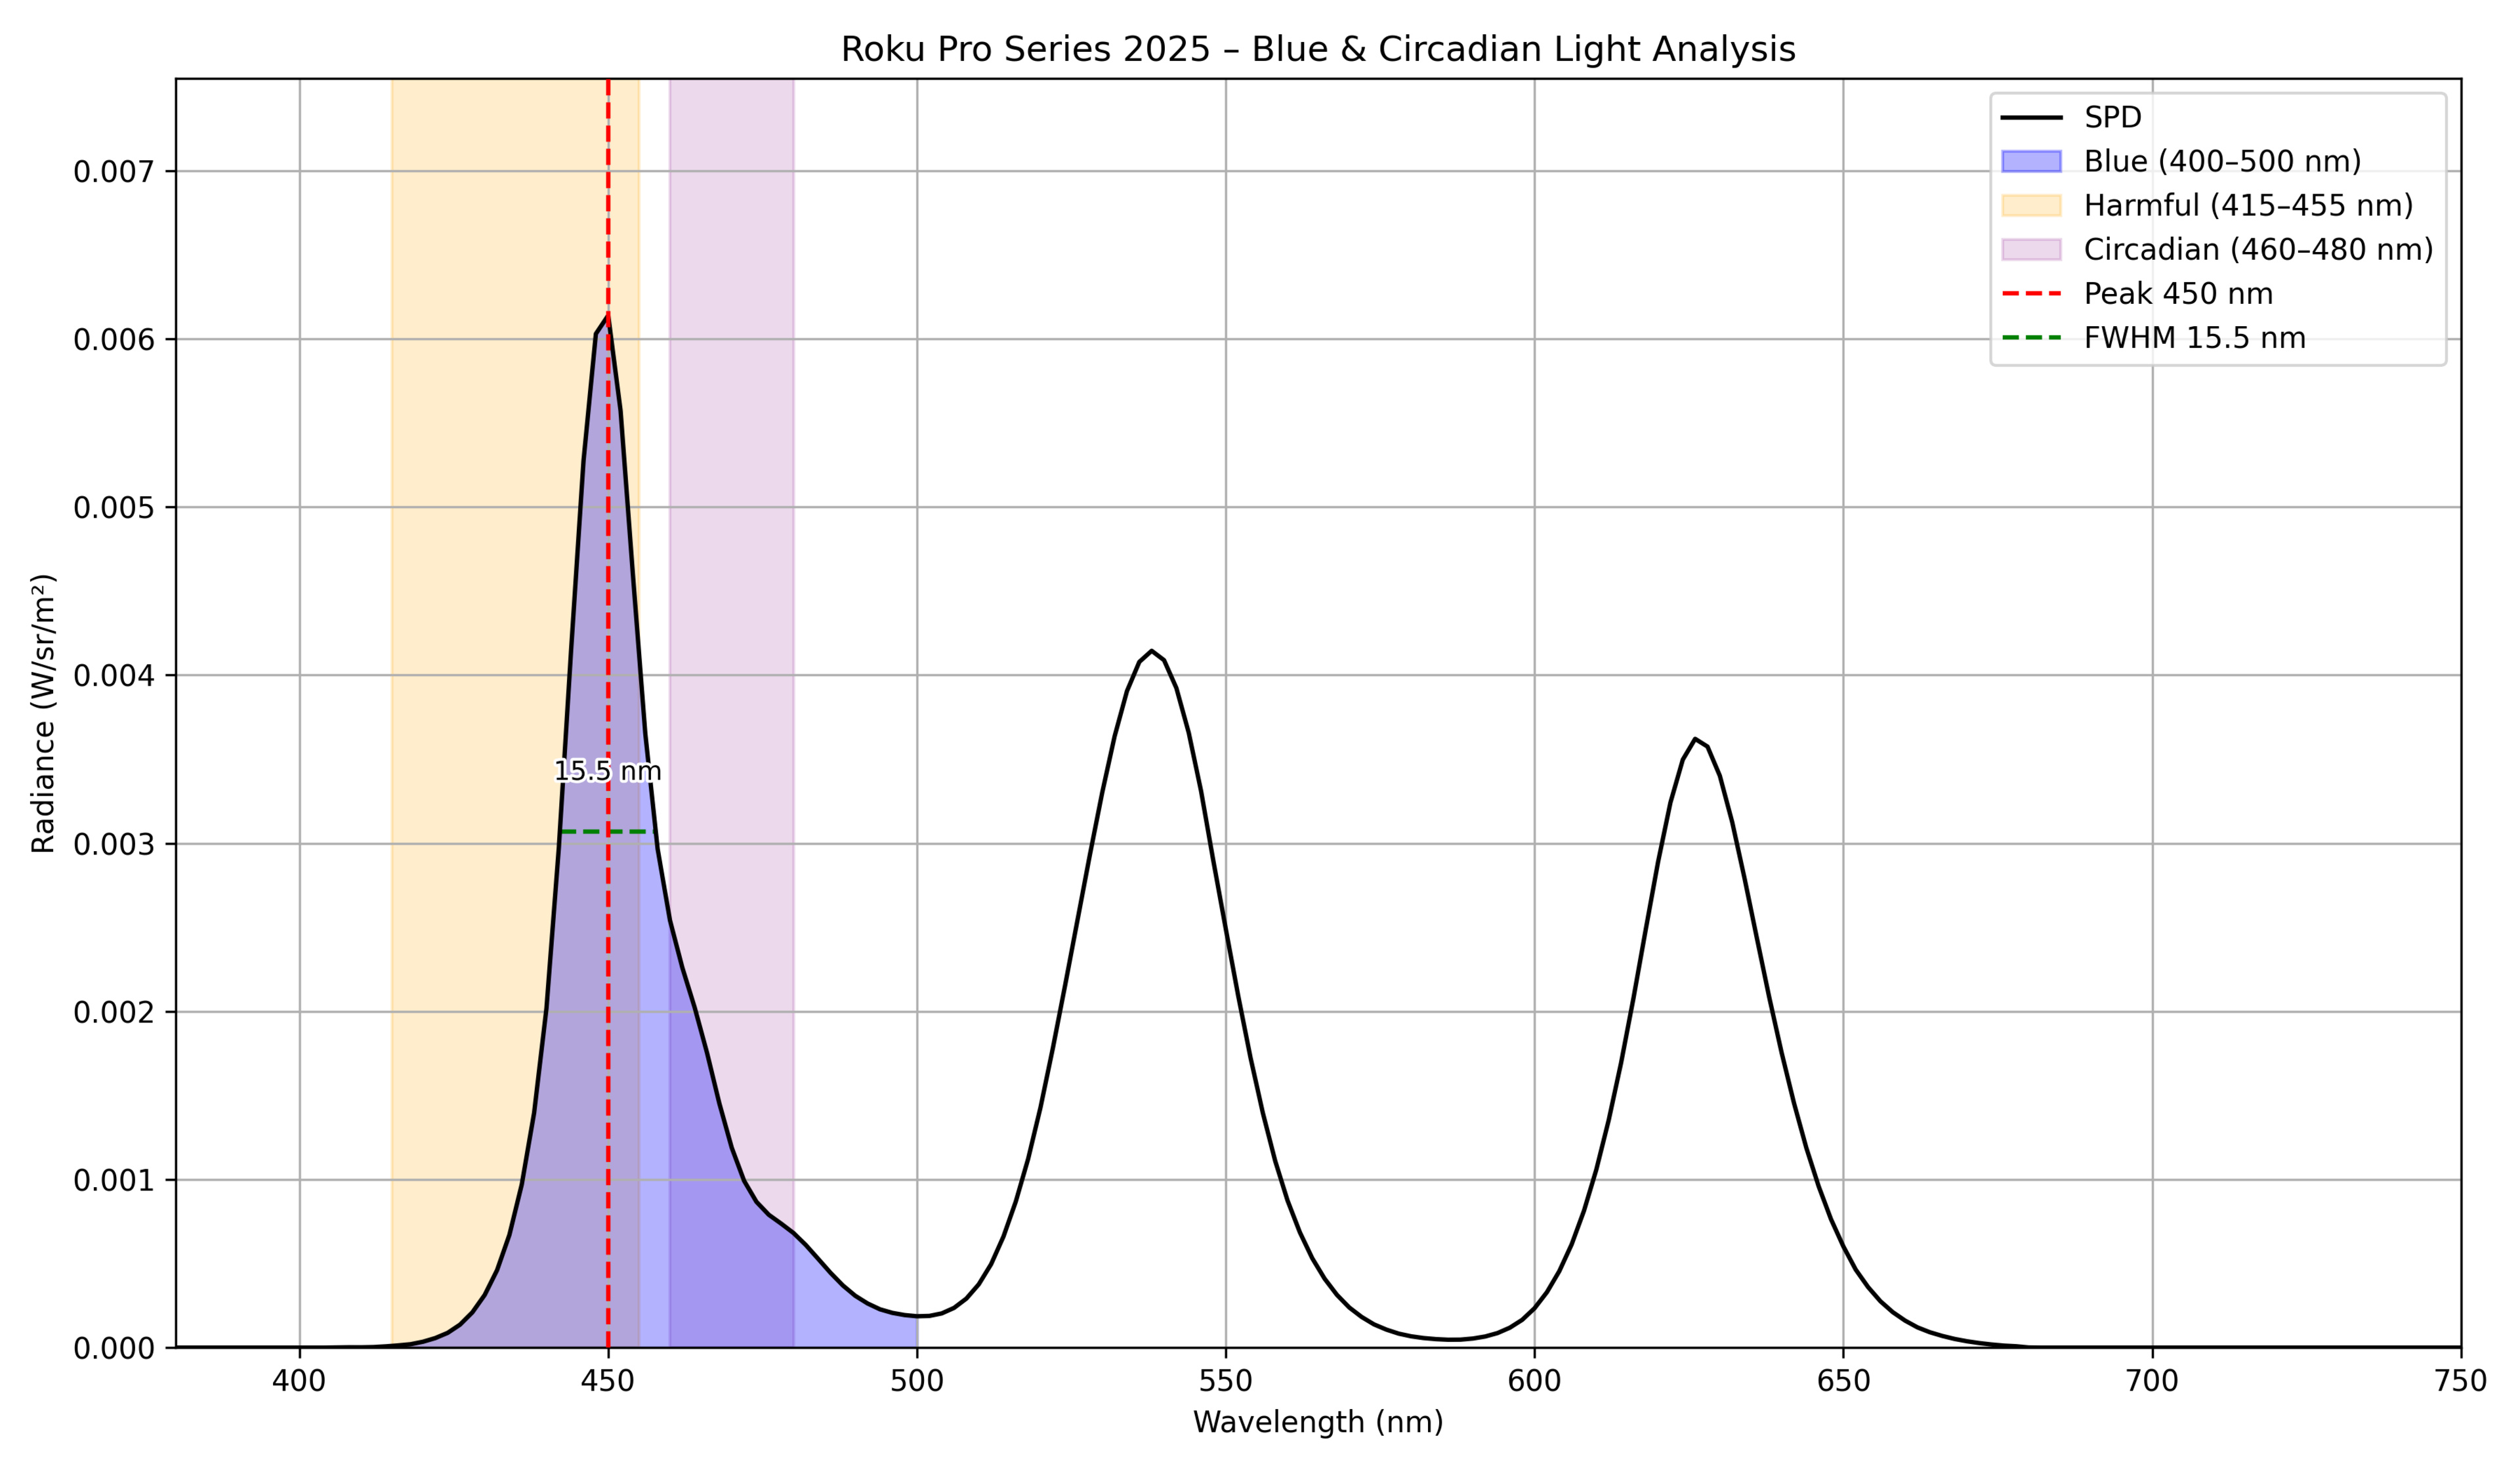 |
450 | 15.5 | 58.56 | 20.63 | 0.132599 |
| Roku Select Series 2023 | 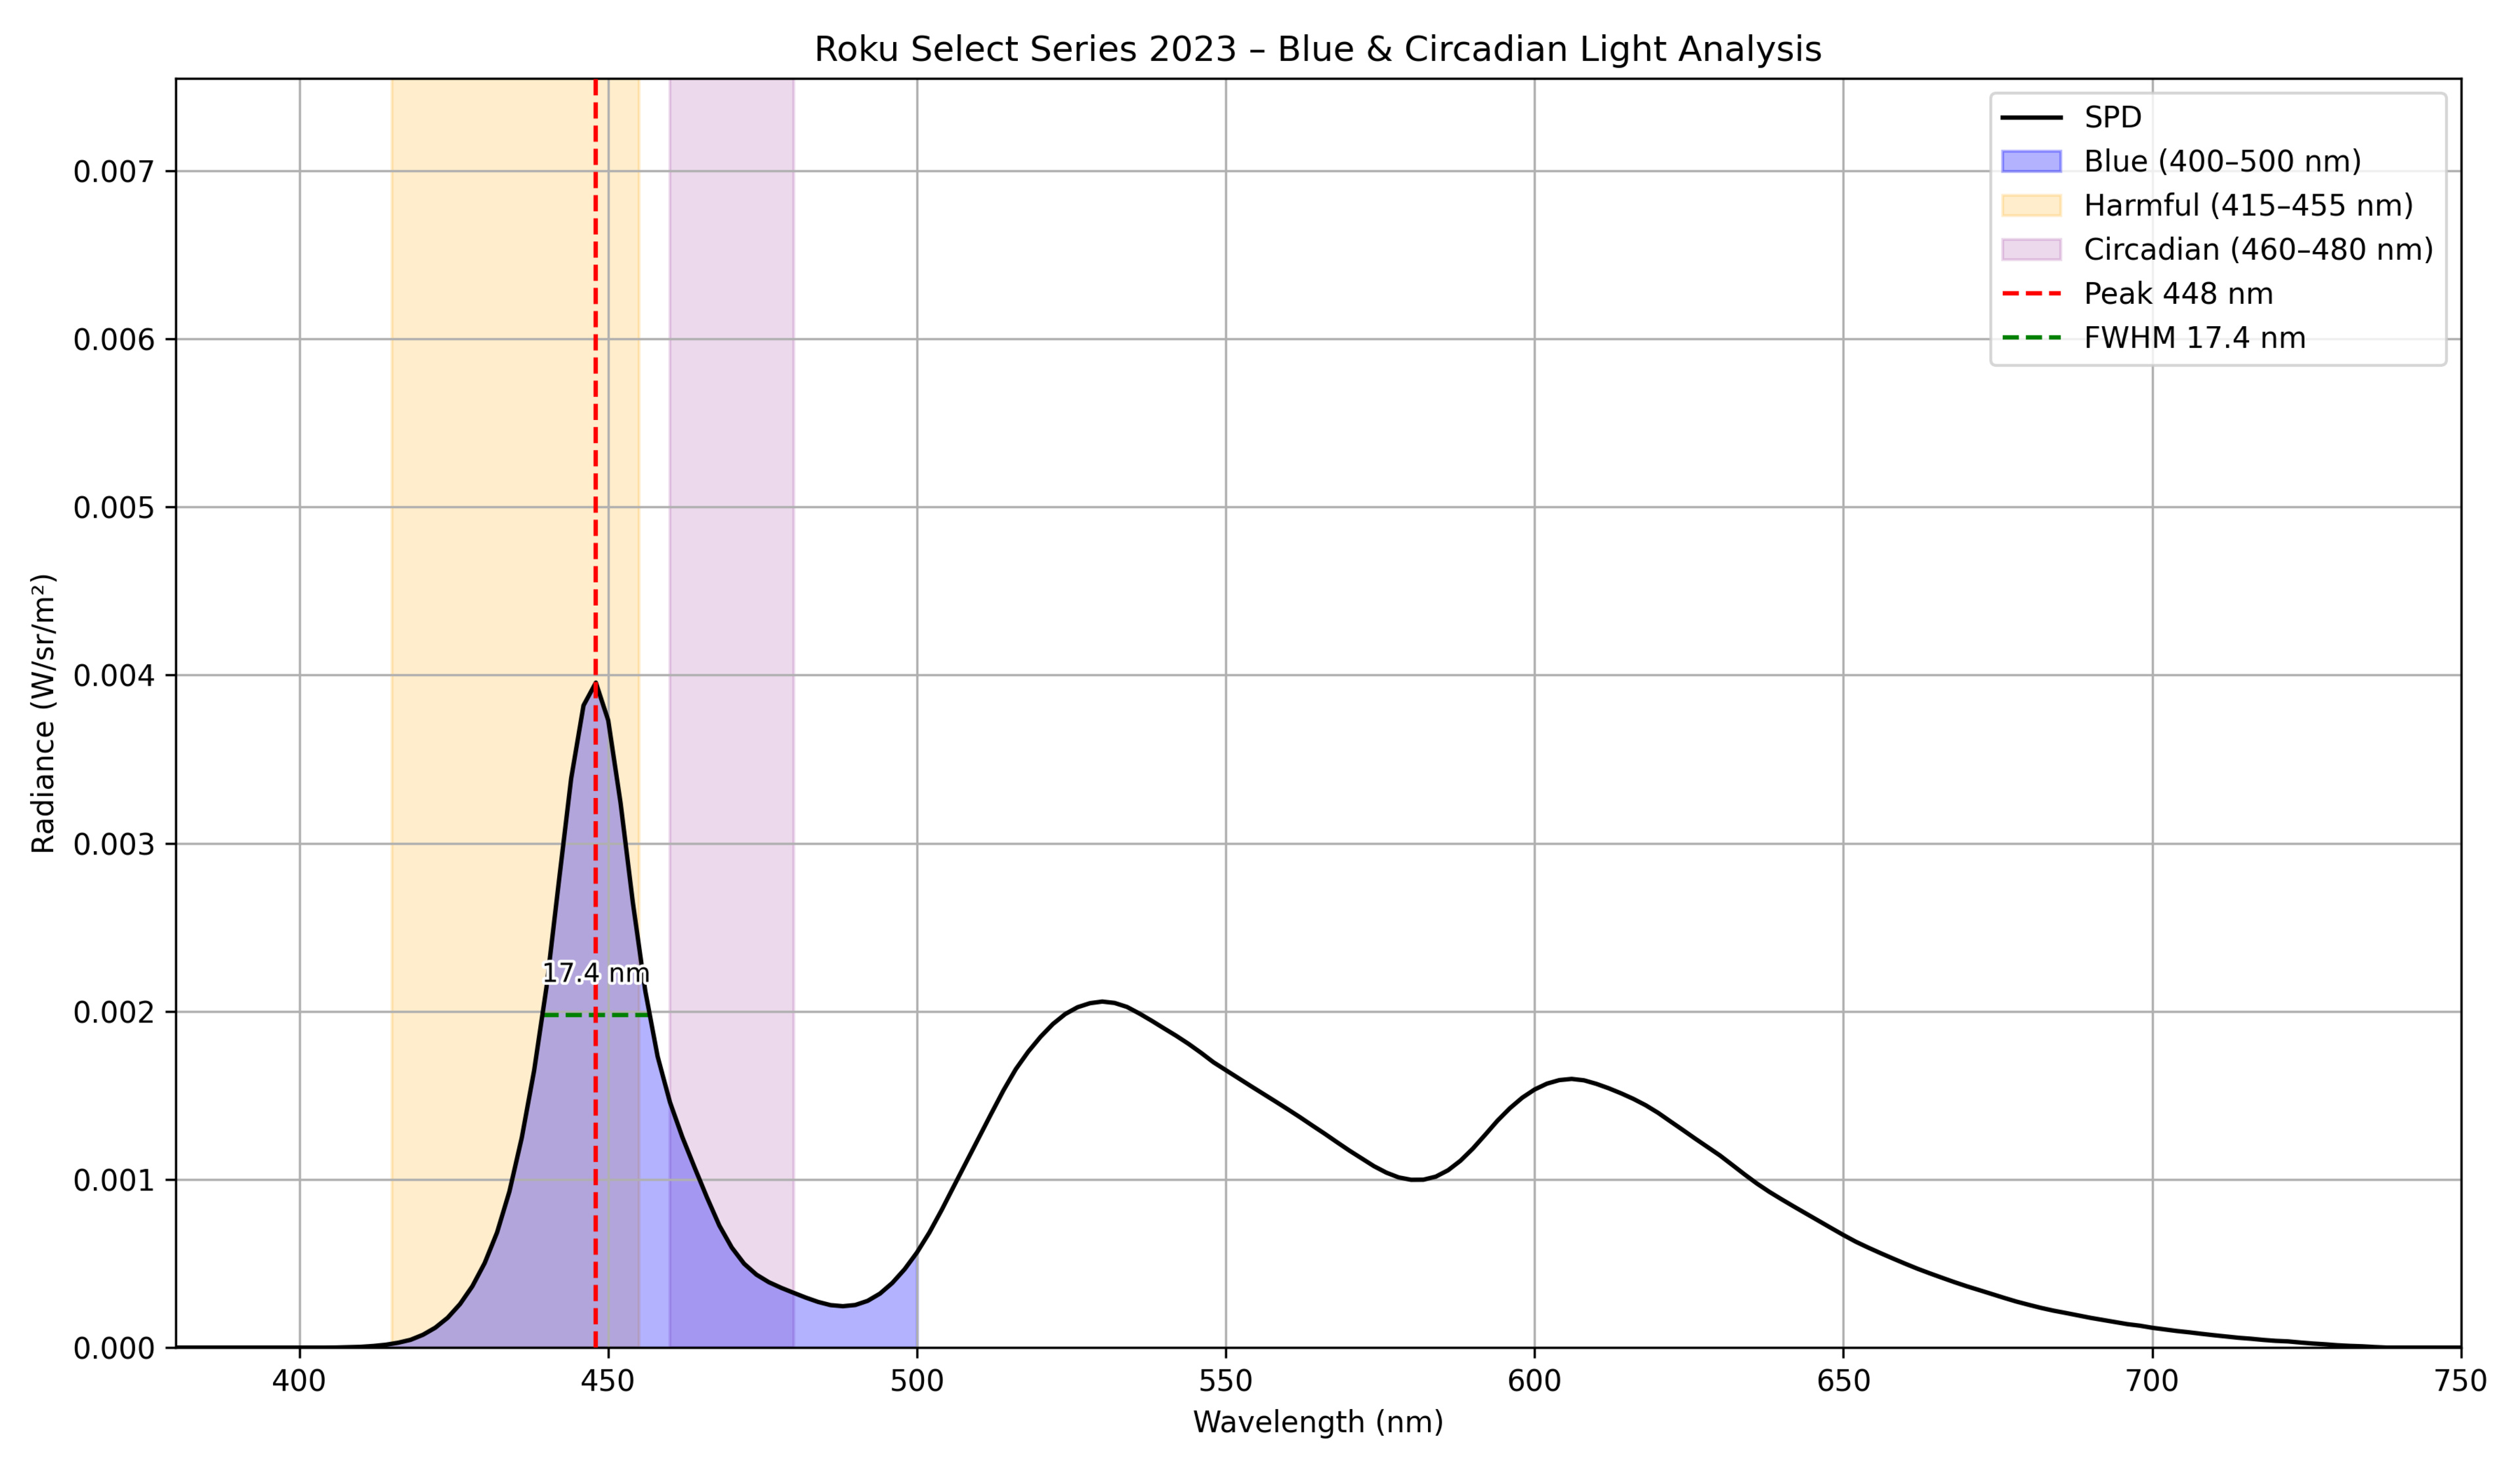 |
448 | 17.4 | 65.15 | 15.21 | 0.093432 |
| Samsung 100QN80F |  |
450 | 16.2 | 50.34 | 24.75 | 0.103042 |
| Samsung DU7200 |  |
448 | 16.7 | 61.84 | 16.51 | 0.10085 |
| Samsung DU8000 | 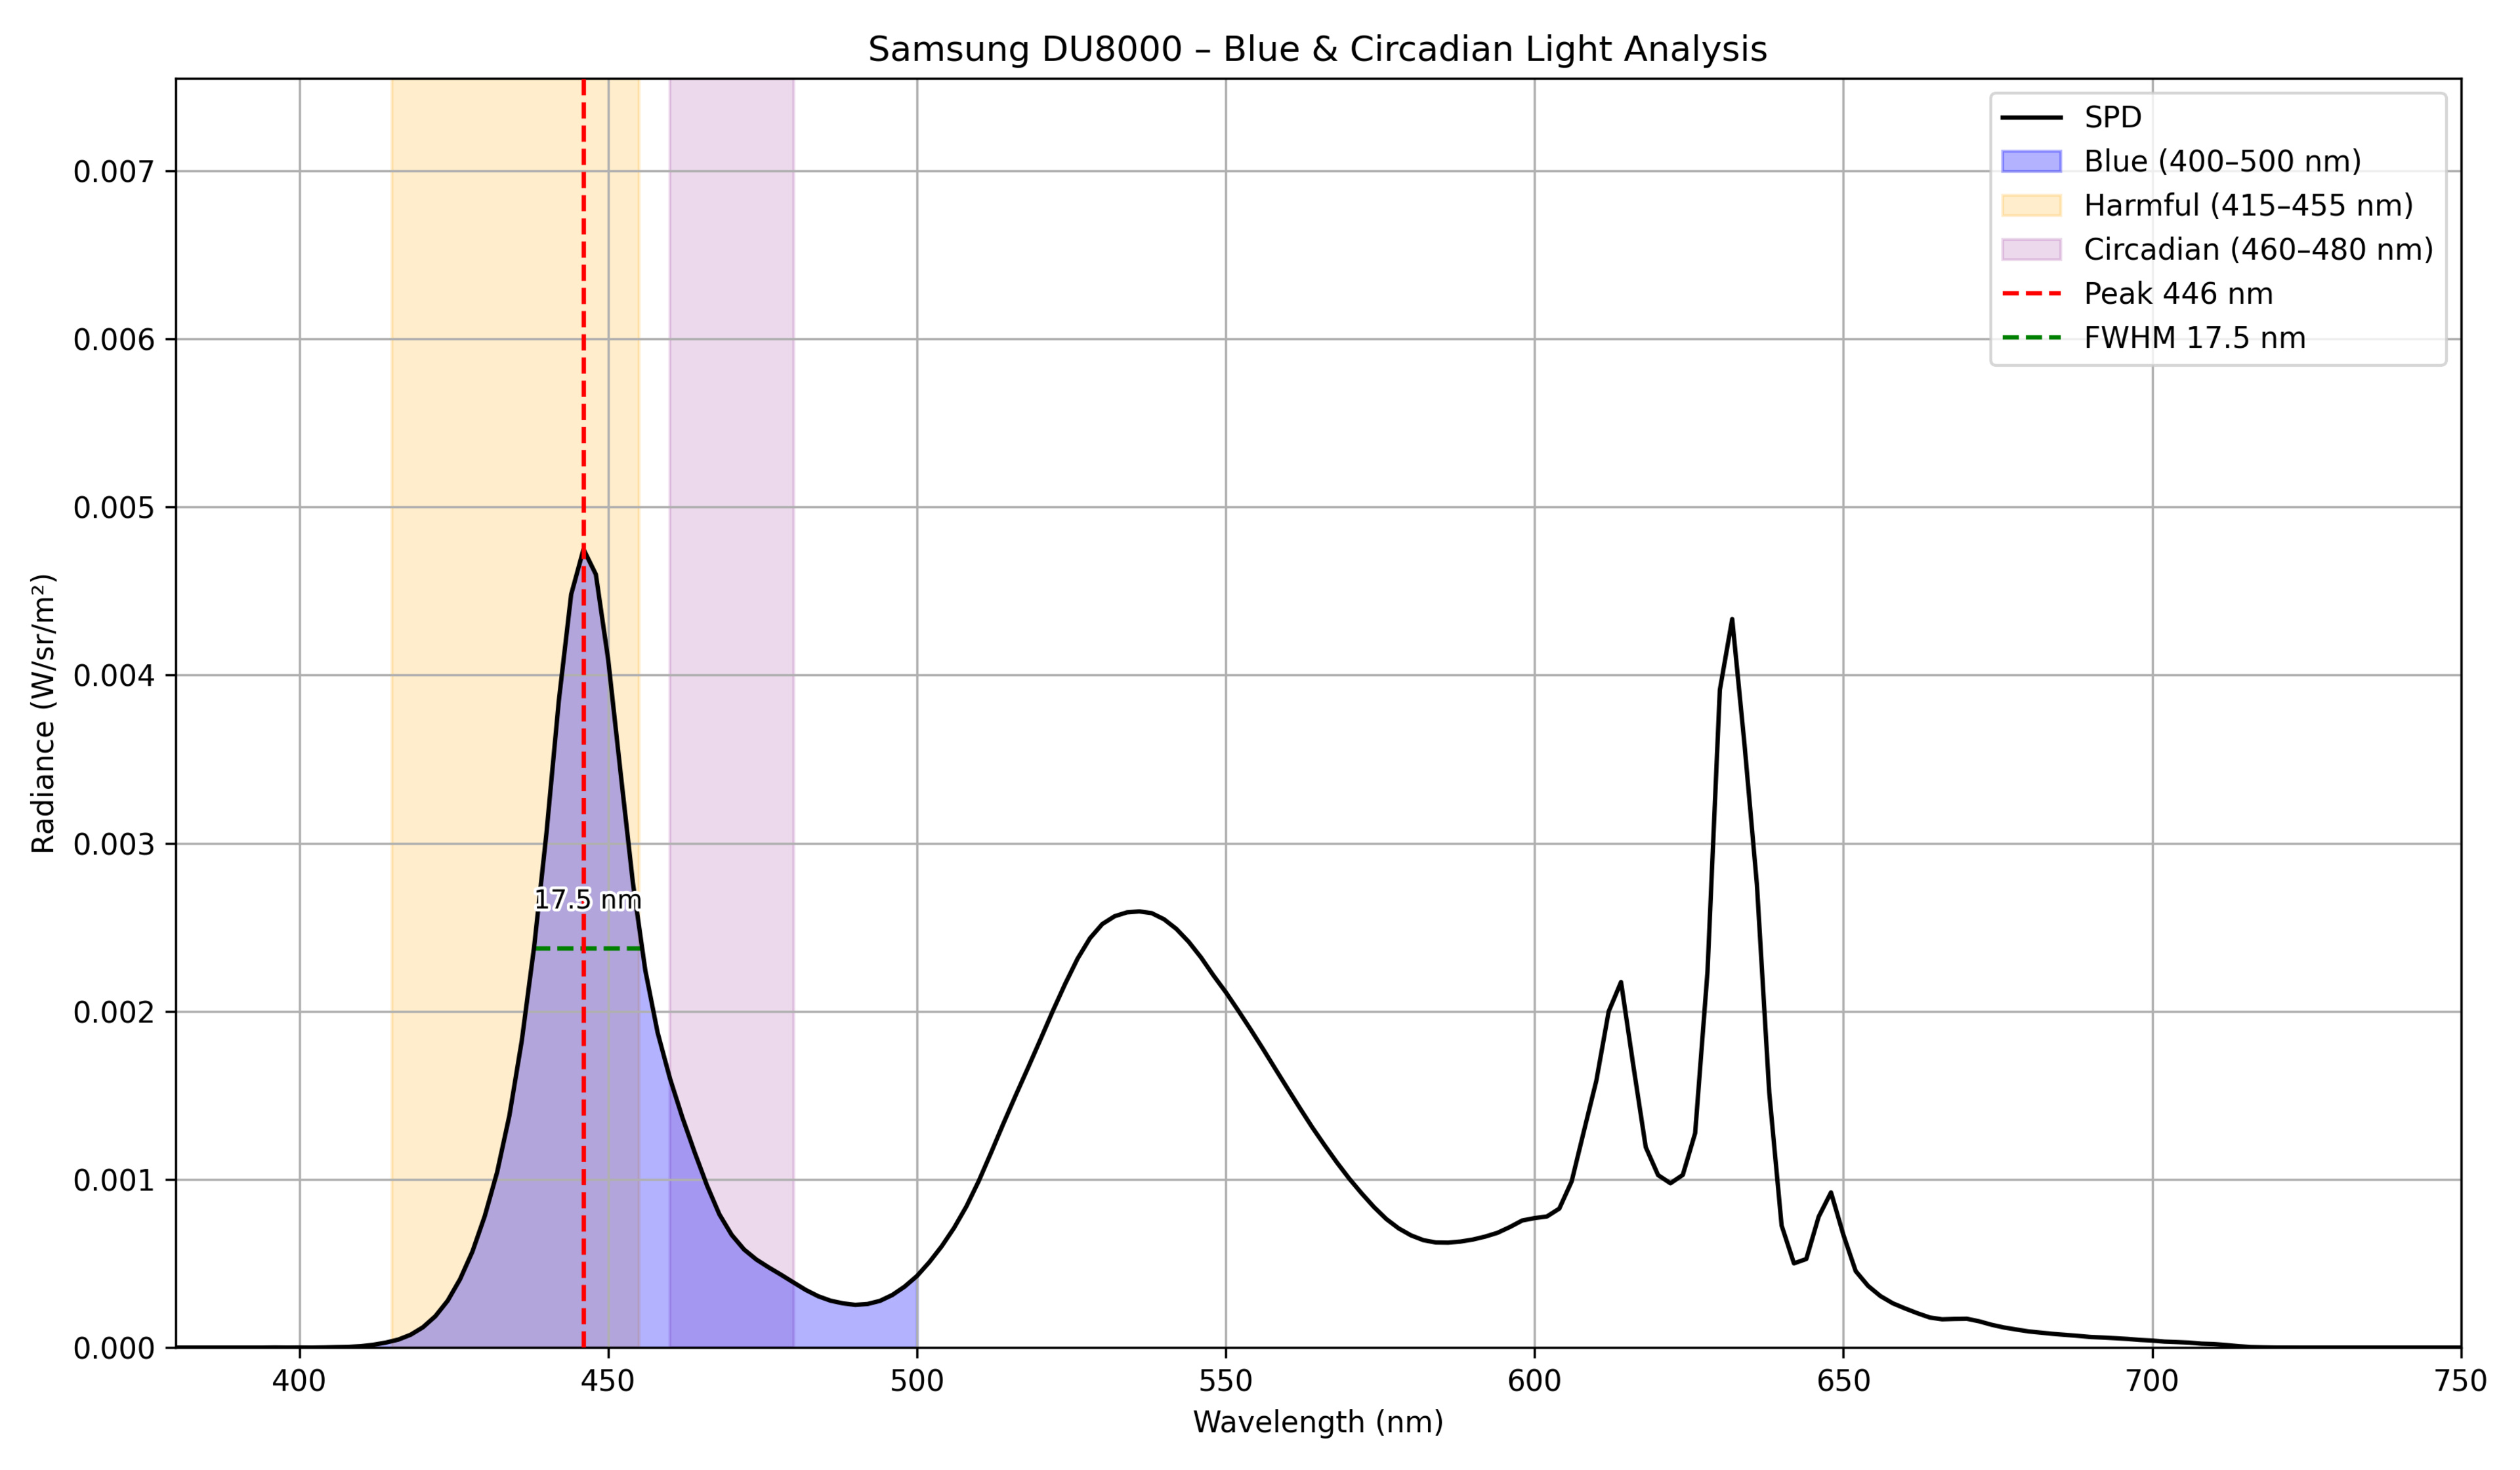 |
446 | 17.5 | 68.96 | 14.2 | 0.11226 |
| Samsung Q60D |  |
448 | 16.1 | 58.21 | 20.76 | 0.090373 |
| Samsung Q70D |  |
450 | 18 | 57.1 | 21.31 | 0.103055 |
| Samsung Q7F 2025 |  |
448 | 16.2 | 64.45 | 17.12 | 0.099692 |
| Samsung Q80D | 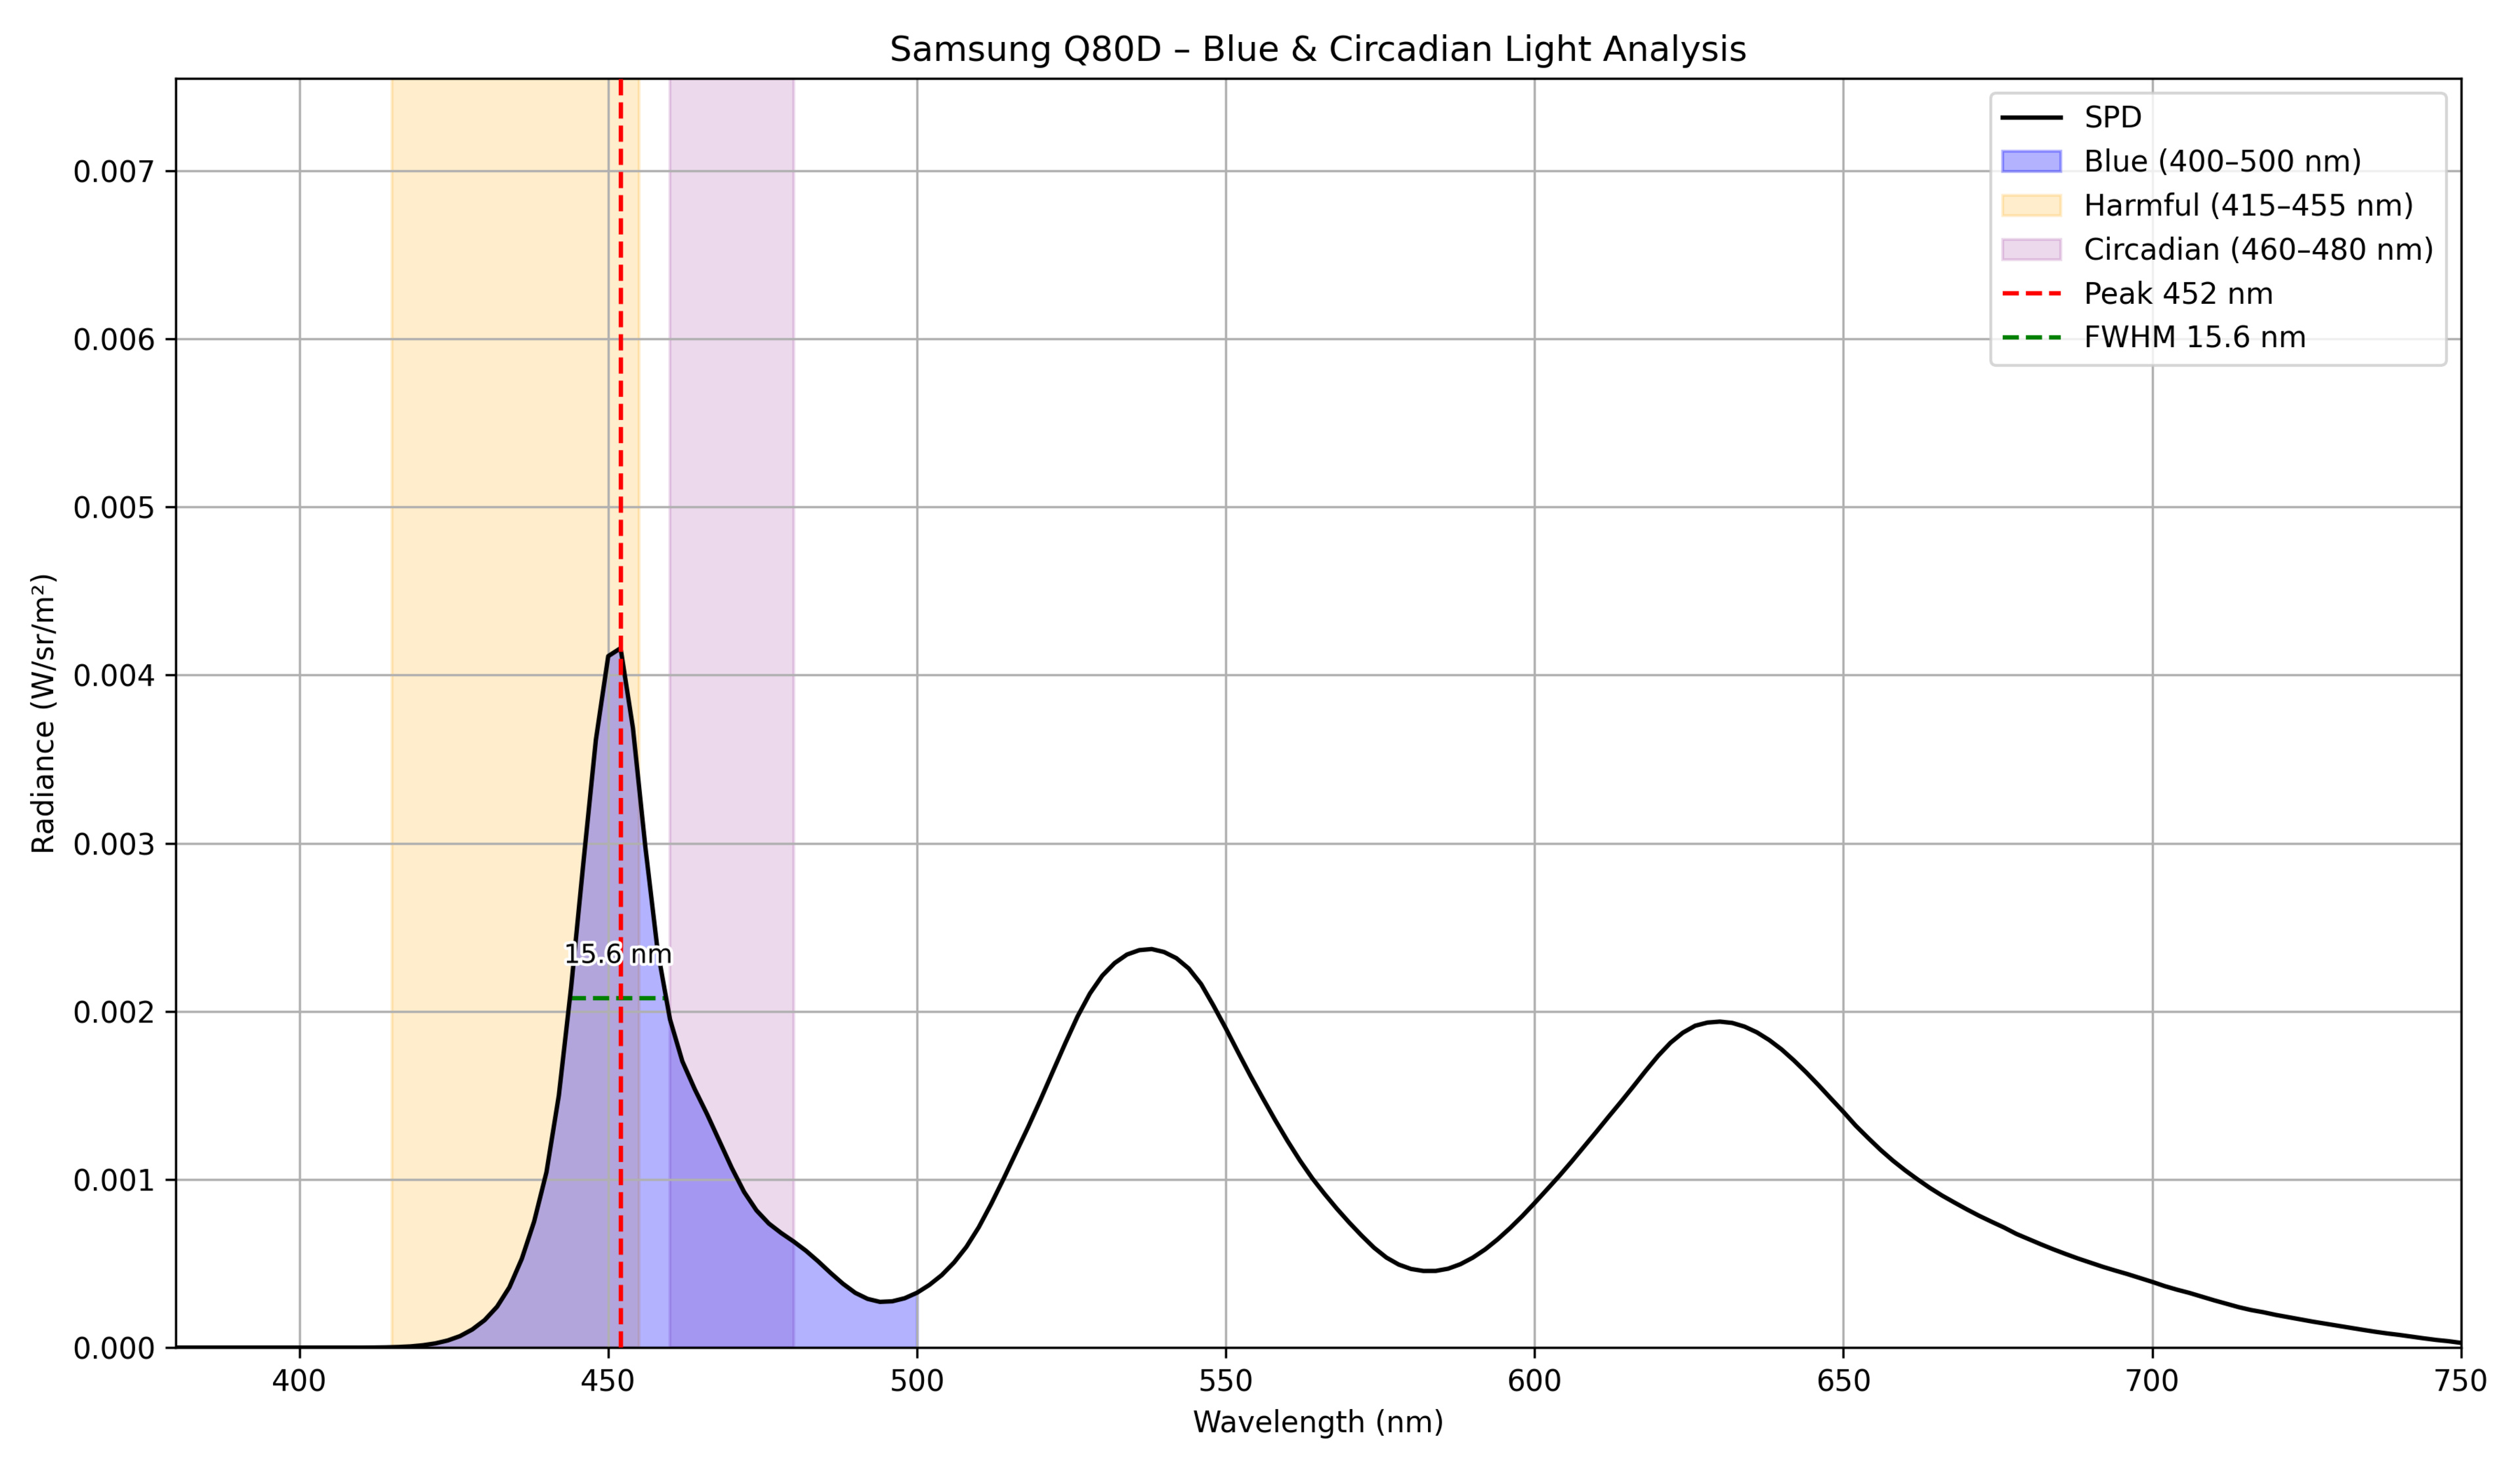 |
452 | 15.6 | 50.24 | 24.21 | 0.094049 |
| Samsung Q8F 2025 | 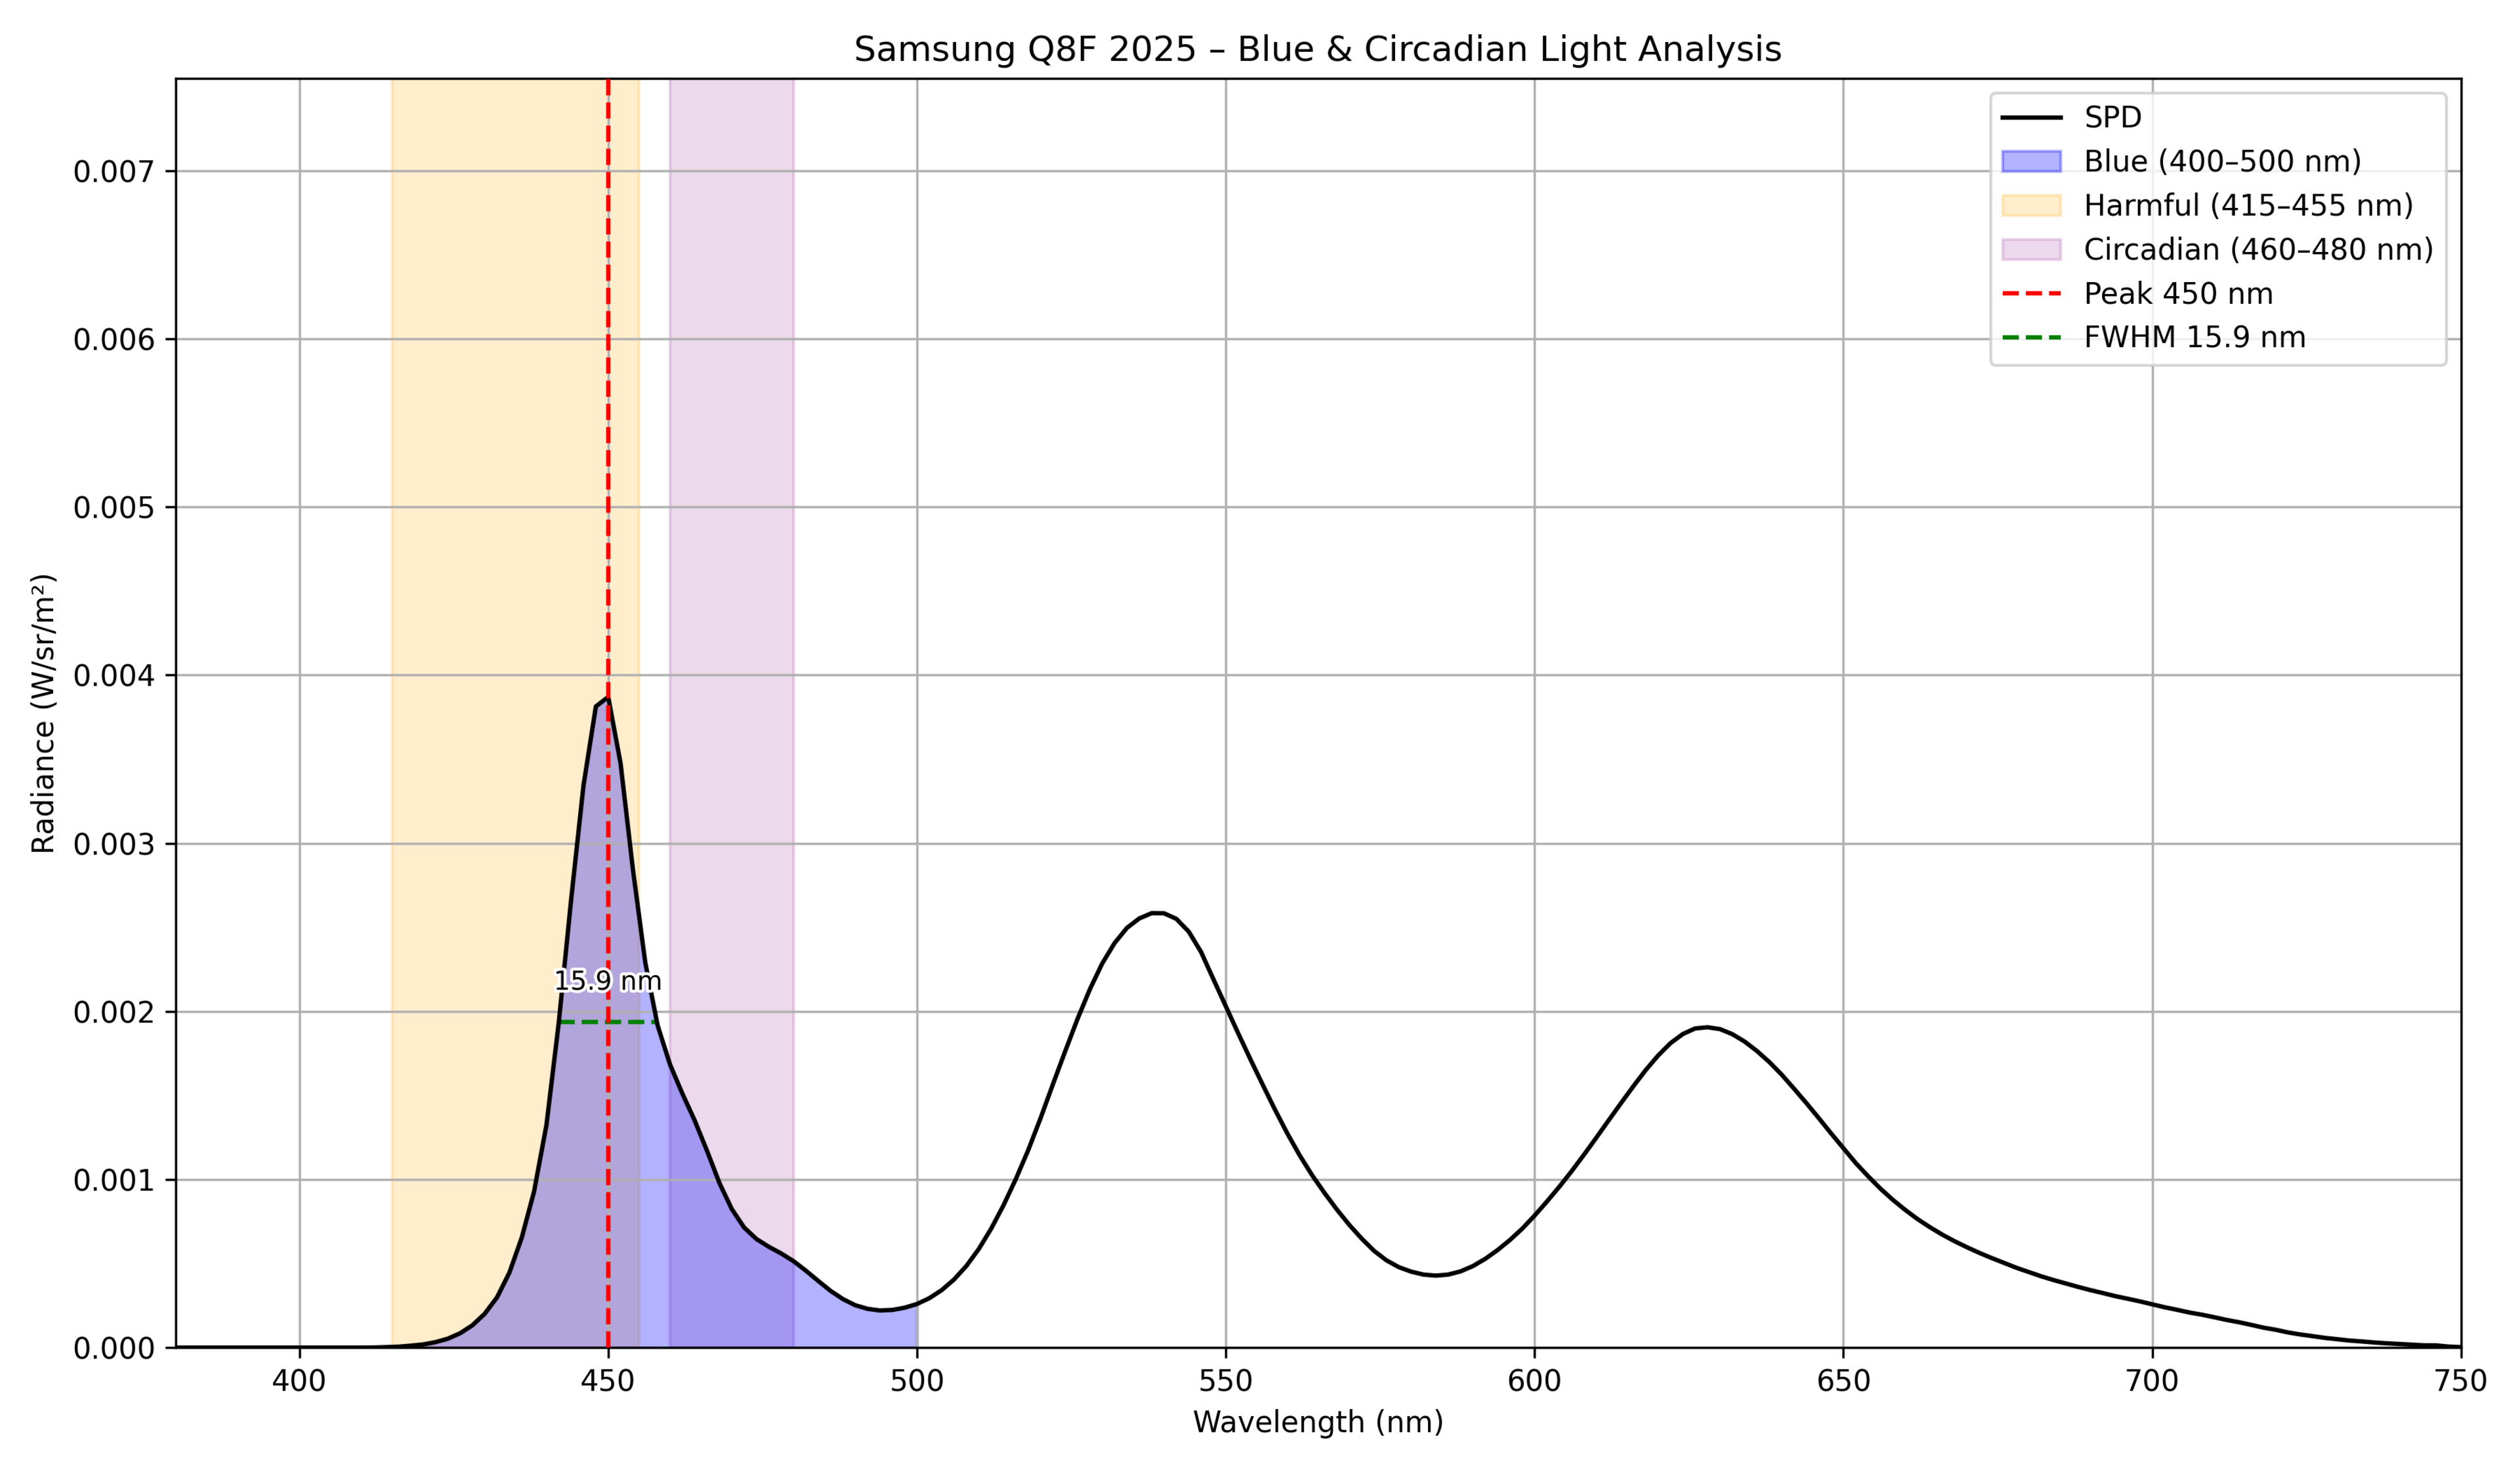 |
450 | 15.9 | 56.59 | 21.65 | 0.087377 |
| Samsung QN80F | 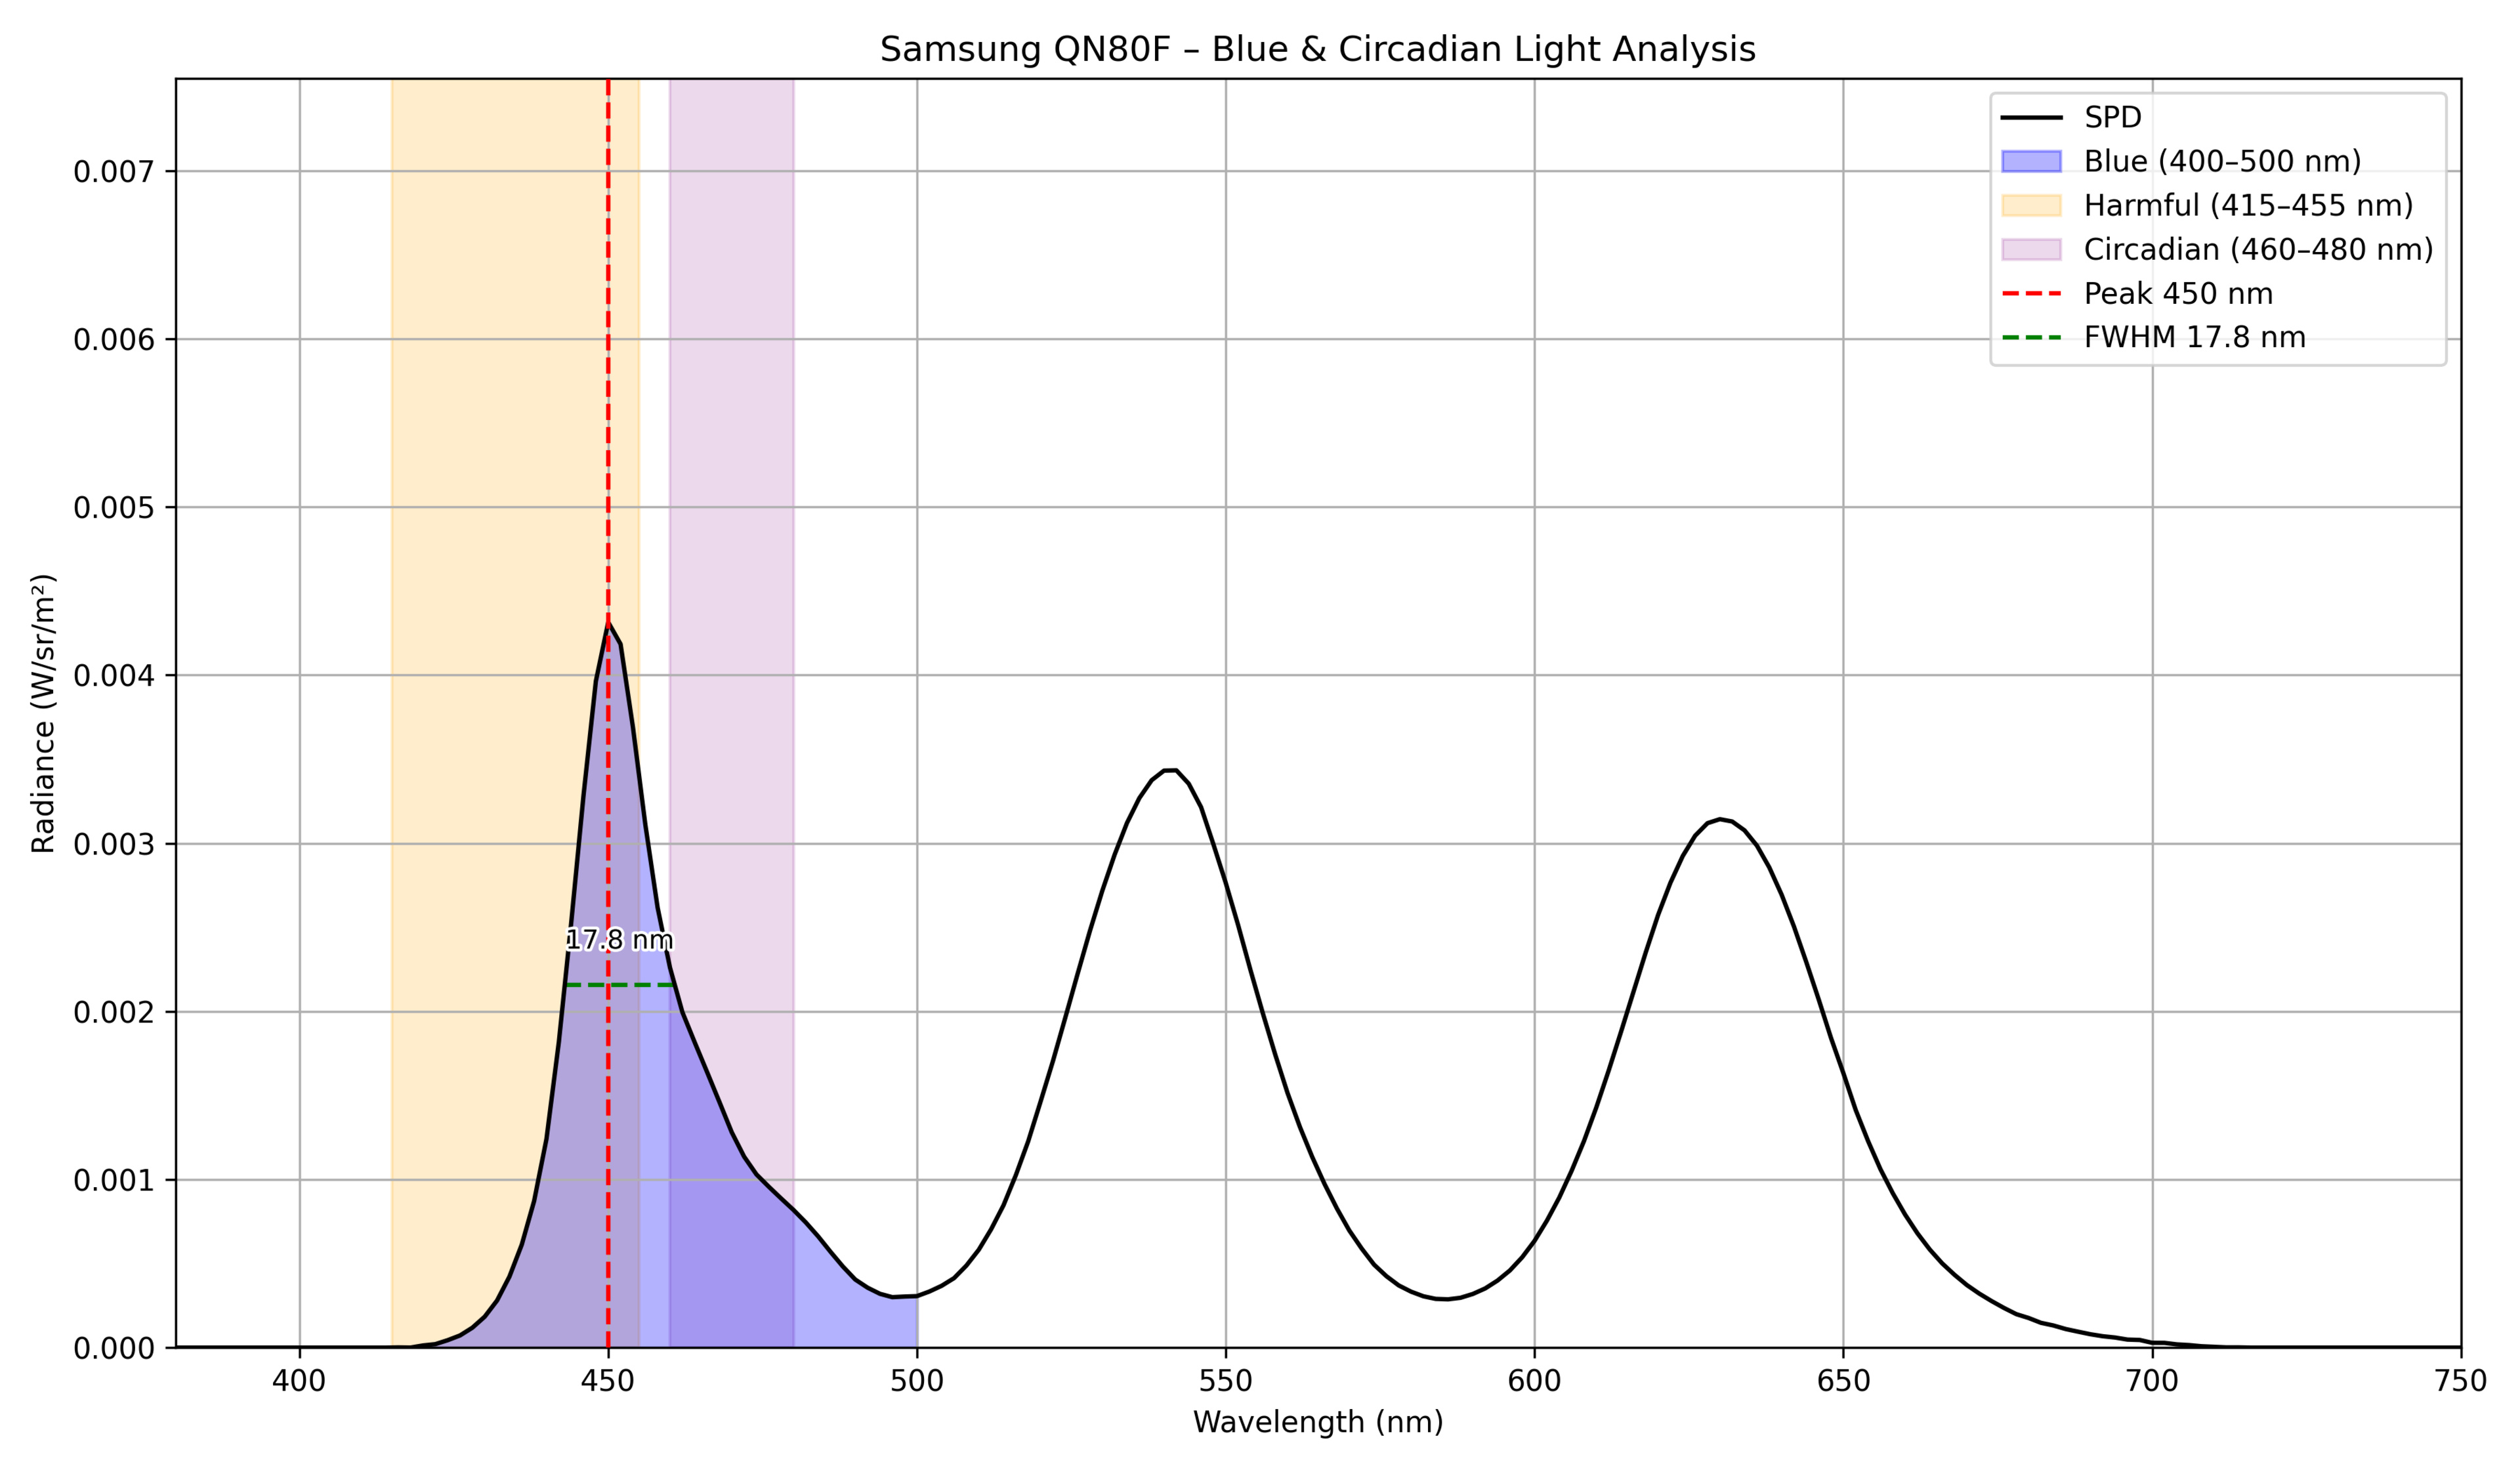 |
450 | 17.8 | 48.74 | 25.95 | 0.105944 |
| Samsung QN85D |  |
448 | 15 | 60.74 | 19.78 | 0.084763 |
| Samsung QN900D 8K |  |
448 | 16 | 58.59 | 20.55 | 0.100956 |
| Samsung QN900F 8K | 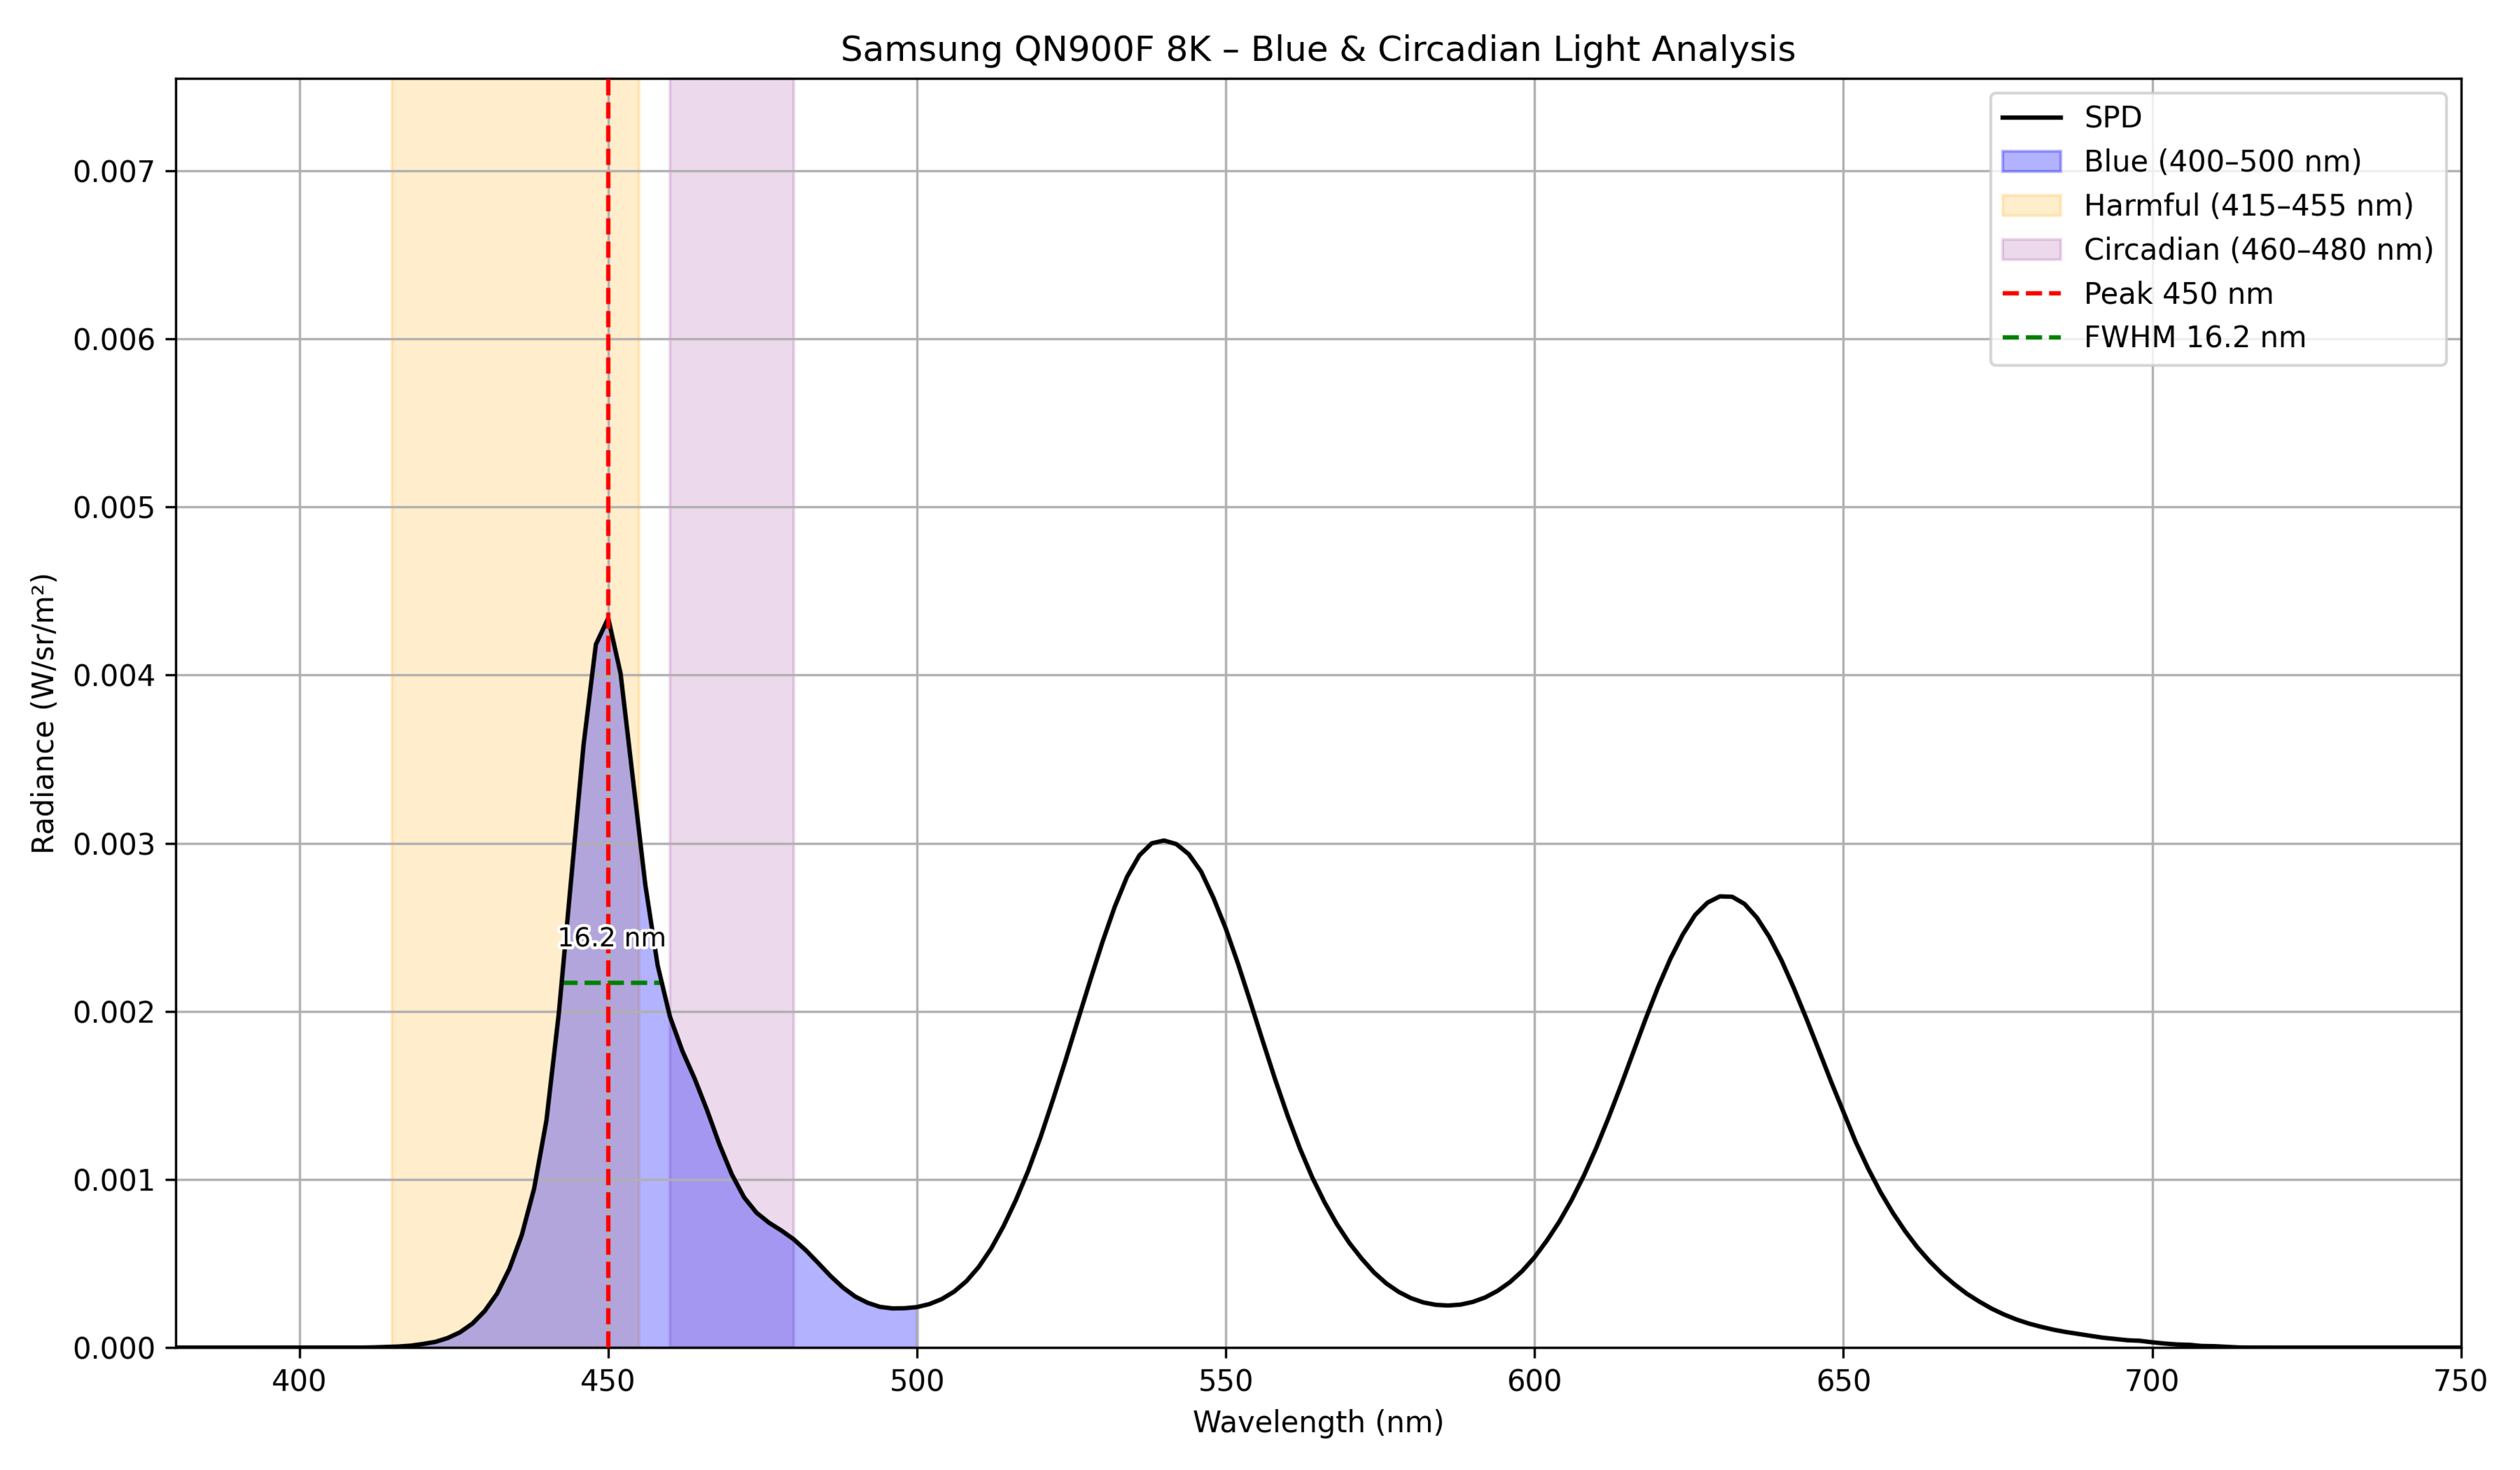 |
450 | 16.2 | 54.18 | 23.07 | 0.099368 |
| Samsung QN90D | 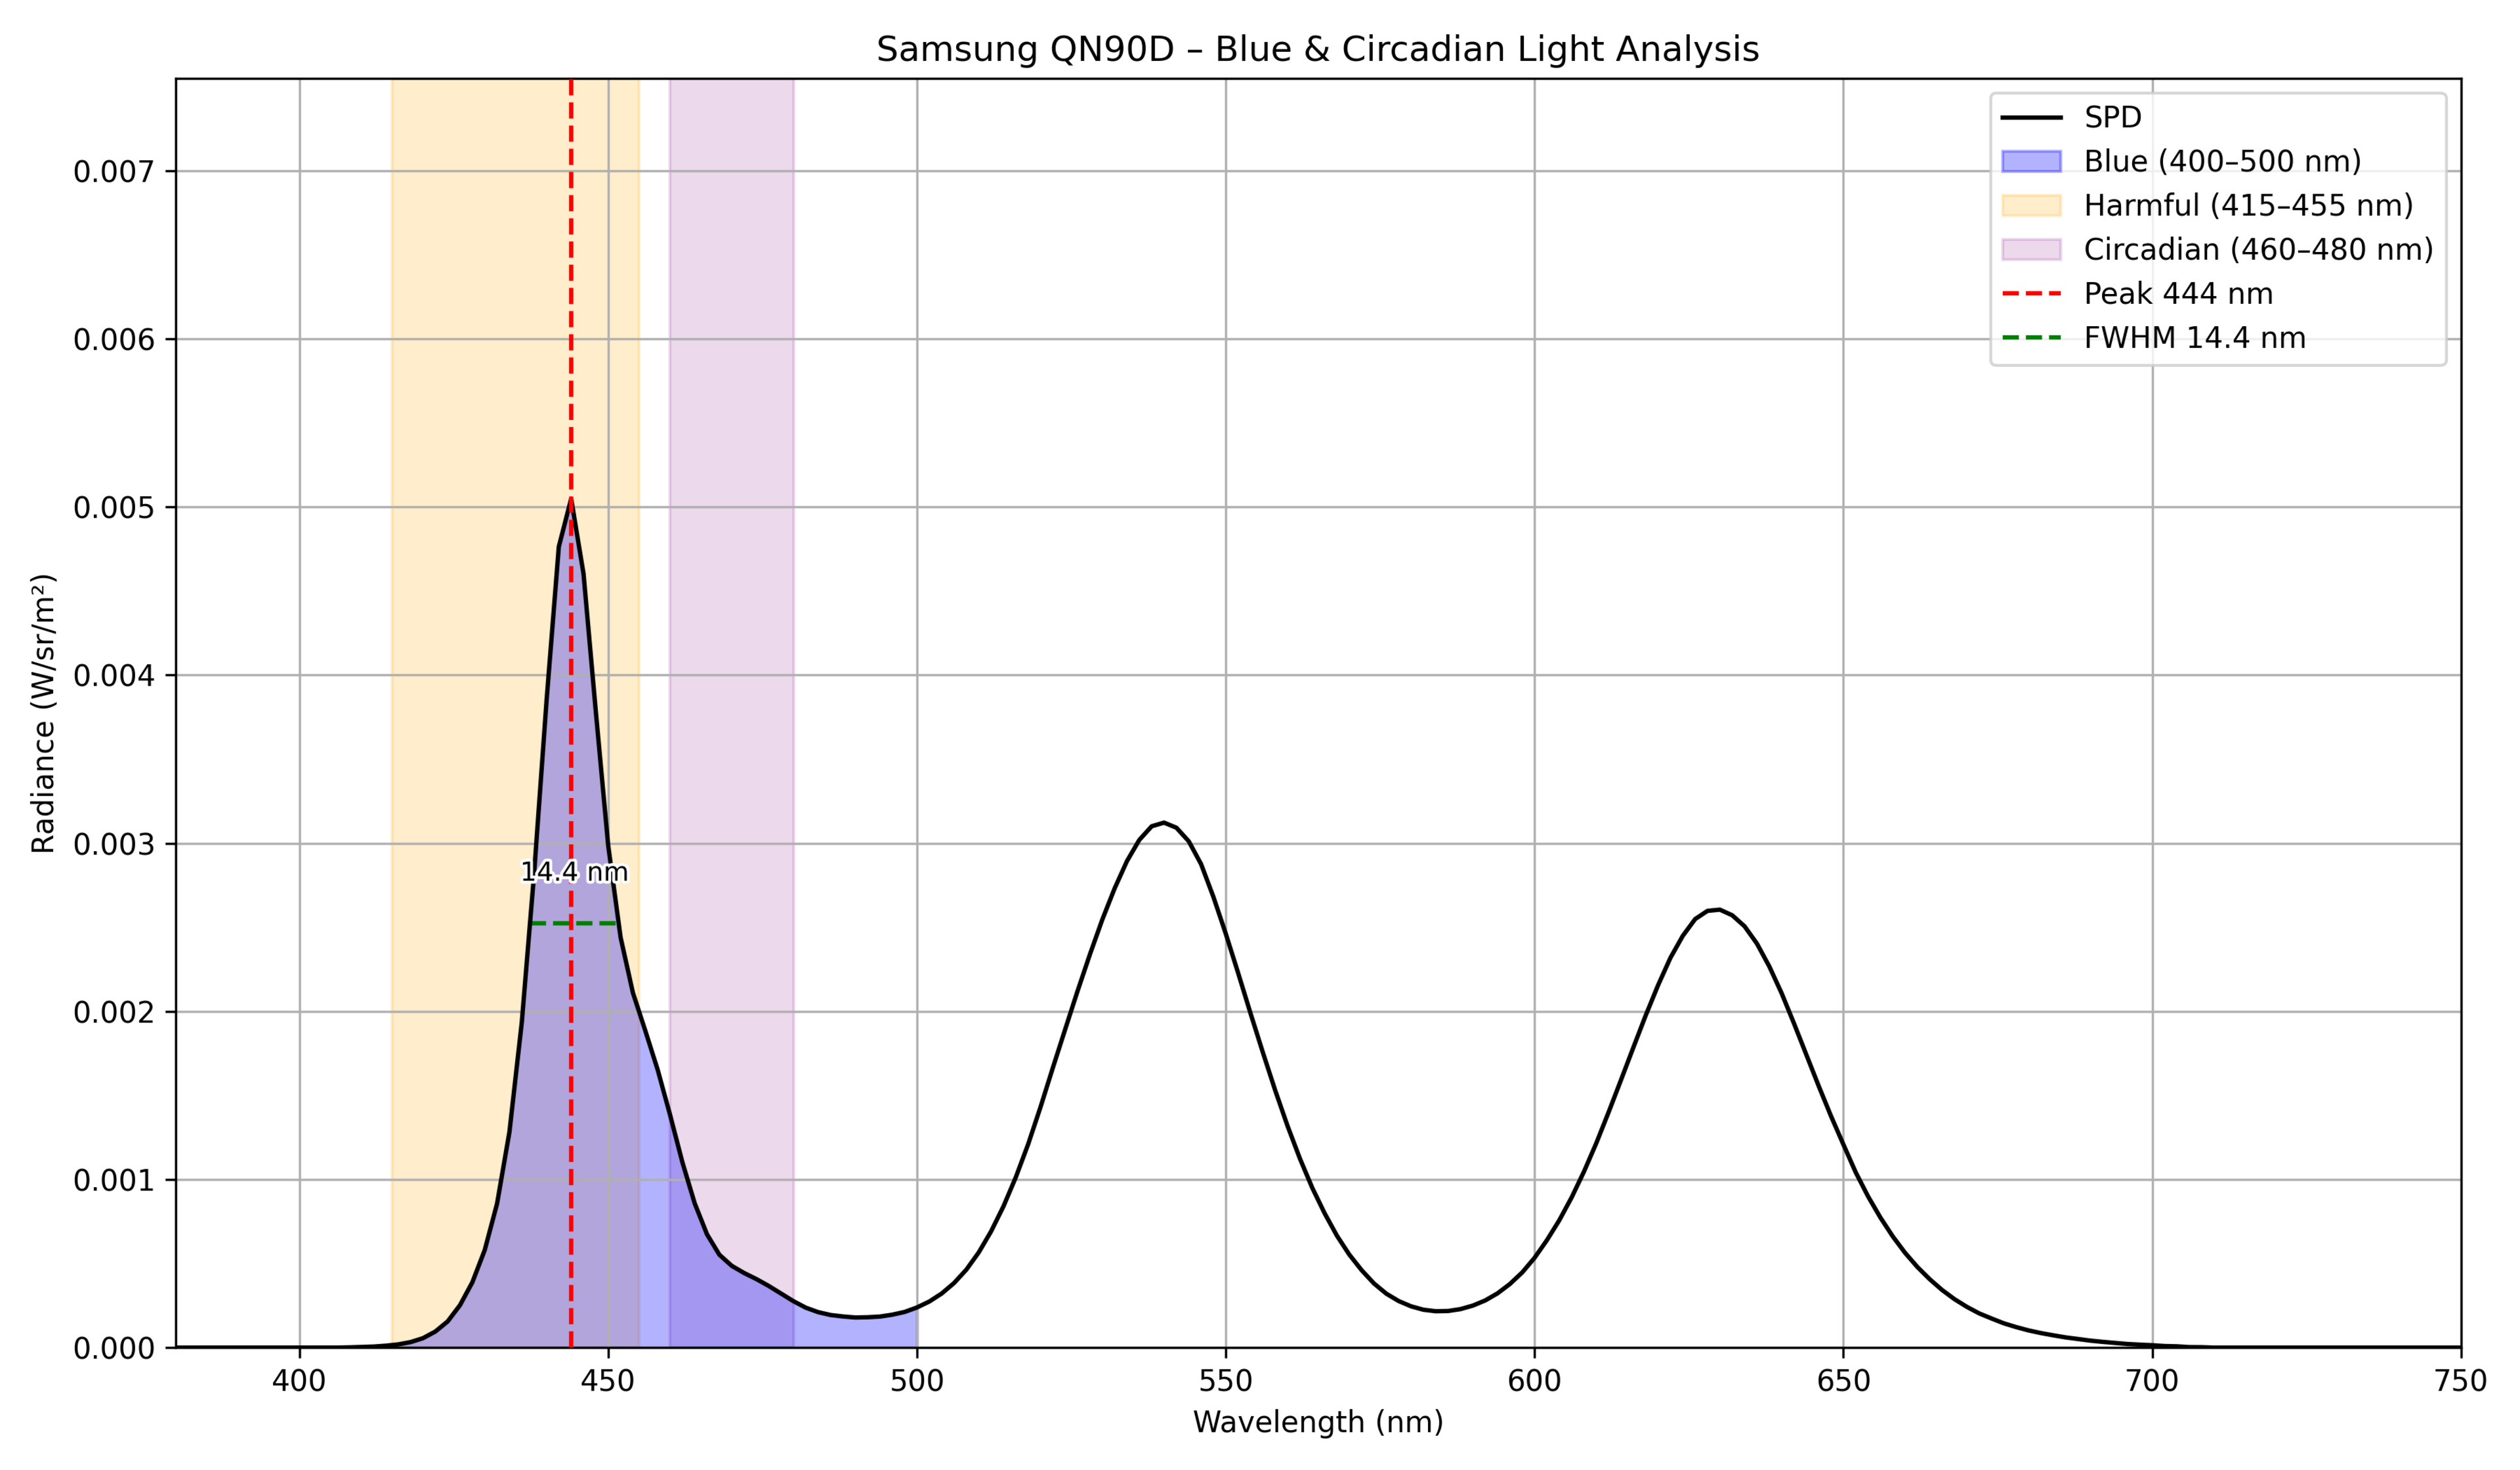 |
444 | 14.4 | 73.4 | 12 | 0.100769 |
| Samsung QN90F | 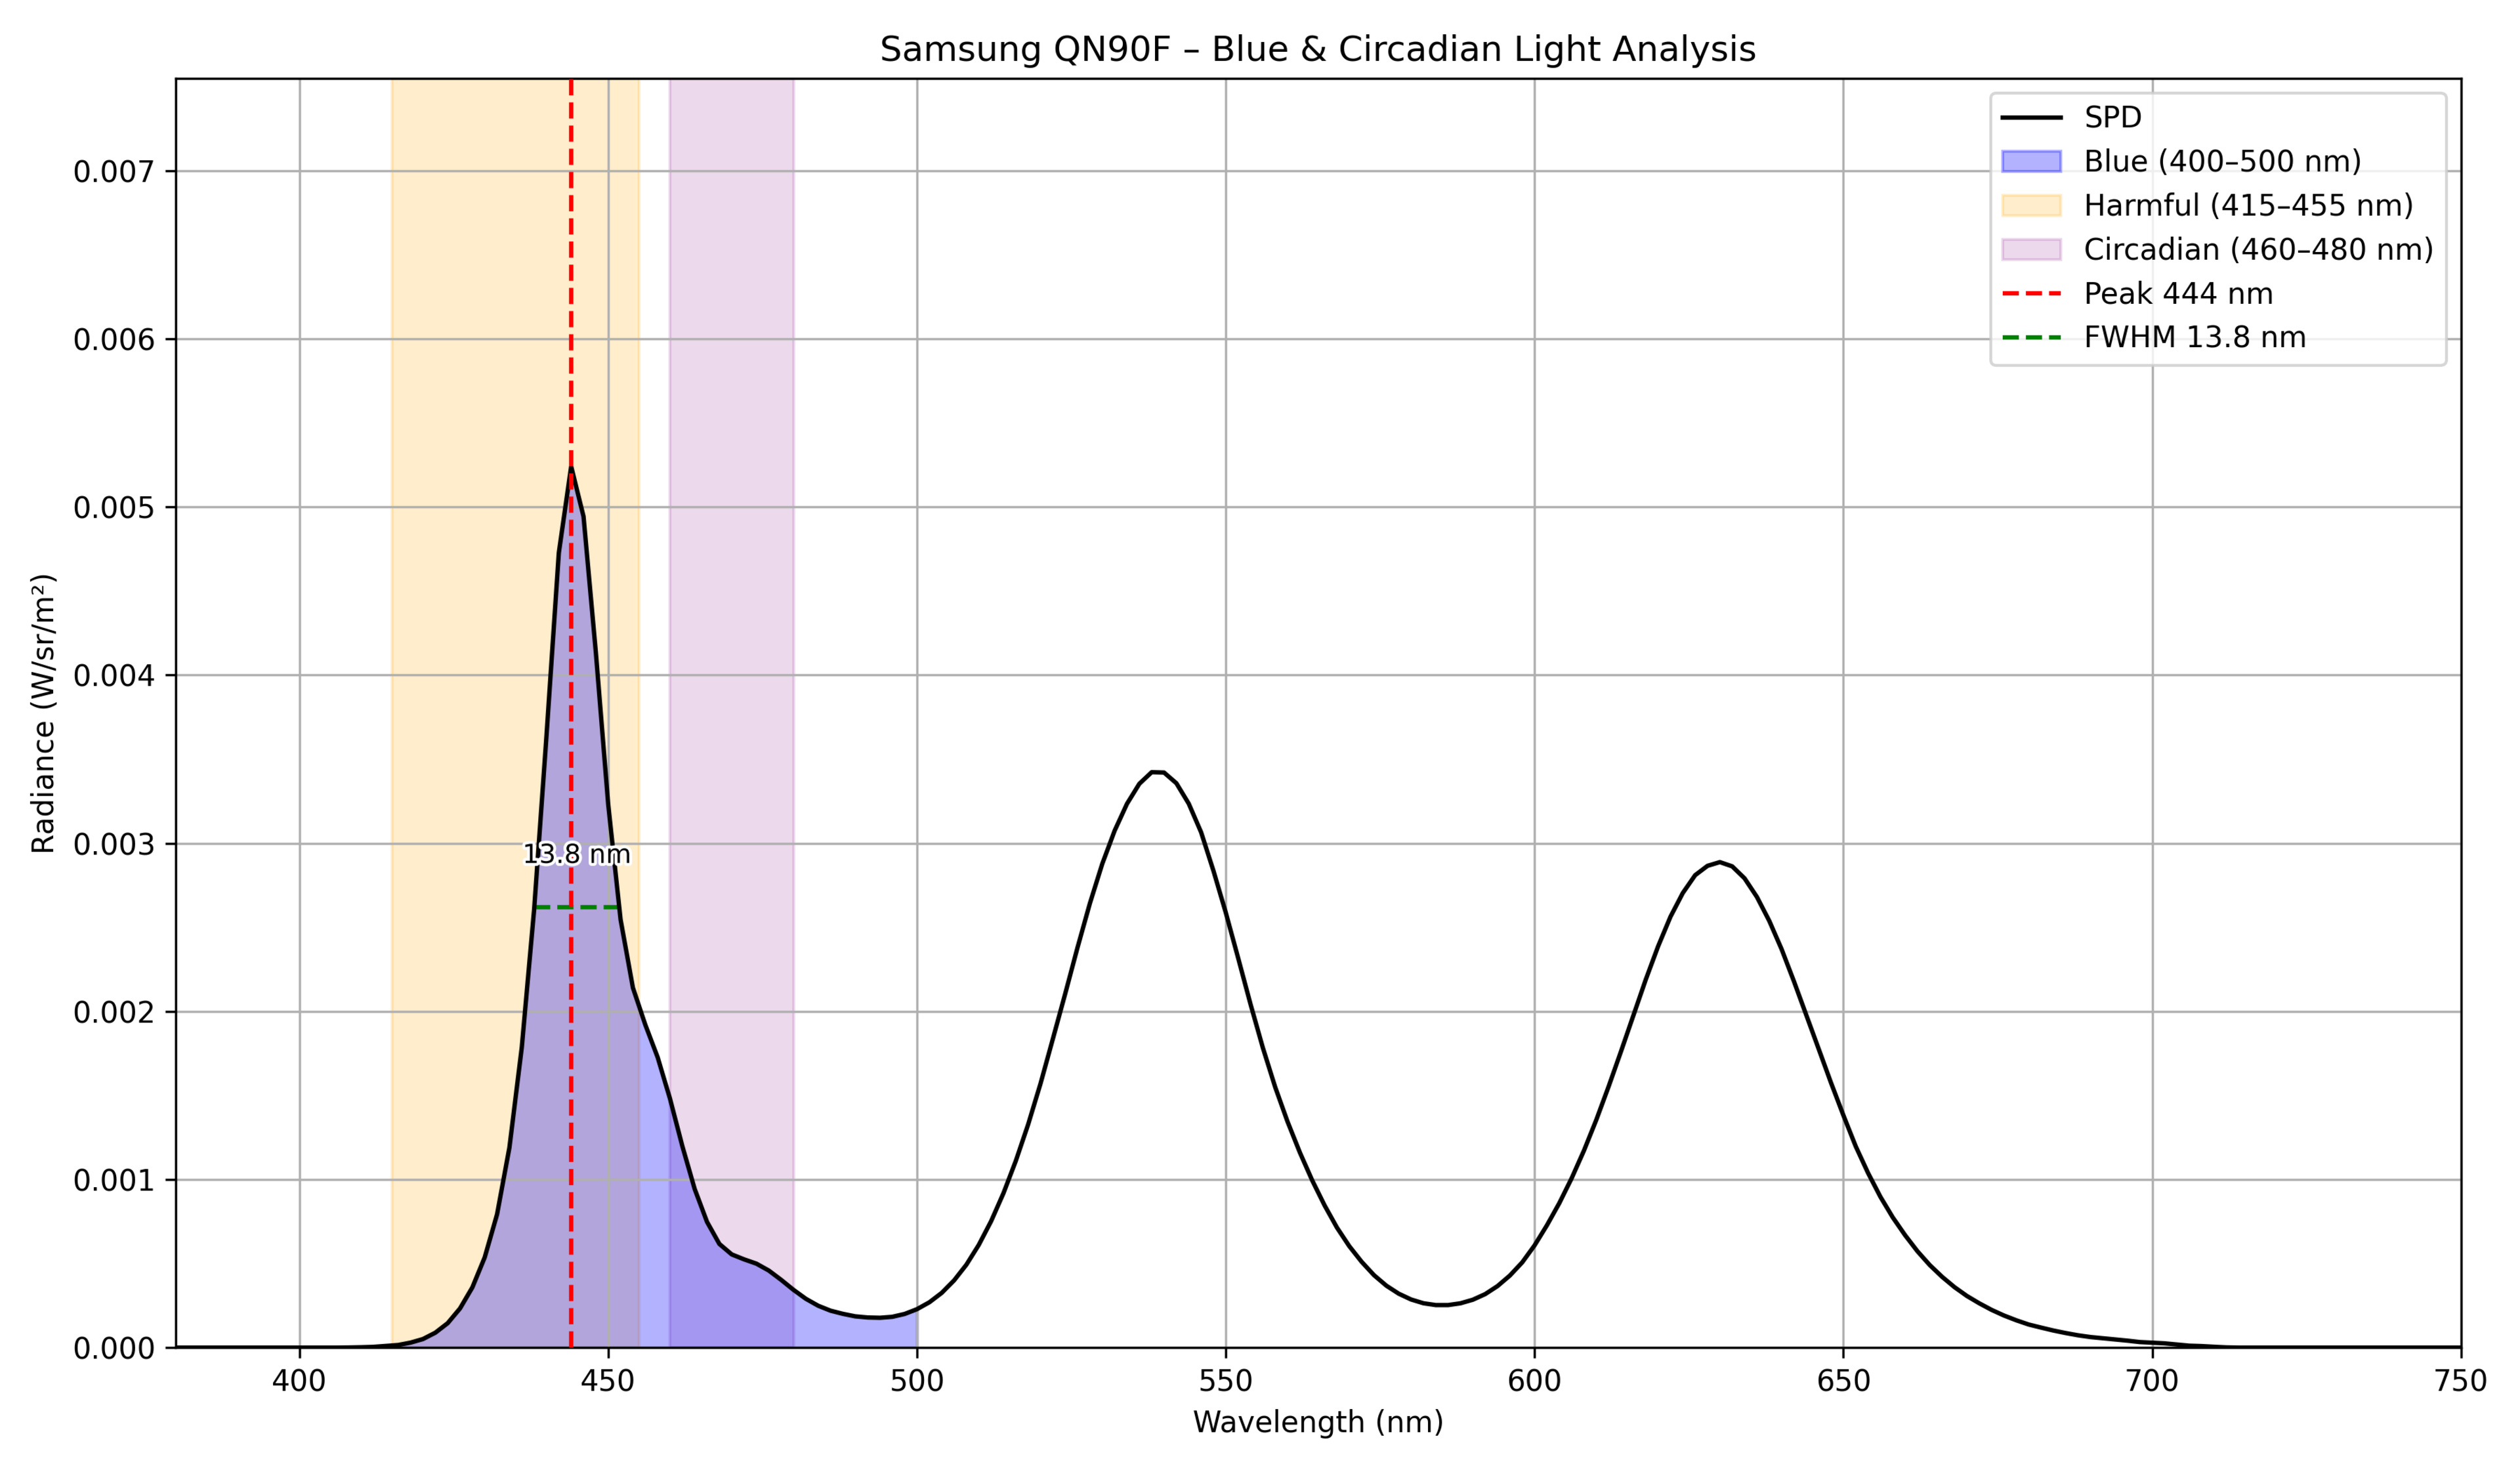 |
444 | 13.8 | 72.02 | 13.22 | 0.103739 |
| Samsung QN95D |  |
446 | 14.9 | 66.04 | 16.49 | 0.101526 |
| Samsung QN990F 8K | 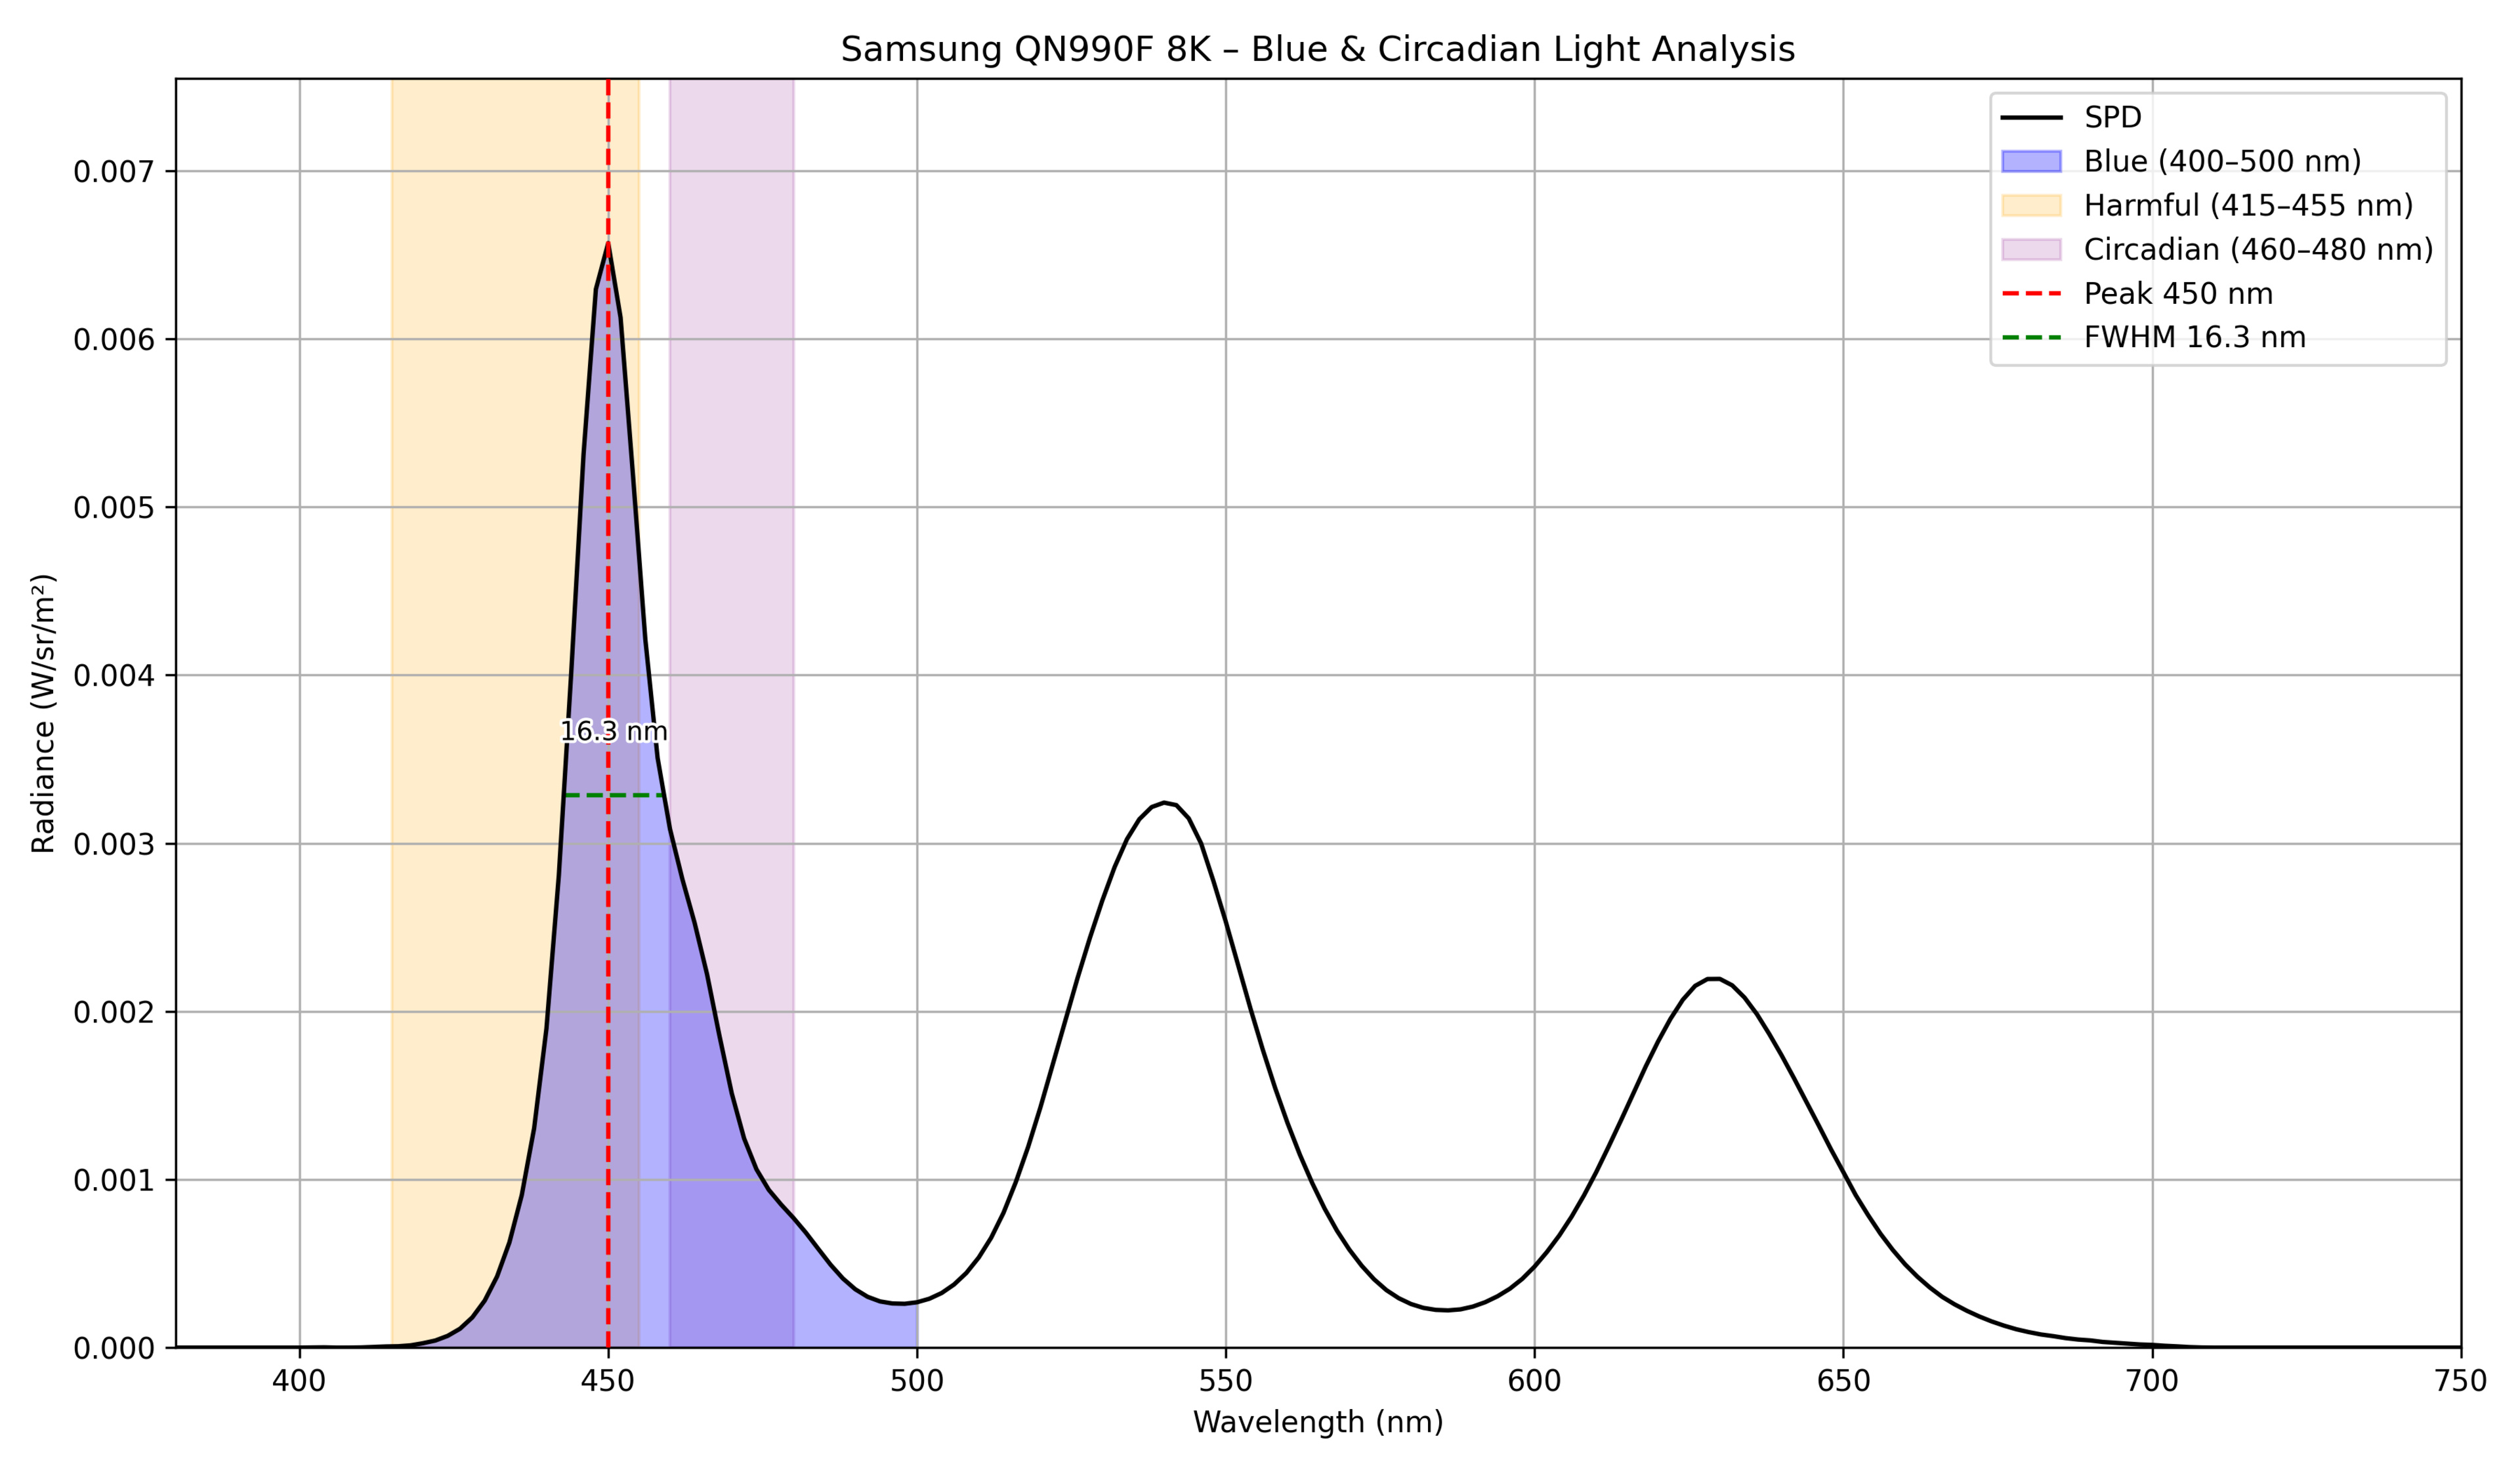 |
450 | 16.3 | 54.59 | 23.33 | 0.145109 |
| Samsung The Frame 2024 |  |
450 | 16.9 | 55.01 | 22.11 | 0.098909 |
| Samsung The Frame Pro 2025 | 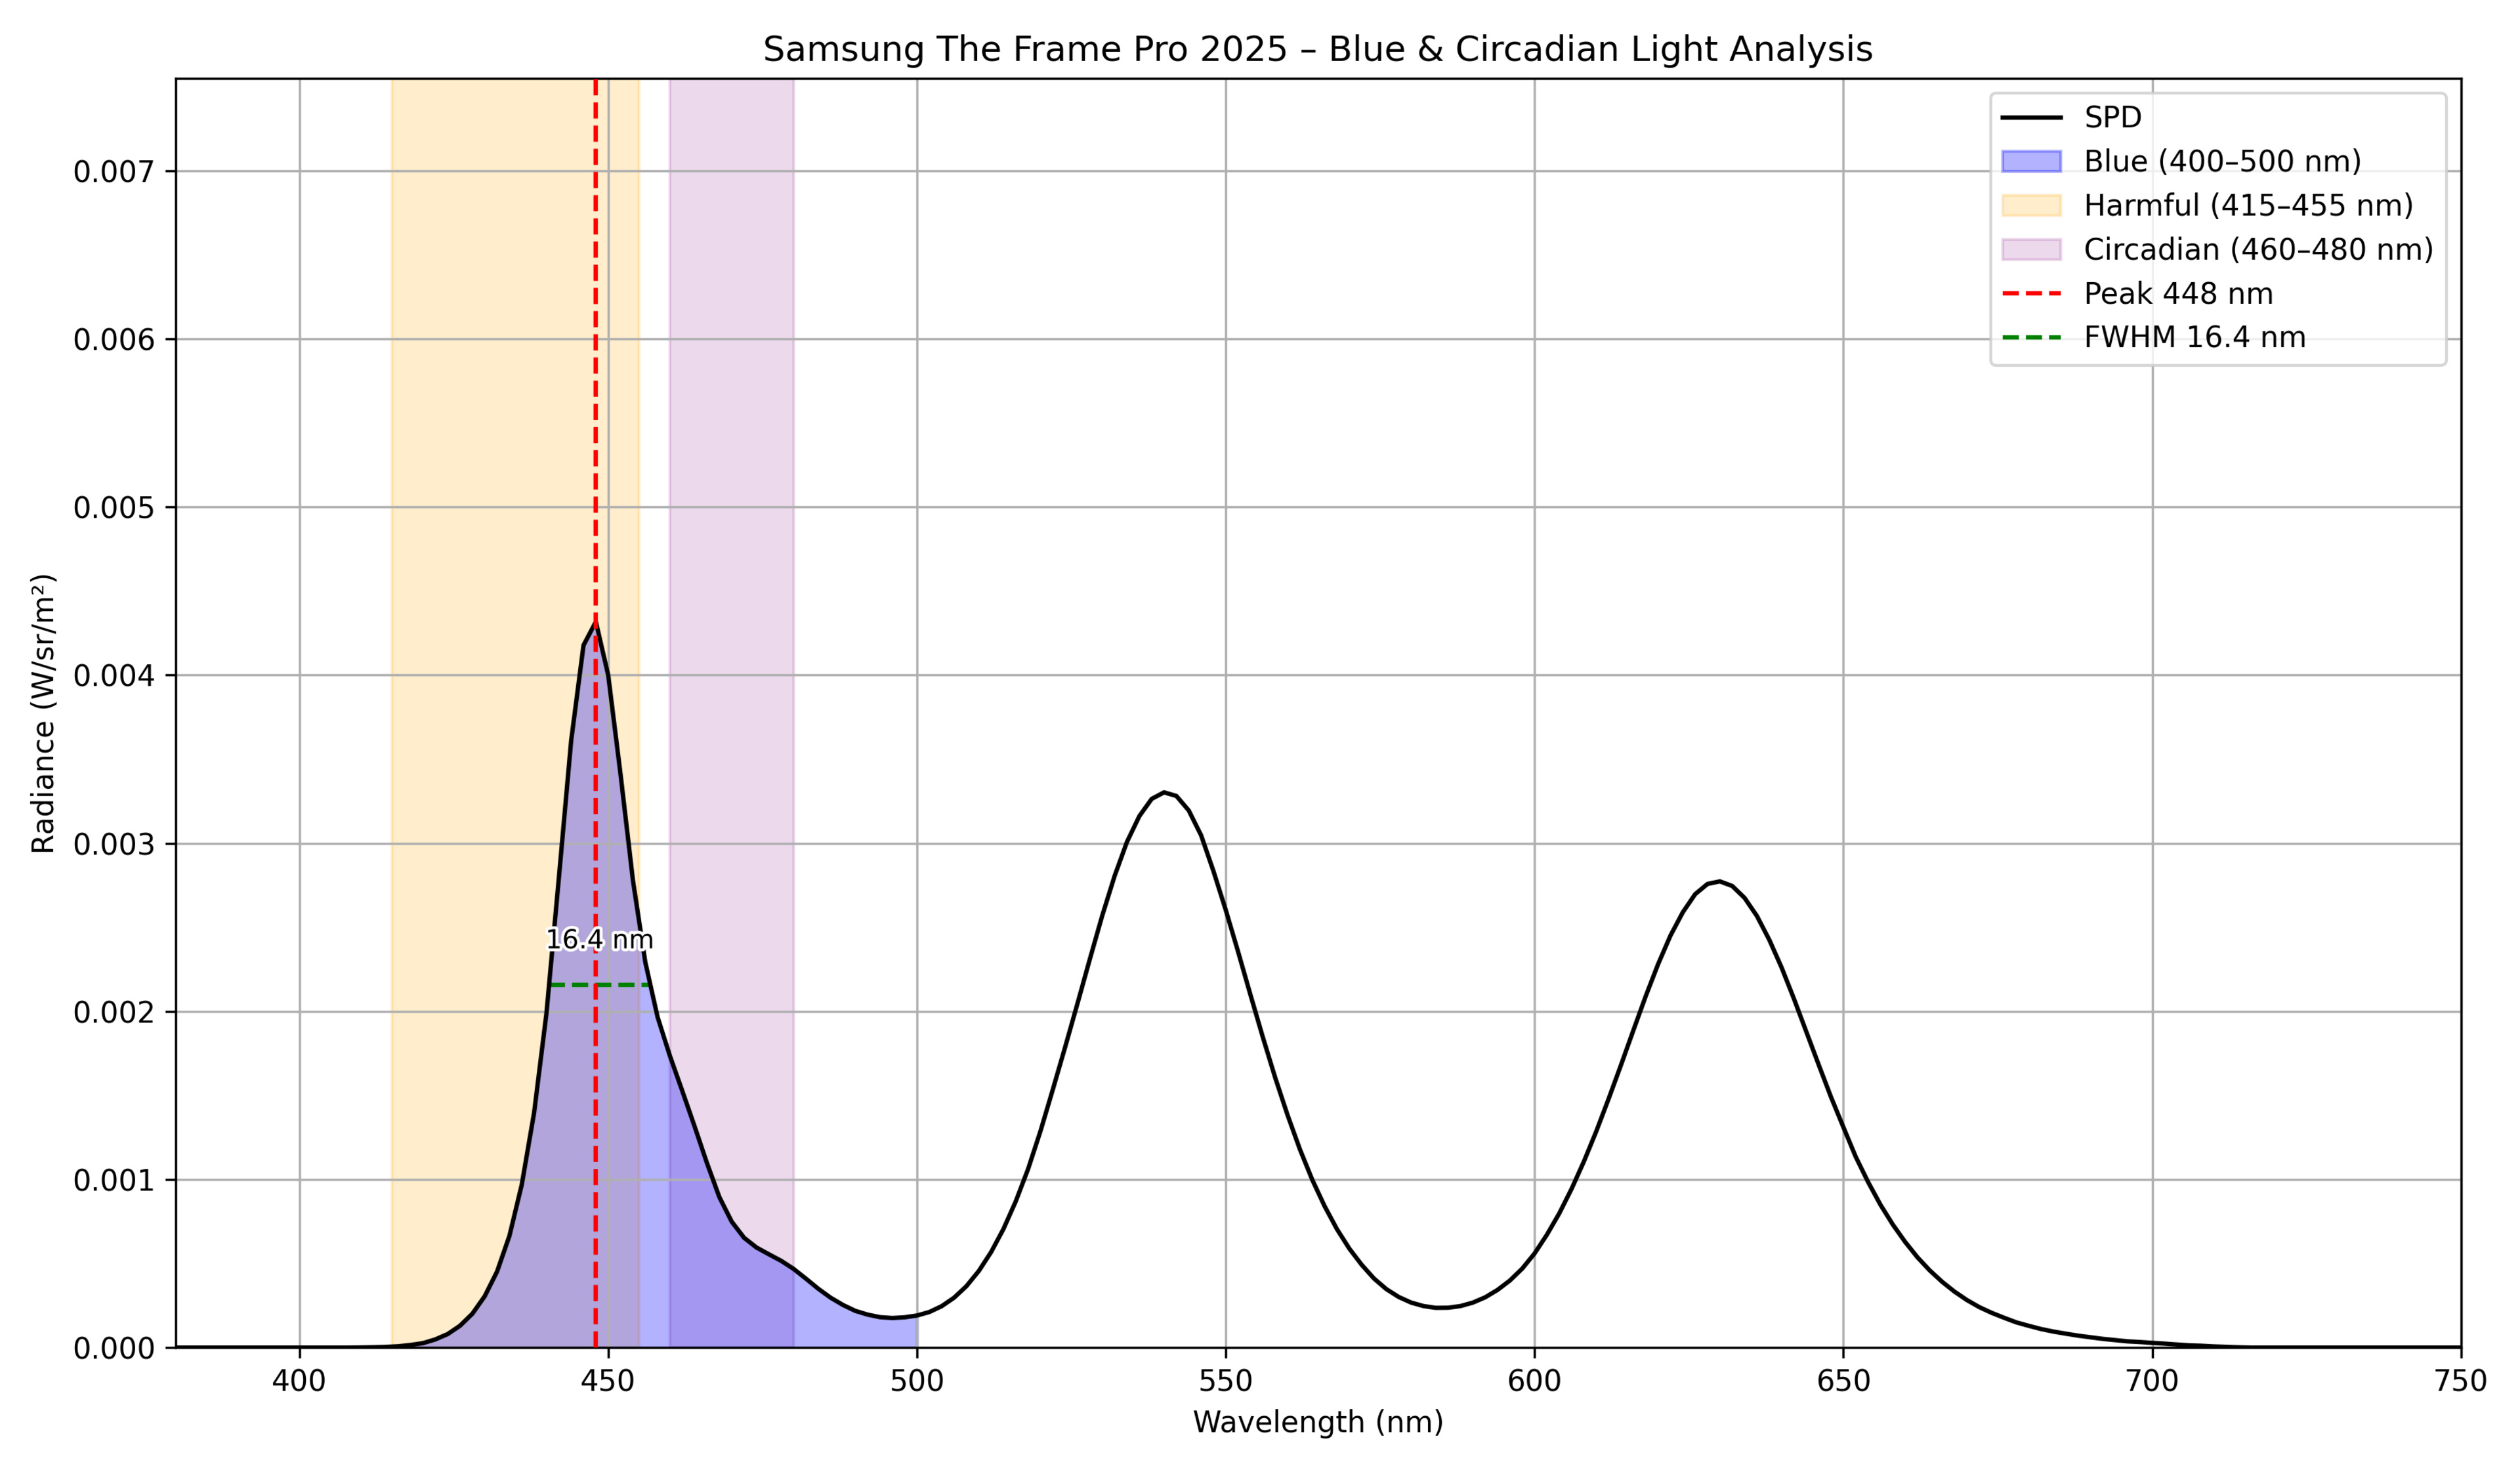 |
448 | 16.4 | 62.33 | 18.71 | 0.09621 |
| Samsung U8000F | 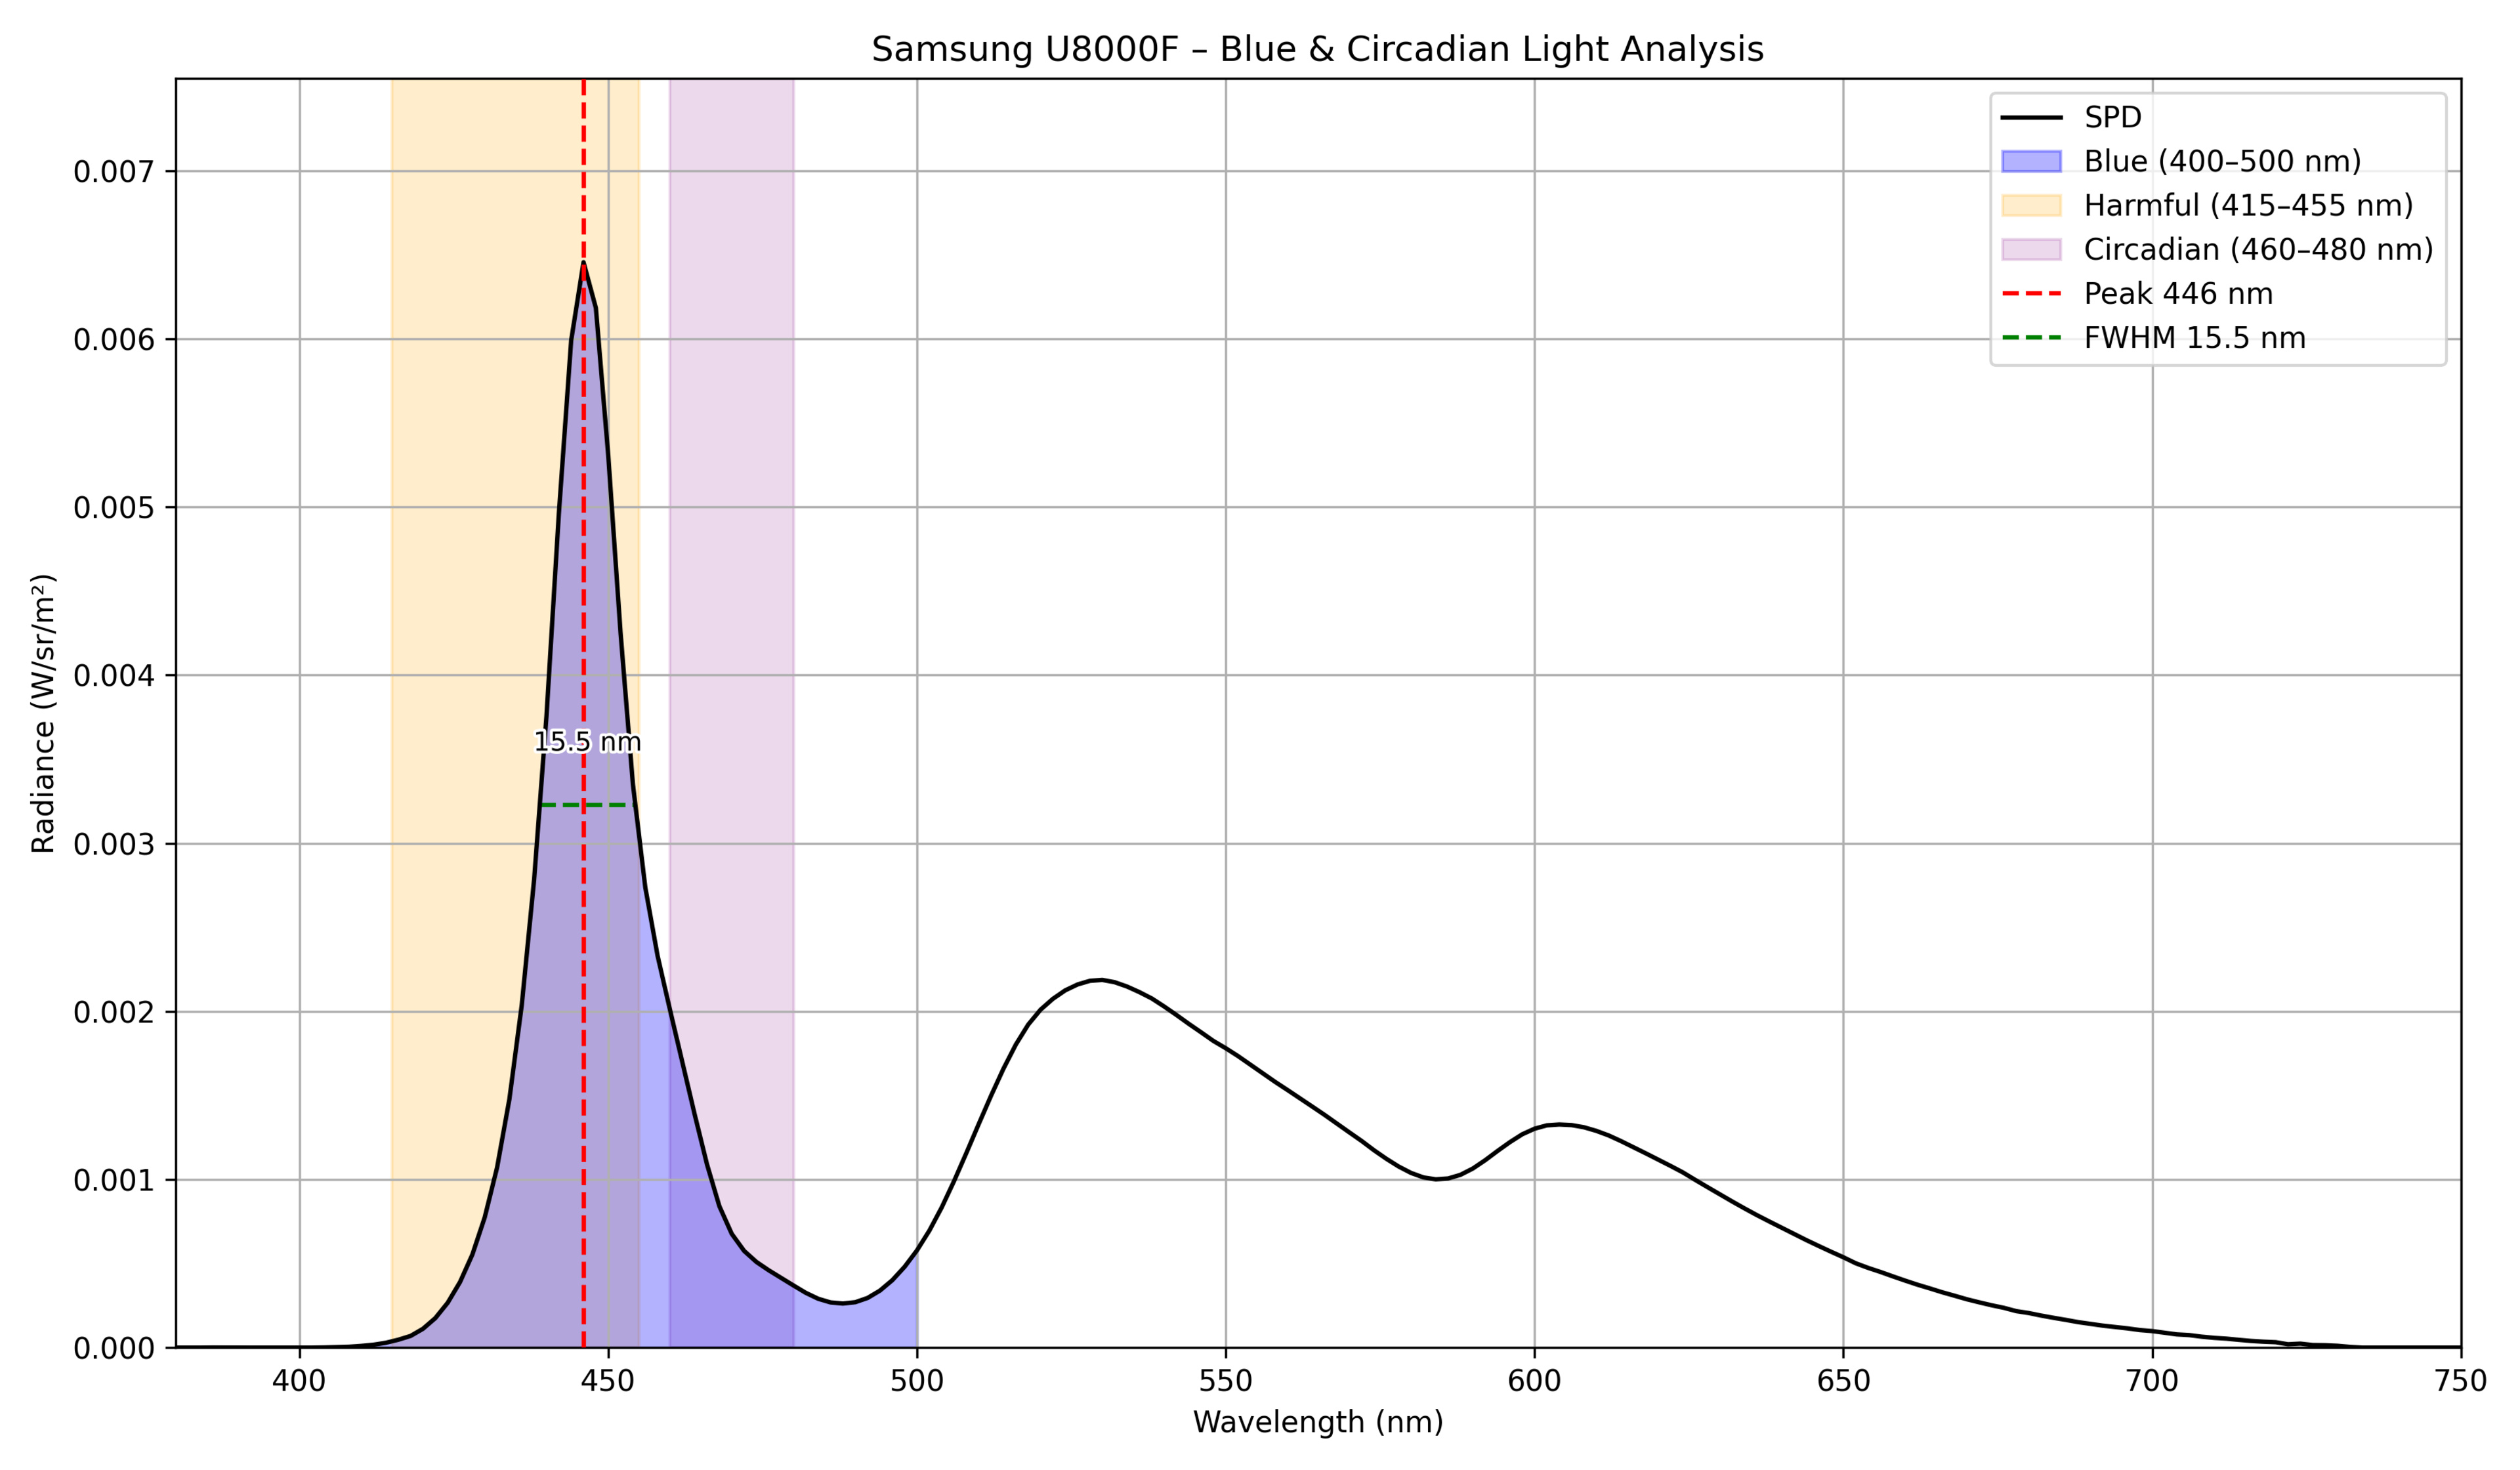 |
446 | 15.5 | 70.64 | 12.92 | 0.136798 |
| Sharp AQUOS XLED FV1 |  |
448 | 14.4 | 63.69 | 17.71 | 0.107264 |
| Sony BRAVIA 2 II | 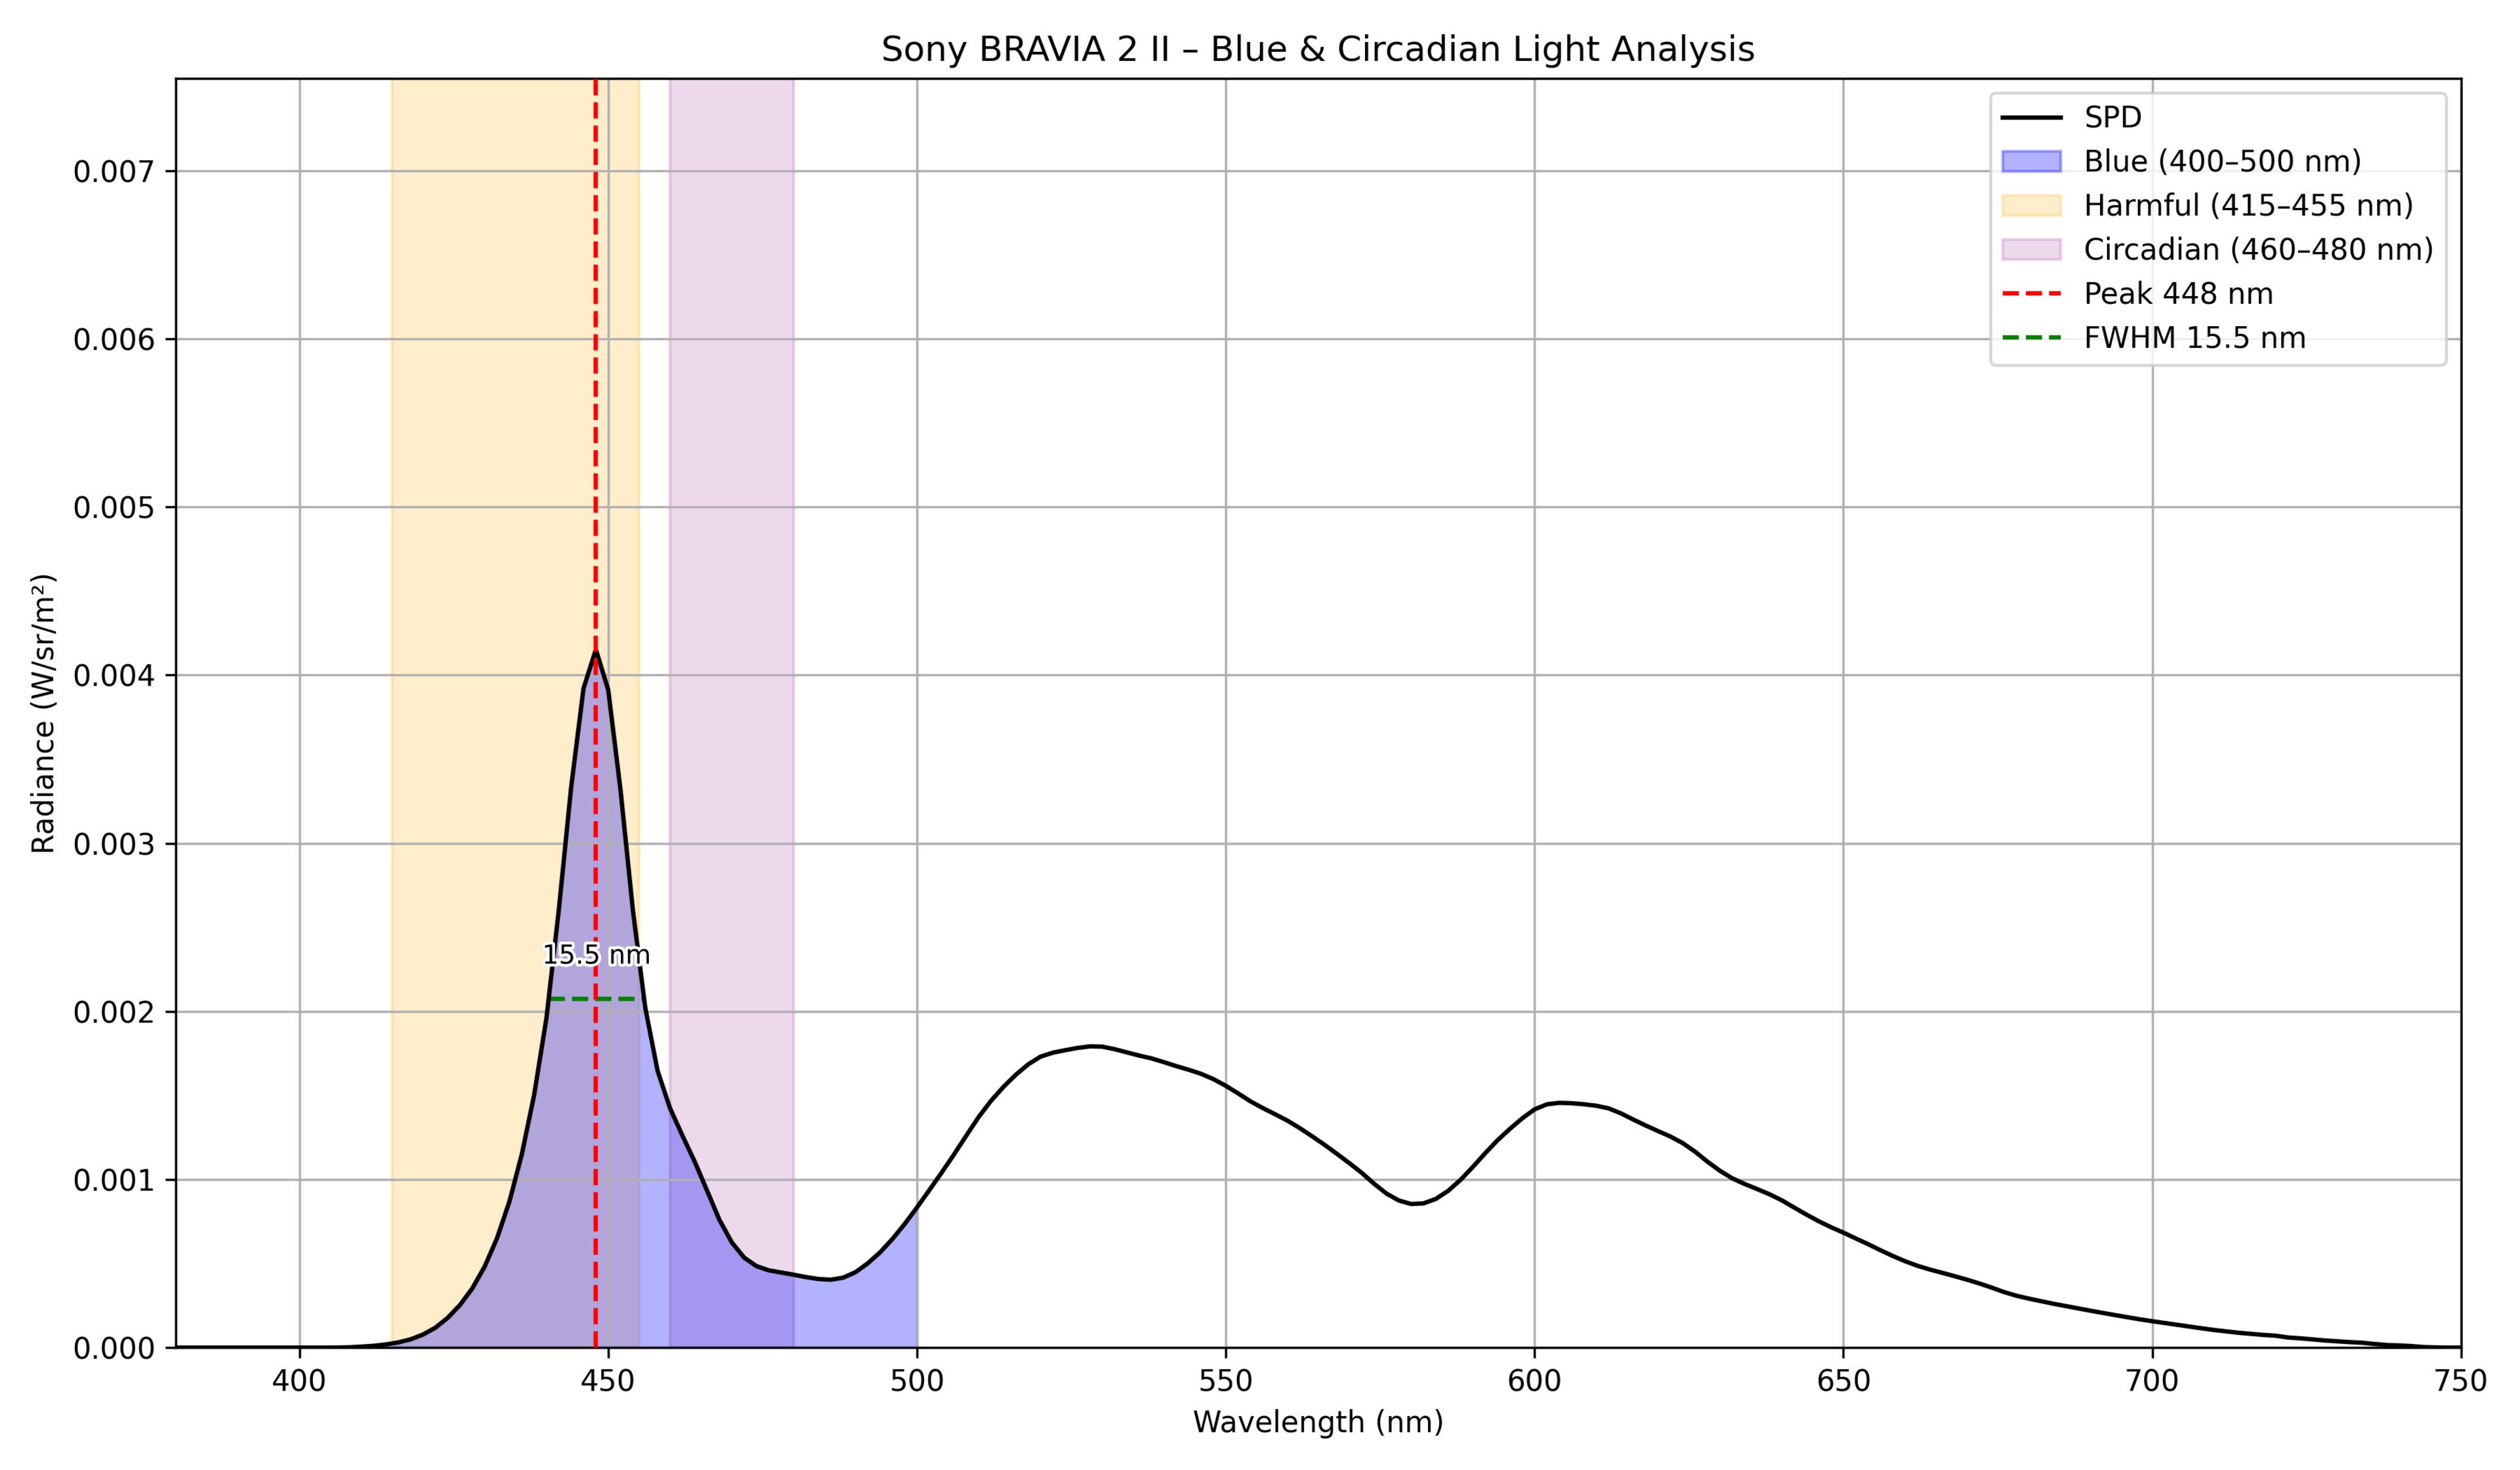 |
448 | 15.5 | 62.07 | 15.51 | 0.097303 |
| Sony BRAVIA 3 | 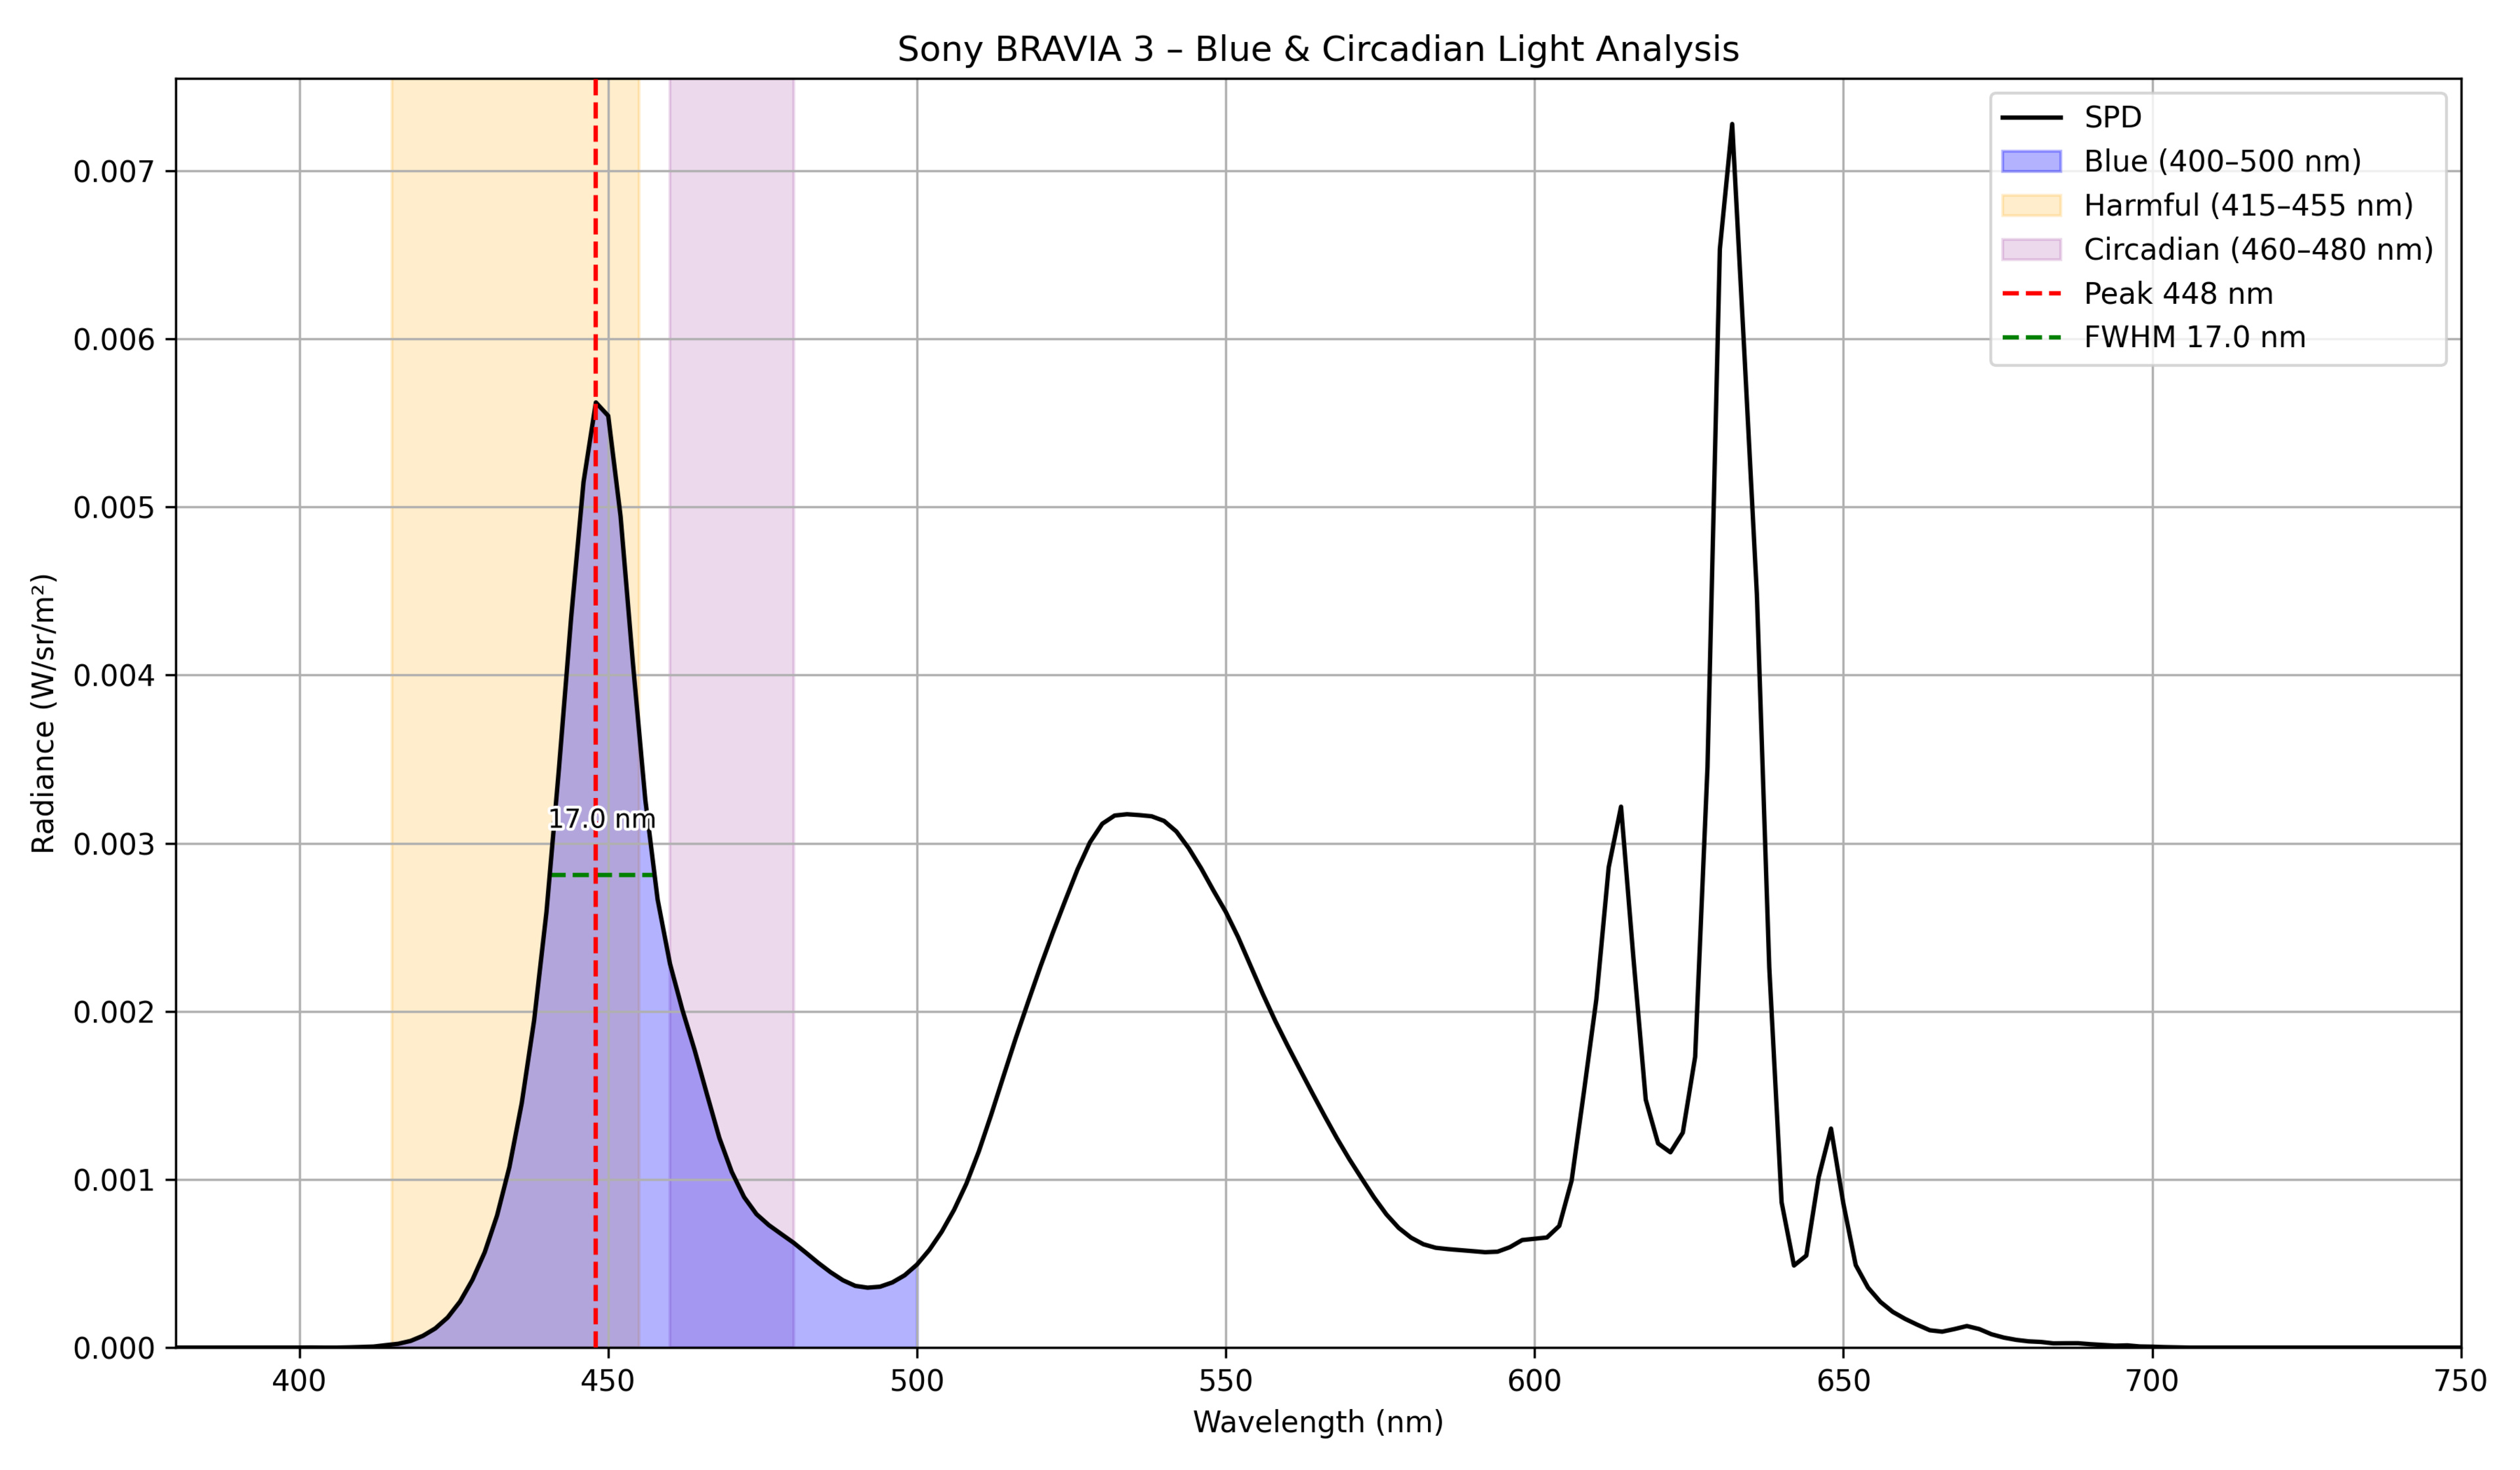 |
448 | 17 | 61.28 | 18.31 | 0.132458 |
| Sony BRAVIA 5 | 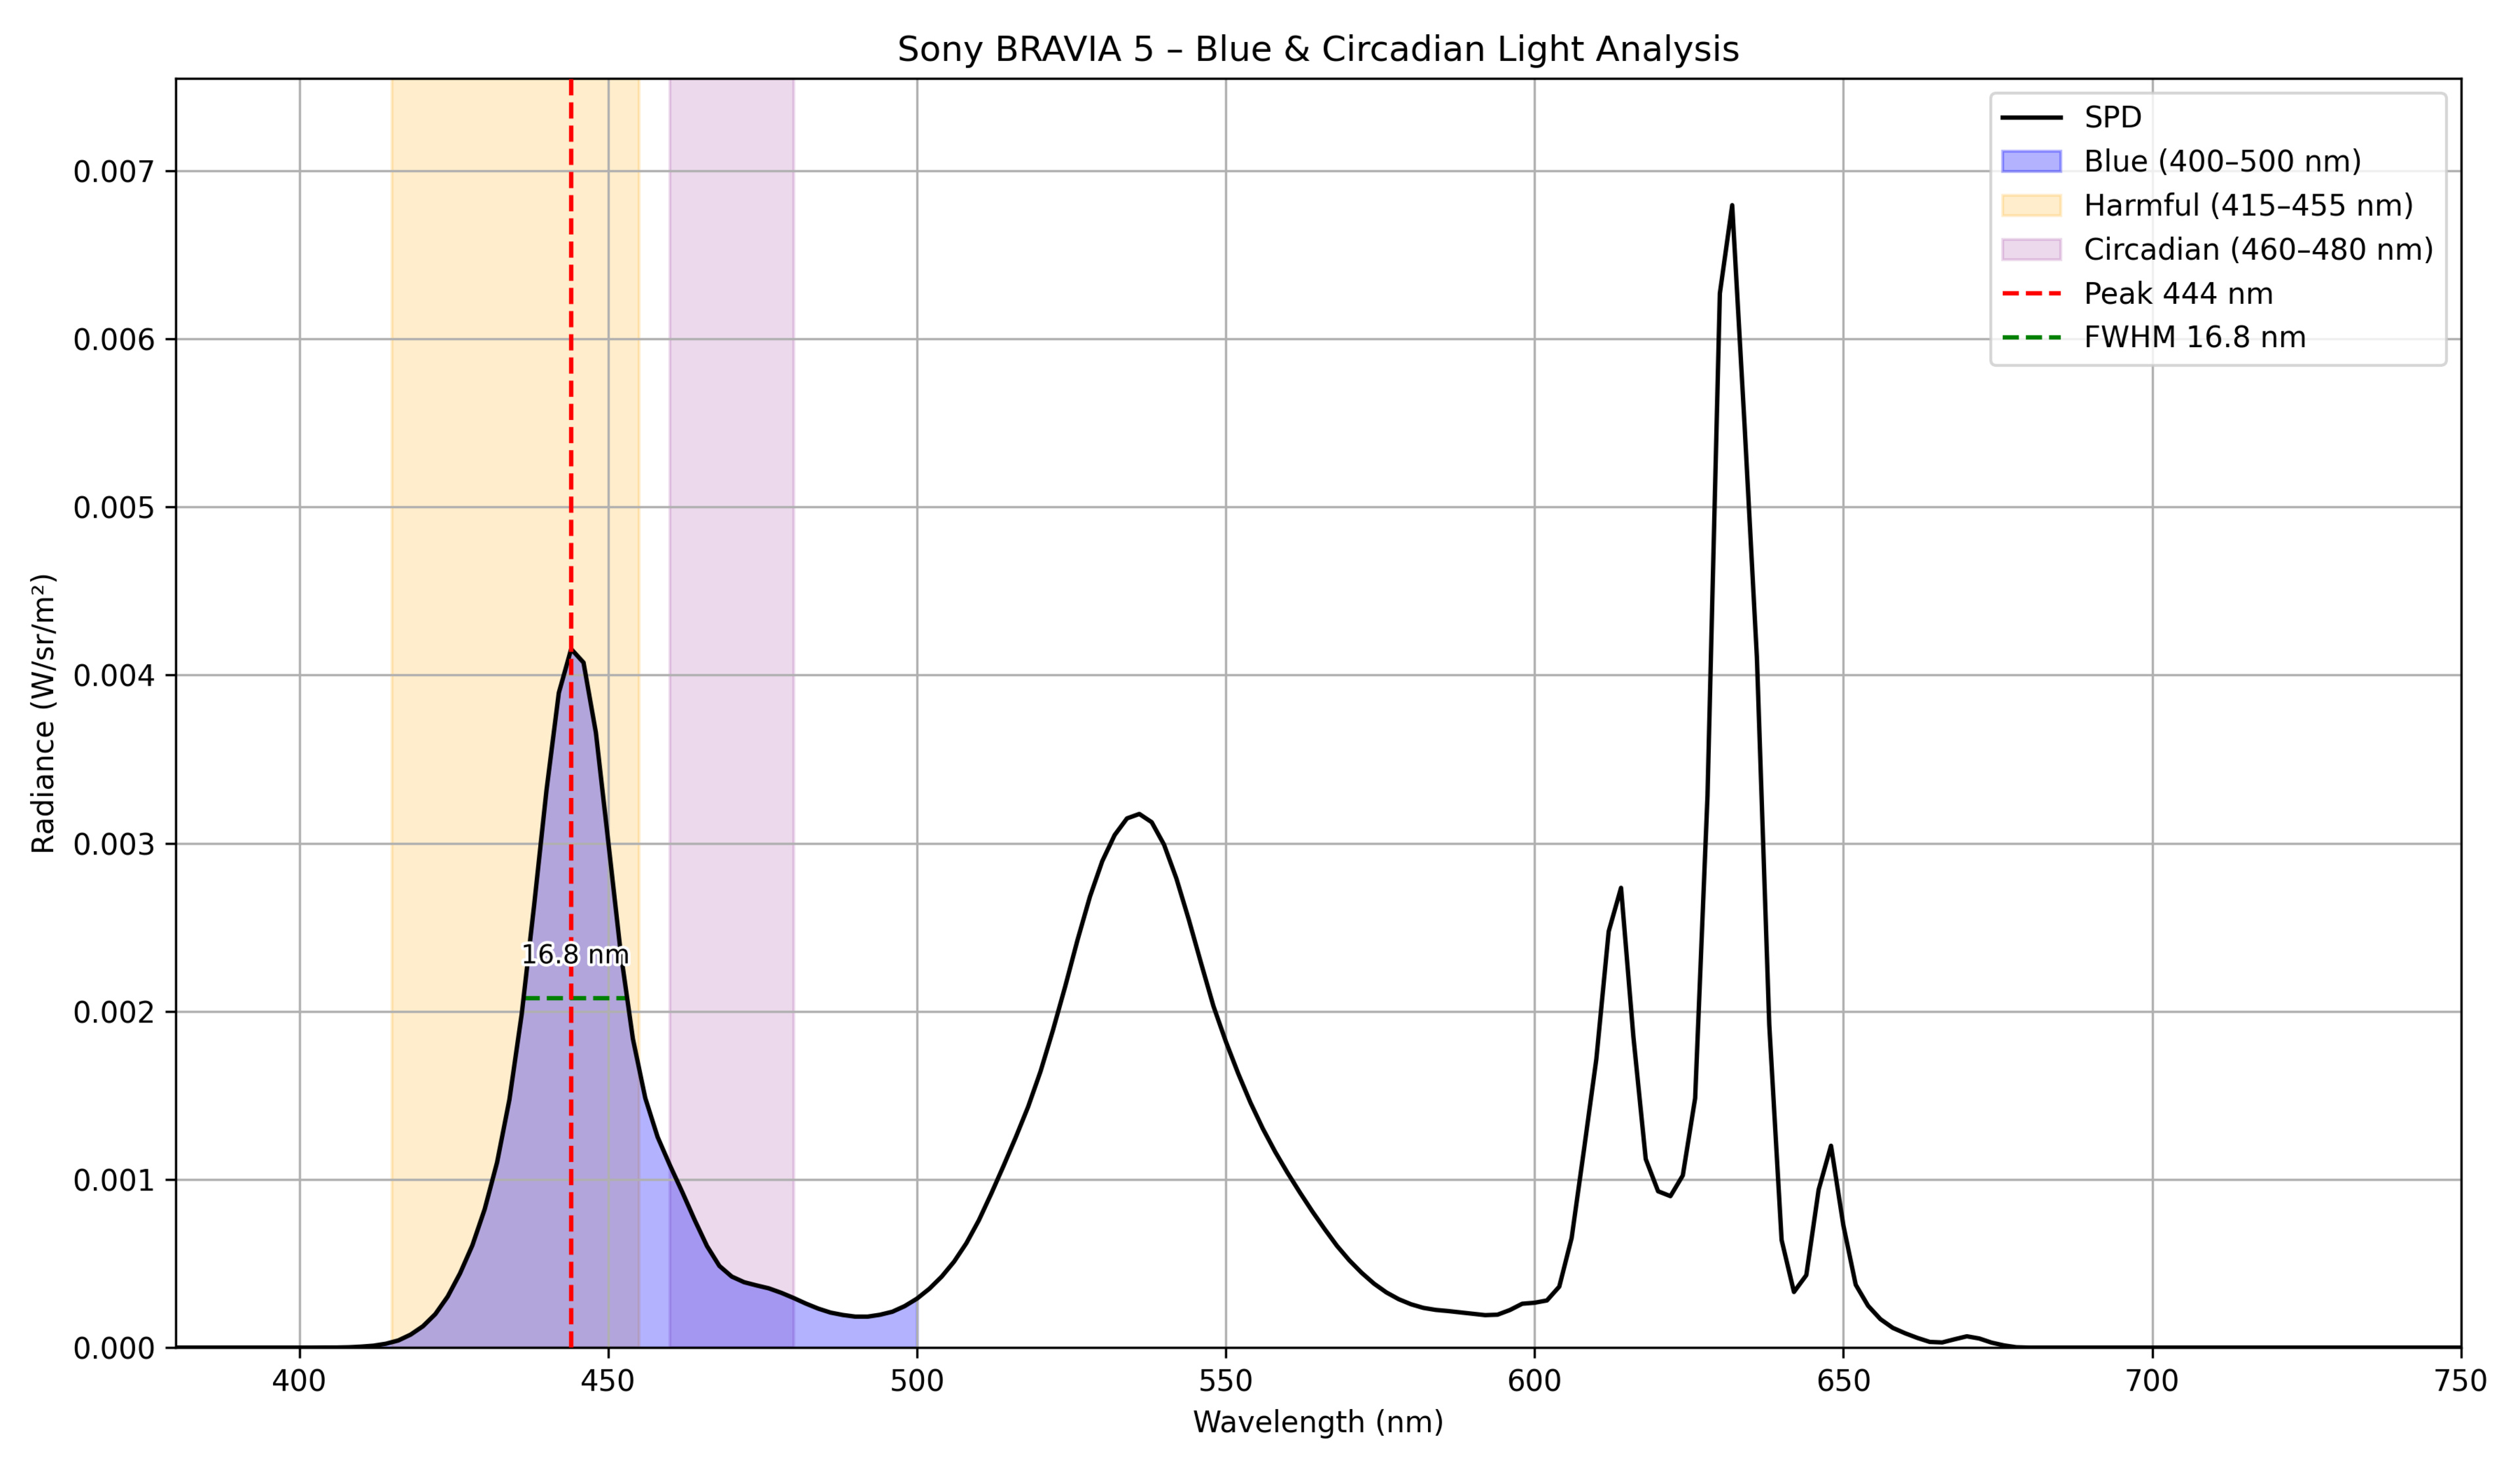 |
444 | 16.8 | 74.88 | 11.33 | 0.093959 |
| Sony BRAVIA 5 98 | 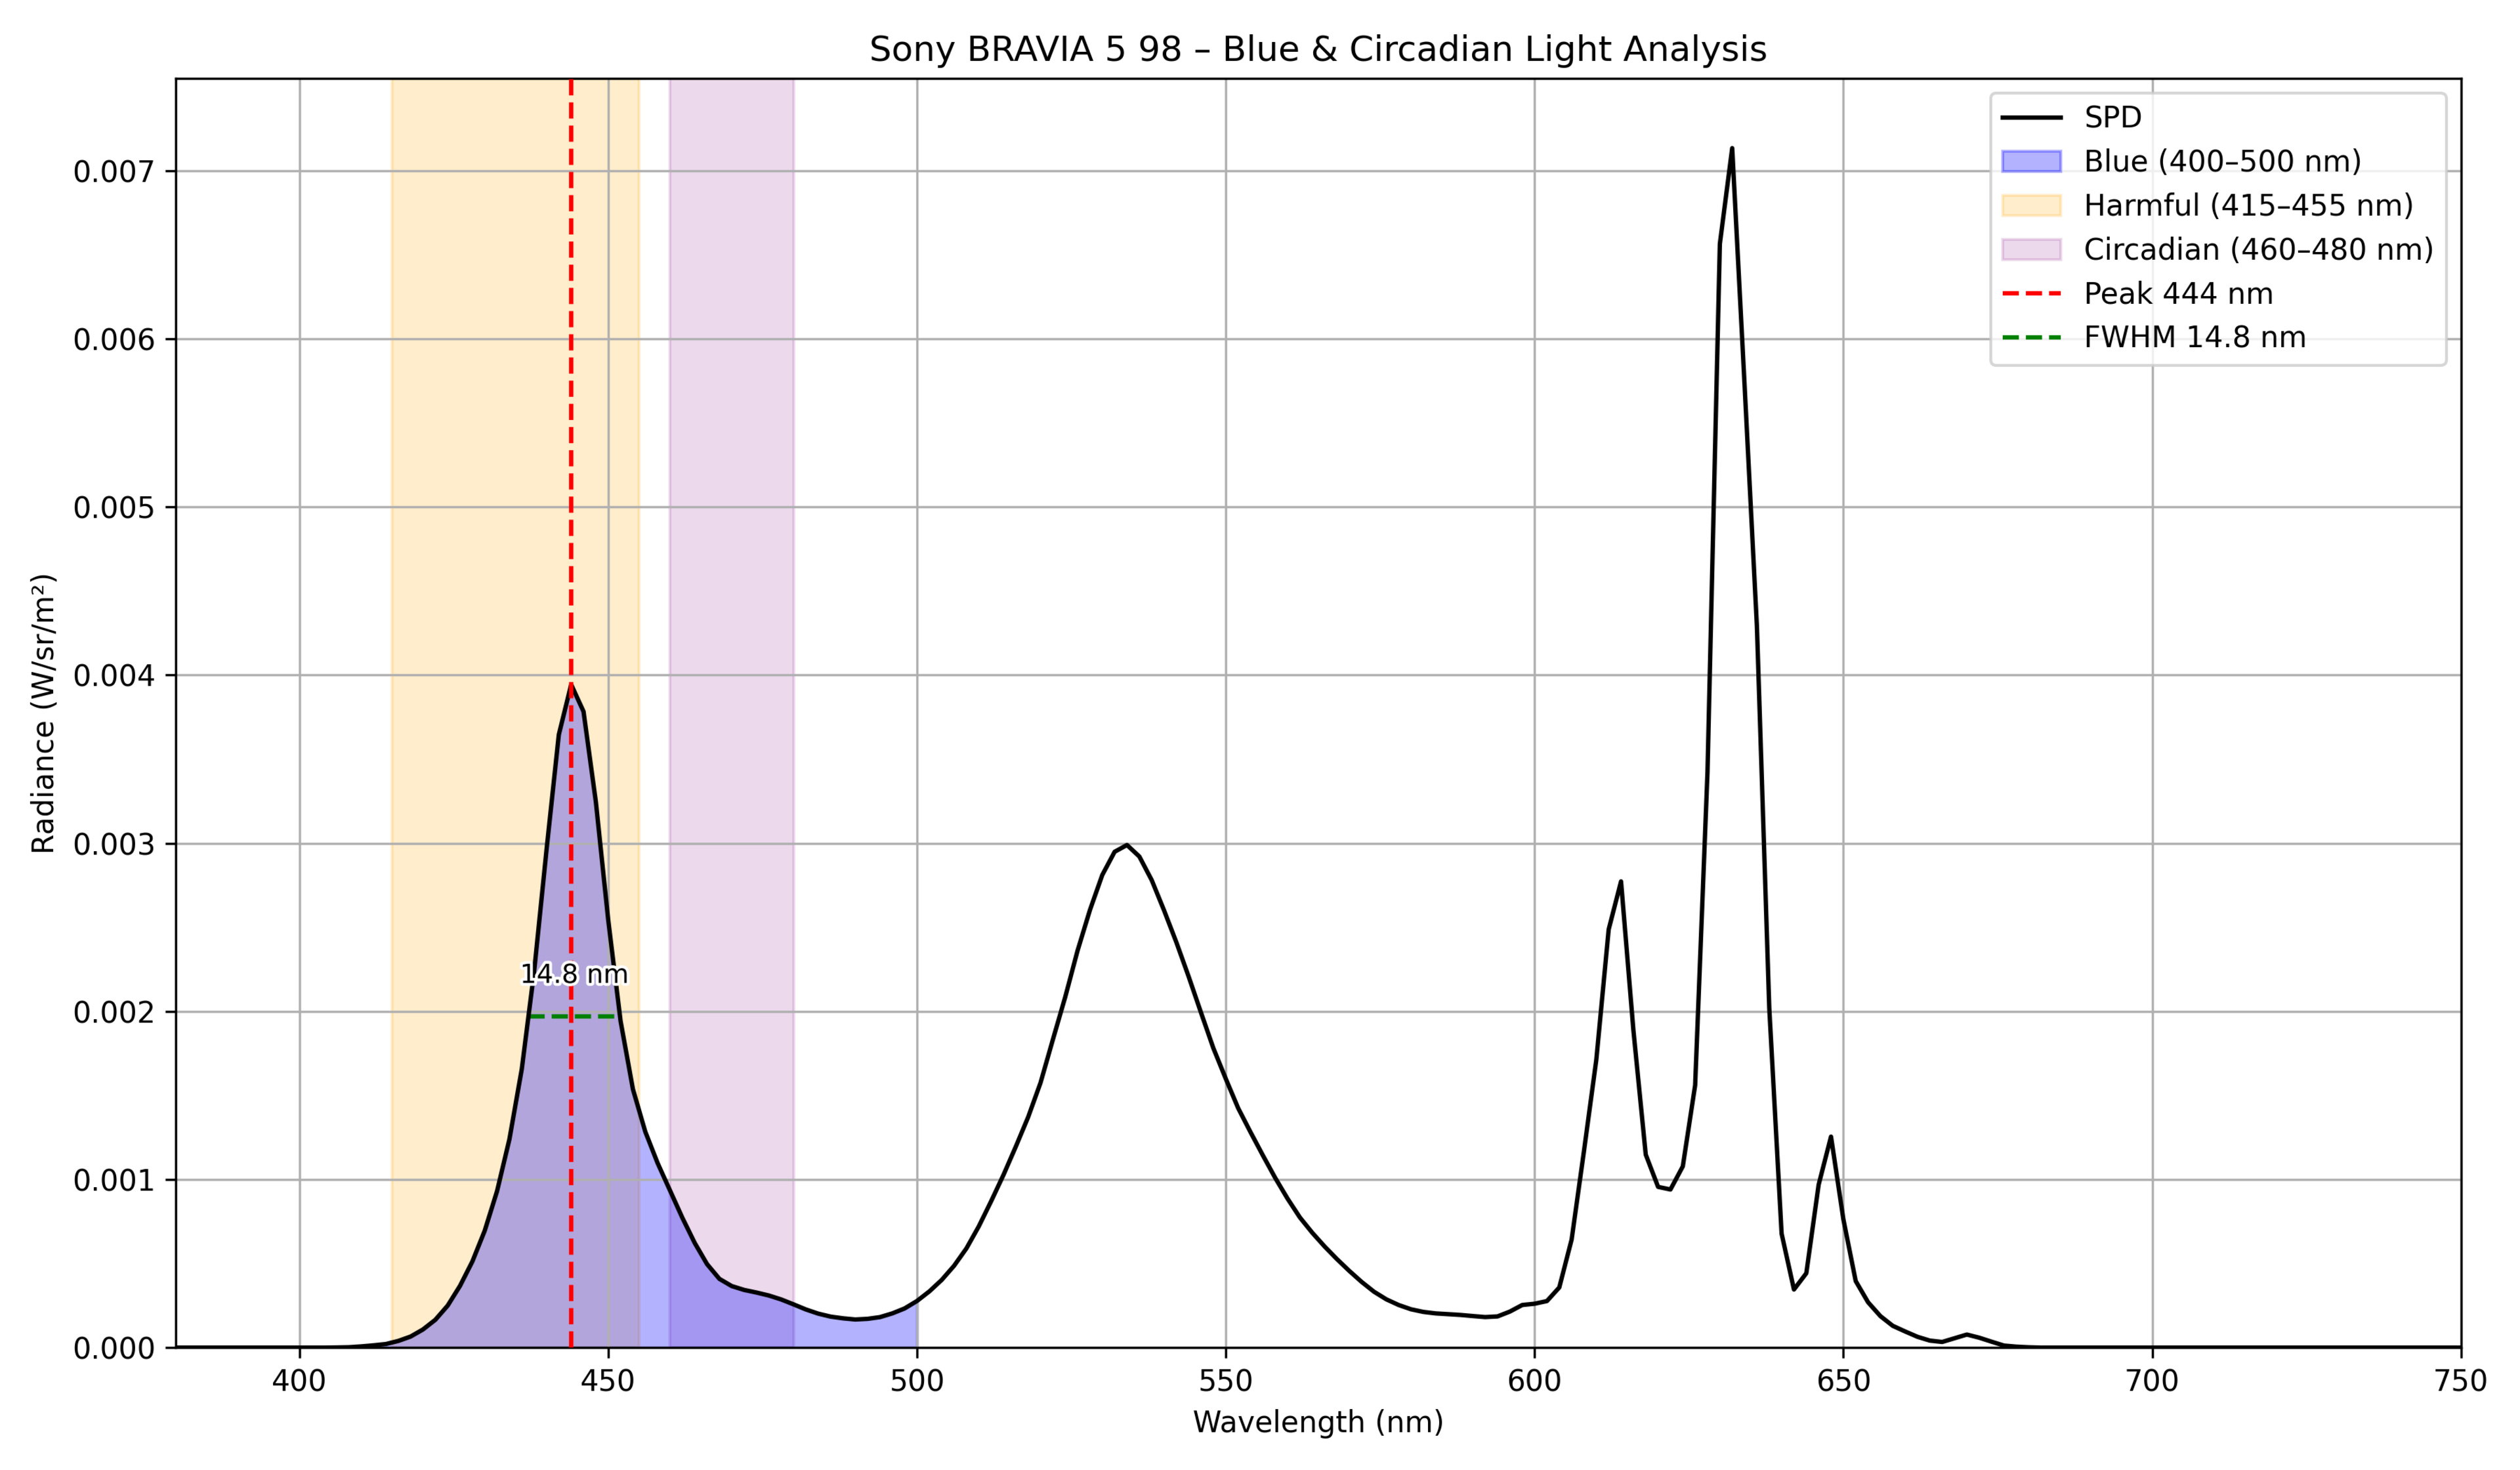 |
444 | 14.8 | 75.24 | 10.97 | 0.082608 |
| Sony BRAVIA 7 | 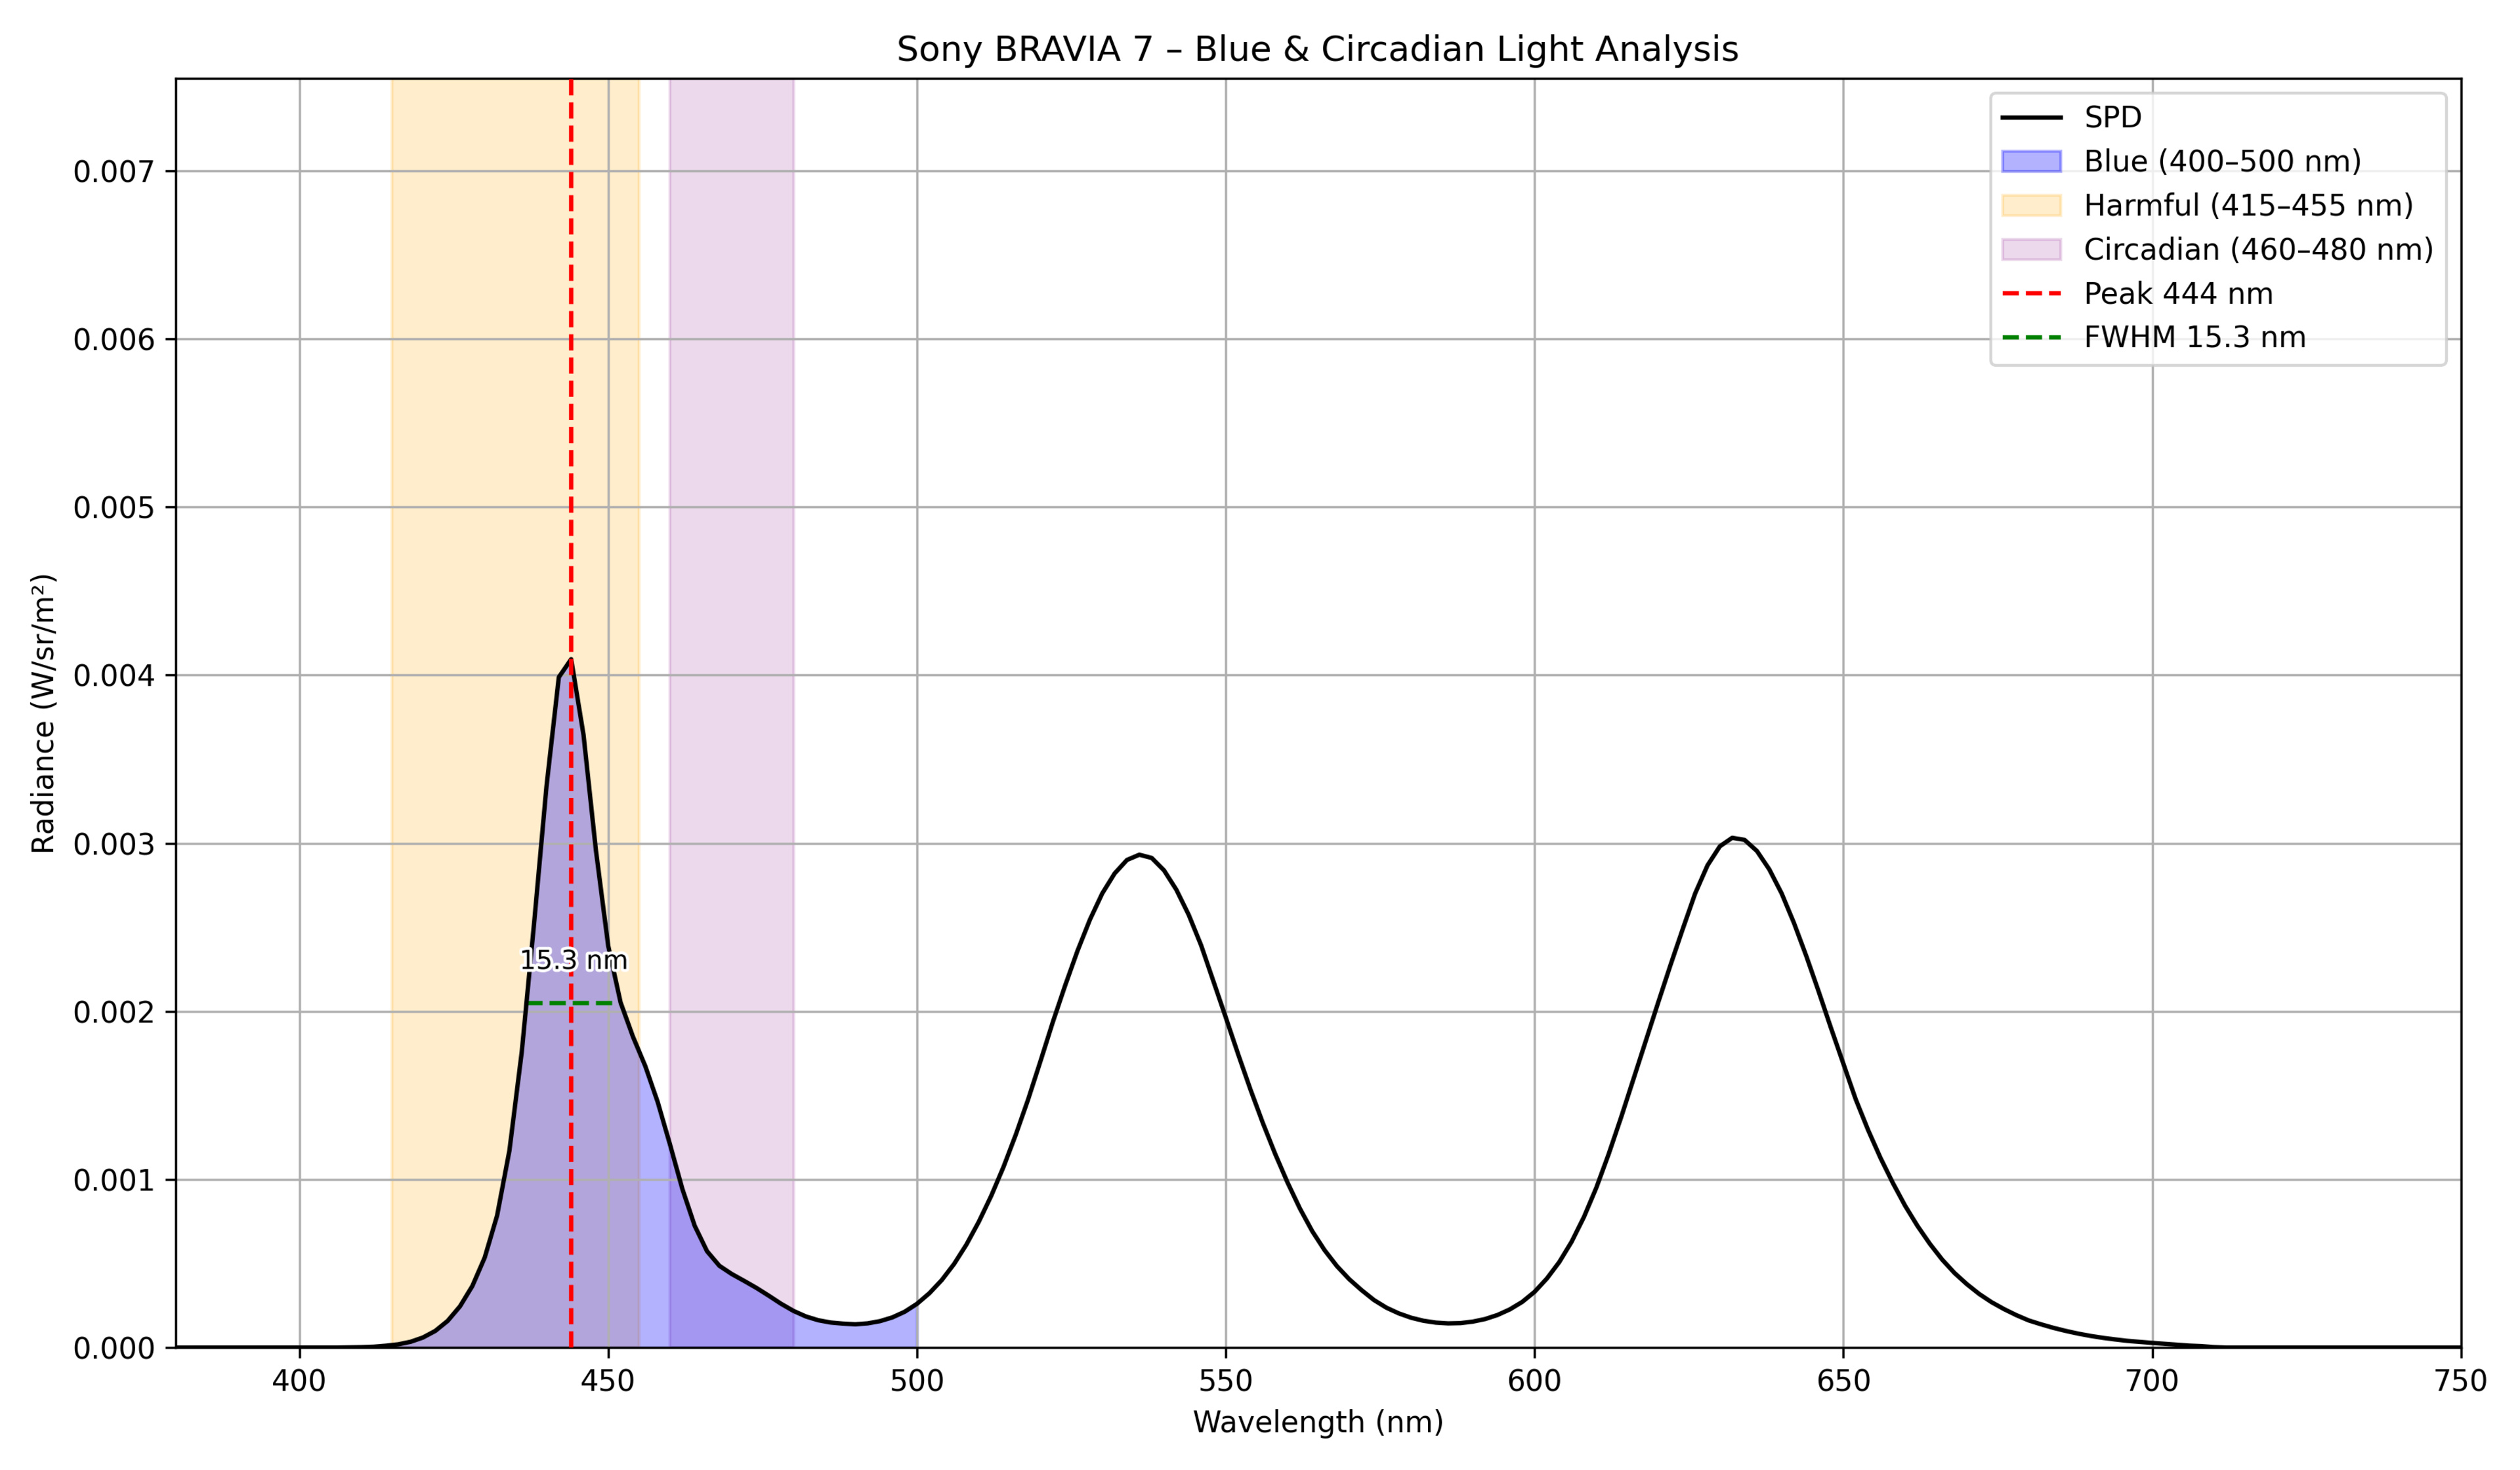 |
444 | 15.3 | 72.84 | 12.17 | 0.085514 |
| Sony BRAVIA 9 | 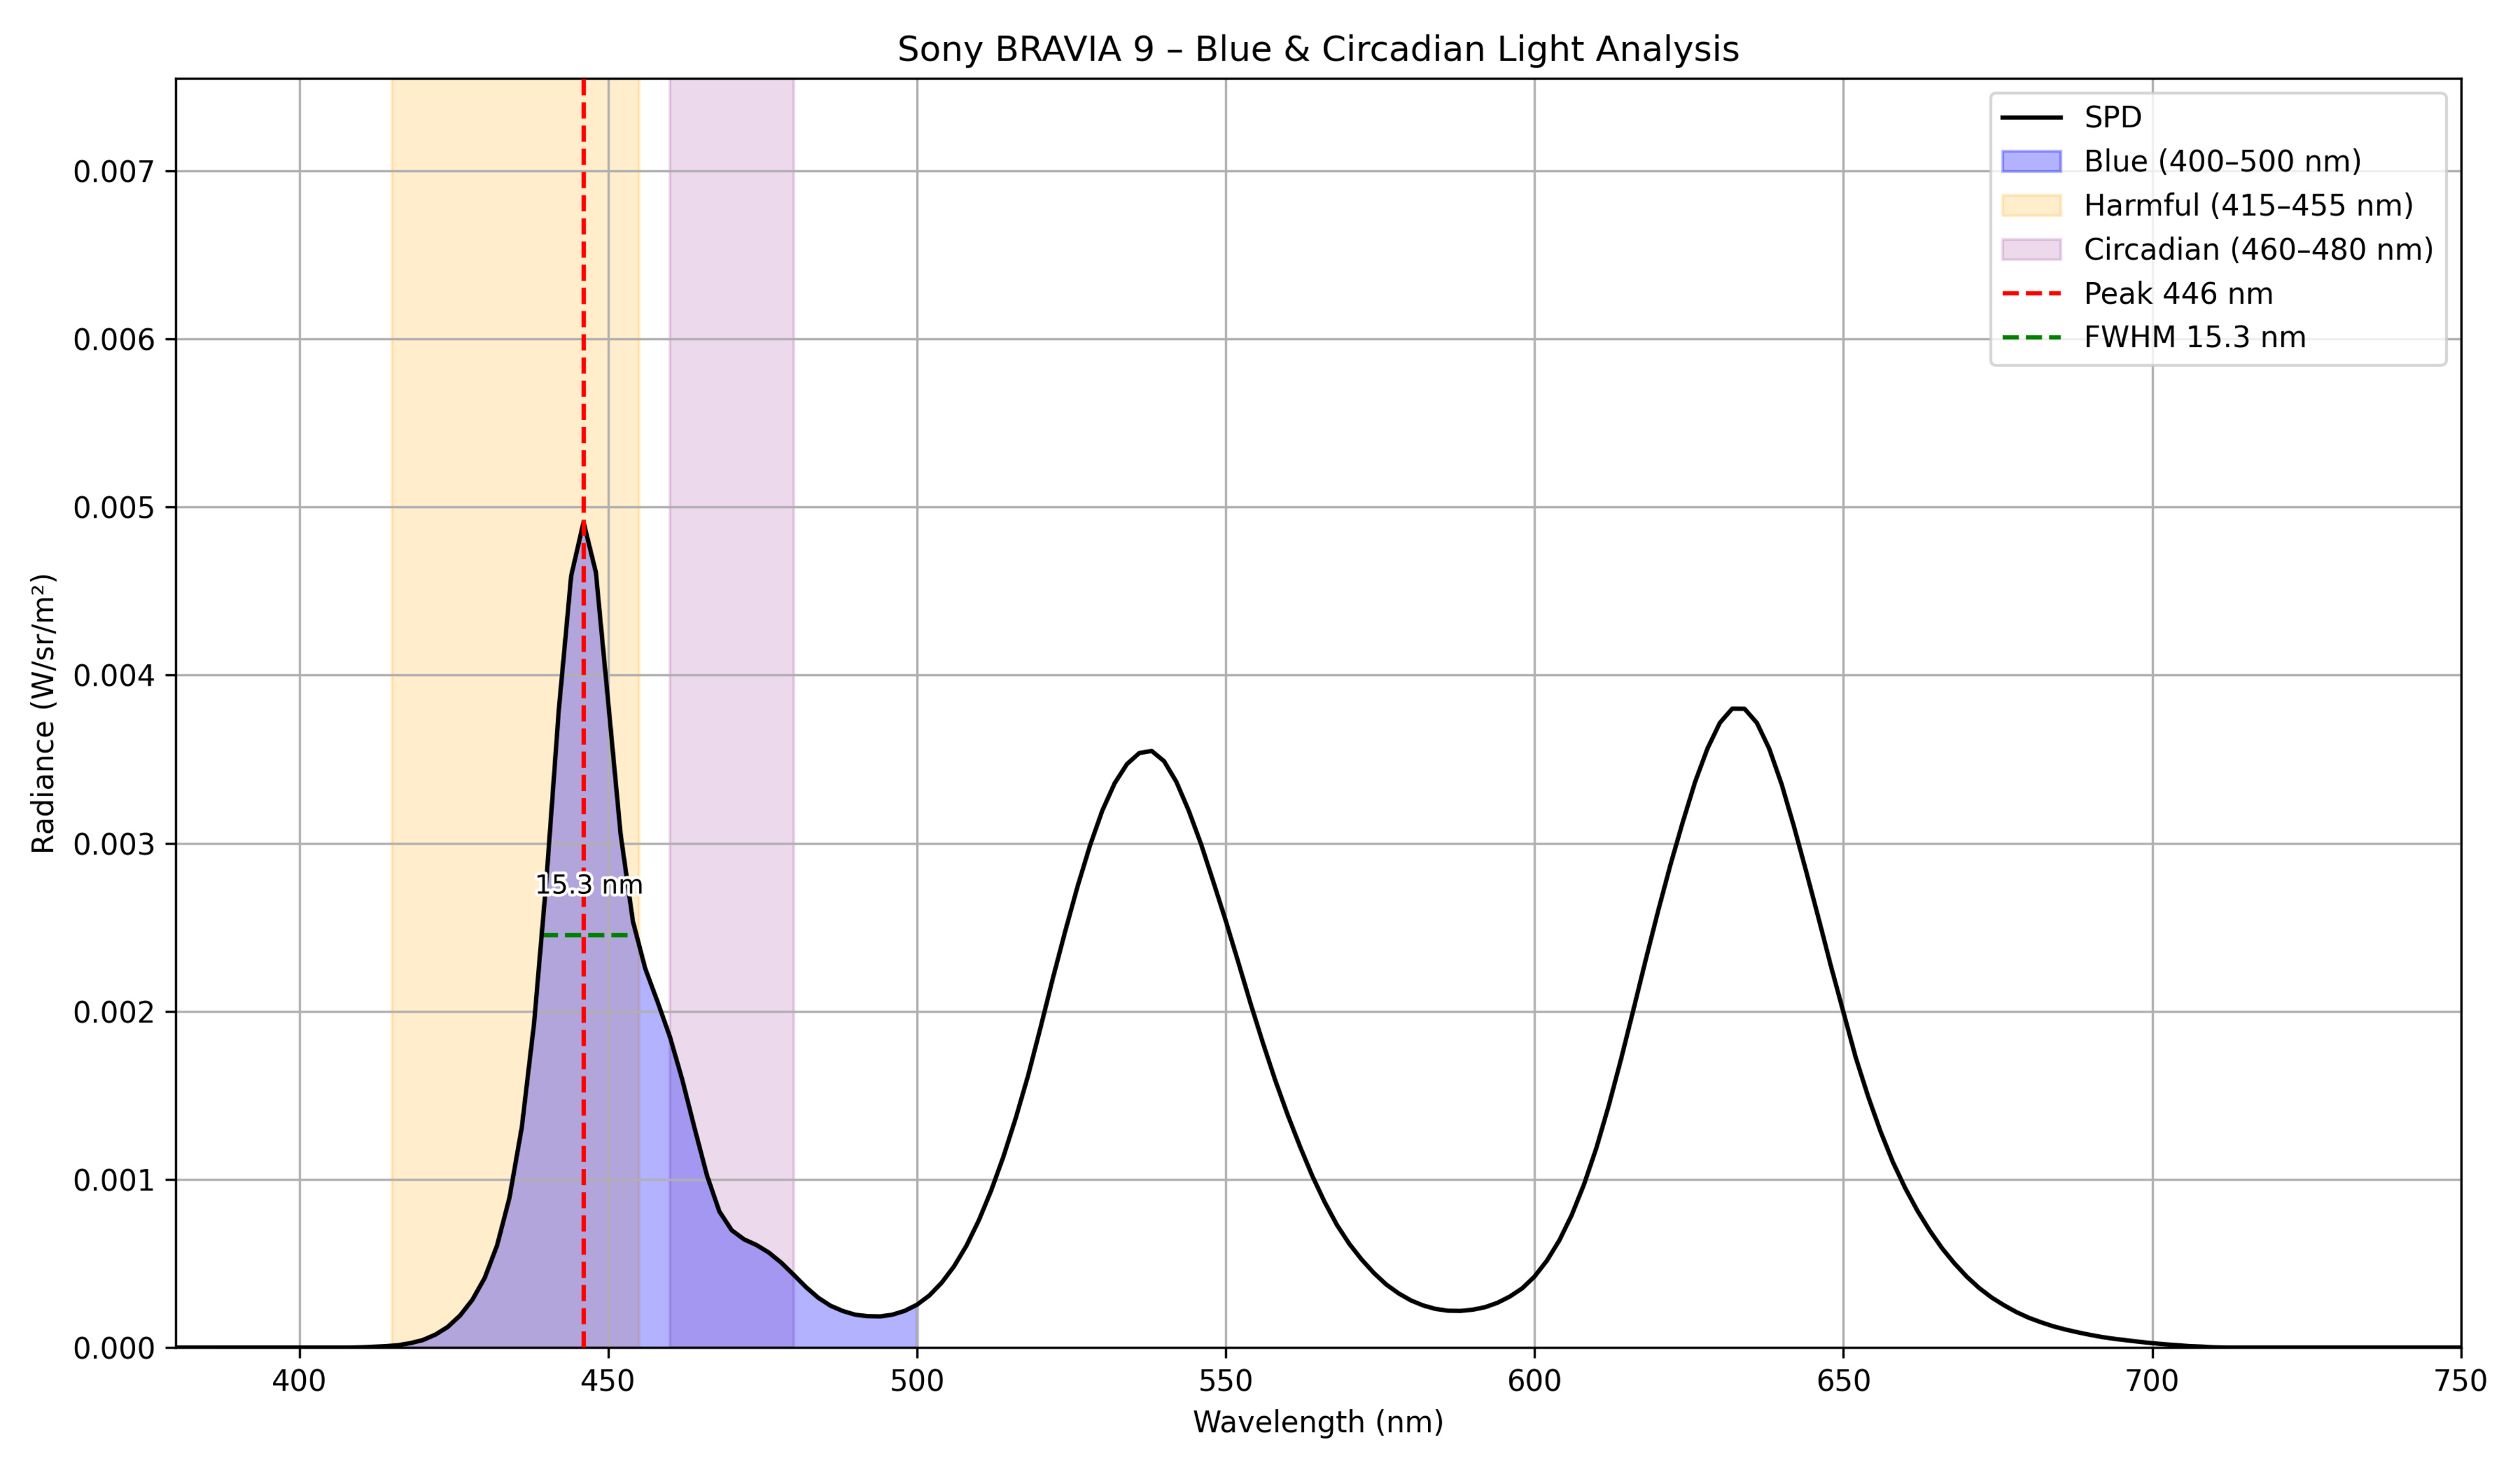 |
446 | 15.3 | 66.05 | 16.9 | 0.105267 |
| Sony X90L/X90CL | 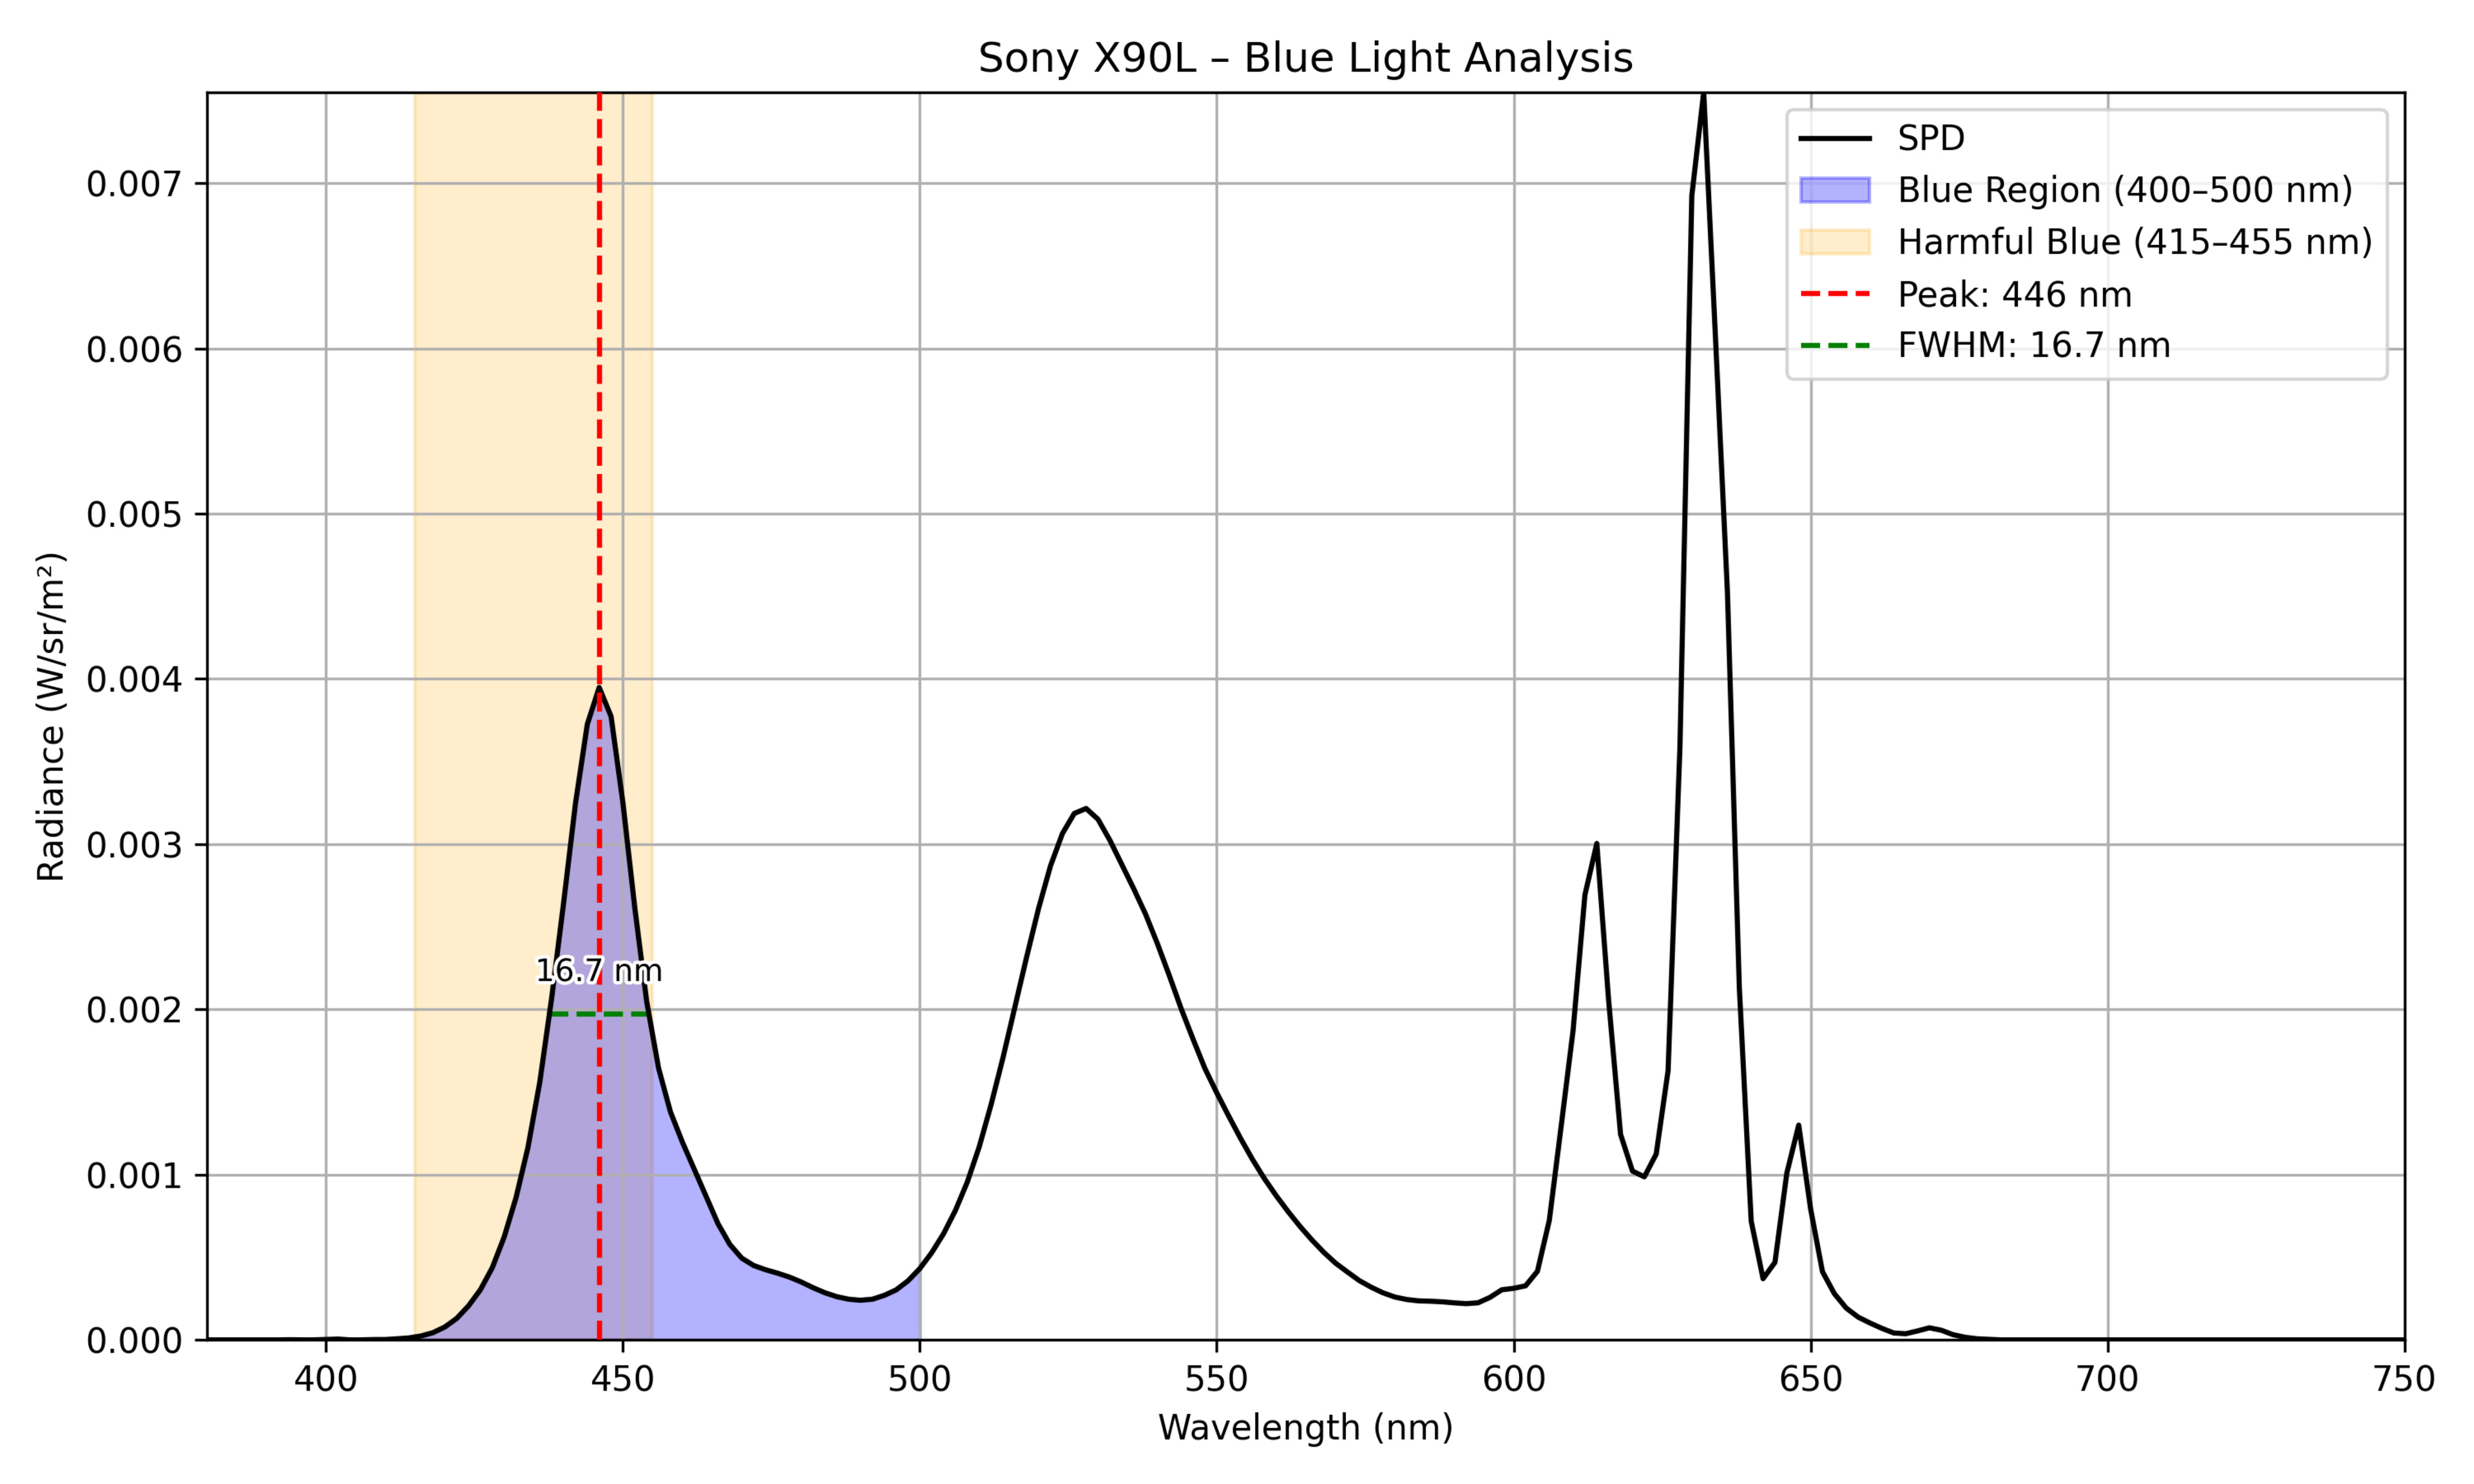 |
446 | 16.7 | 69.81 | 13.46 | 0.090833 |
| TCL 98QM8K |  |
448 | 15 | 64.4 | 17.66 | 0.099332 |
| TCL NXTVISION |  |
448 | 15.9 | 62.37 | 17.76 | 0.111755 |
| TCL Q651G | 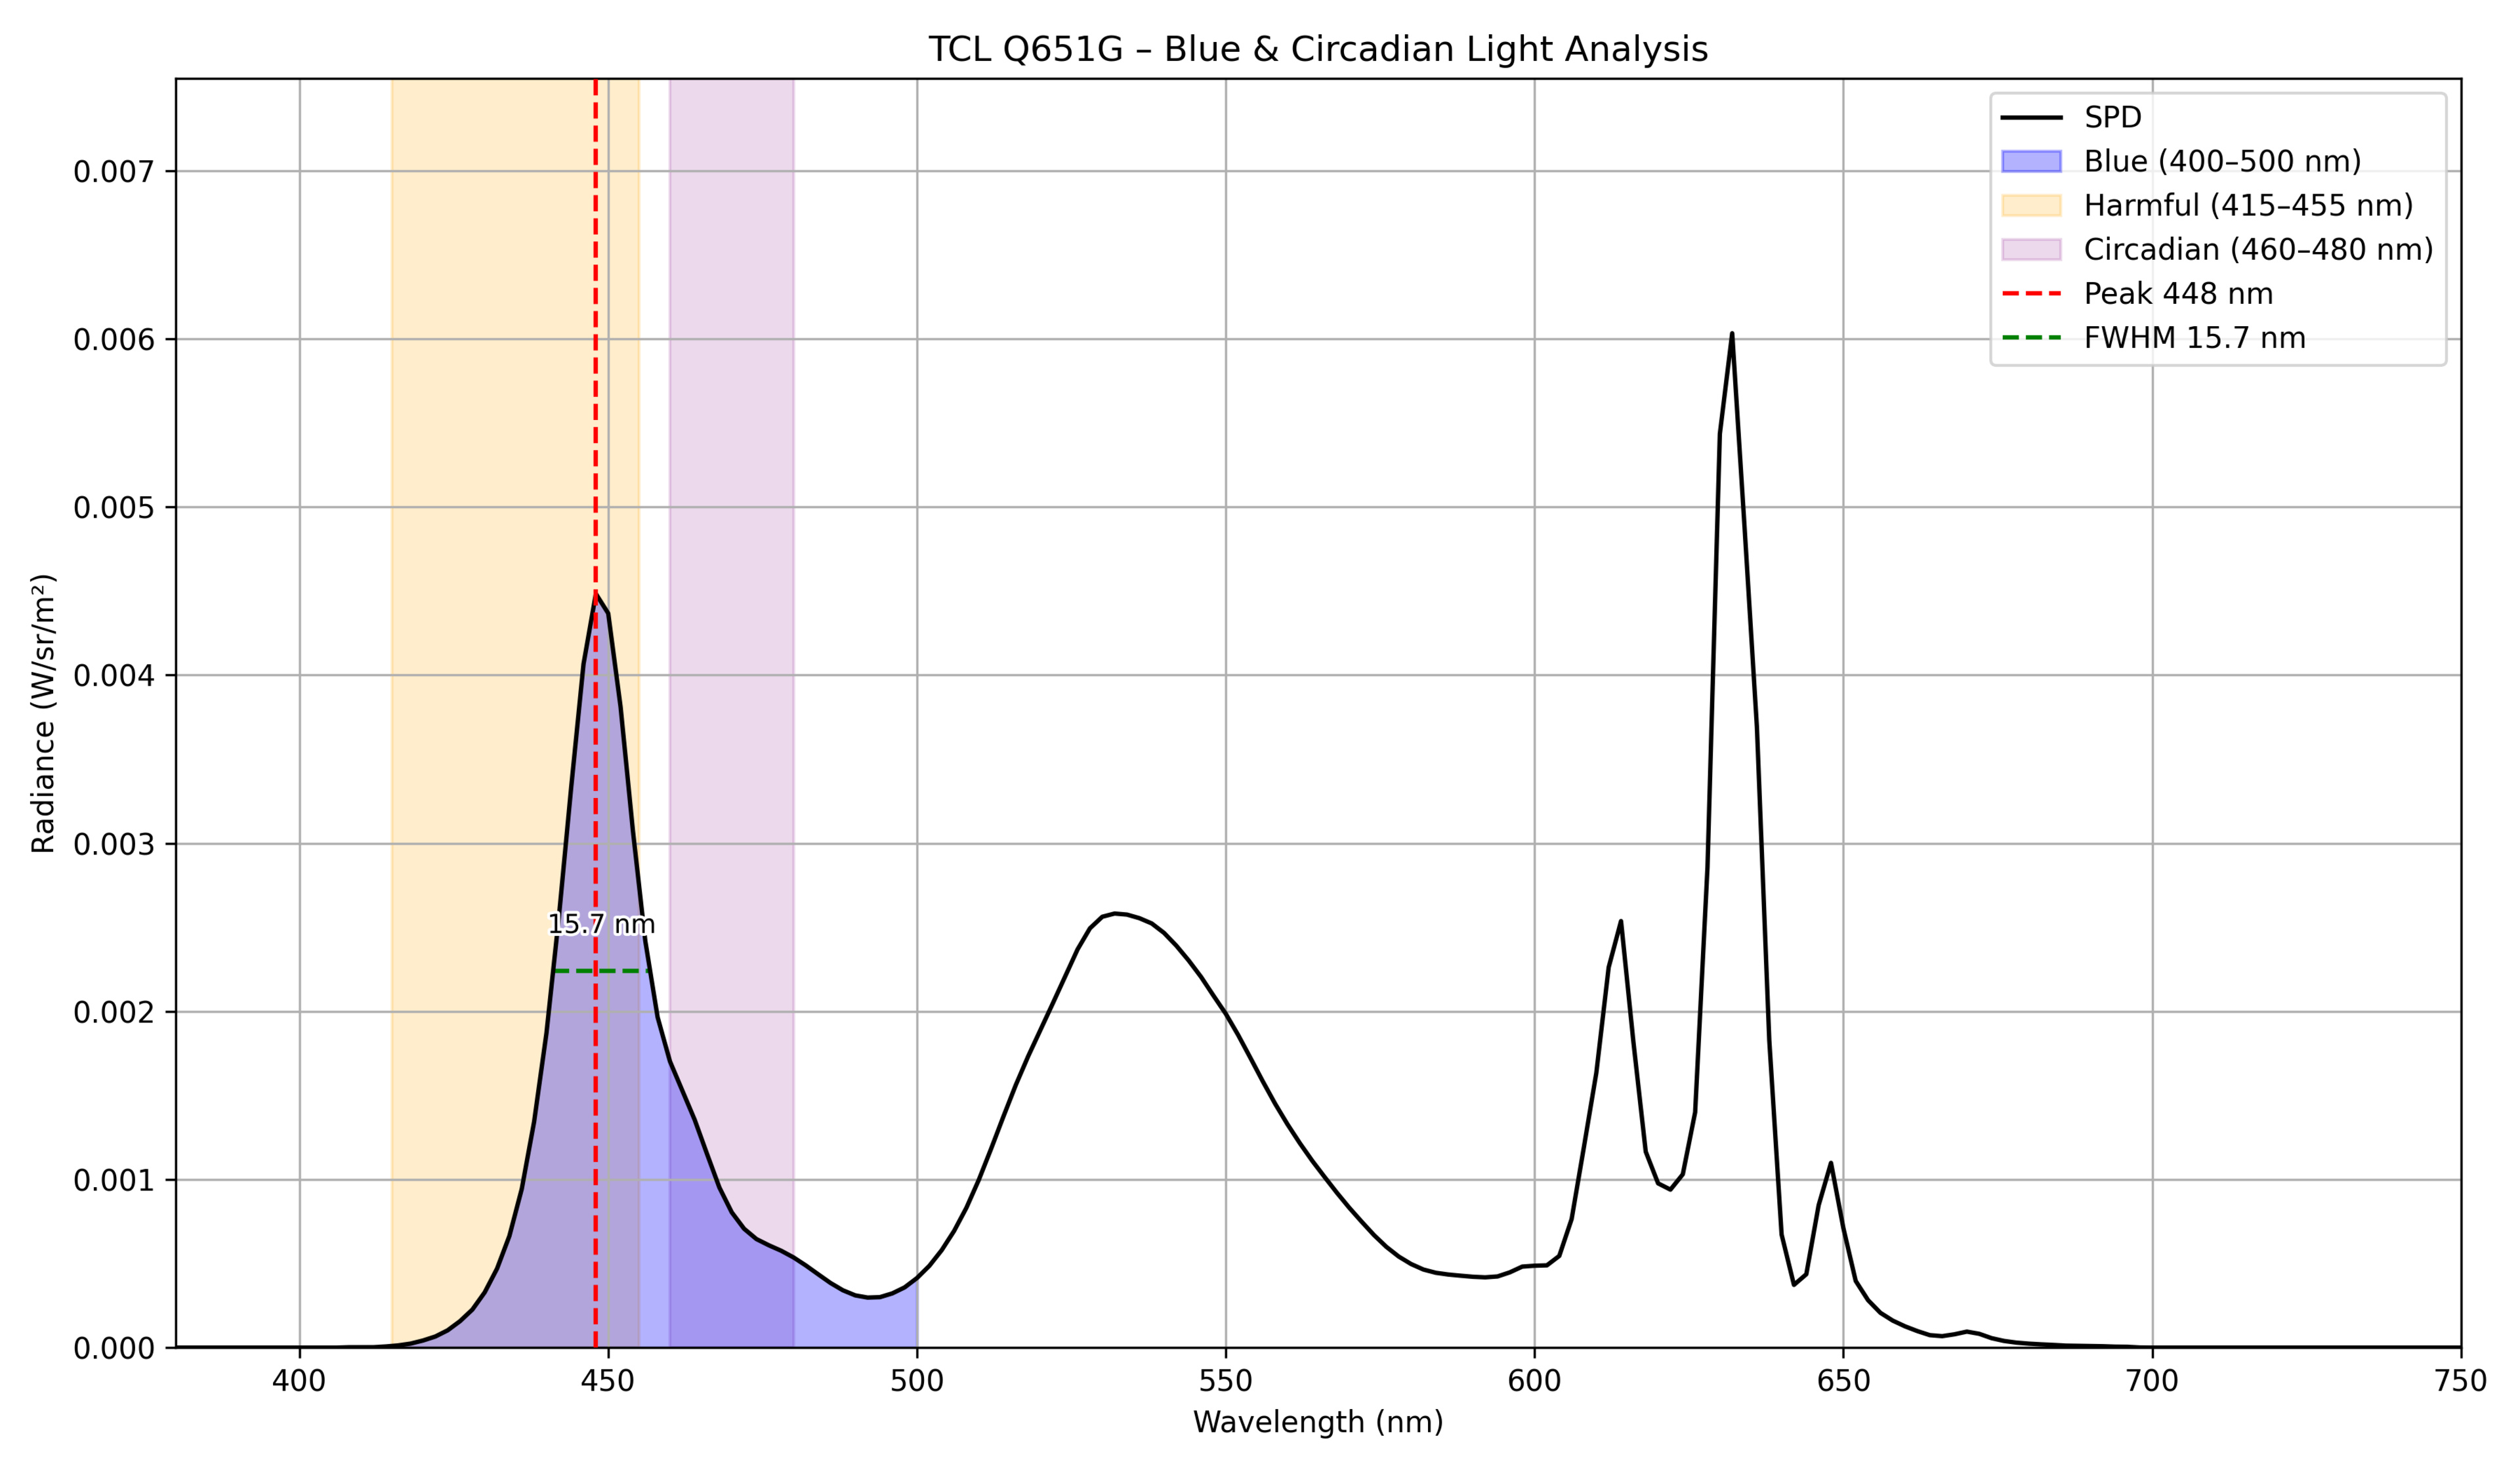 |
448 | 15.7 | 60.37 | 18.76 | 0.100719 |
| TCL Q77K |  |
446 | 16.7 | 66.79 | 15.5 | 0.11853 |
| TCL QM5K |  |
448 | 16.9 | 63.44 | 17.11 | 0.102917 |
| TCL QM6K |  |
446 | 16.6 | 70.29 | 13.51 | 0.112902 |
| TCL QM751G |  |
446 | 15.4 | 71.89 | 13.4 | 0.09884 |
| TCL QM7K | 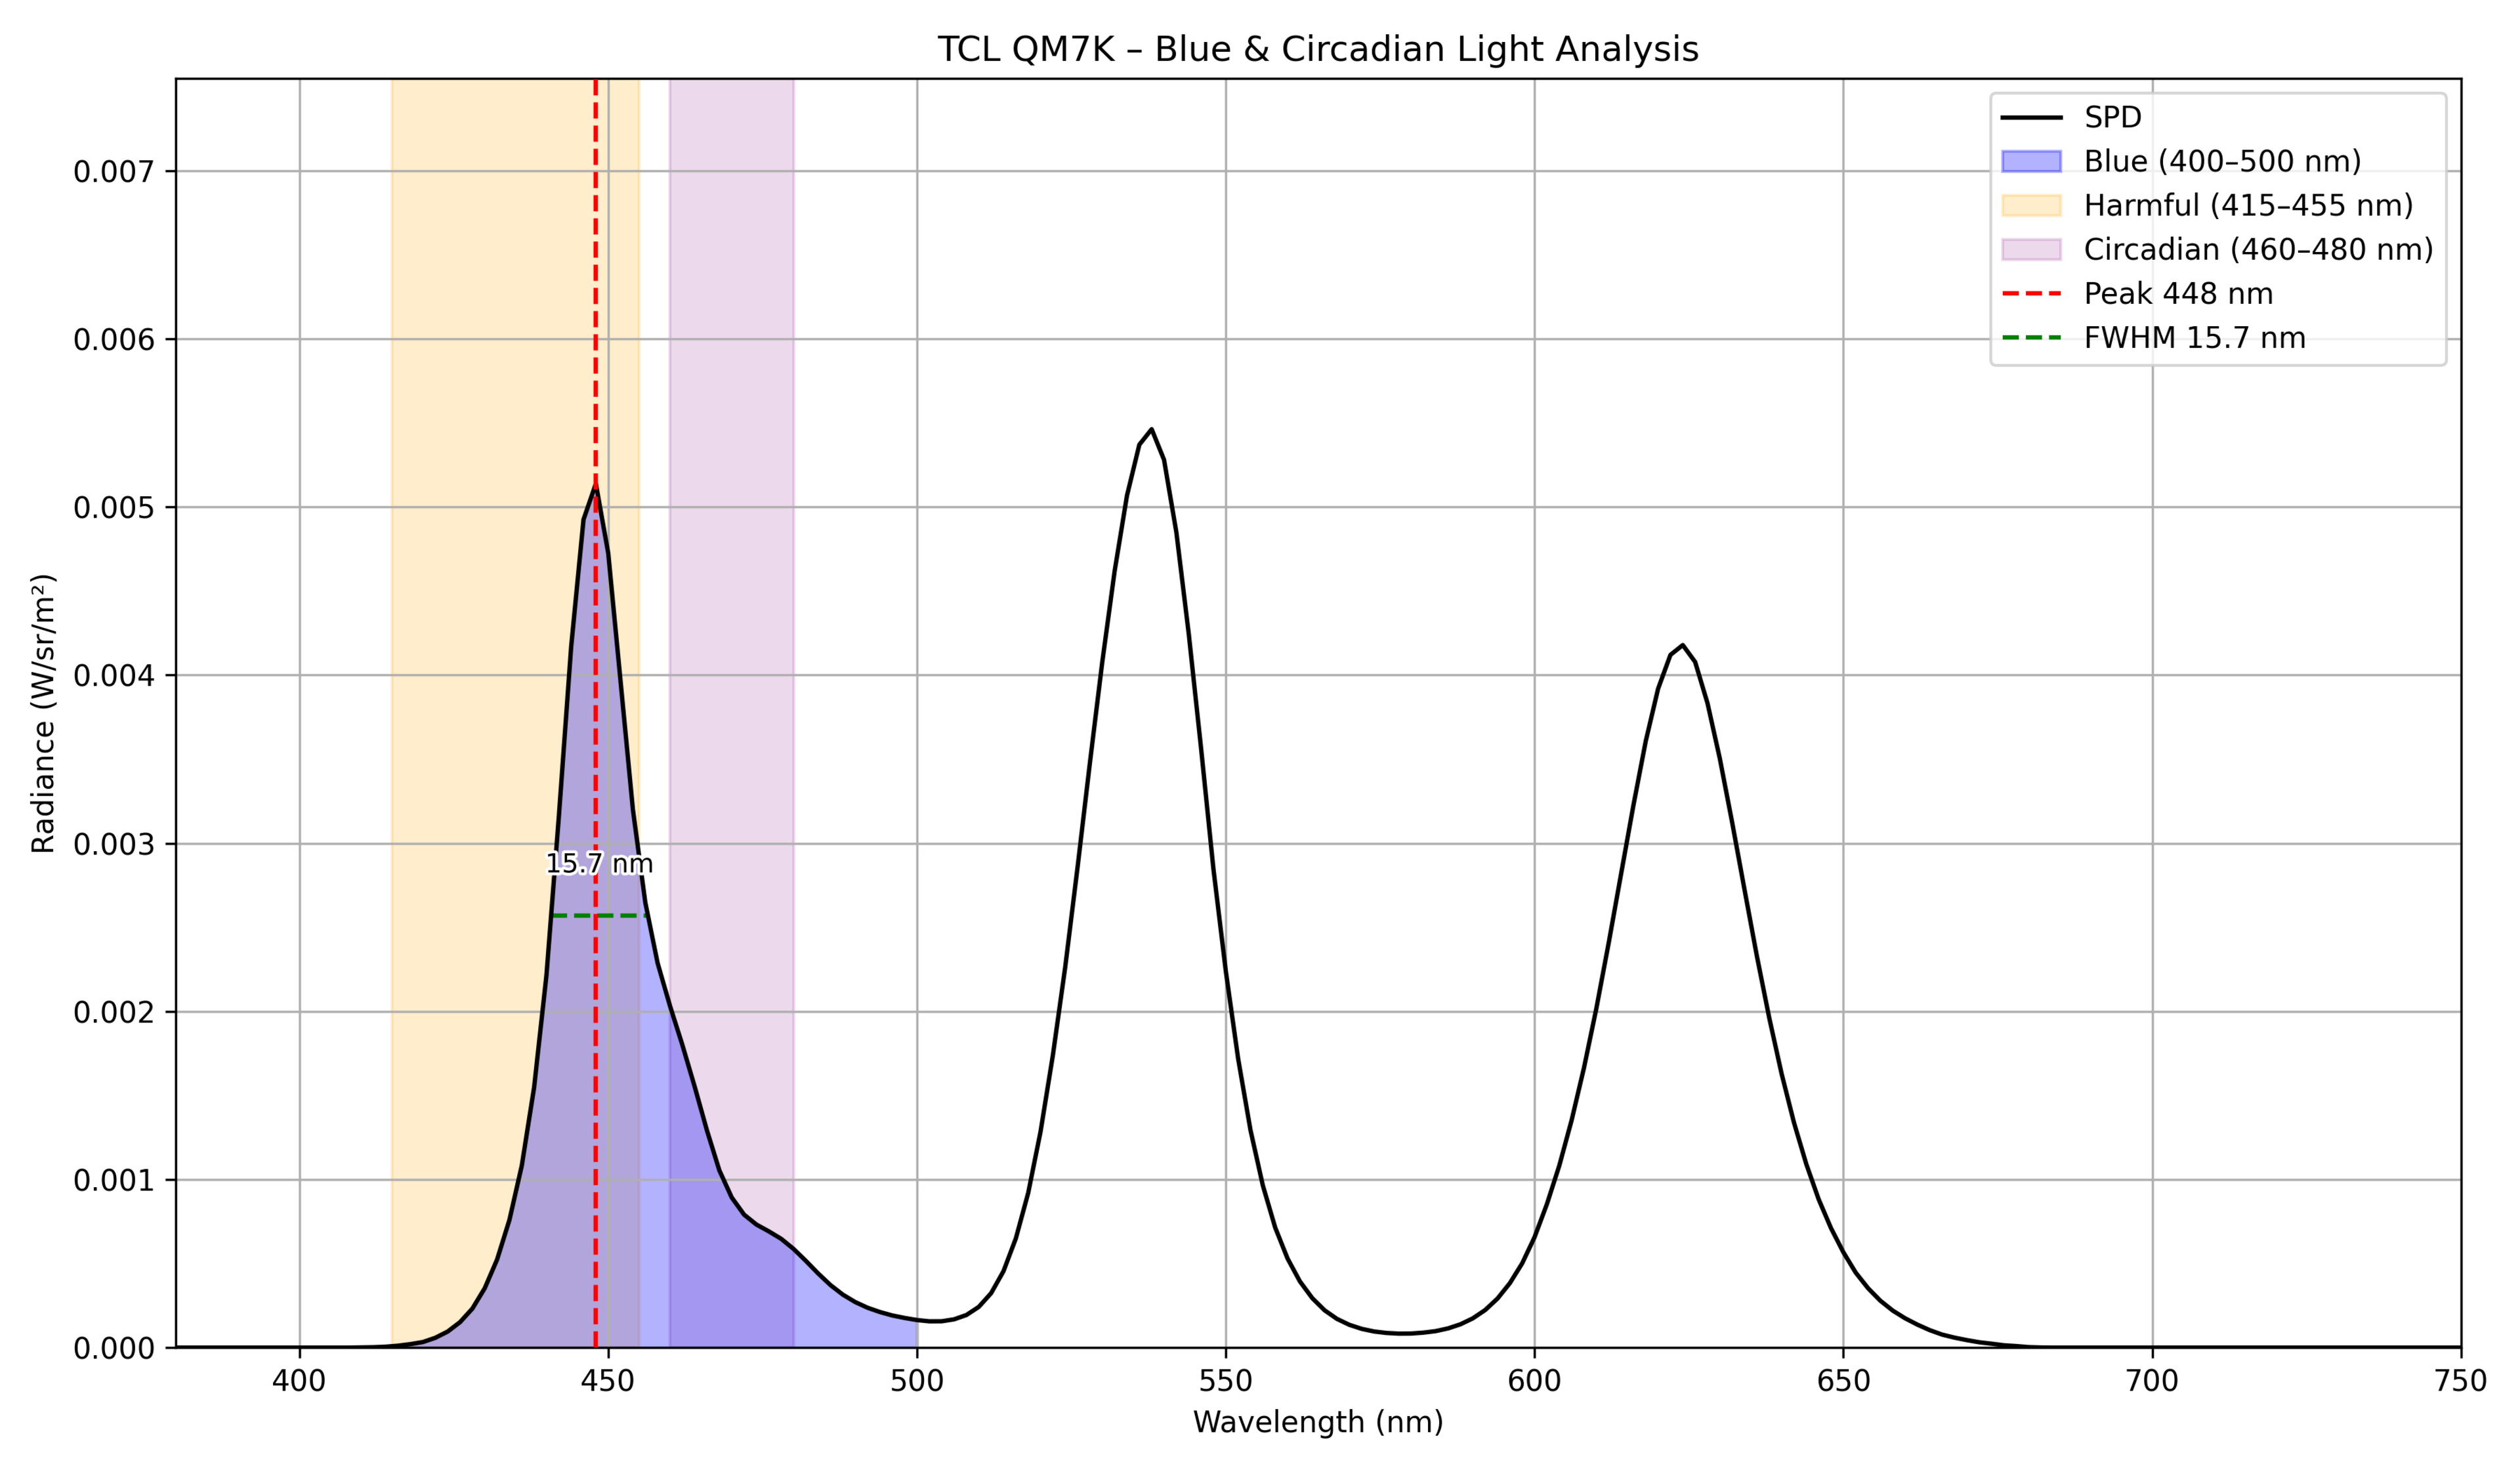 |
448 | 15.7 | 61.86 | 19.15 | 0.112384 |
| TCL QM851G | 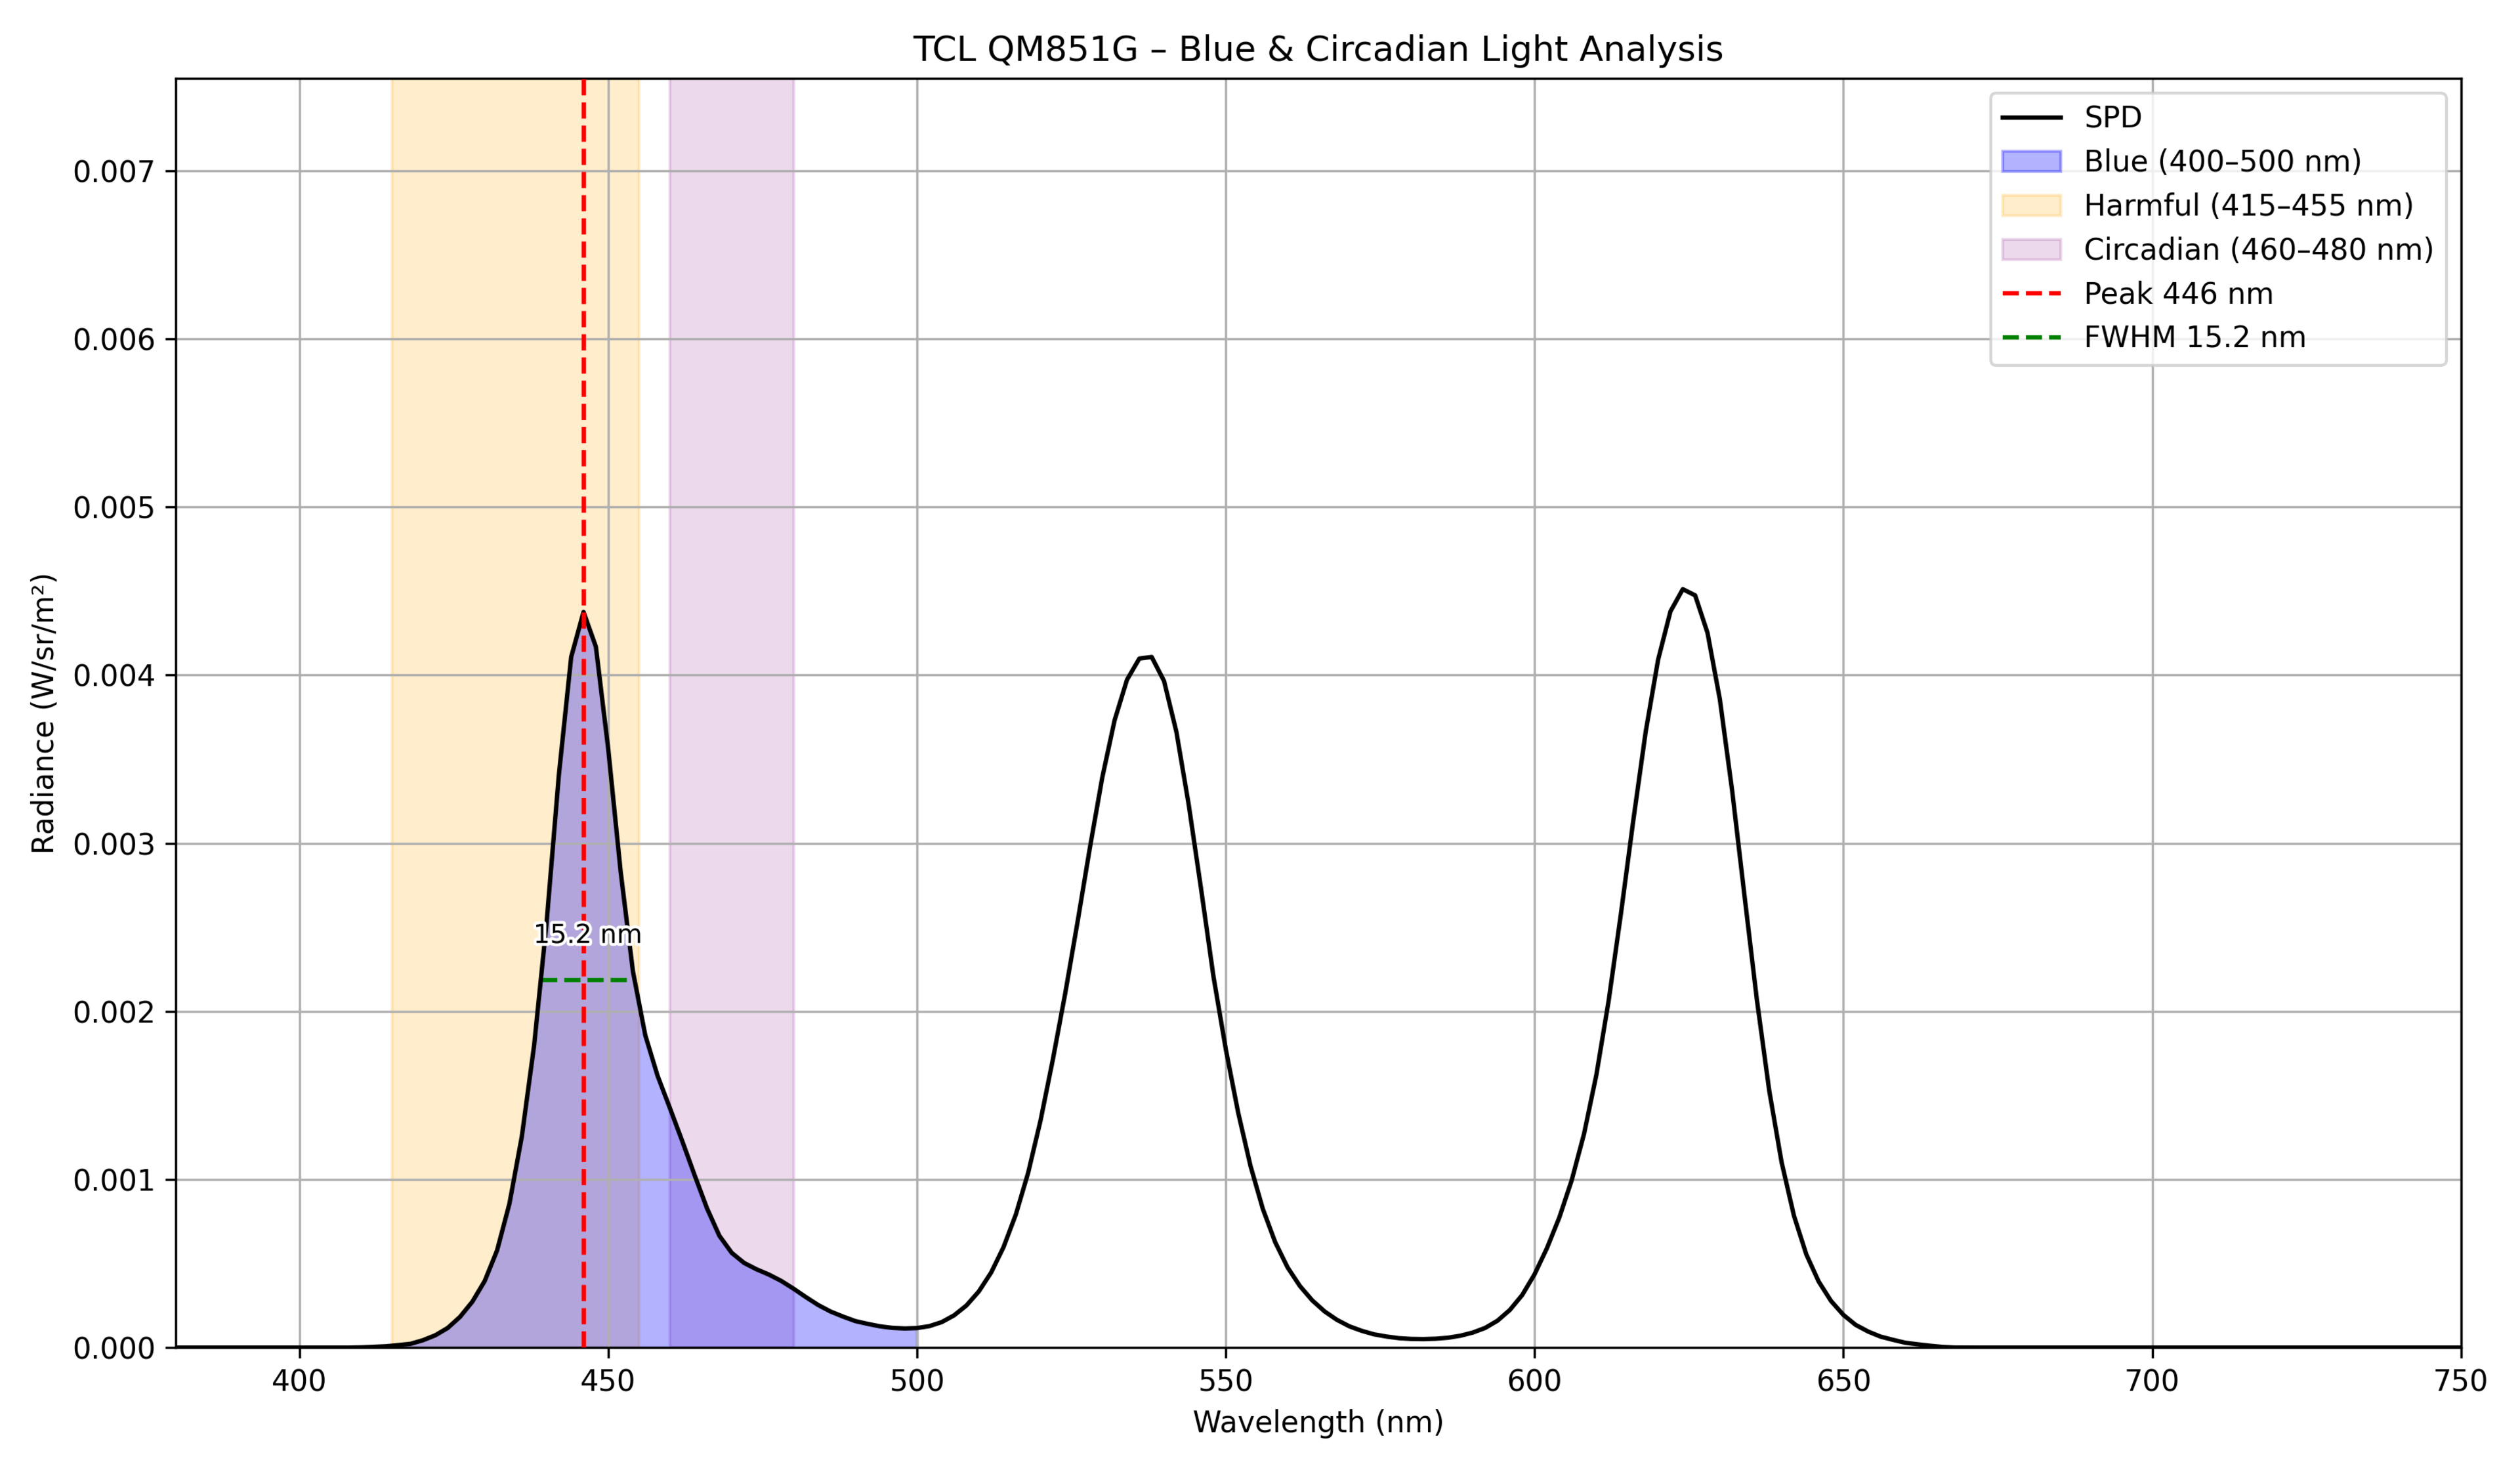 |
446 | 15.2 | 69.11 | 15.26 | 0.091724 |
| TCL QM8K |  |
448 | 15 | 63.85 | 18 | 0.089981 |
| TCL QM9K | 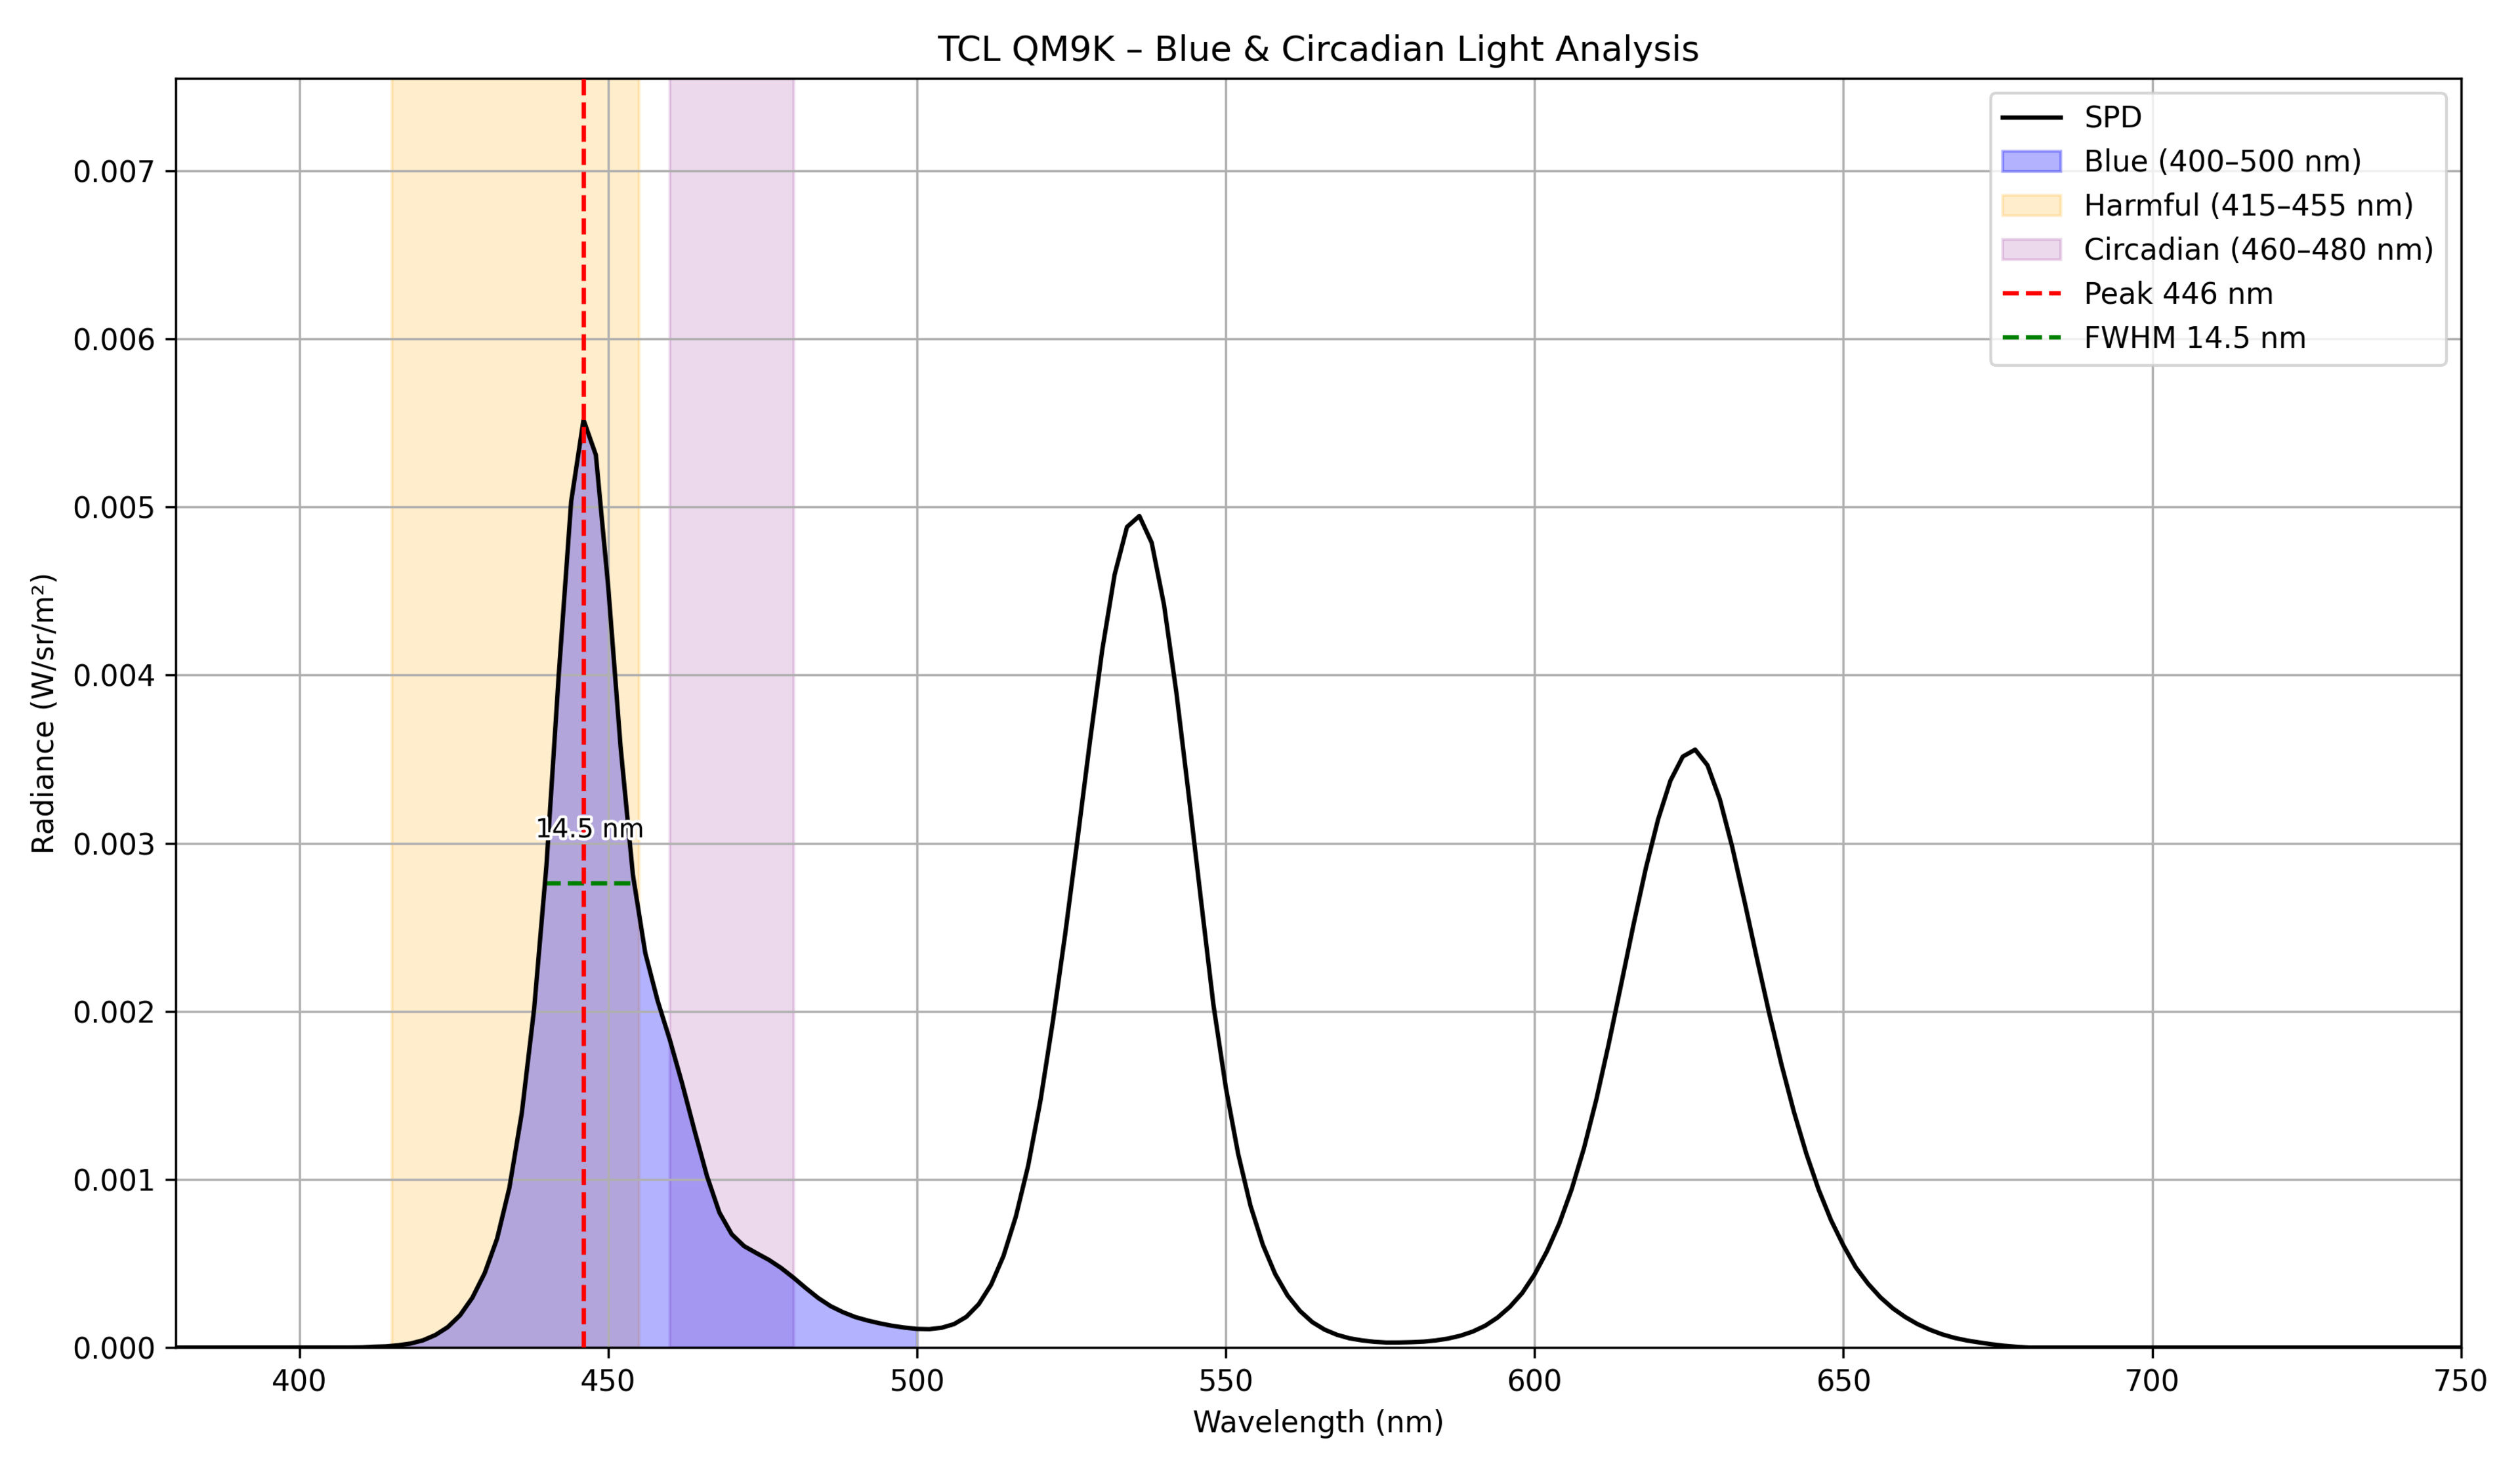 |
446 | 14.5 | 68.73 | 15.43 | 0.111901 |
| TCL S551G |  |
448 | 15.2 | 62.71 | 17.62 | 0.105201 |
OLED TV Results
Based on the data collected, OLEDs appear to produce significantly less harmful blue light than LED TVs. The blue light emissions from all OLEDs are slightly longer-wavelength, which places them slightly outside the harmful zone. Since they have a broader spectral peak, they still emit some harmful light, though some models perform slightly worse than others. On the other hand, OLEDs emit more light within the circadian system range, which may make them slightly worse for watching TV before bed.
You can see the full data below:
| Product | Spectral Power Distribution | Type | Blue Peak Wavelength (nm) | Full Width At Half Maximum (nm) | Harmful Range (415-455nm) (%) | Circadian System Range (460-480nm) (%) | Total Blue Output Power (W/sr/m²) |
|---|---|---|---|---|---|---|---|
| LG B4 OLED | 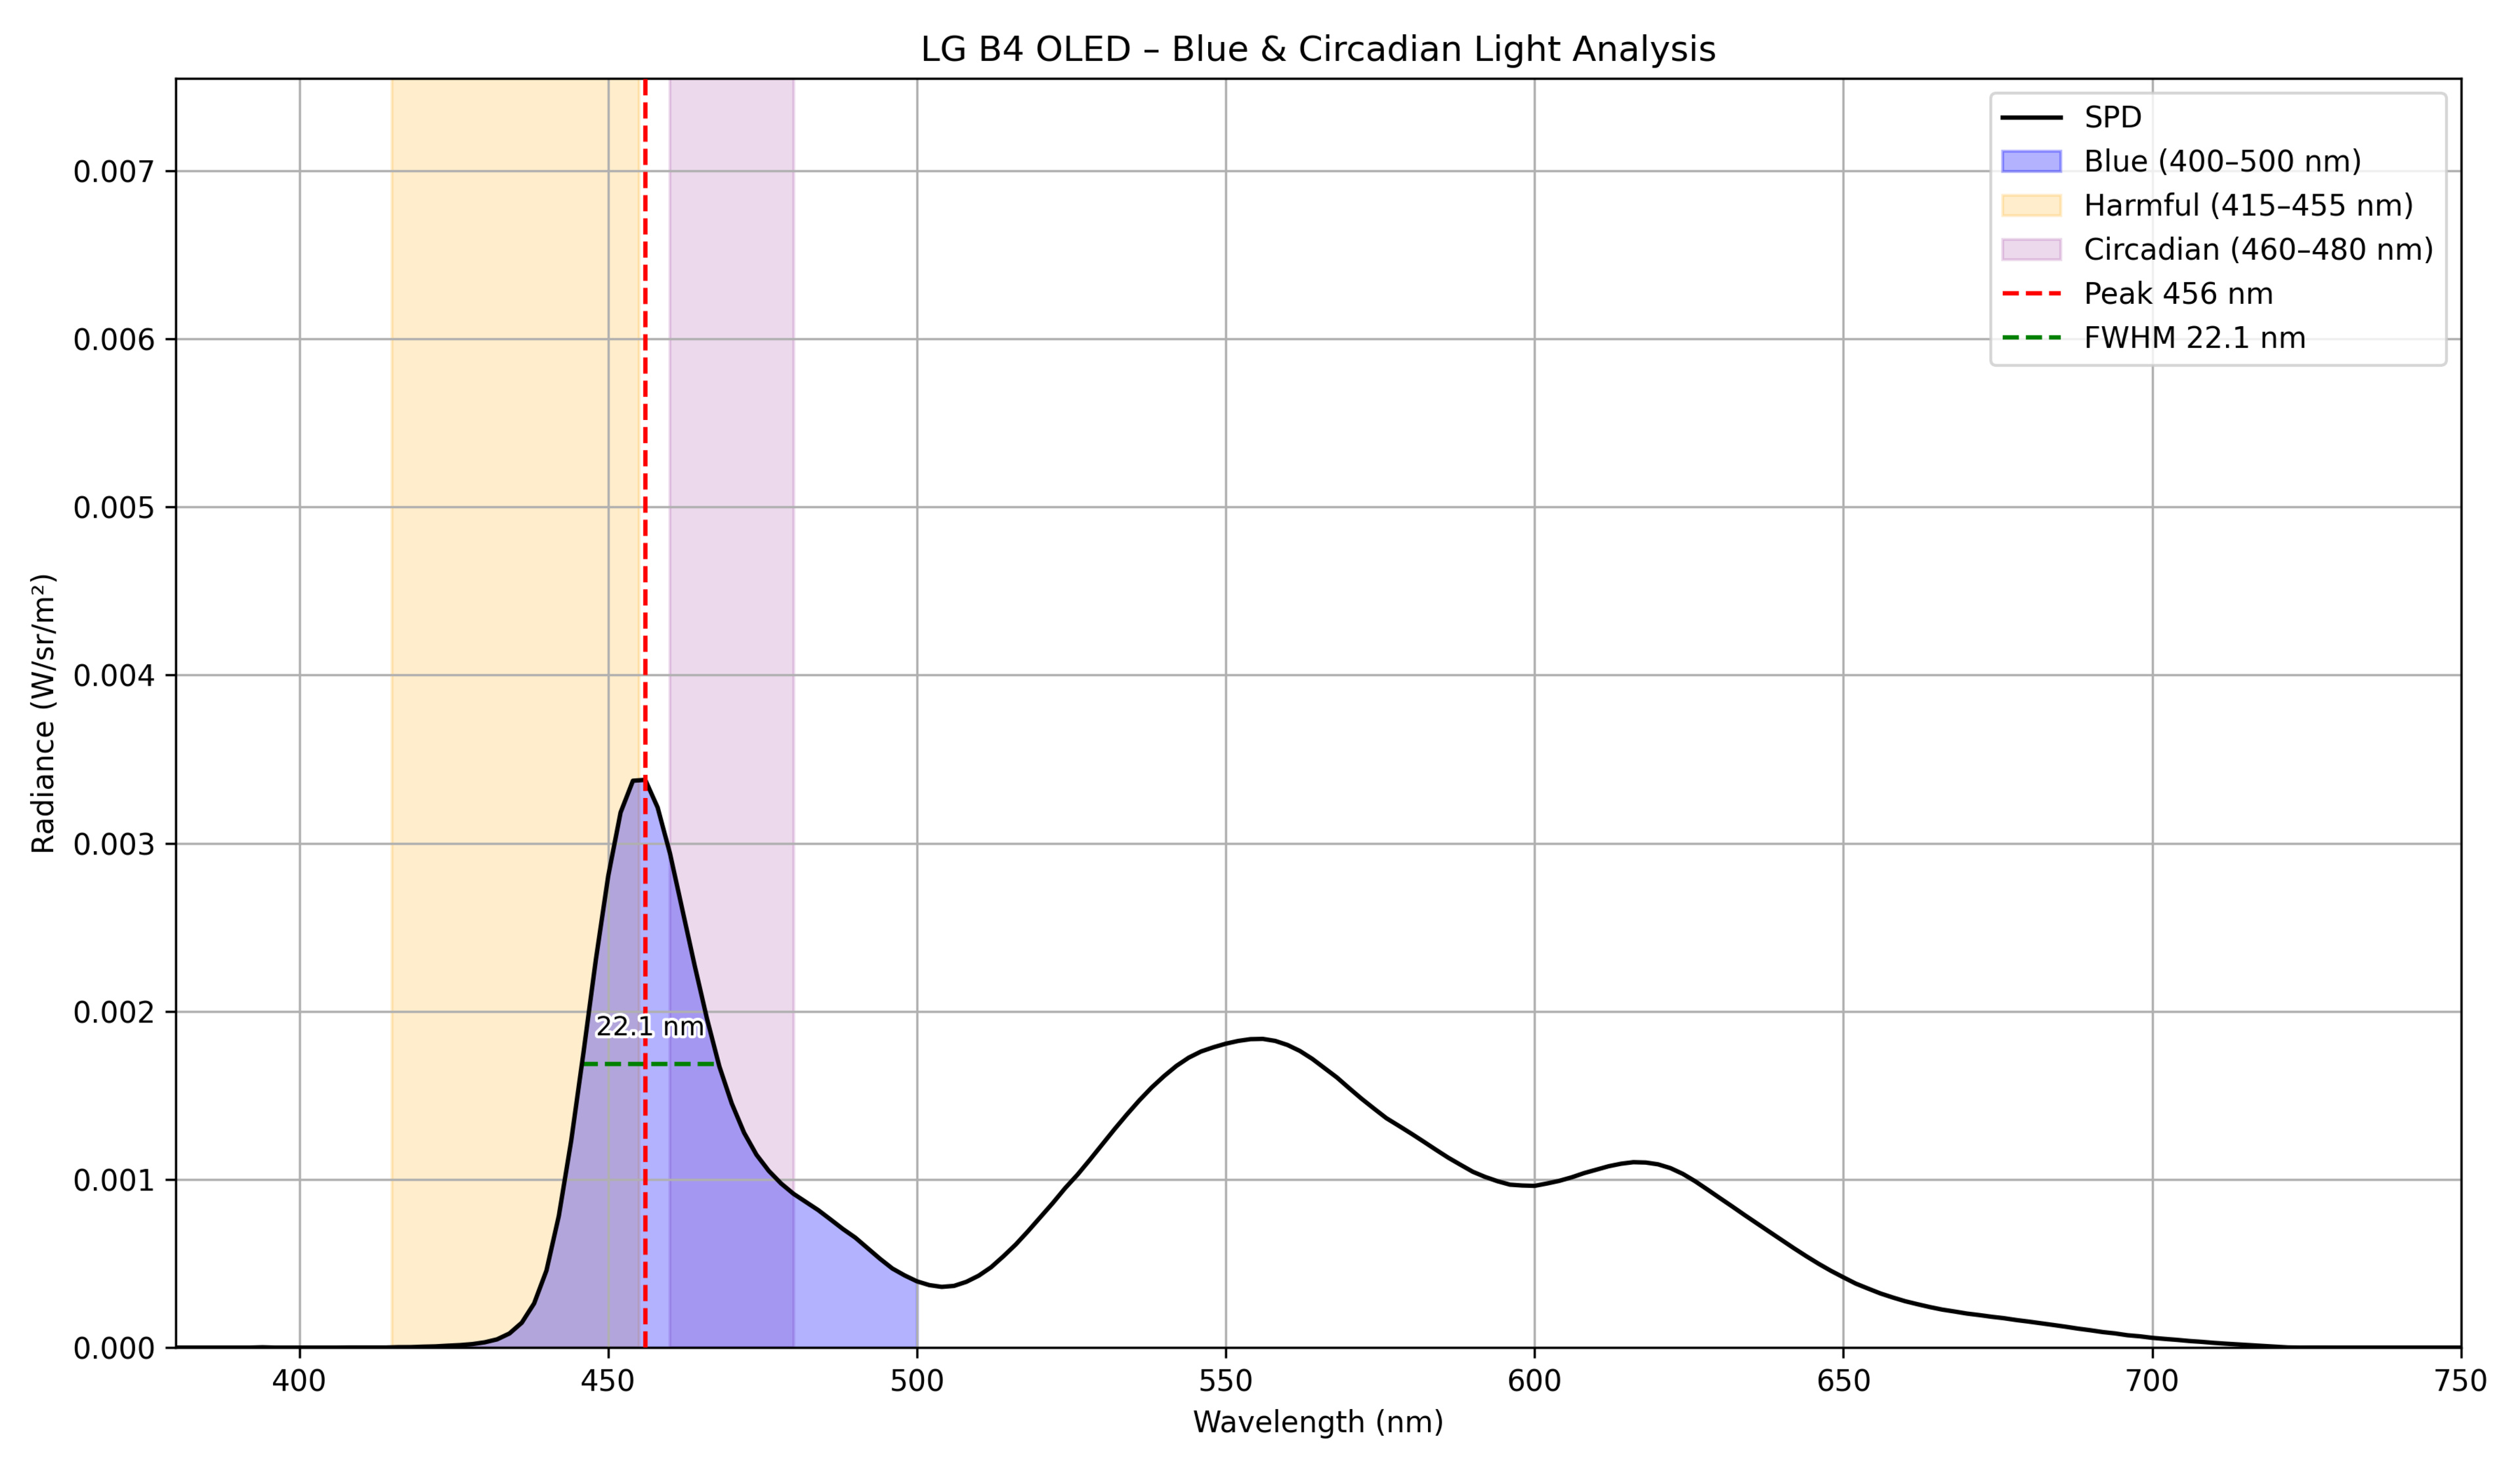 |
WOLED | 456 | 22.1 | 31.32 | 34.45 | 0.094838 |
| LG B5 OLED |  |
WOLED | 456 | 22.3 | 30.48 | 35.06 | 0.101696 |
| LG C4 OLED | 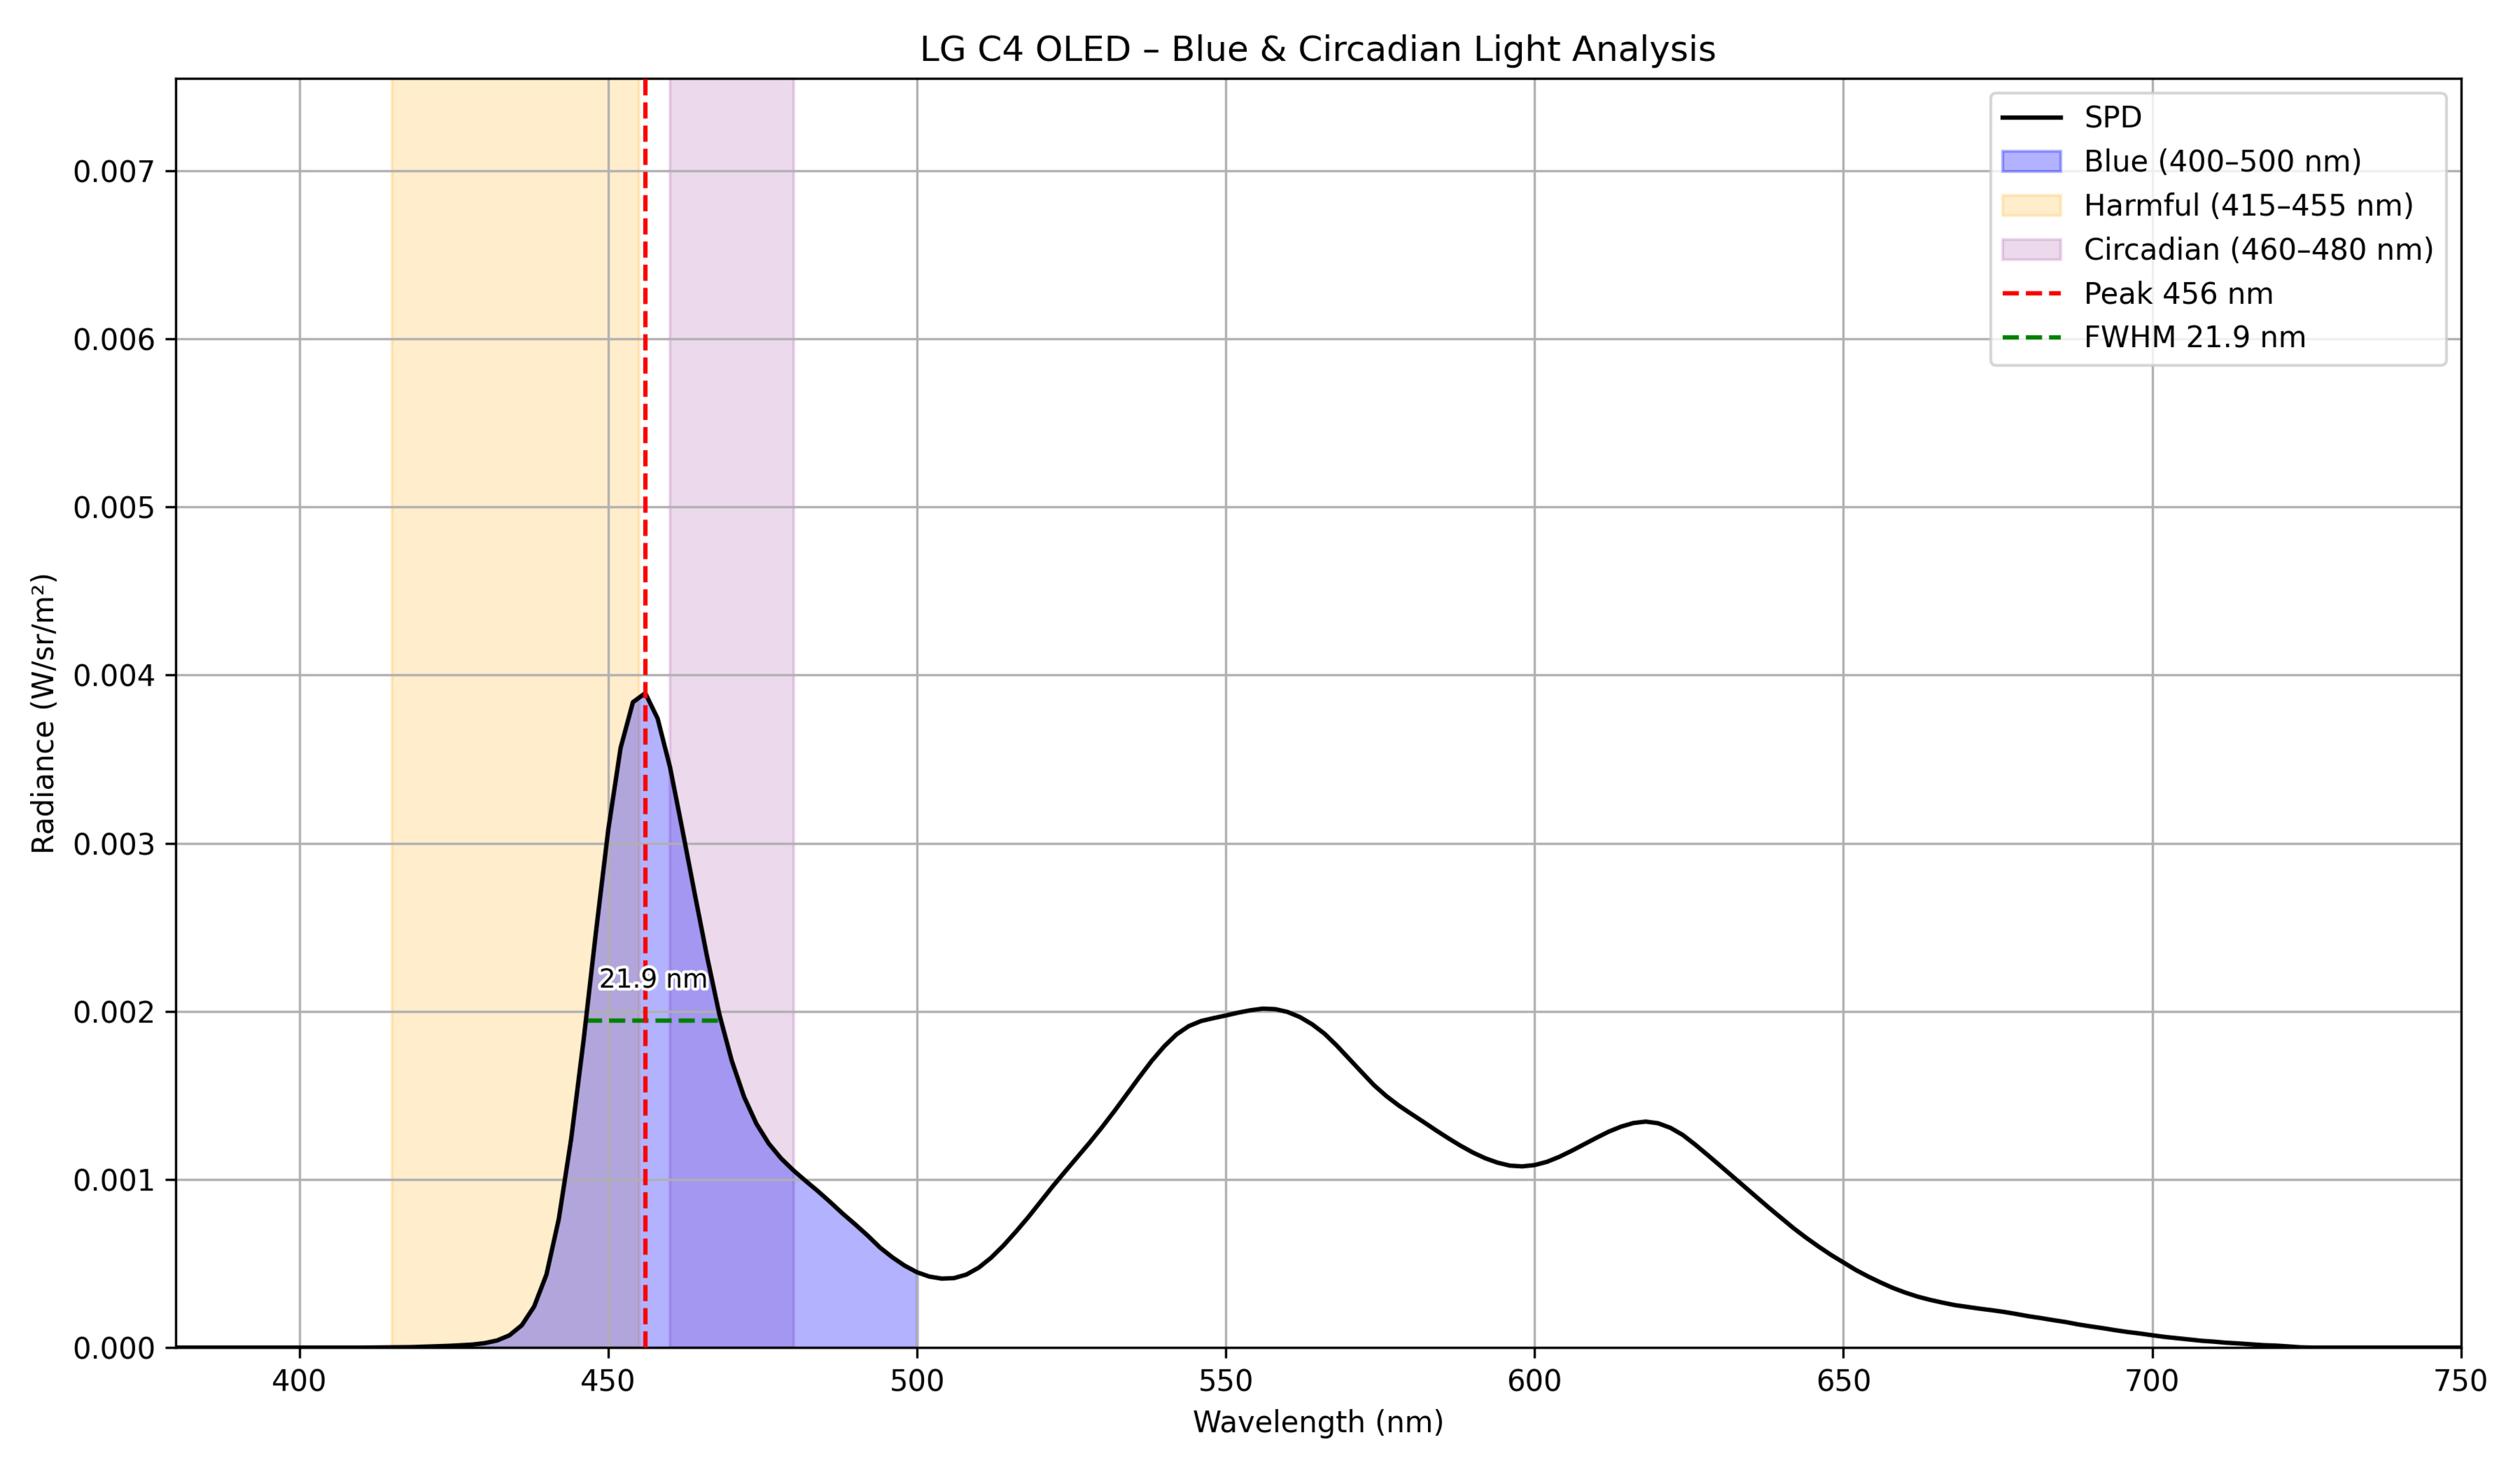 |
WOLED | 456 | 21.9 | 29.56 | 35.76 | 0.107456 |
| LG C5 OLED | 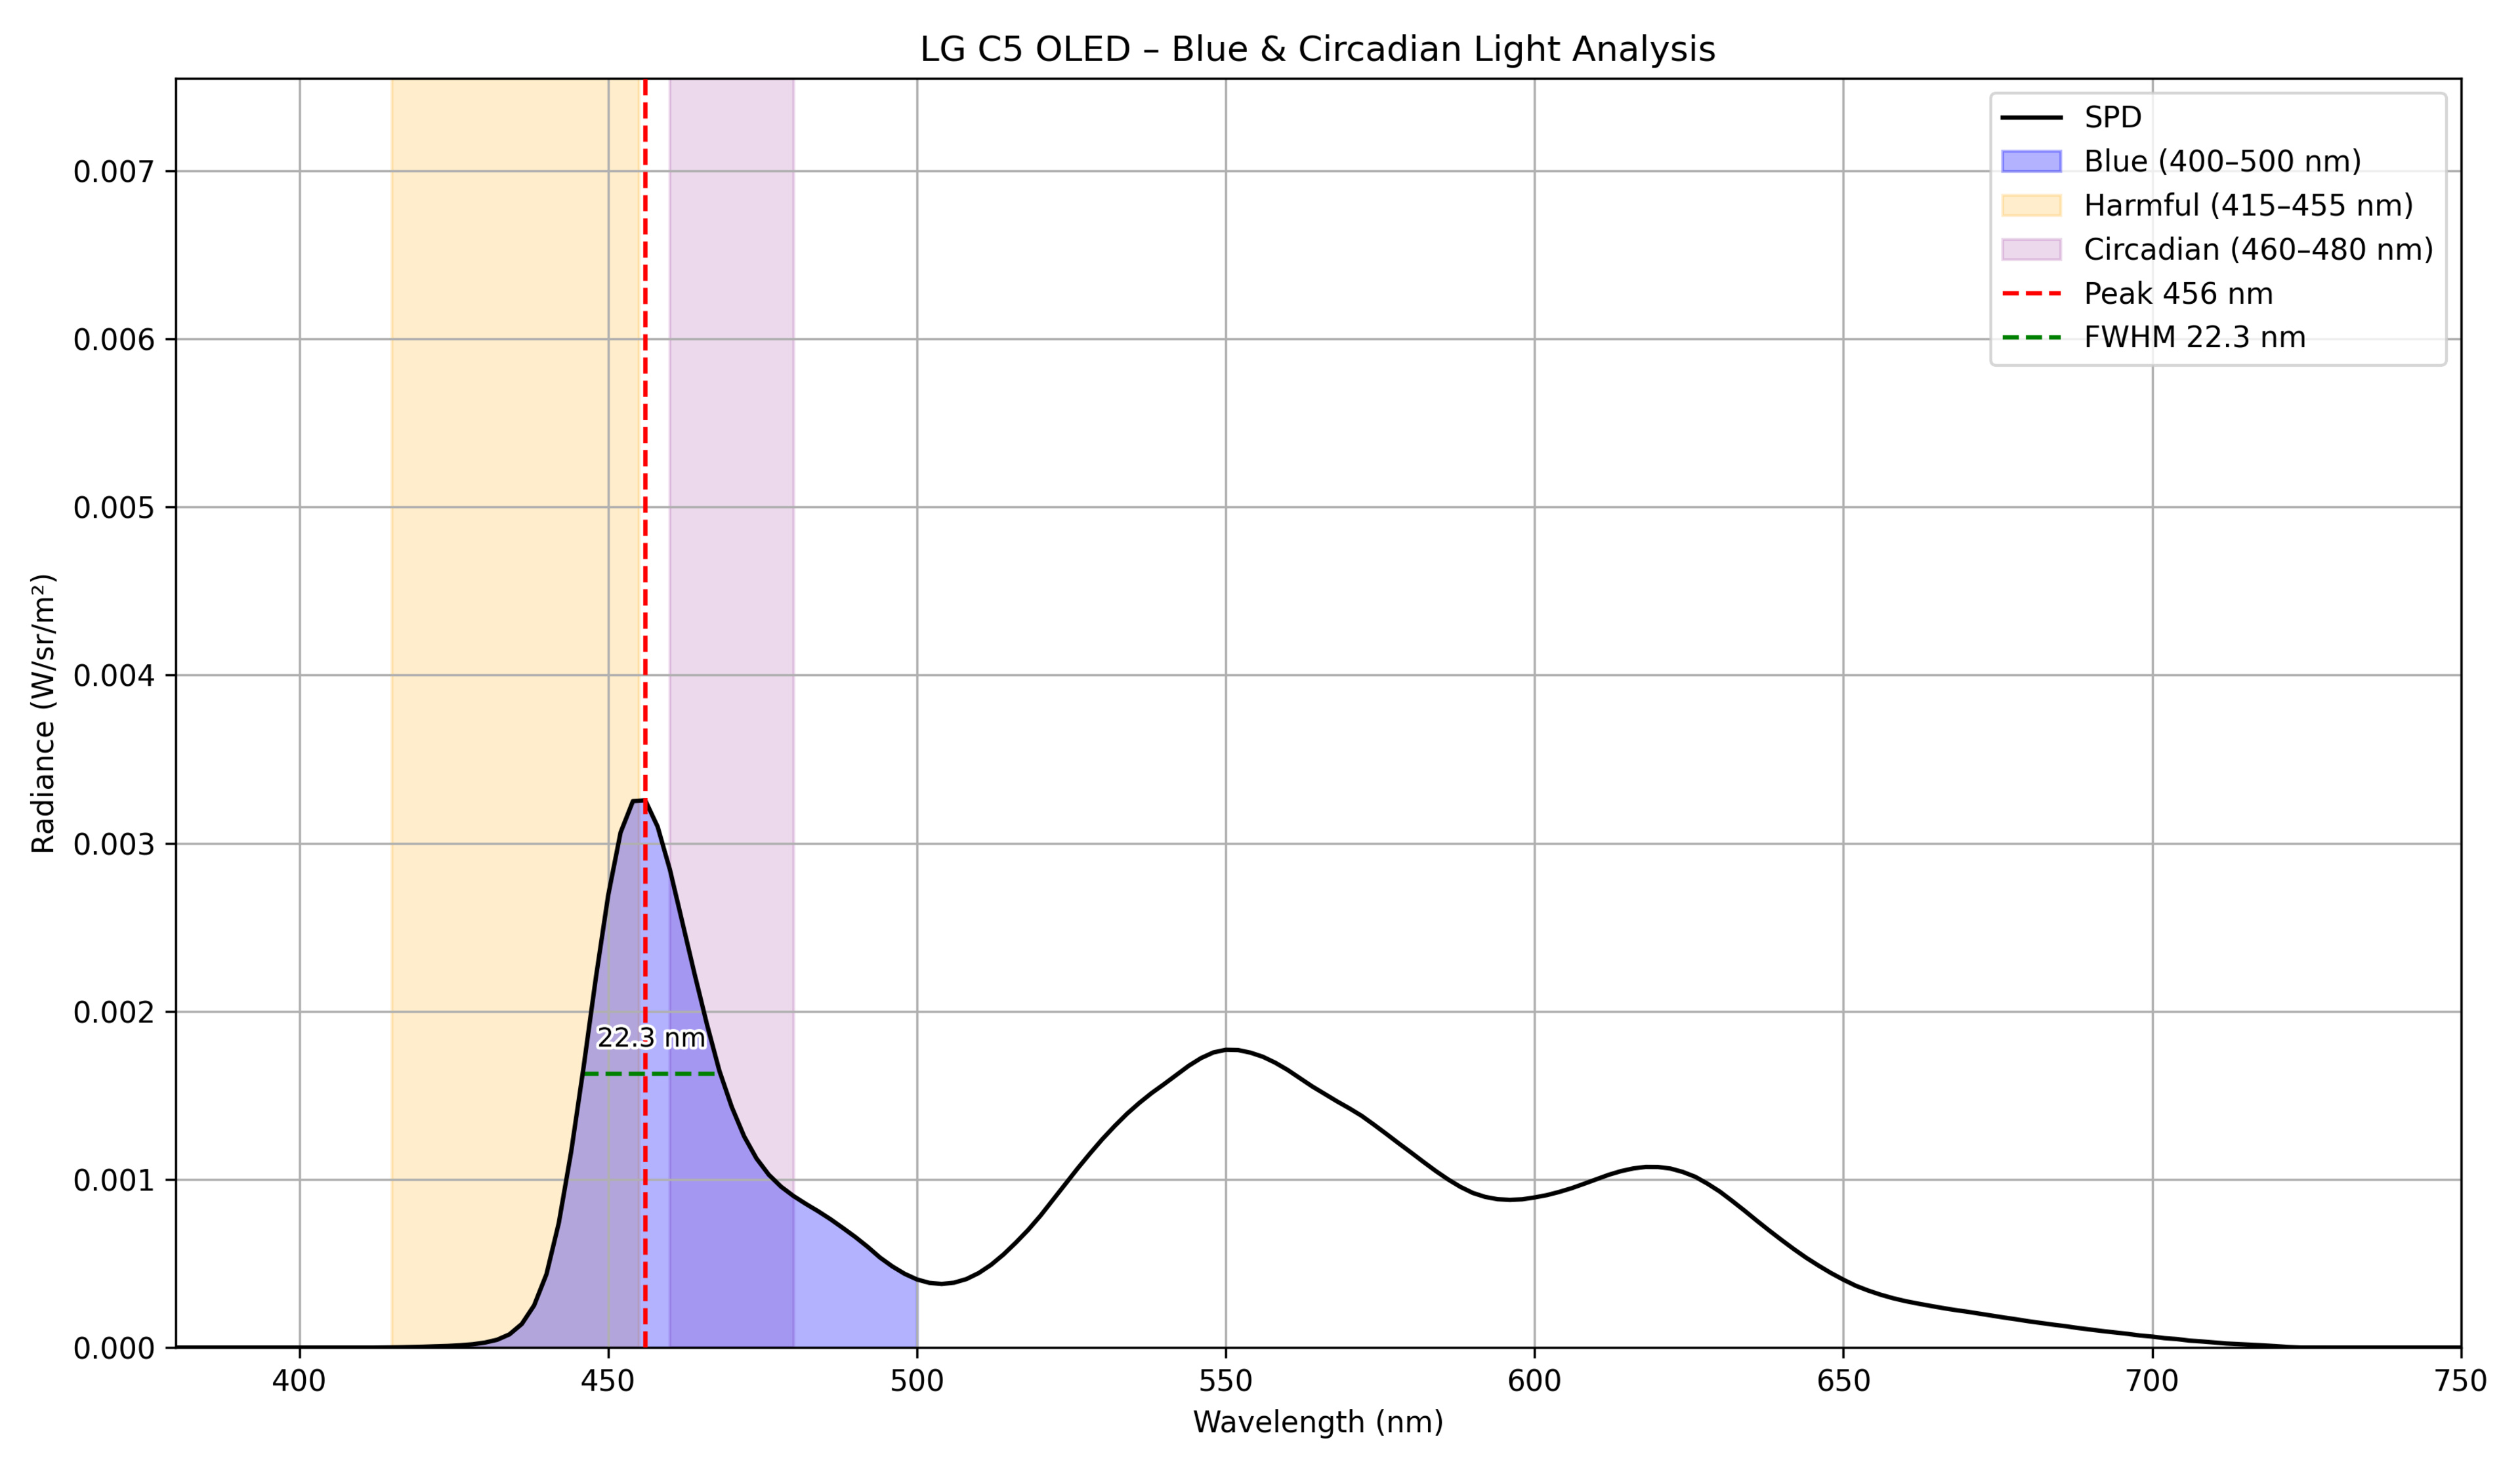 |
WOLED | 456 | 22.3 | 30.8 | 34.68 | 0.092195 |
| LG G4 OLED | 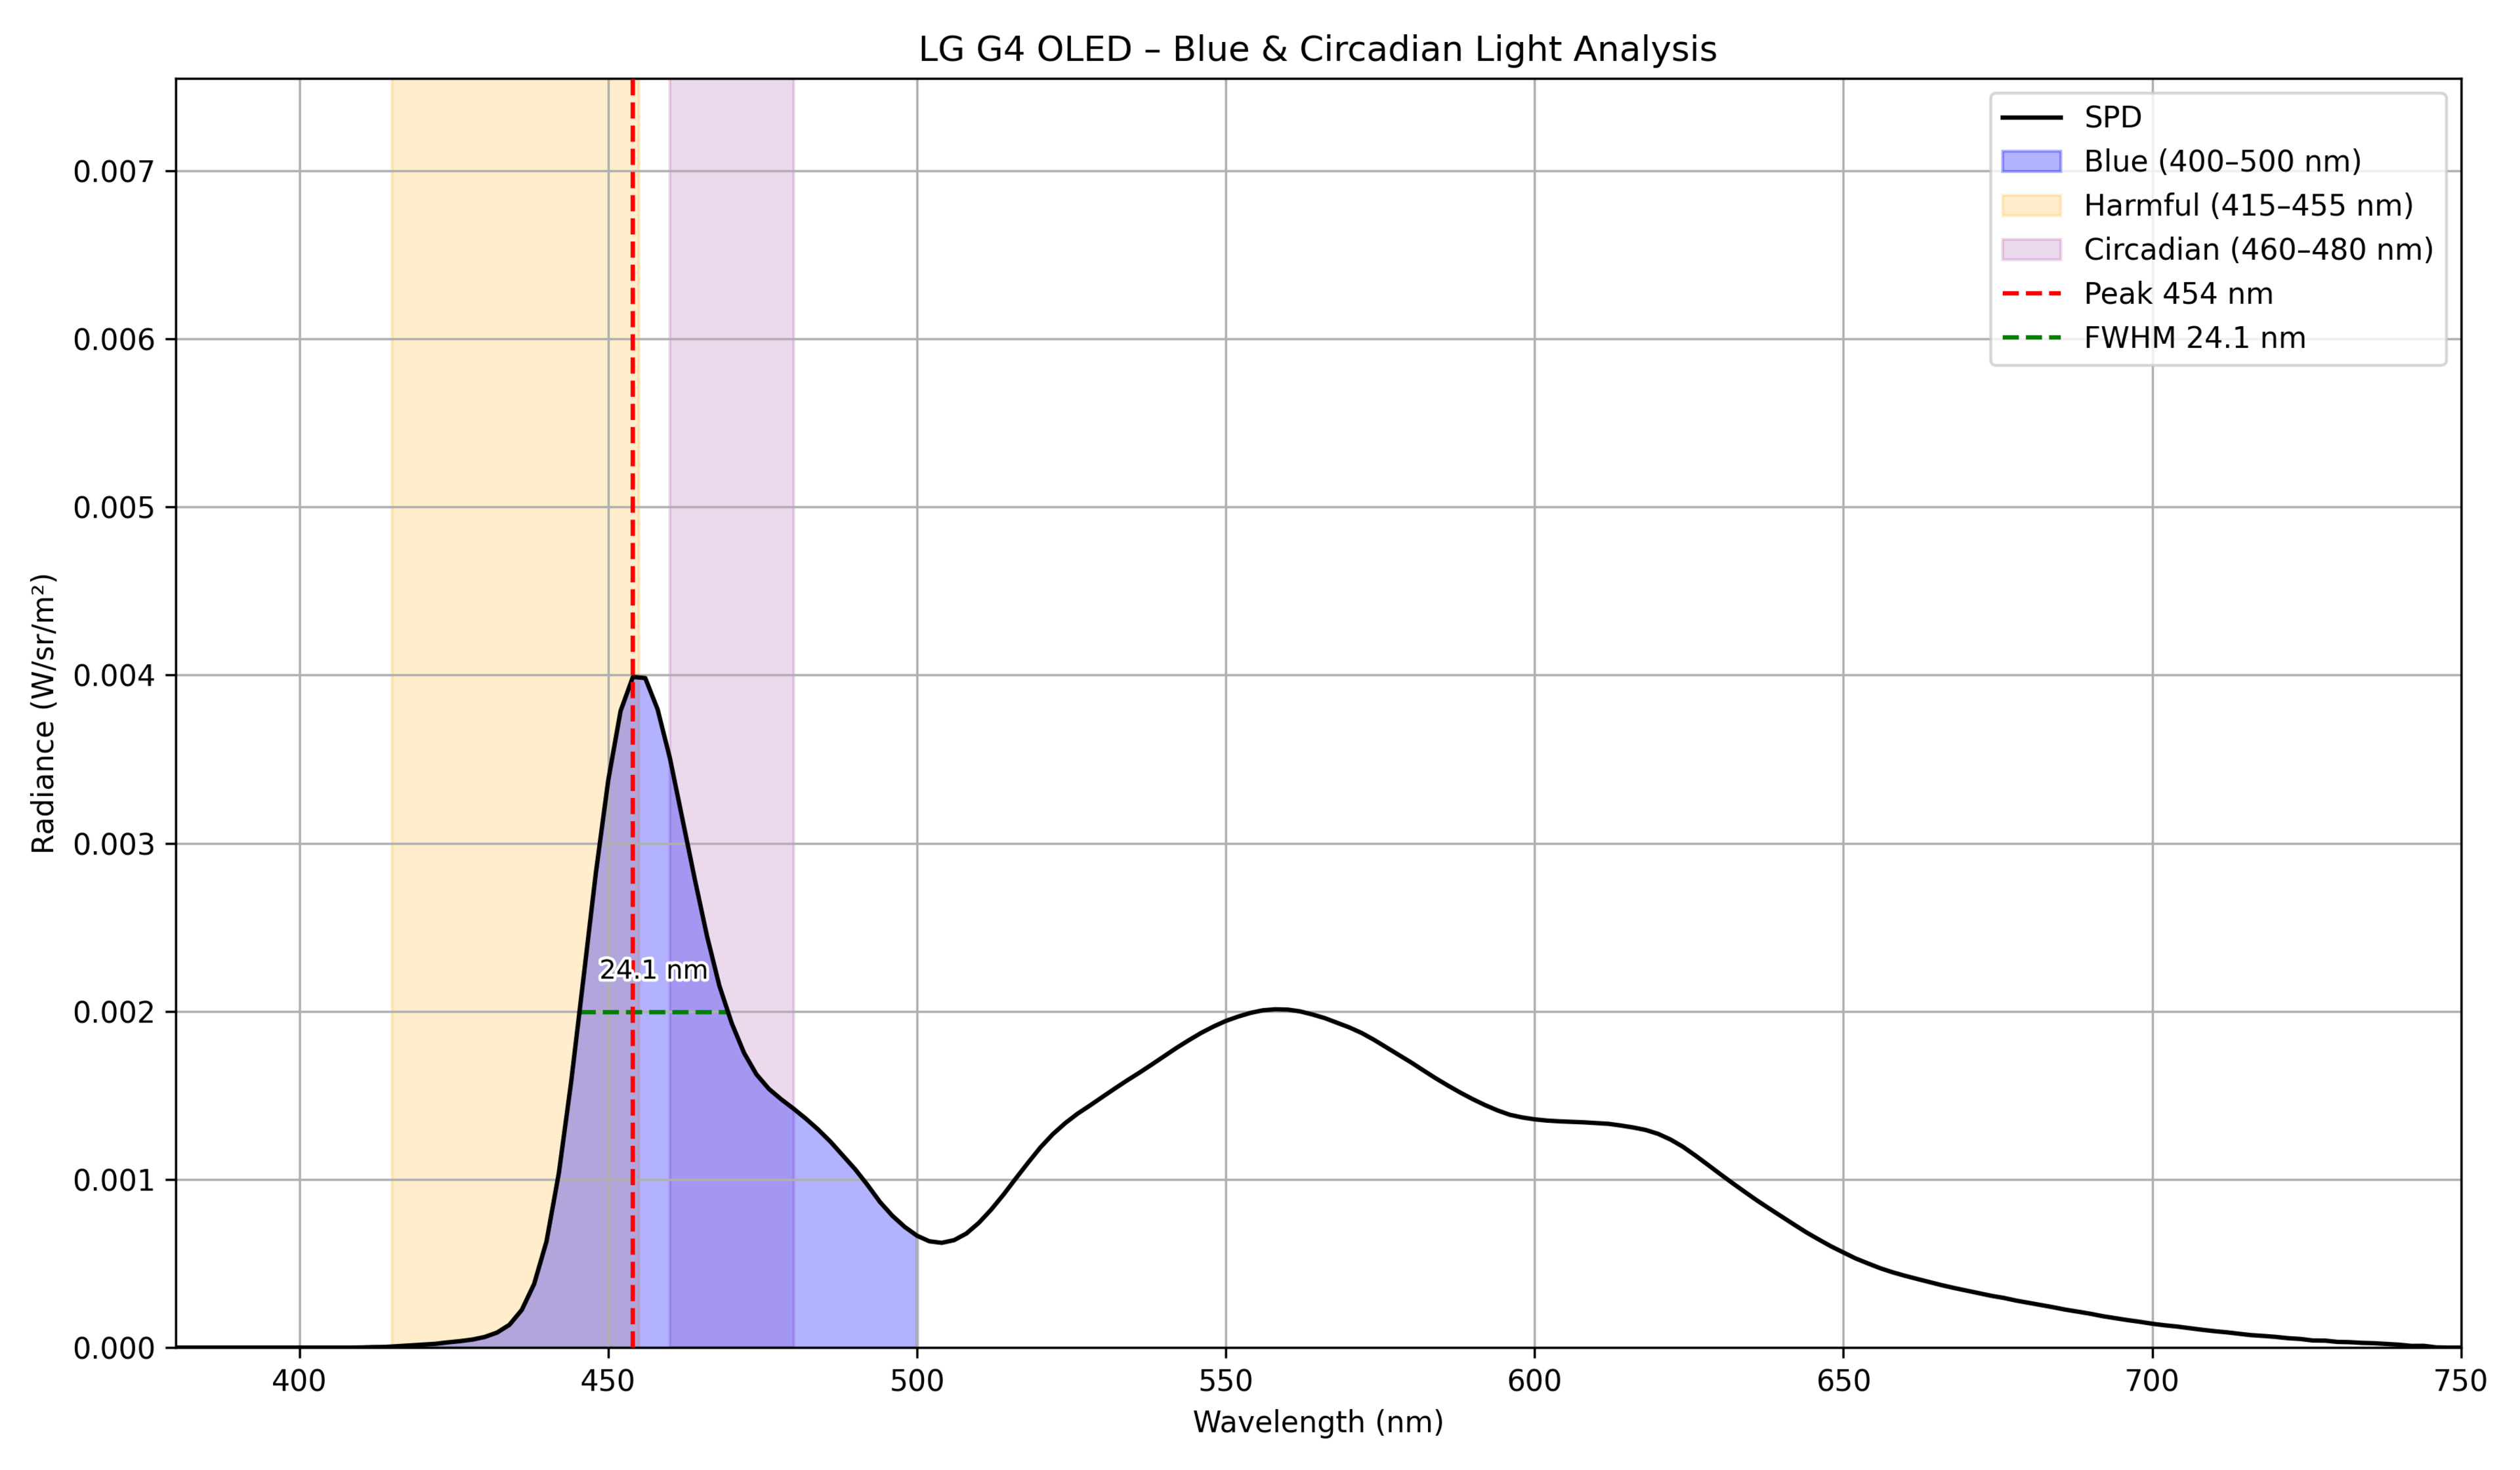 |
WOLED | 454 | 24.1 | 29.92 | 34.49 | 0.123643 |
| LG G5 OLED | 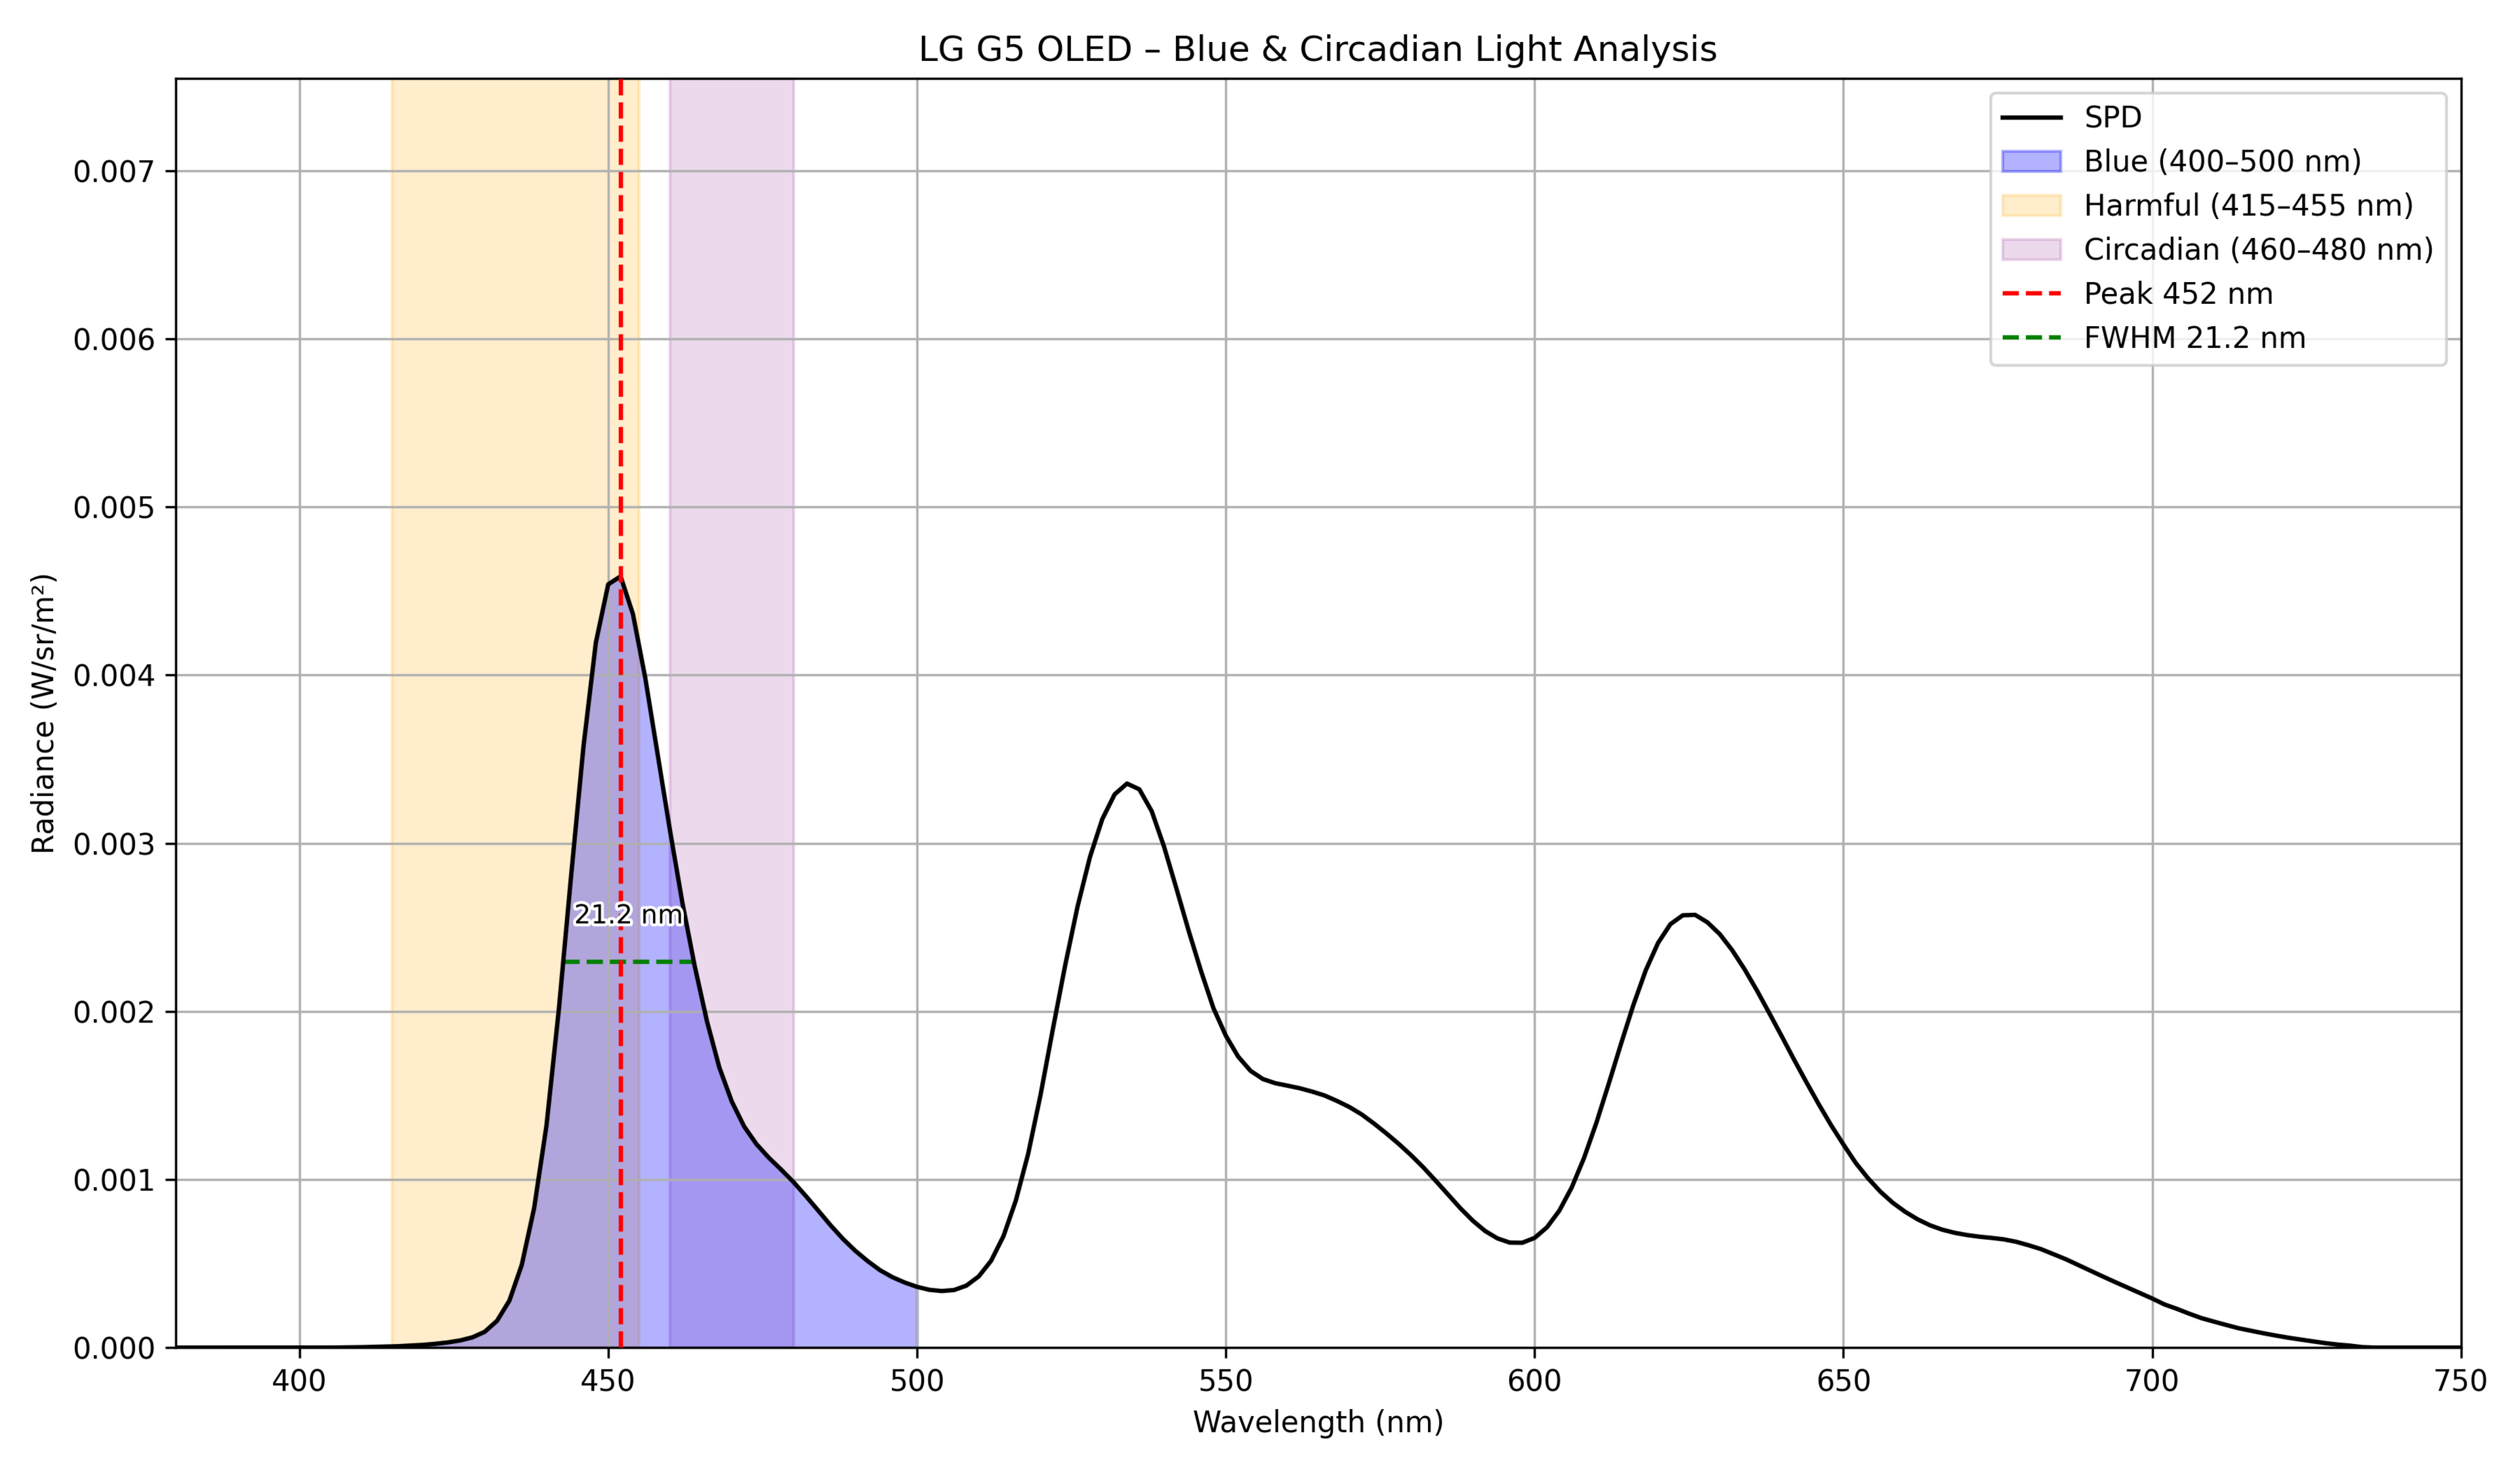 |
WOLED | 452 | 21.2 | 44.43 | 27.26 | 0.122751 |
| Panasonic Z85A OLED | 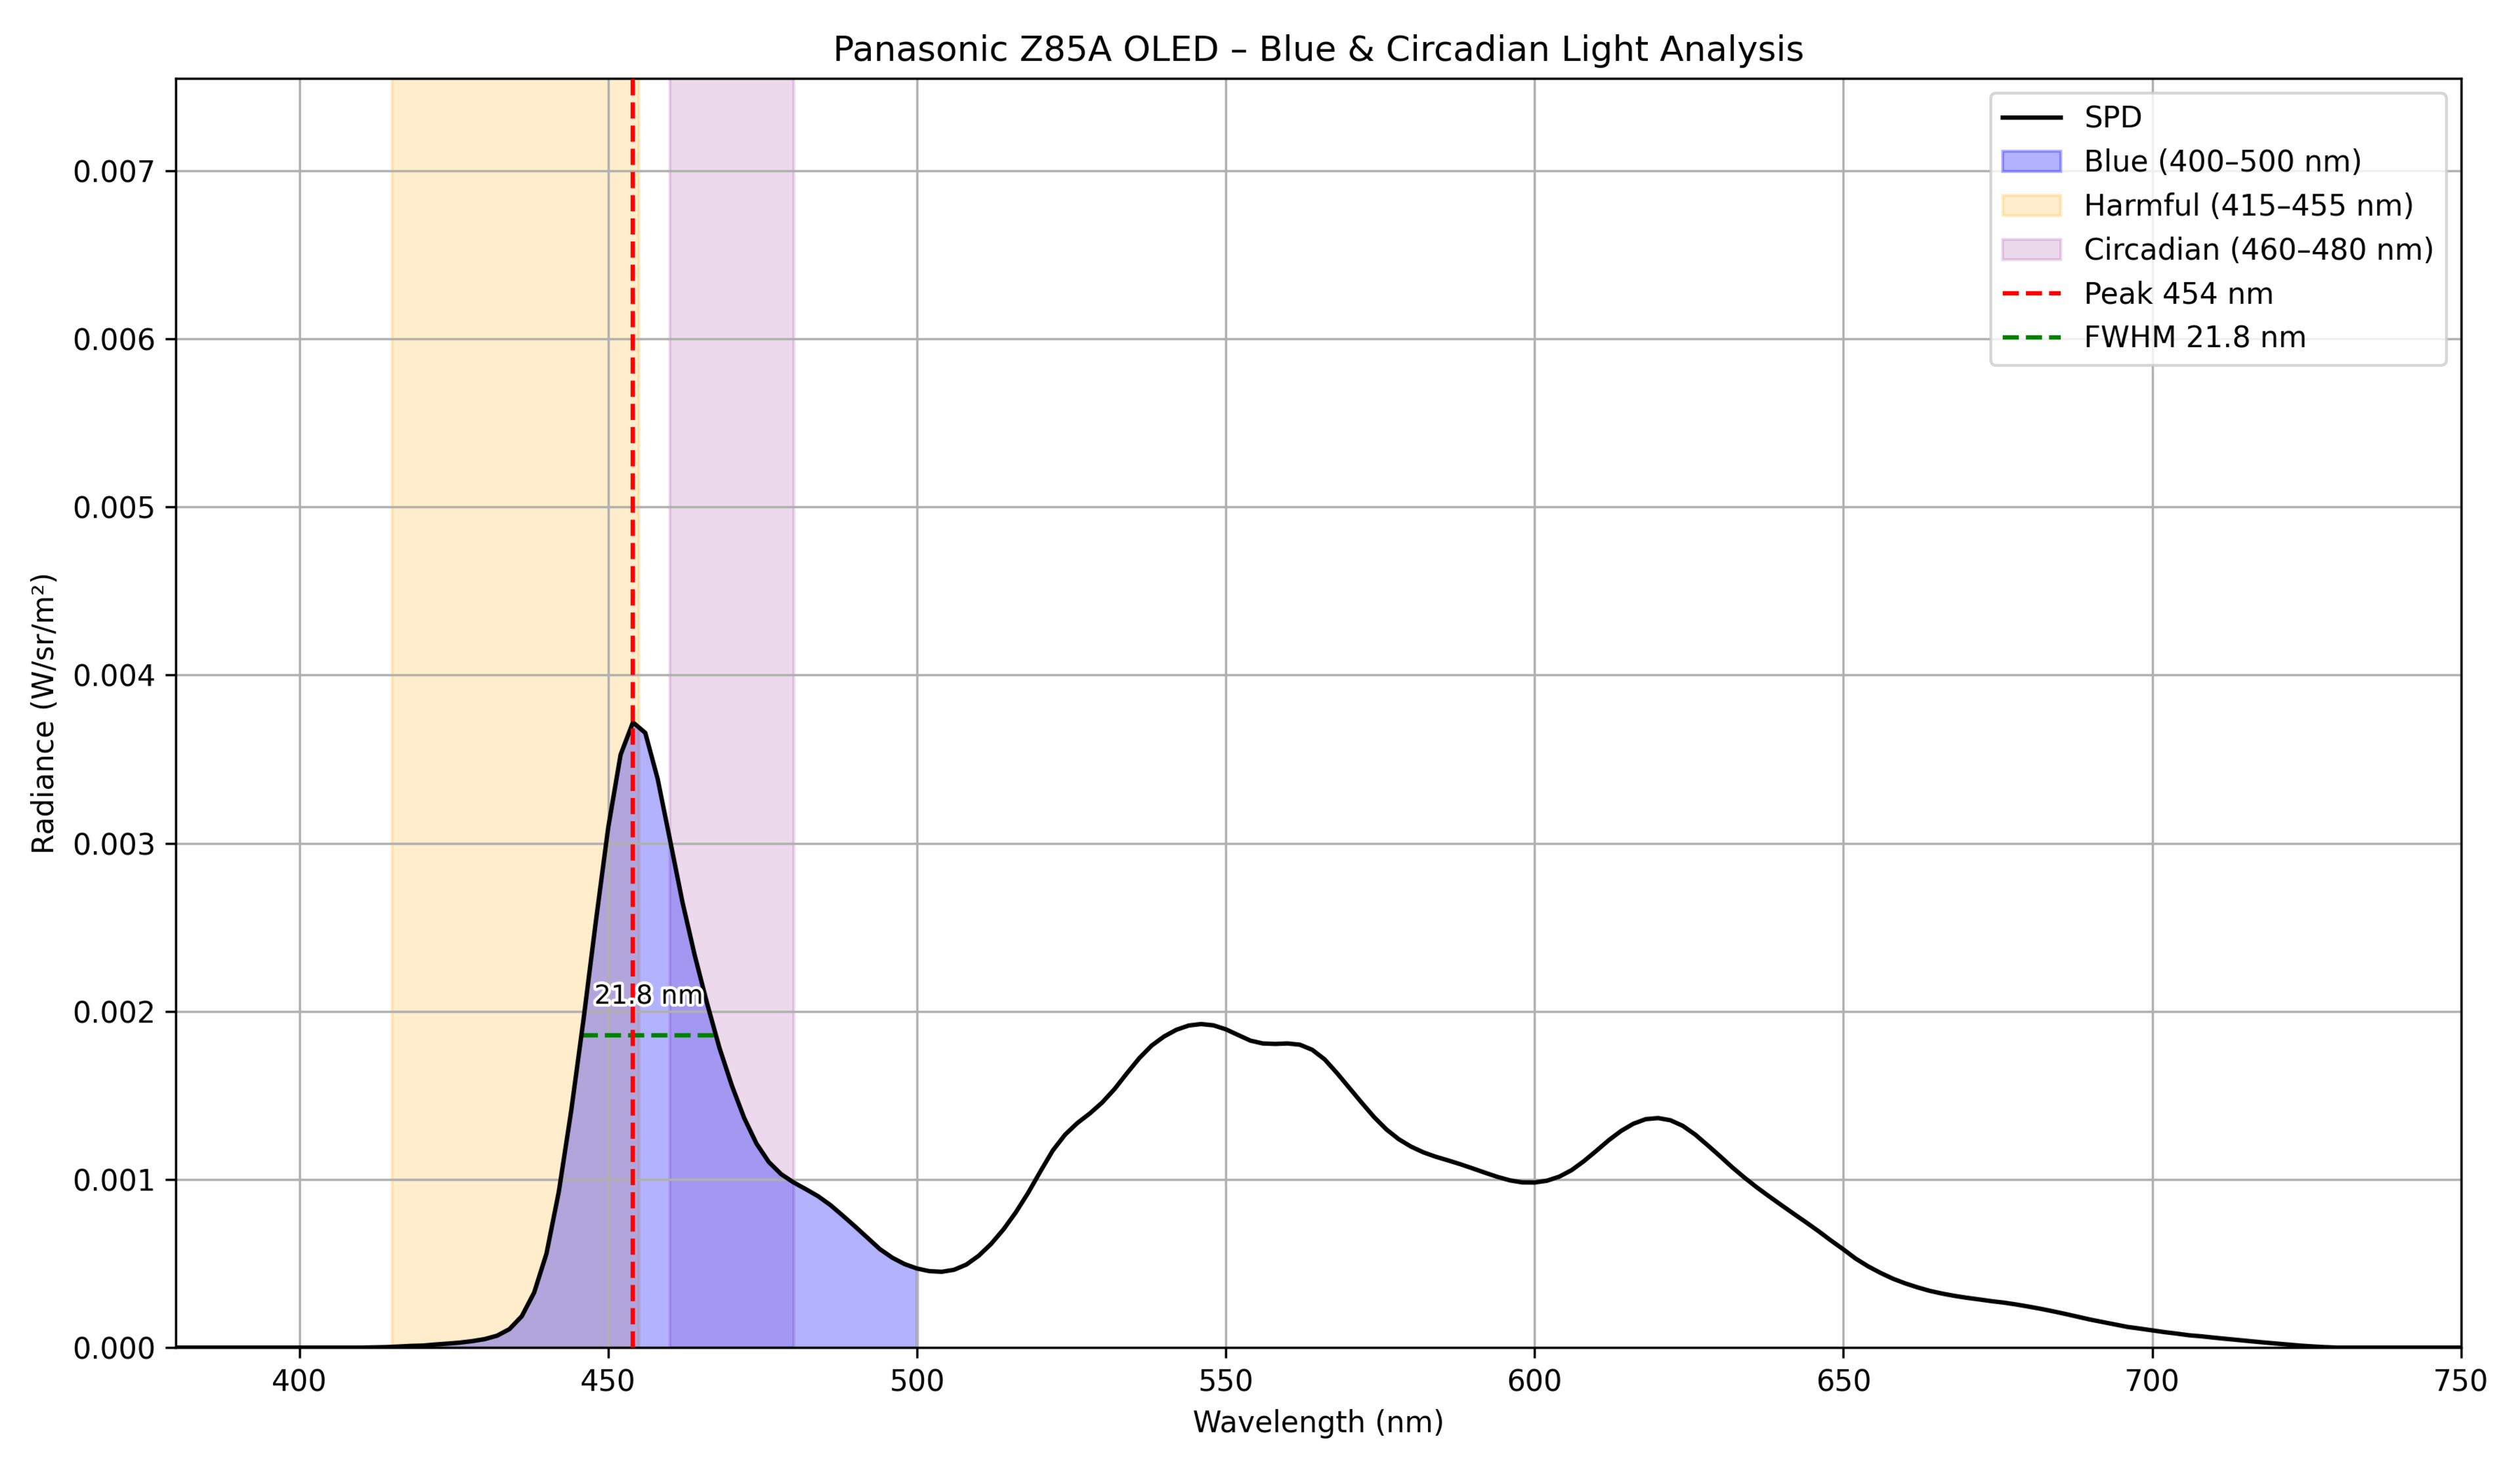 |
WOLED | 454 | 21.8 | 32.54 | 33.23 | 0.102905 |
| Panasonic Z95A OLED | 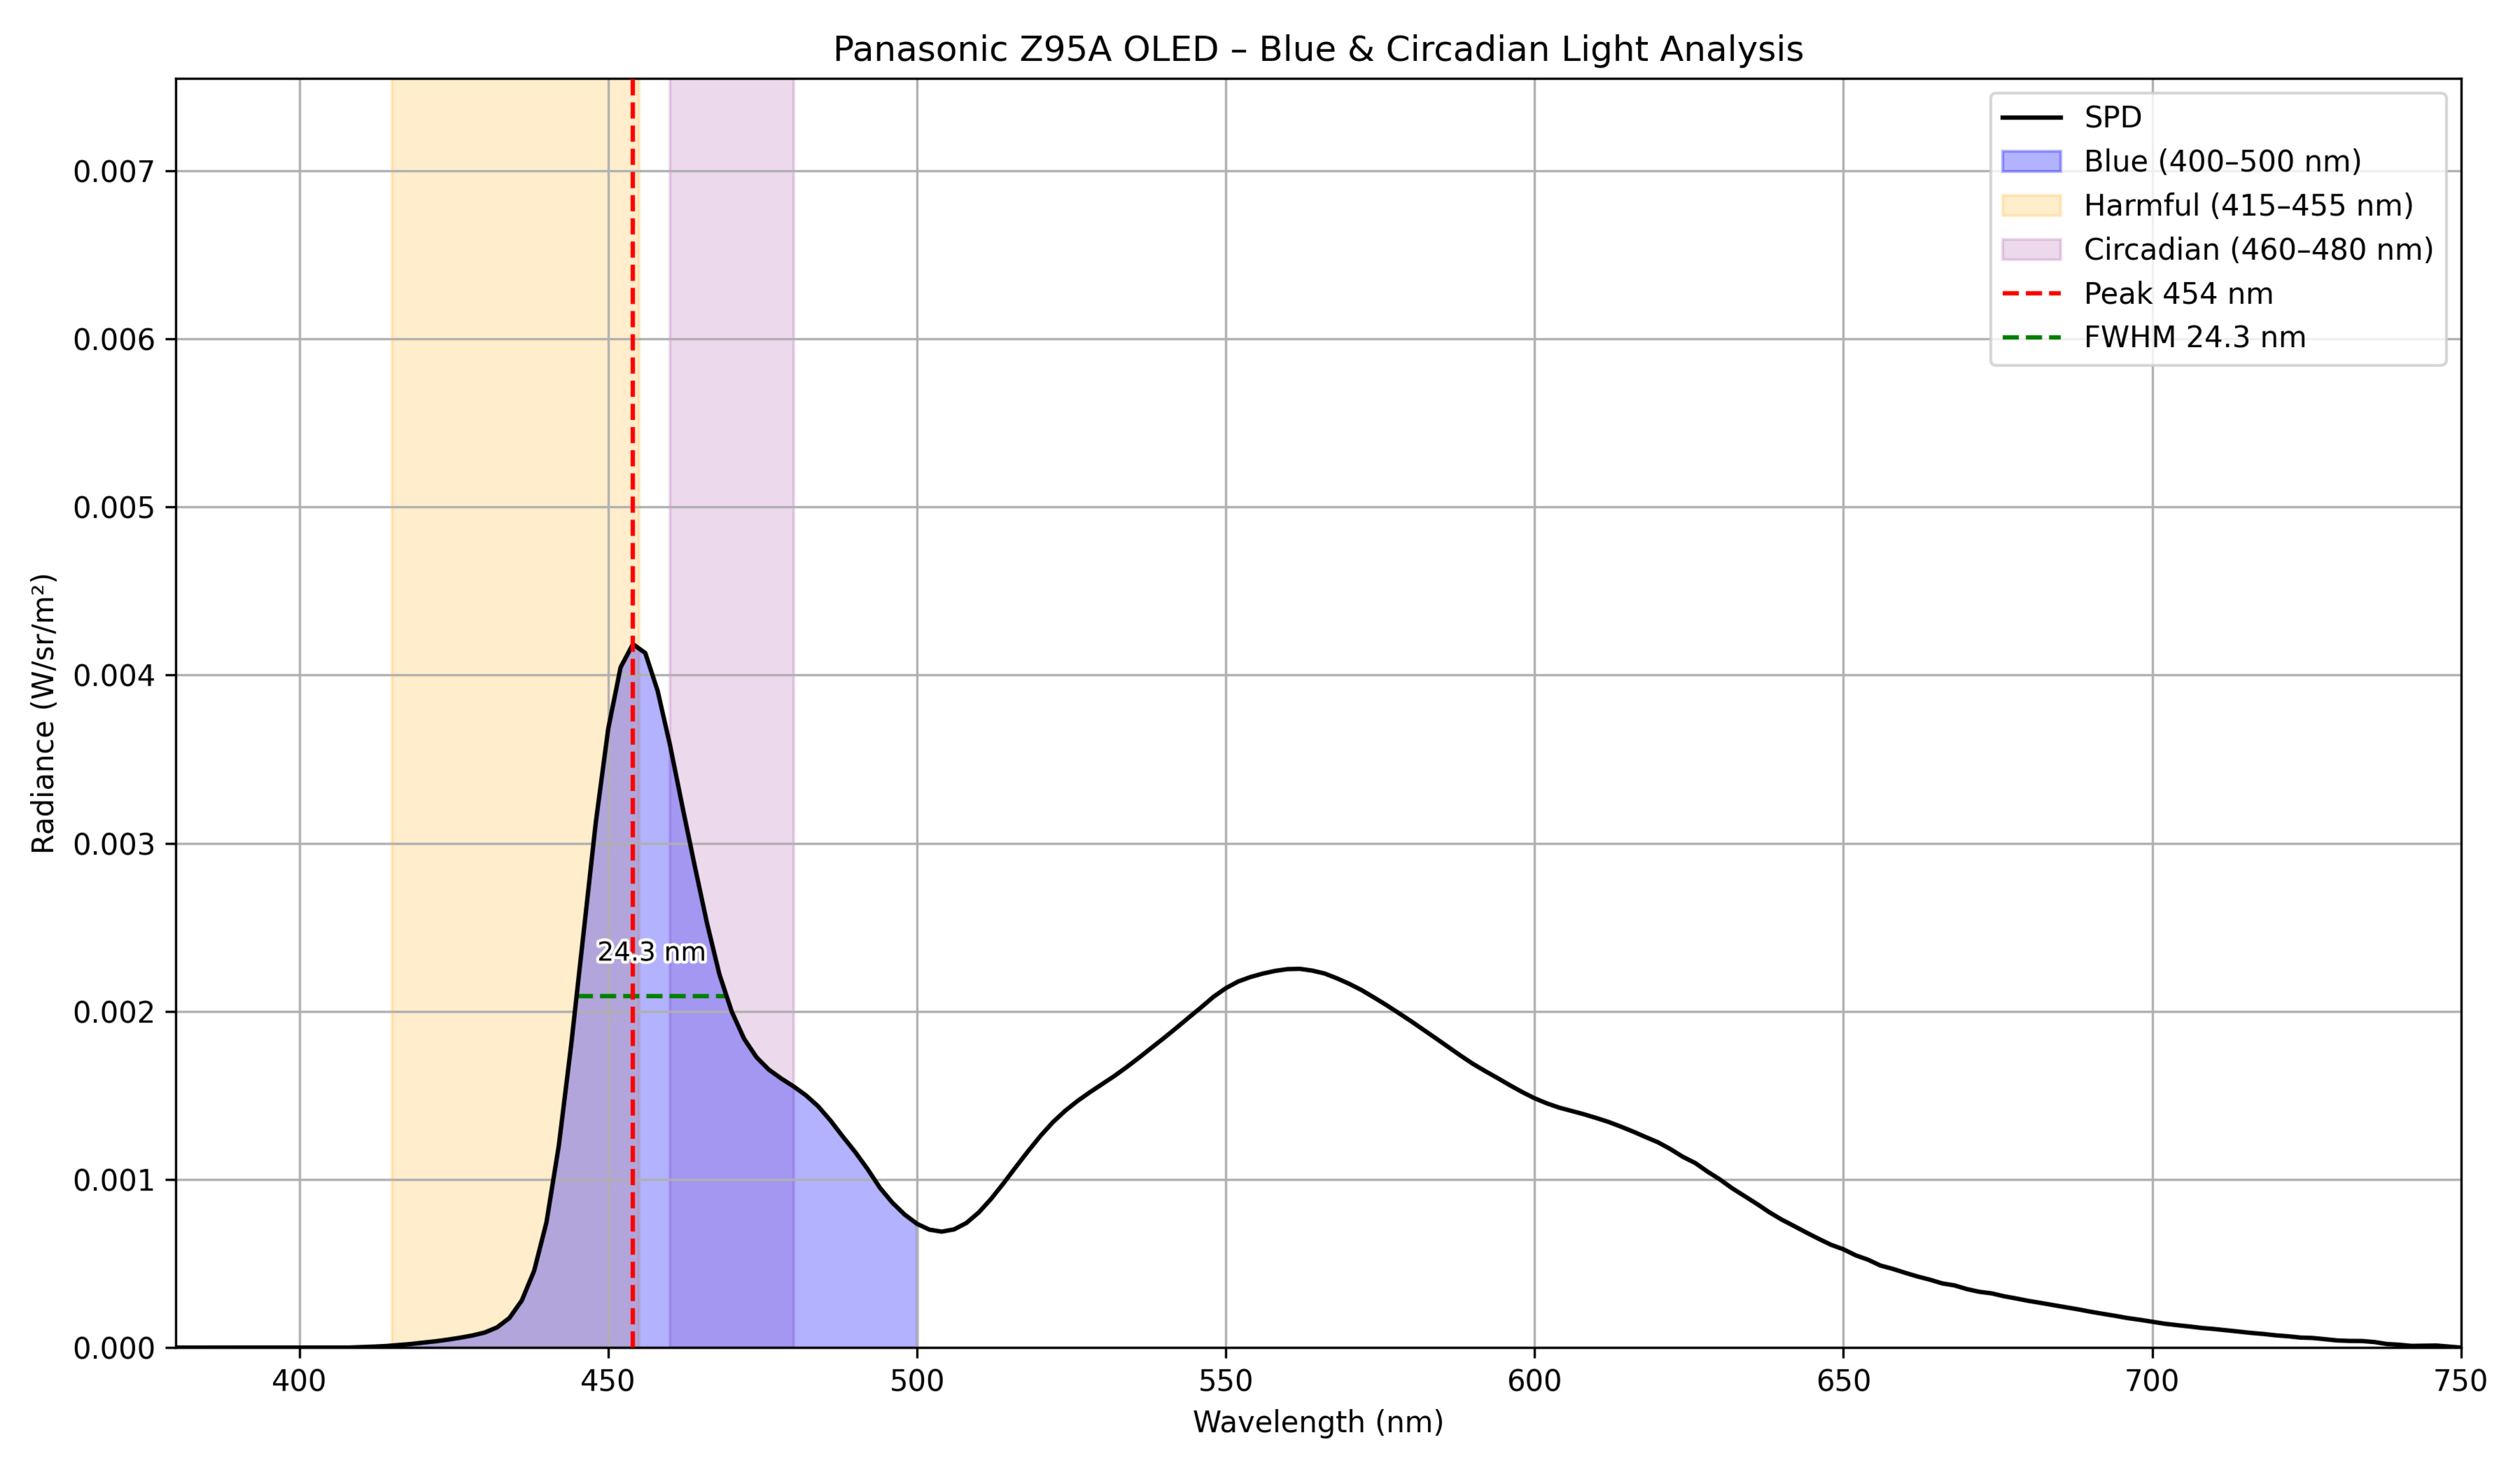 |
WOLED | 454 | 24.3 | 31.03 | 33.54 | 0.132481 |
| Panasonic Z95B OLED | |
WOLED | 452 | 21.3 | 42.69 | 28.38 | 0.106664 |
| Philips 974 Series OLED | 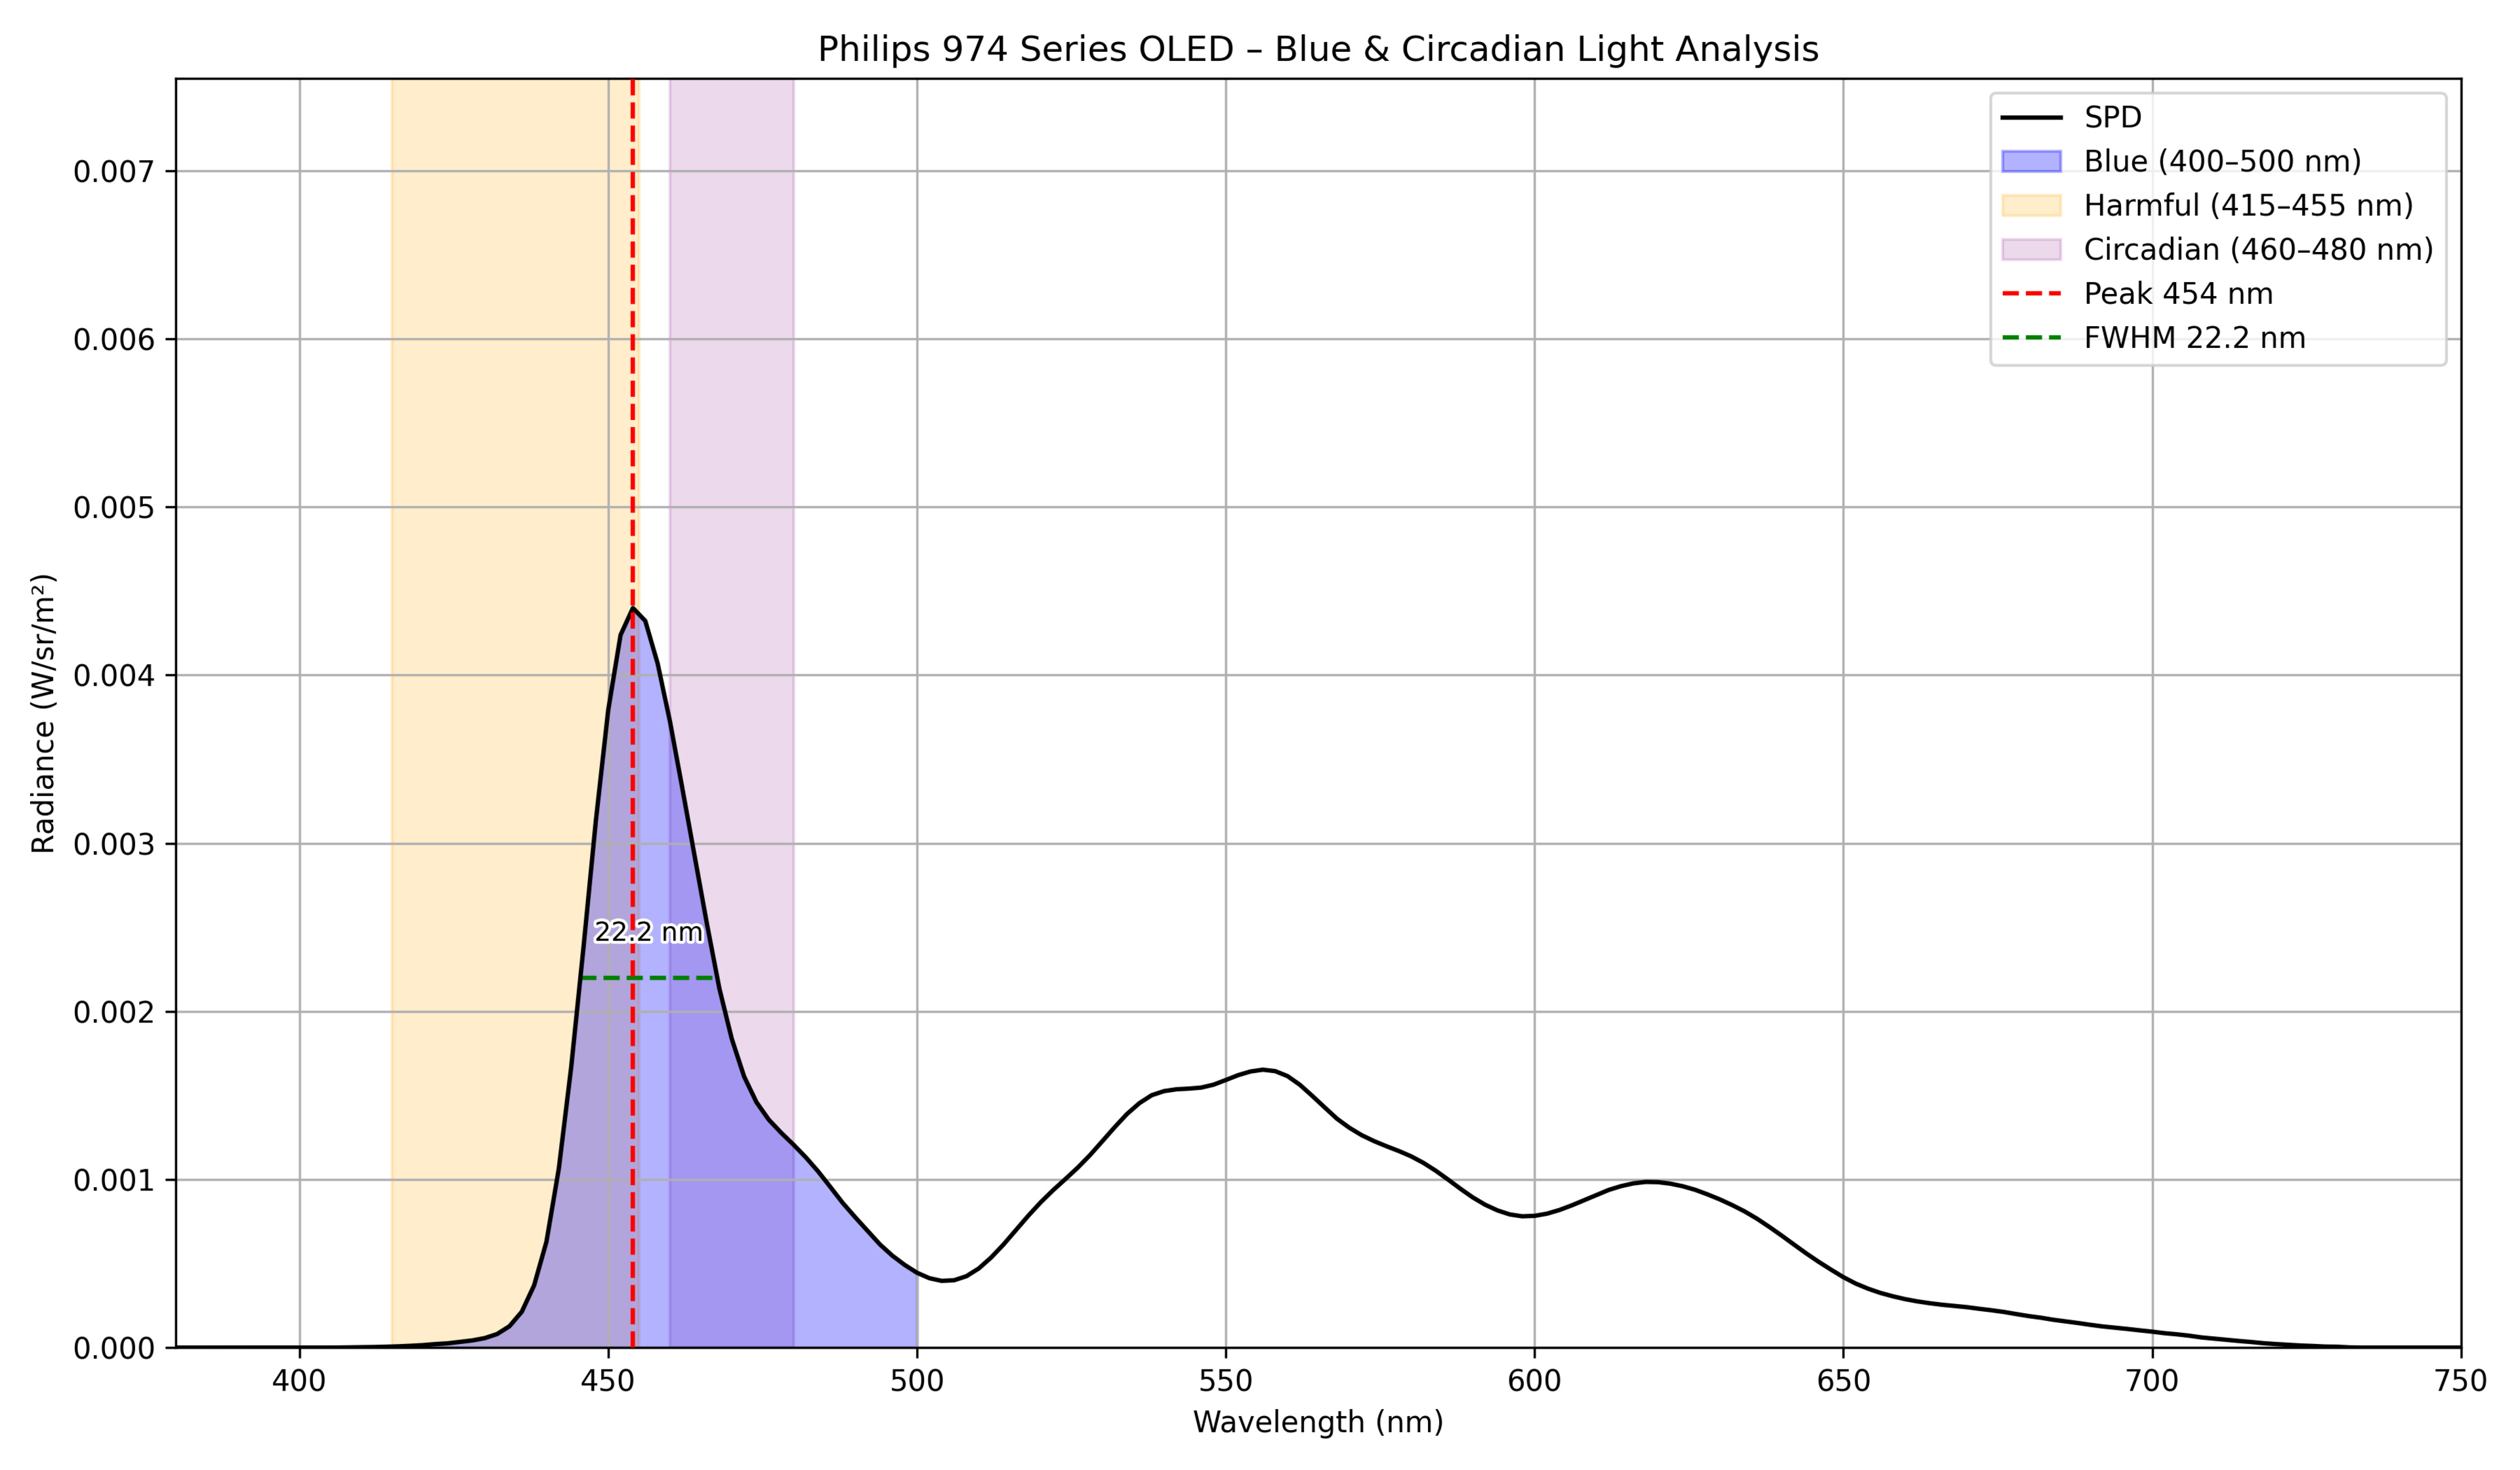 |
WOLED | 454 | 22.2 | 32.74 | 34.04 | 0.122866 |
| Samsung S85D OLED | 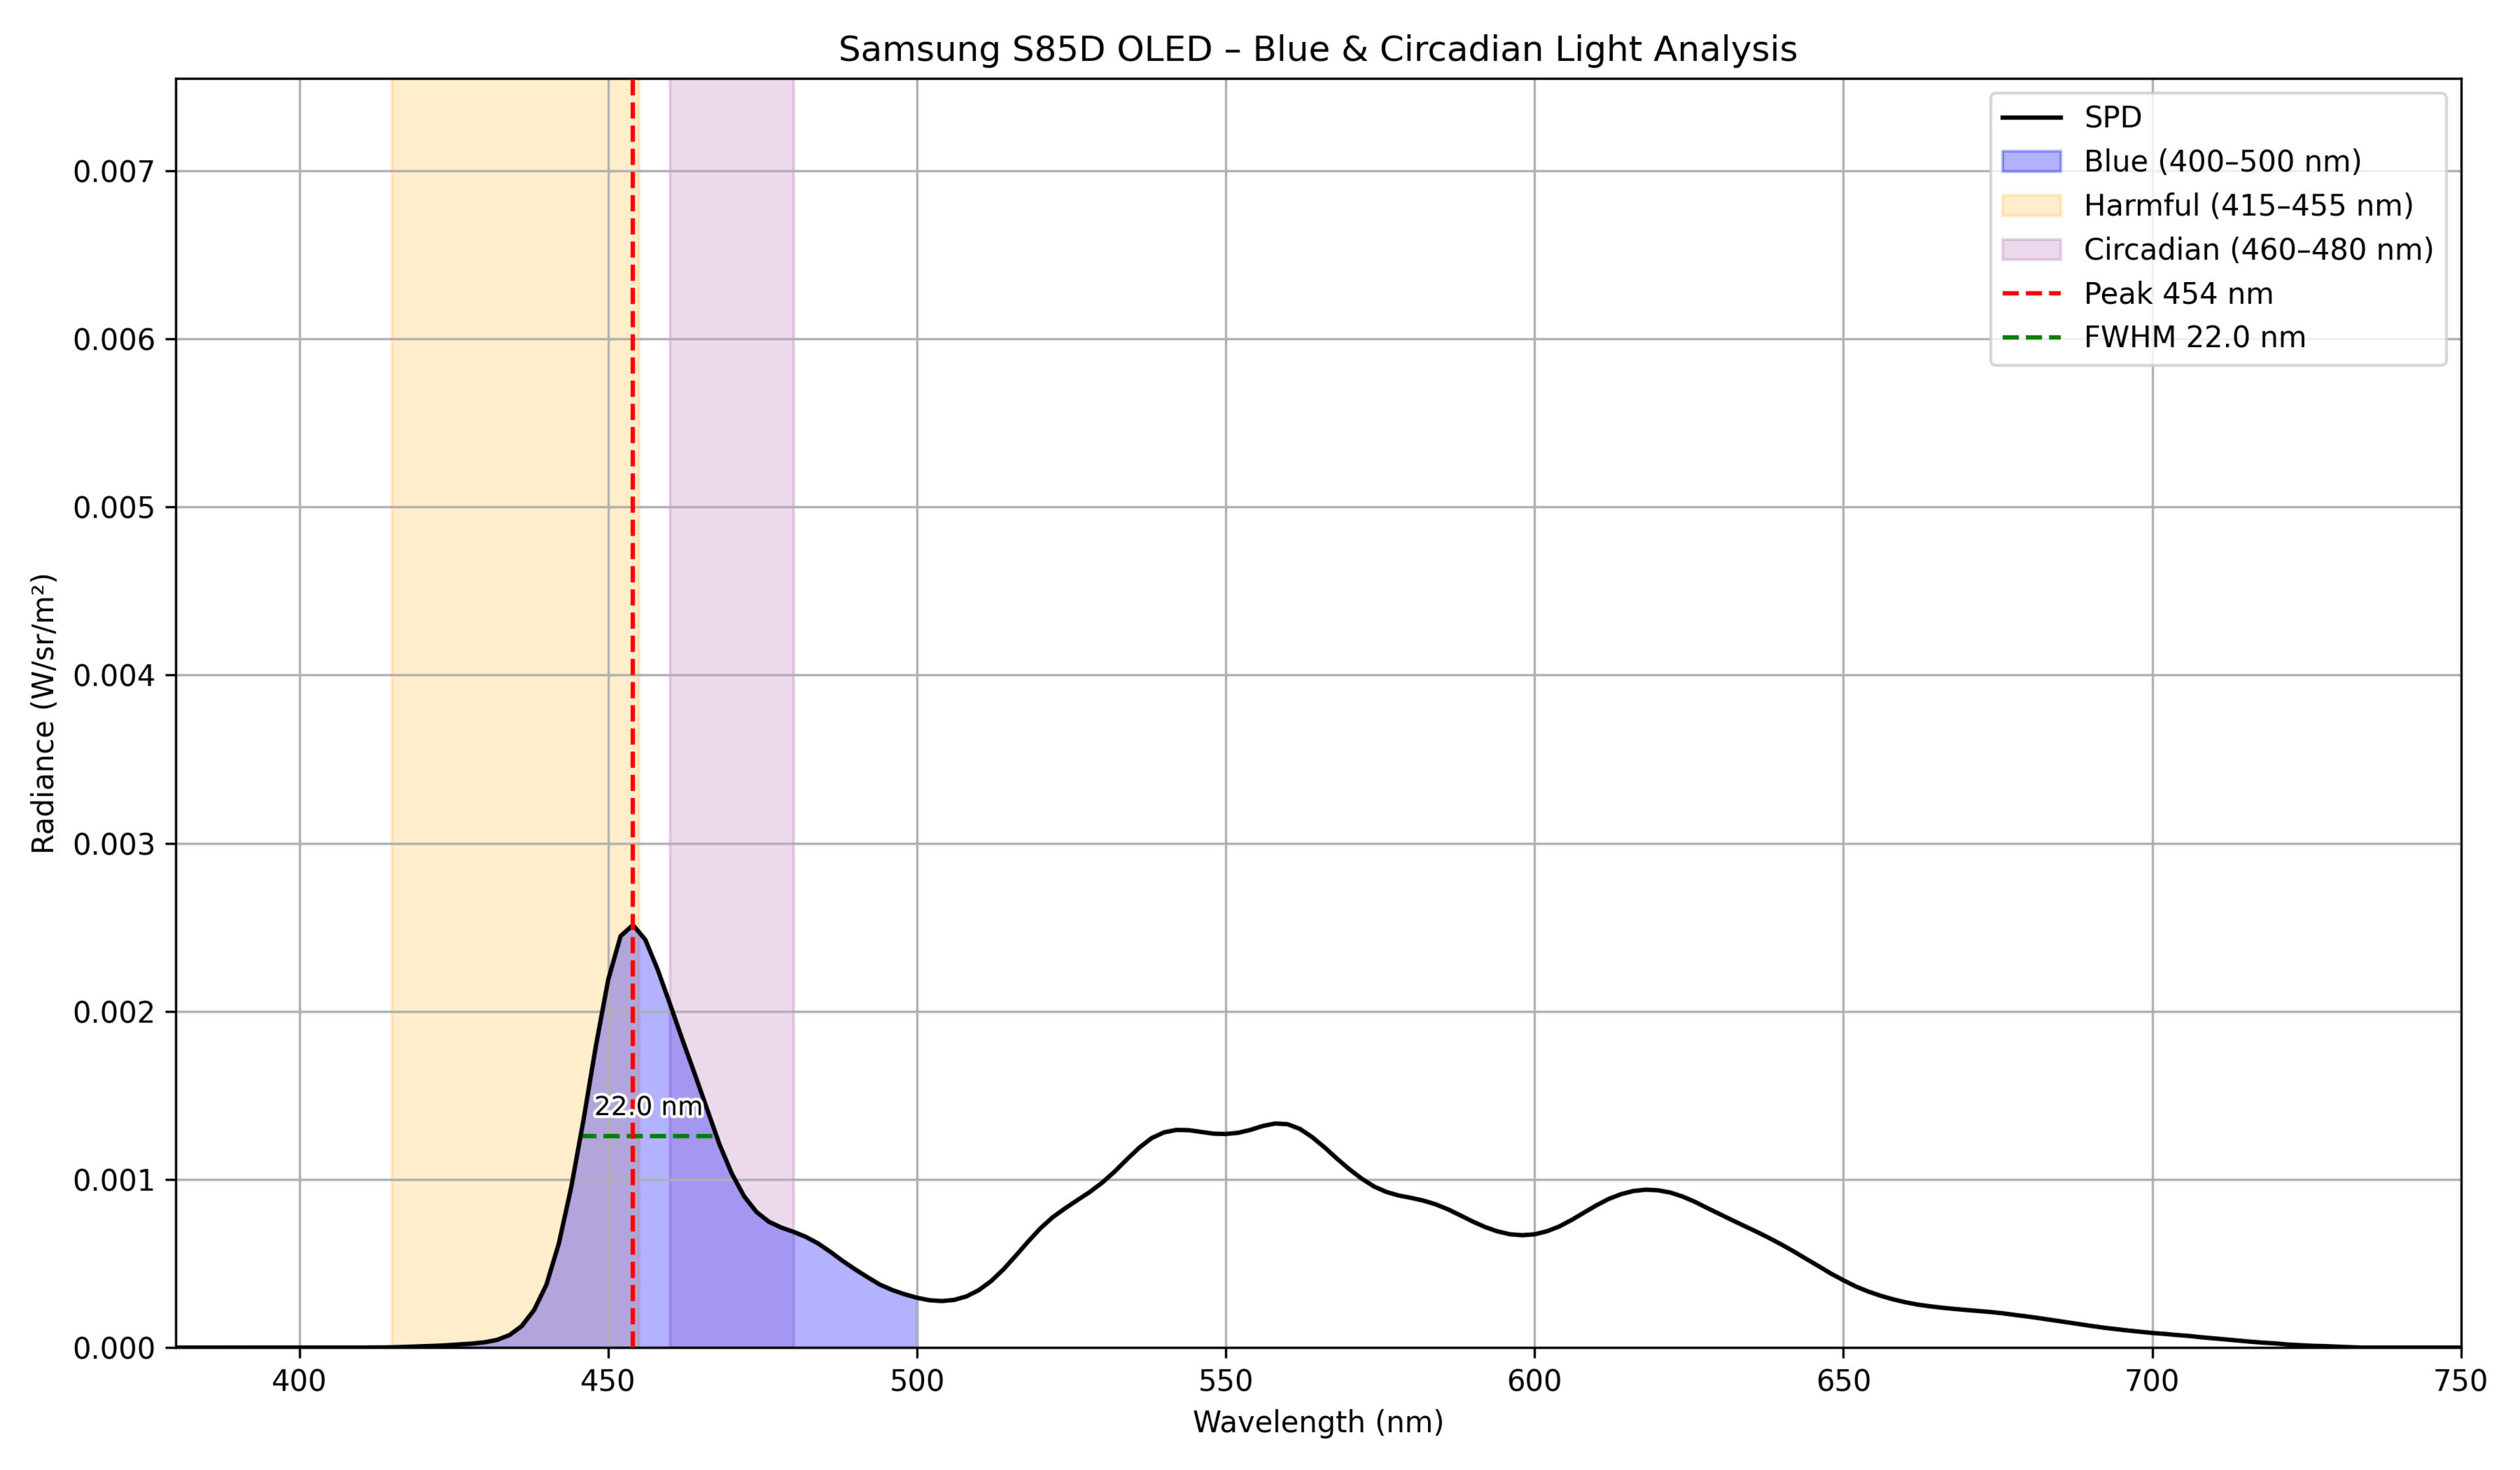 |
QD-OLED | 454 | 22 | 33.1 | 33.35 | 0.069944 |
| Samsung S85F OLED |  |
QD-OLED | 452 | 21 | 39.39 | 30.72 | 0.096546 |
| Samsung S90D OLED |  |
QD-OLED | 452 | 20.9 | 39.15 | 30.72 | 0.102461 |
| Samsung S90F OLED | 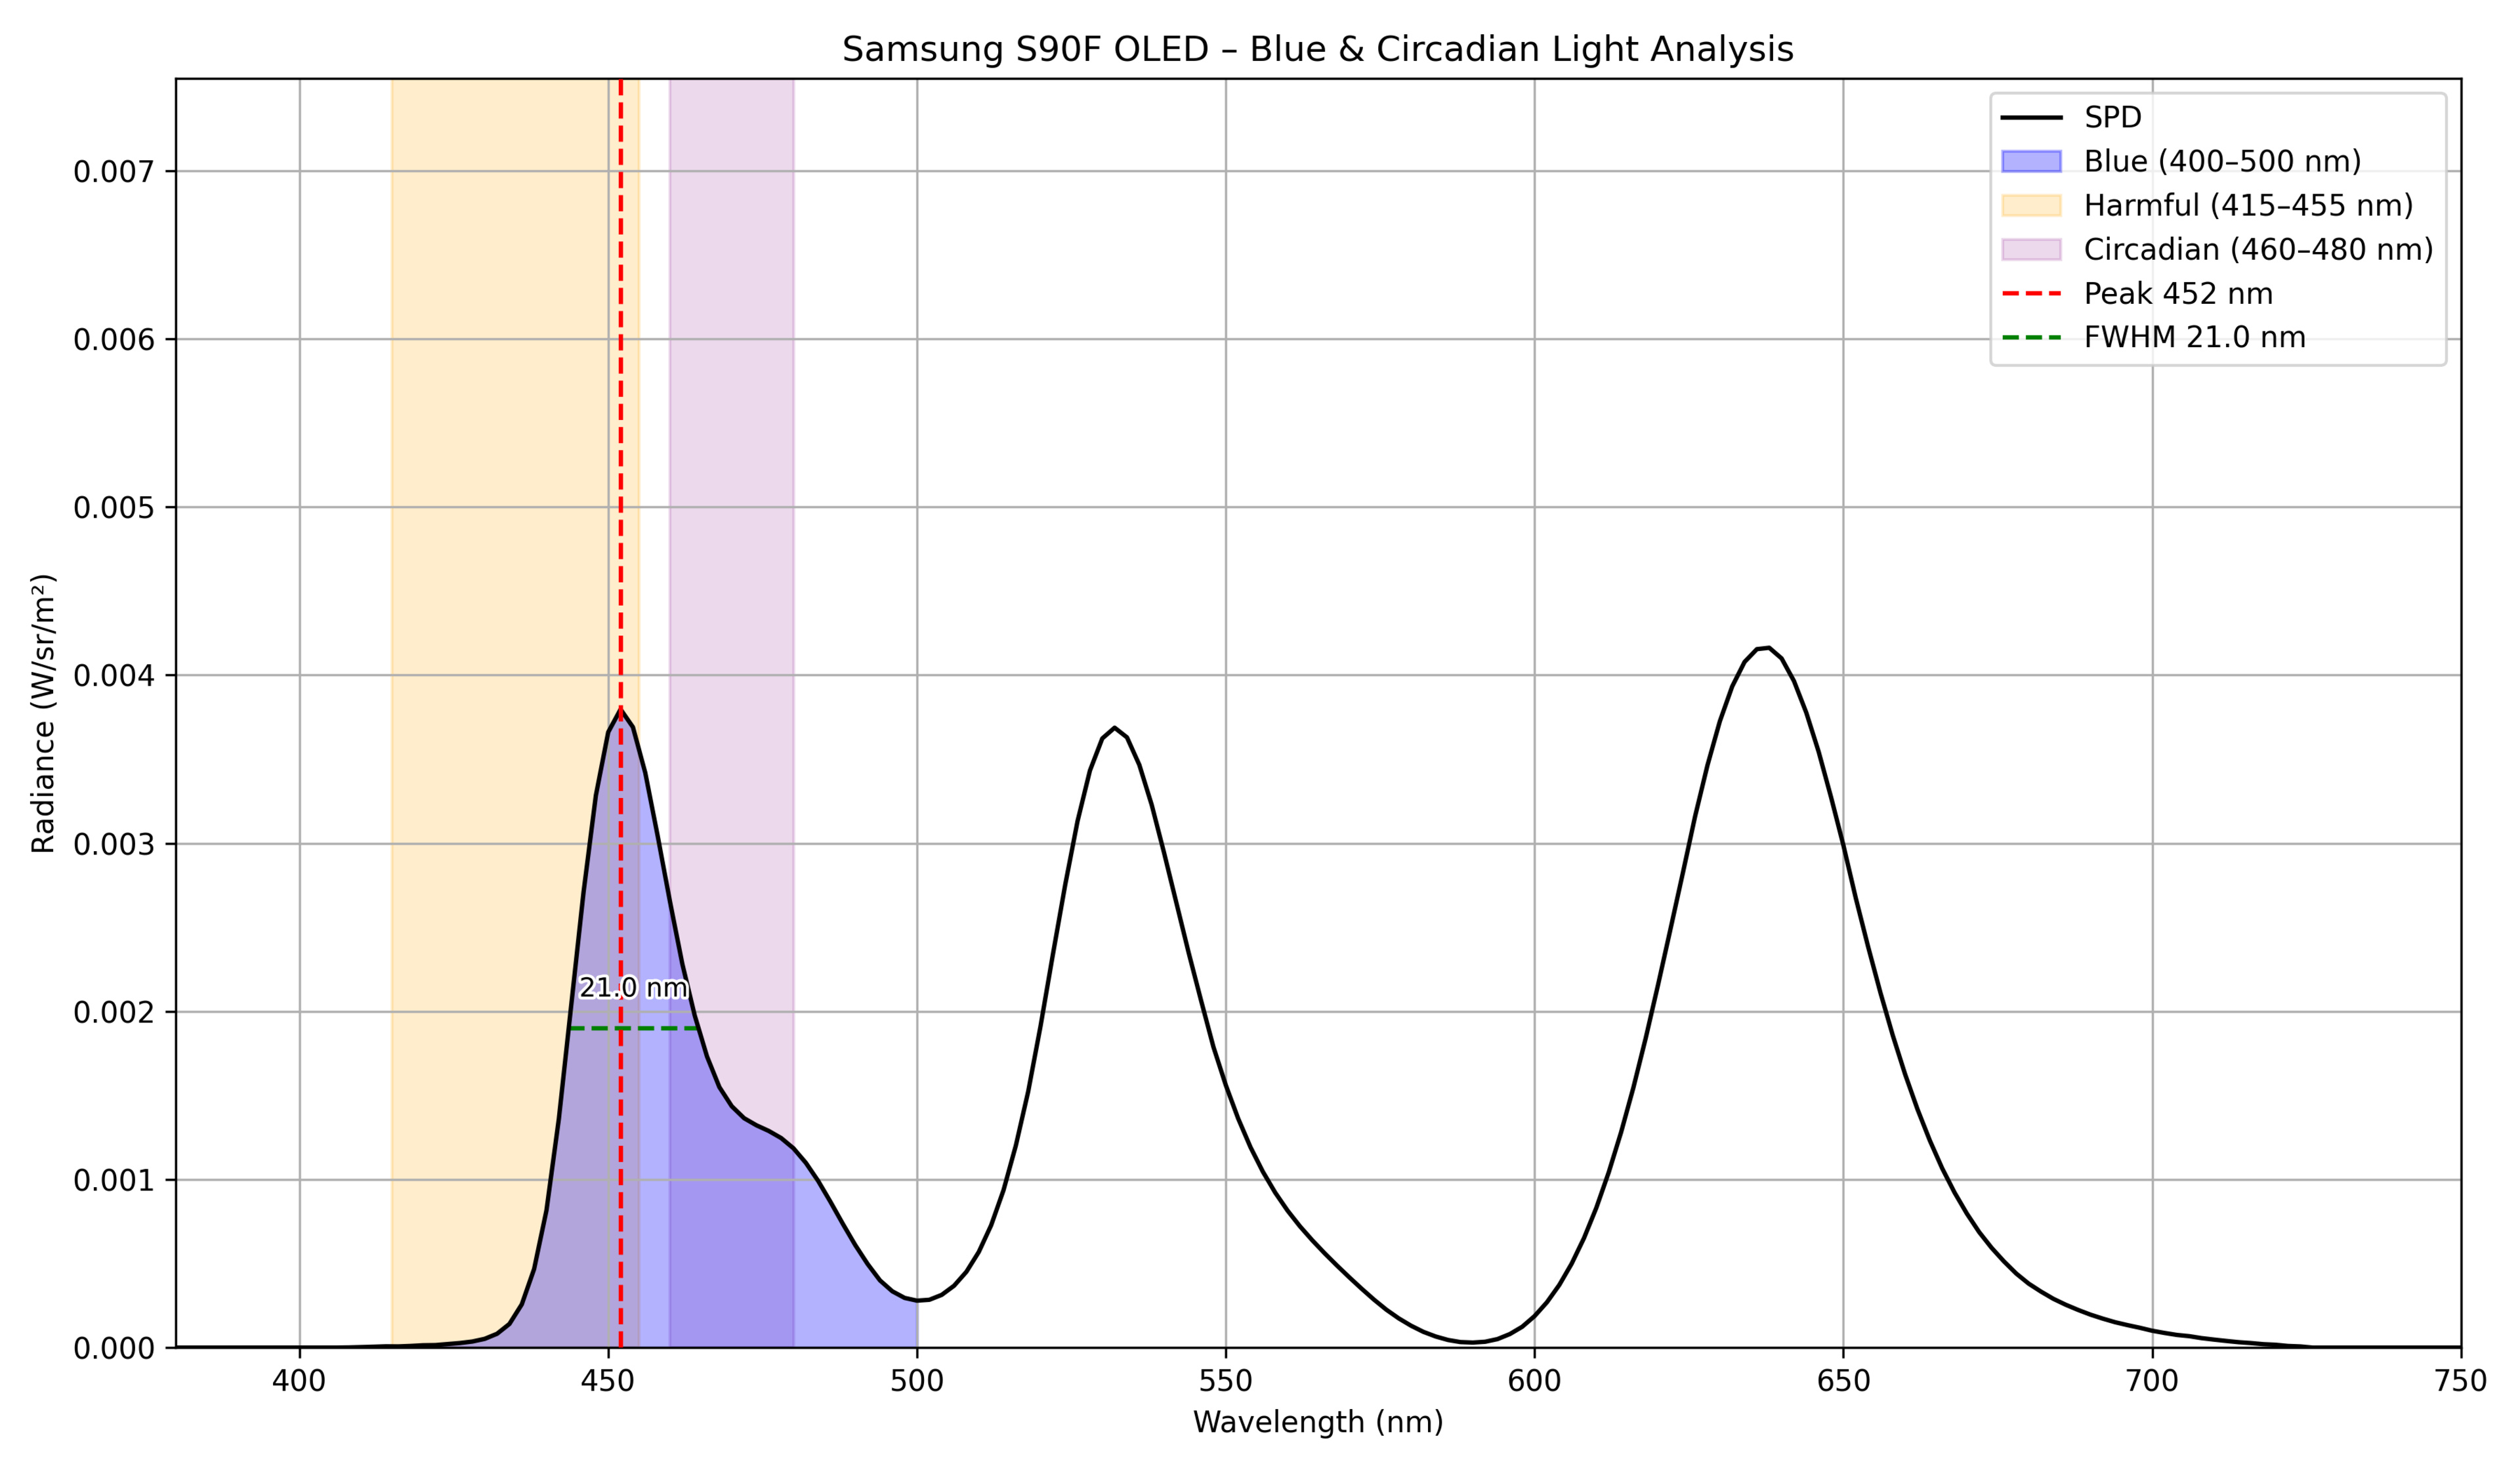 |
QD-OLED | 452 | 21 | 38.95 | 30.43 | 0.105934 |
| Samsung S95D OLED | 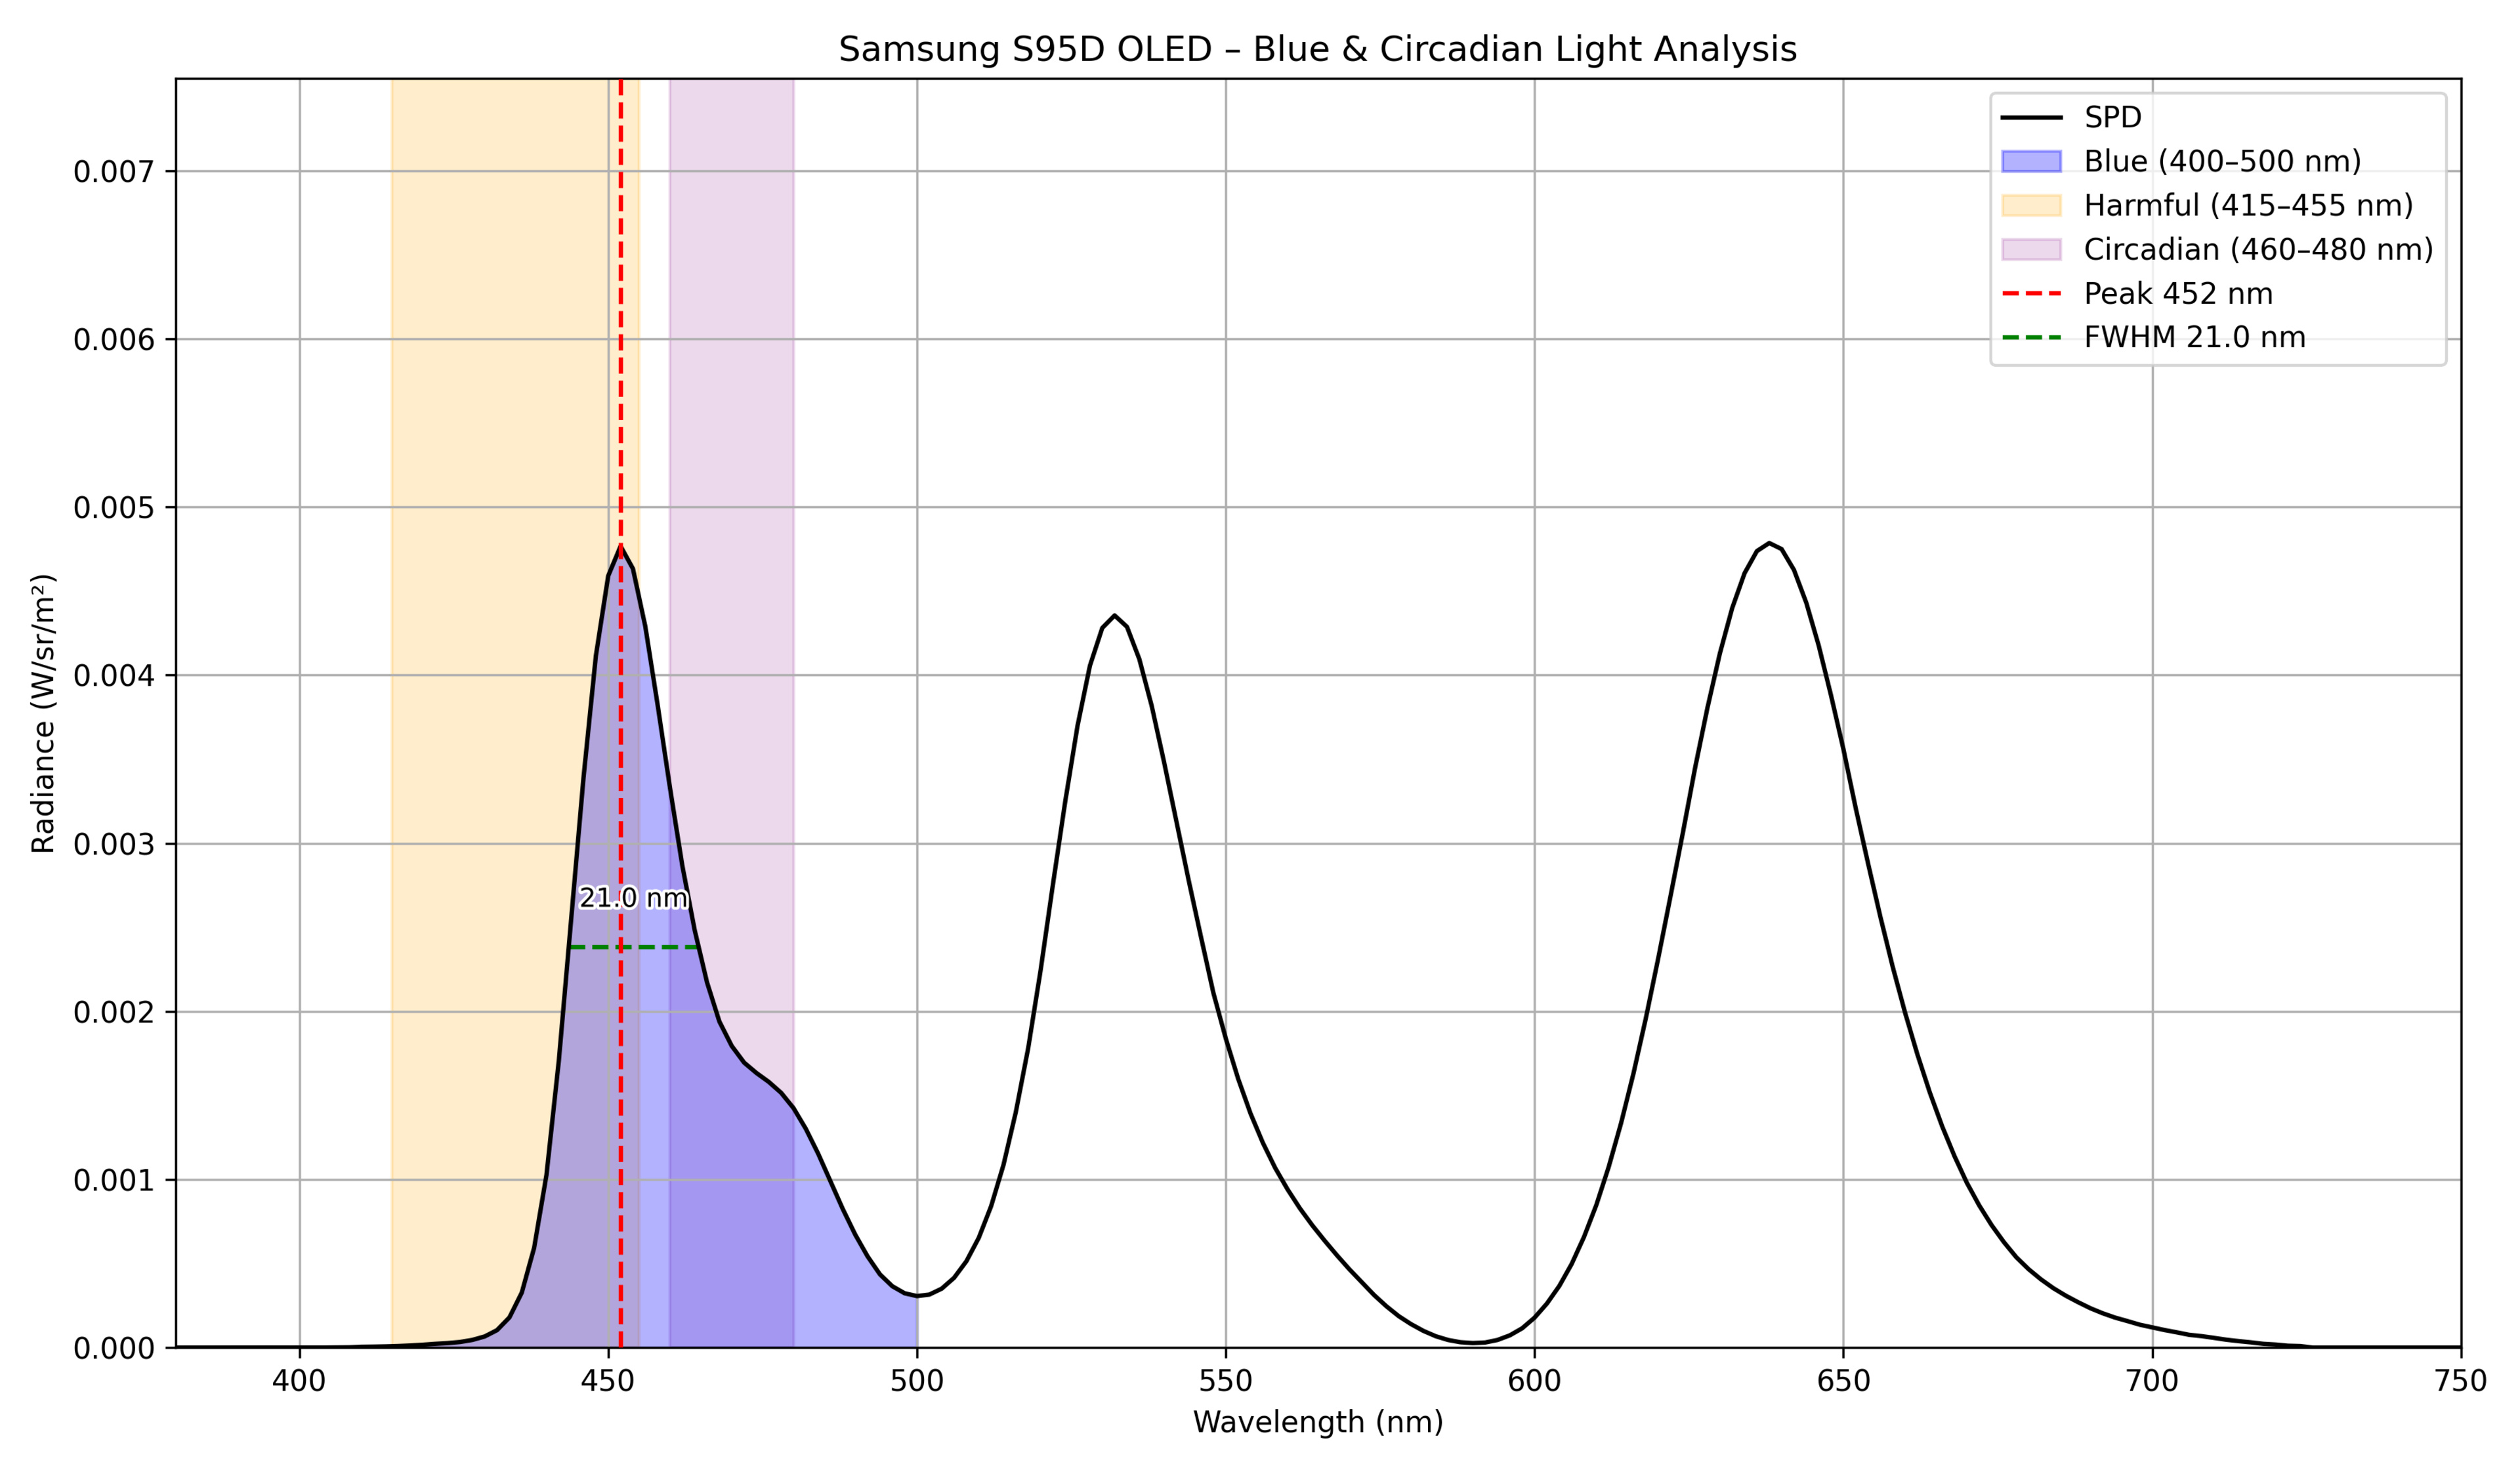 |
QD-OLED | 452 | 21 | 39.51 | 30.6 | 0.131087 |
| Samsung S95F OLED | 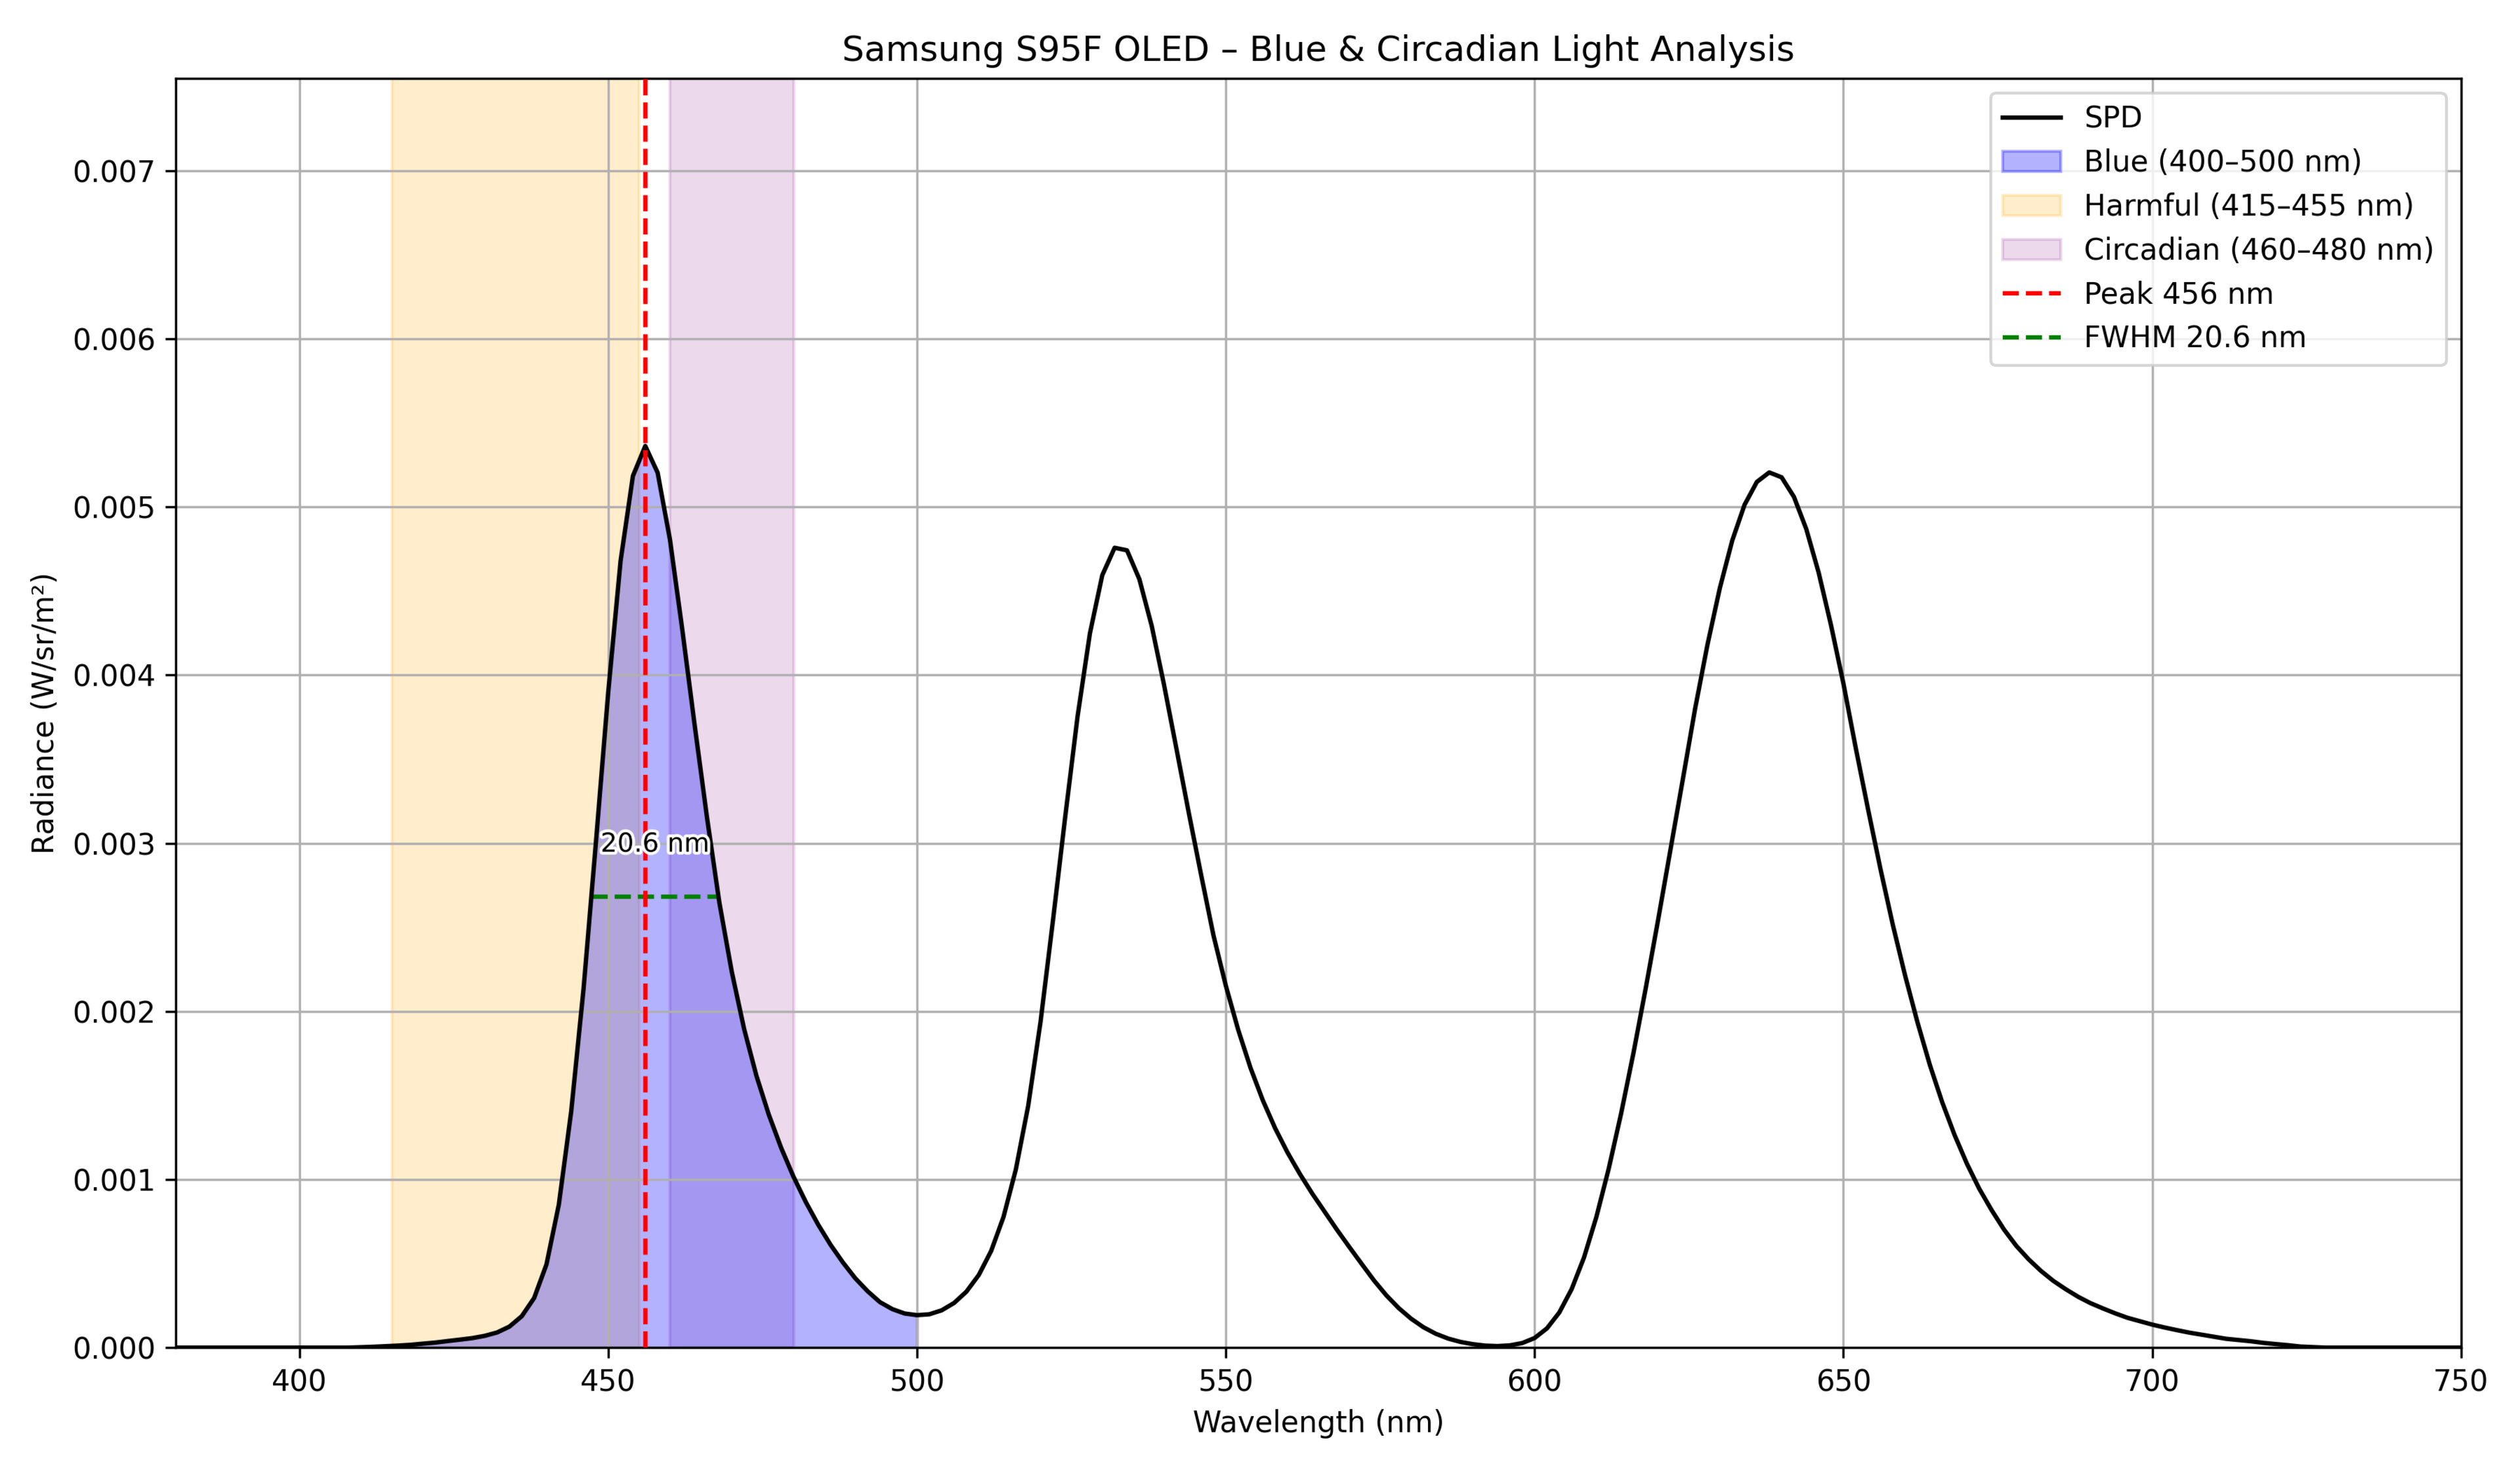 |
QD-OLED | 456 | 20.6 | 30.65 | 38.23 | 0.130799 |
| Sony A95L OLED |  |
QD-OLED | 452 | 21.2 | 39.11 | 30.9 | 0.120001 |
| Sony BRAVIA 8 II OLED |  |
QD-OLED | 456 | 20.3 | 30.6 | 38.19 | 0.108204 |
| Sony BRAVIA 8 OLED | 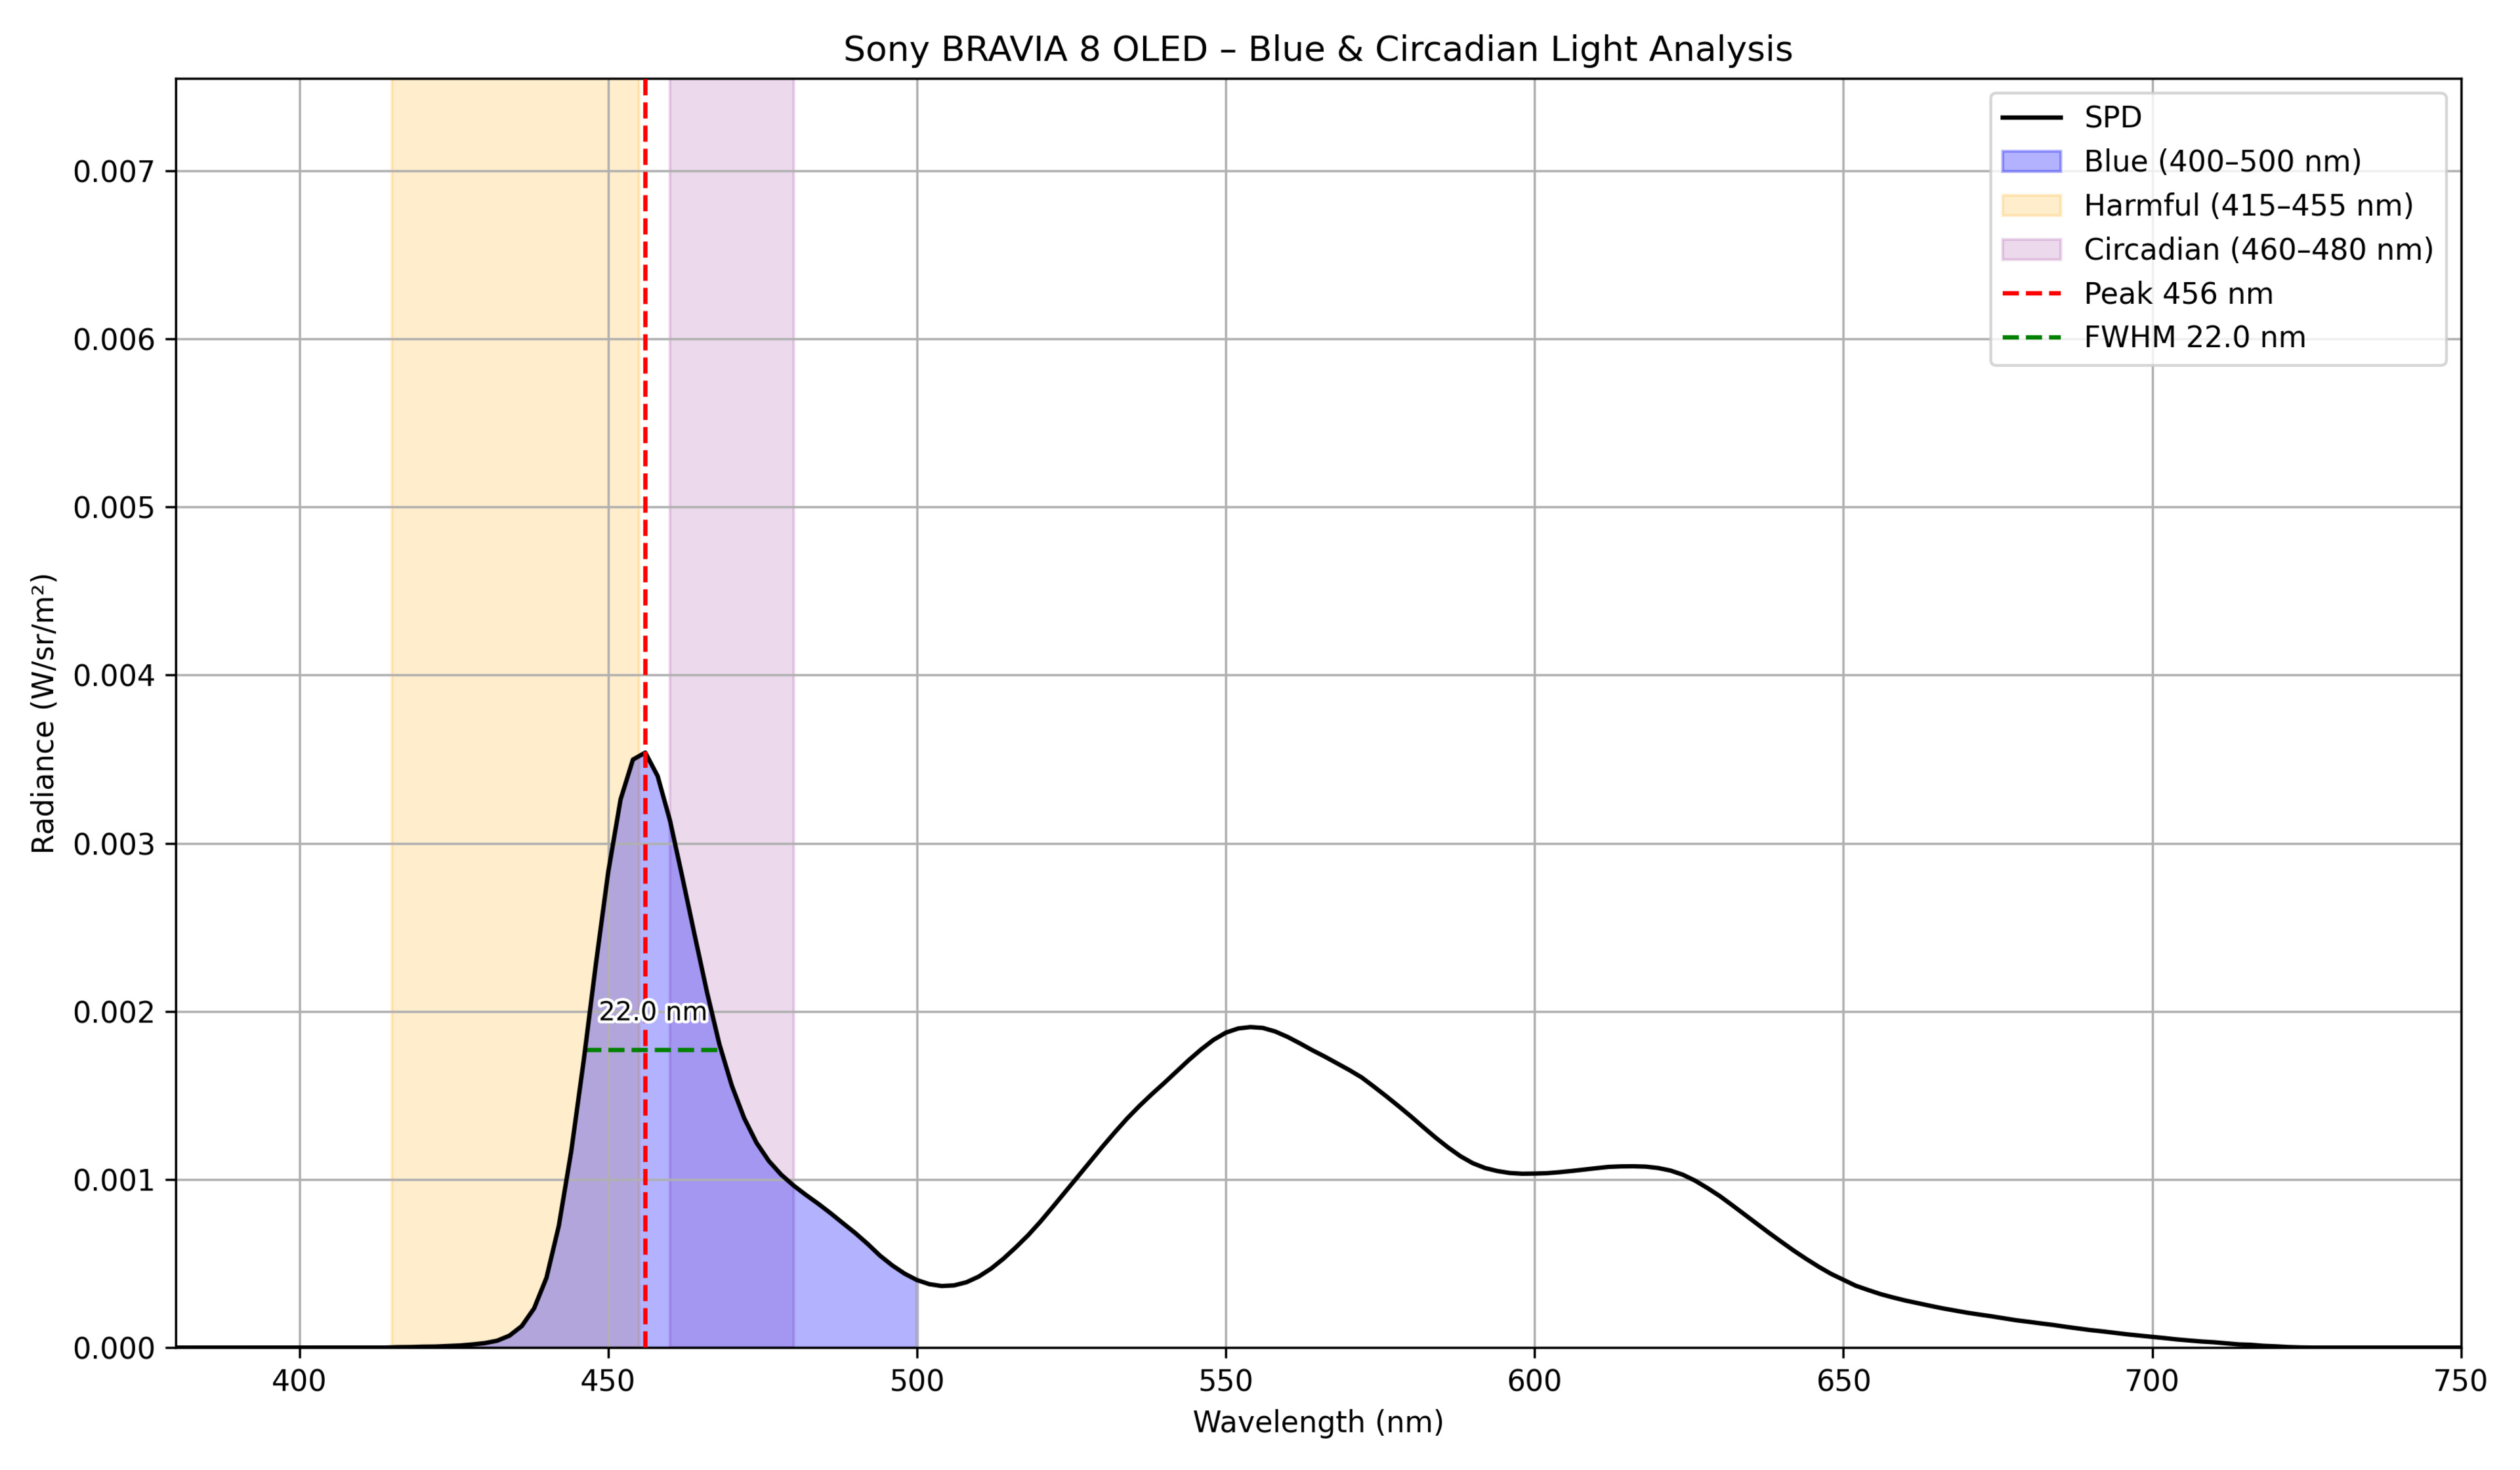 |
WOLED | 456 | 22 | 29.84 | 35.57 | 0.098413 |
Conclusion
Whether we like it or not, blue light is a necessary component of any TV backlight, and we can't eliminate it completely. Different TVs produce different amounts of blue light, though, and not all of it falls within the range that might be harmful to your eyes. LED TVs emit the most blue light within the harmful range, but they also emit the least amount of light in the circadian rhythm range. OLEDs, on the other hand, emit significantly less blue light in the harmful range, but they might have a greater impact on sleep cycles. If you're shopping for a new bedroom TV, it seems like LED TVs might be the best choice, but OLED is the safer choice for extended, general-use viewing.
Color Accuracy
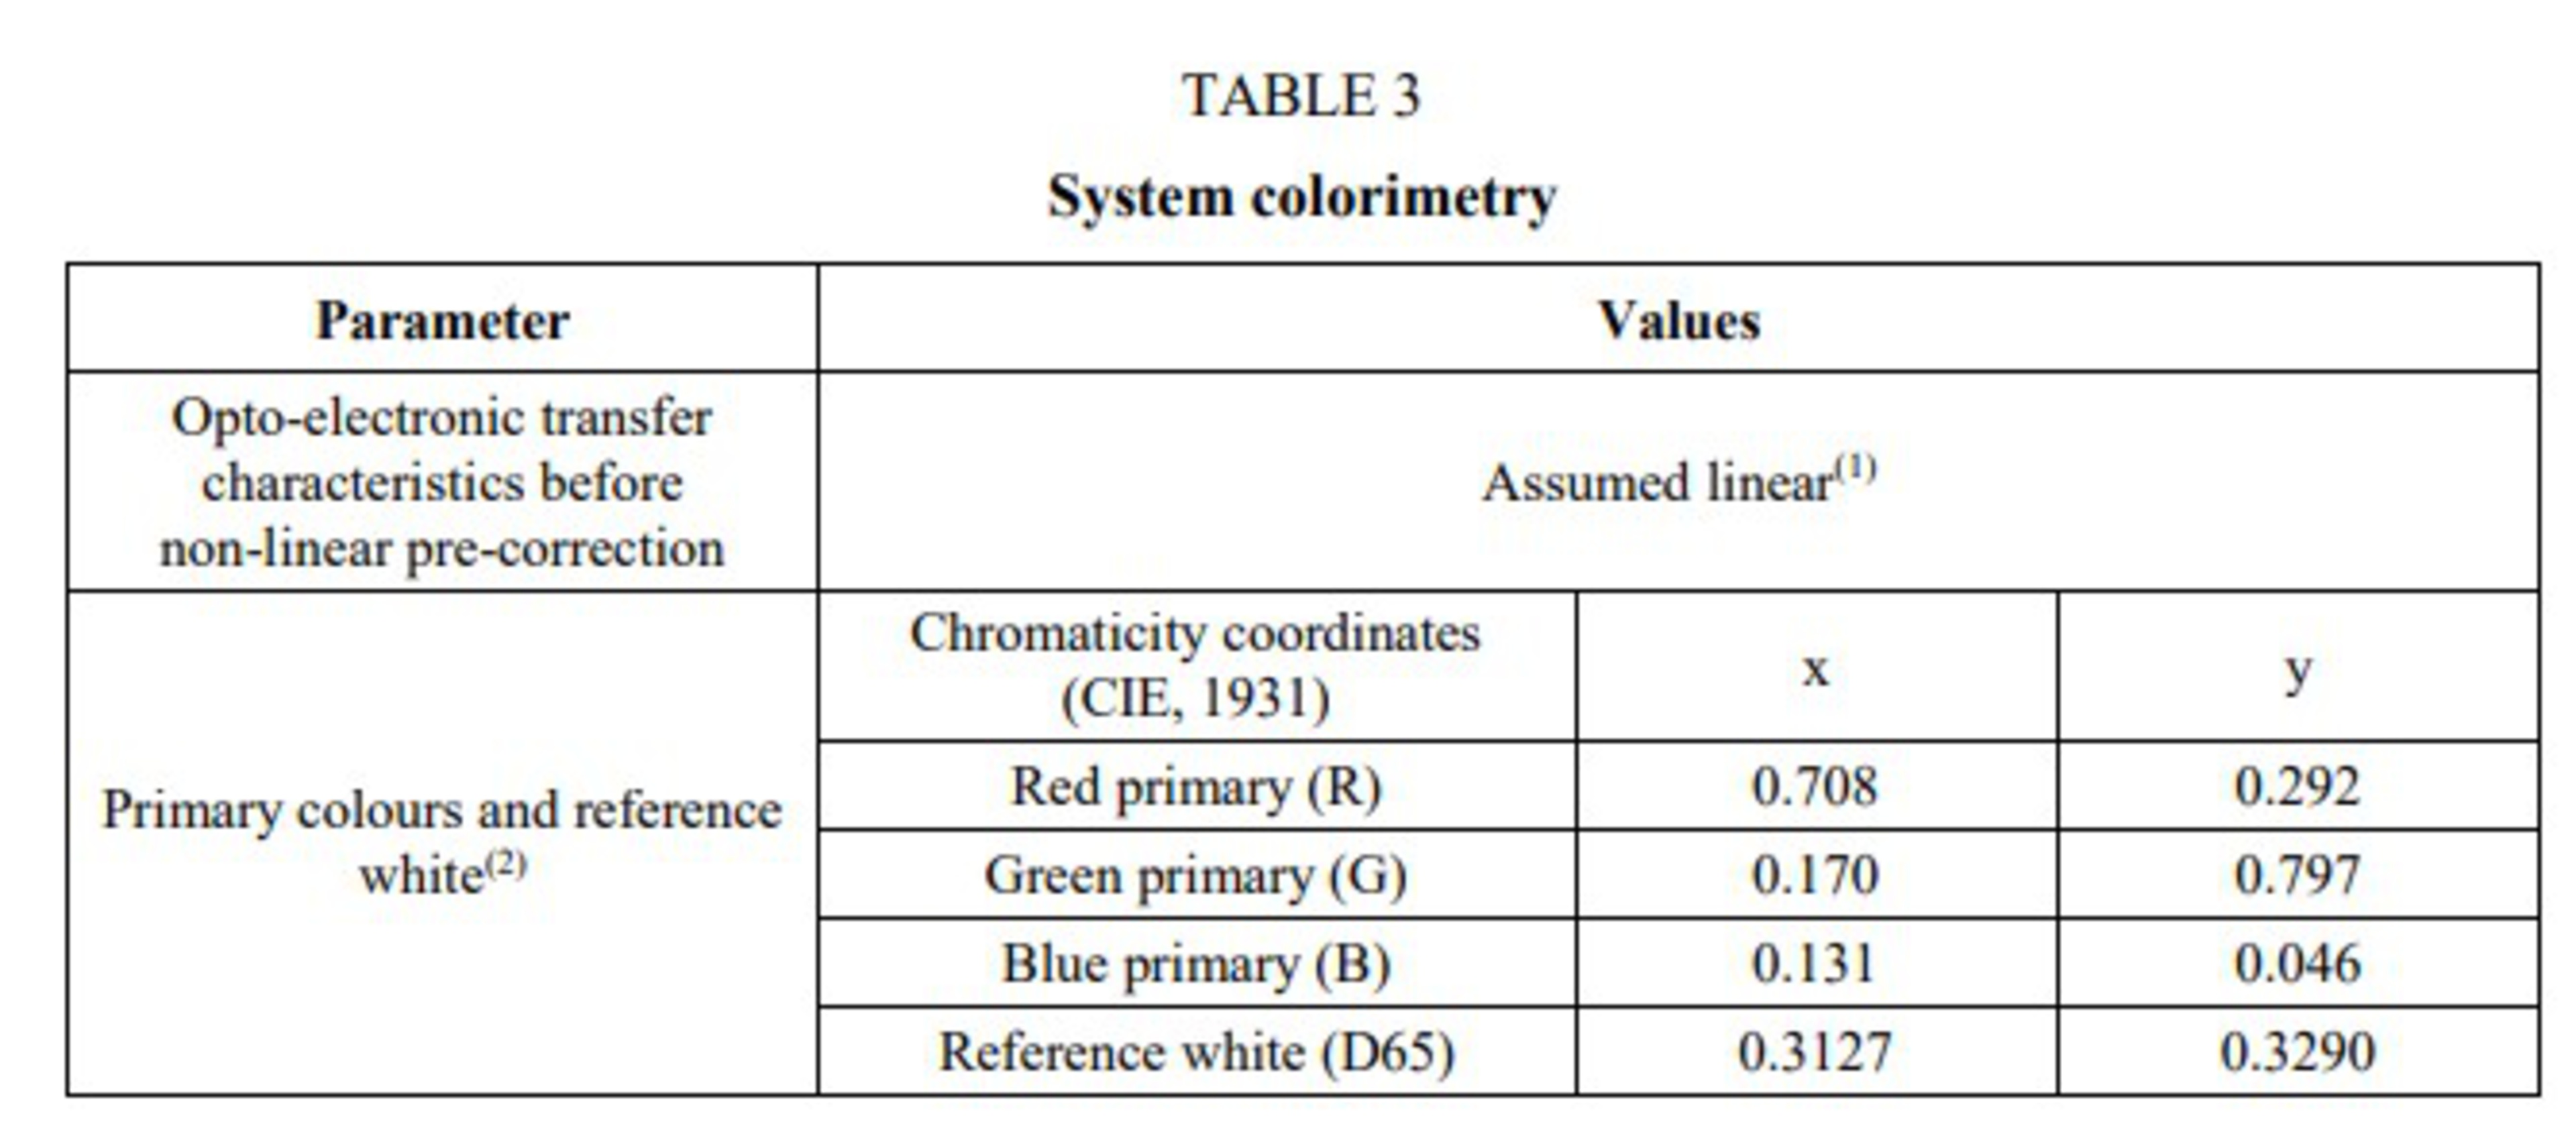
Pure blue is defined by the ITU-R by its chromaticity coordinates in the CIE 1931 x'y' color space. This coordinate corresponds to a wavelength of 467nm. This is both good and bad news if you care about blue light and its impacts. To achieve full BT.2020, this means you need a laser-sharp peak centered at 467nm, which is well above the most harmful blue light zone. The problem is that the materials used by the vast majority of TV panel manufacturers can't deliver the combination of brightness, wavelength, and, more importantly, lifespan that modern consumers need from their TVs.
This is starting to change, though. New research in material sciences has found ways to improve the wavelength of blue emitters, and some of this is starting to trickle down to consumer electronics. At CES 2026, the Hisense 116UXS was shown off for the first time. This innovative TV adds a cyan subpixel, shifting the wavelength of blue light emitted by the TV much closer to the ideal 467nm. Hisense hasn't shared any measurements or spectral data, but one of Hisense' stated goals with this product is to reduce the amount of harmful blue light emitted by the TV. They might be on to something with this approach, and it may actually work to reduce harmful blue light without negatively impacting color accuracy.
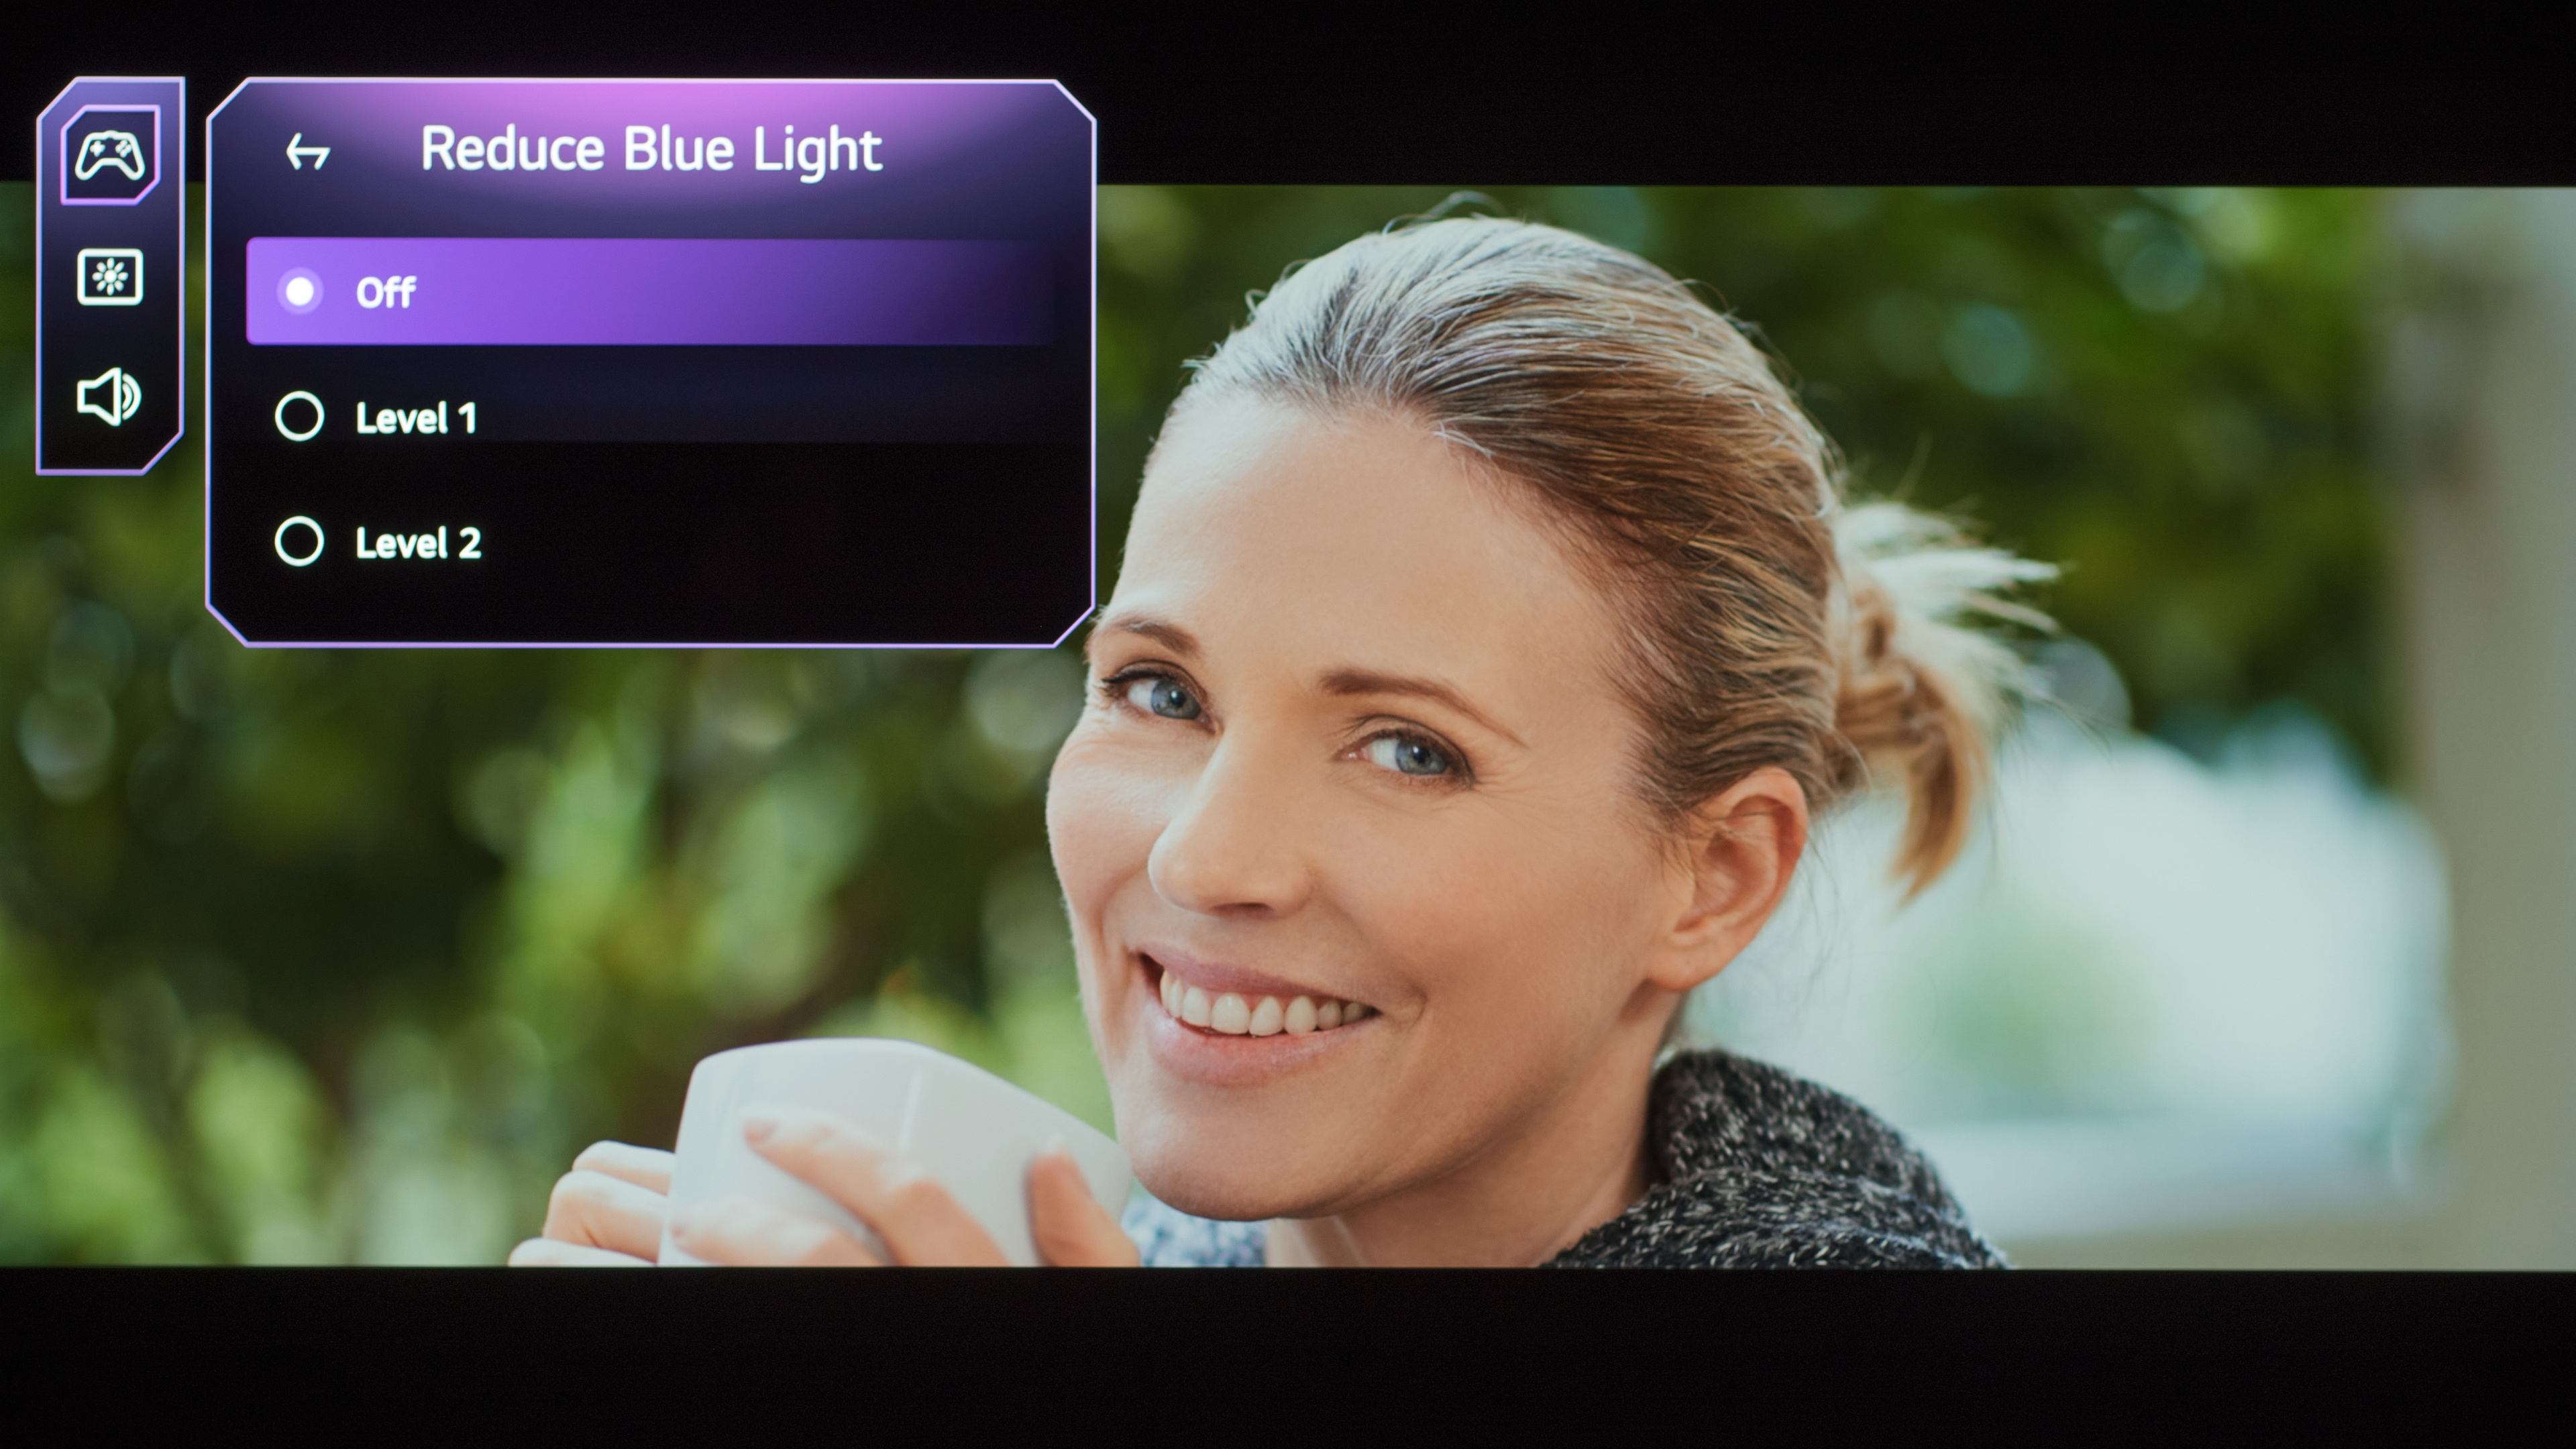
Reducing Blue Light On Your TV
| Brand | Setting Name |
|---|---|
| Hisense | Low Blue Light |
| LG | Reduce Blue Light, Eye Care Mode |
| Samsung | EyeComfort Mode, Blue Light Reduction |
| Sony | No dedicated mode |
| TCL | Eye Health Protection |
So now that we've shown that all TVs emit some harmful blue light, what can you actually do about it? Almost all TVs on the market offer a "Night Mode" or "Reduce Blue Light" setting. These features are designed to reduce the amount of blue light emitted by the TV. This comes at a cost, though, as this forces the TV into a warmer color temperature, so you'll see a less accurate image. We looked into these blue light filters on monitors and found them to be very effective at reducing blue light emitted from displays, and we expect this feature on TVs to be just as effective.