We’ve bought and tested more than 380 TVs over the past nine years with our goal of helping you find the best one for your needs. We keep the TVs in our lab until they’re no longer popular, comparing and retesting them with major firmware updates and newer test methodologies. It keeps our reviews in the best state for when you buy a TV.
Despite all this, there’s a huge hole in our reviews—a fundamental flaw we haven’t been able to fix. Today we’re changing that with the biggest test we’ve ever done. And the goal of it is to answer what seems like a simple question—how long can I expect my new TV to last?
To try to answer this question, we've decided to run 100 TVs that we still have in the lab from the last 2-3 years through a grueling 2-year accelerated longevity test to see how long they last. Each TV will run for either 20 or 15.5 hours per day, for a total of 126 hours per week, turning off eight times a day to simulate normal use. Every two months, we'll take uniformity and brightness measurements to see how they age over time and to look for any uniformity issues or change in brightness over time. We'll post updates to this page and our YouTube R&D channel, keeping you updated every step of the way.
Goal
The main goal of the longevity test is to get a better understanding of how long modern TVs should last. To do so, we're running an accelerated test with 100 TVs over the next two years. We're looking for any issues with the TVs as they age, including whether or not brightness decreases over time, uniformity issues (burn-in), or any outright component failures. As this test deals with a very small sample size of each model (one unit of each model), the goal of this test is limited to wider trends; we can't draw any conclusions on the reliability of specific models or even specific brands. We want to know how long a TV should last, and we want to push the TVs to failure, so we can perform a tear-down to determine the cause of failure and better understand which components on a TV are most likely to fail.
Burn-In
Although it's not one of the primary goals of this test, we're hoping to better understand how newer OLED panels compare to the older generation of OLEDs. It's generally accepted that burn-in isn't as much of an issue as it used to be, but it's unclear just how much better the newer OLED TVs are. With new panels, new heatsinks, and even brand-new panel types like QD-OLED, there are a lot of unknowns.
We've already explored what types of content are most likely to cause burn-in in our real-life burn-in test, which only used LG C7 OLEDs, but only one of those TVs was at the max brightness. This time there will be multiple models of OLED TVs, all displaying the same content, and all of them will be at max brightness.
Given the intensity of this test, it's highly likely that these OLED TVs will still experience burn-in, but we're looking to see how the different OLED technologies compare and how they compare to the old C7s. Do heat sinks reduce the likelihood of experiencing burn-in? What about QD-OLEDs like the Samsung S95B OLED and the Sony A95K OLED? The goal here isn't to determine which content is most likely to burn in; instead, we're looking to see how these different technologies compare given the same content and the same test conditions.
Component failures
Aside from burn-in, TVs are also prone to failure for many other reasons, and this can occur with any TV, whether it's an OLED, QD-OLED, or LCD with an LED backlight. This test will simulate multiple on/off cycles per day to test that circuitry. Heat impacts the components in any TV, so we're also looking for failures from things such as blown capacitors or other failed components. We're also looking for any change in brightness, as even non-organic LEDs have a limited lifespan, and their brightness is likely to decrease over time. We're hoping to better understand how these components fail and to look for any trends across brands or across specific panel types.
Our Tests
Test Setup
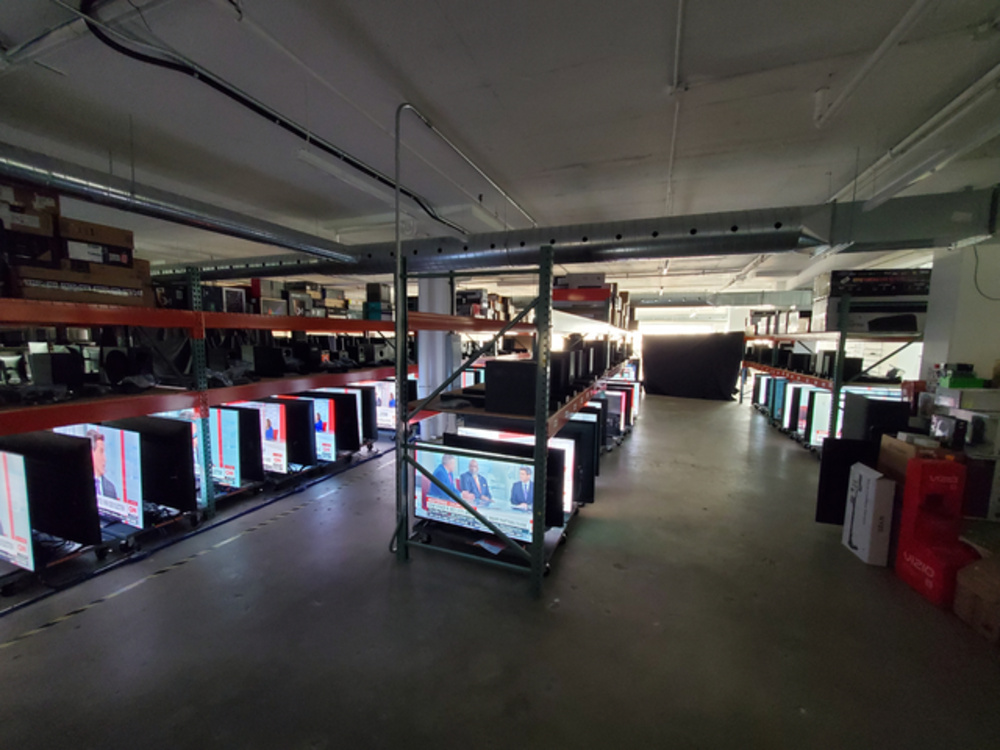
For this test, we've used our existing inventory shelving to set up all 100 TVs. A new electrical subpanel and surge protection system was installed to ensure each TV is powered properly and properly protected. Each TV is connected to a Yodeck media player via HDMI, and each streamer is connected via ethernet to a central server. It allows us to control the content being displayed on all 100 televisions at once. The Yodeck streamers also support HDMI-CEC, allowing us to remotely control the TVs, turning them on and off according to a fixed schedule. All 100 TVs are displaying the exact same content: a live stream of the U.S. version of CNN, untouched, with all commercials and breaks intact.
TV Settings
For the duration of this test, each TV will be set up according to our recommended pre-calibration settings for that model, but with the brightness at max. We'll also spot-check these settings to ensure that nothing changes over time due to a firmware update or other bug that could cause the settings to change. For the OLED TVs in this test, we'll enable all panel-saving features, including pixel shift features and additional burn-in prevention mechanisms, like LG's logo luminance adjustment feature.
All TVs are on the latest firmware available at the start of the test, but their Wi-Fi connection is disabled for the duration of the test so that they don't receive any unattended firmware updates. If any significant firmware updates come out during our test, we'll still retest these TVs; however, we'll take additional measurements before and after applying the firmware update to track any changes to the peak brightness due to the firmware update.
Schedule
Update 11/18/2022: After we launched our two-year longevity test, a few users were quick to point out a major flaw in our schedule. It didn't allow Sony OLED TVs to run their compensation cycles, as Sony TVs only start this process after the TV has been off for four hours. We've adjusted our schedule to make sure this process has time to complete.
Each TV is on for a total of 20 hours per day on Tuesday, Thursday, Saturday, and Sunday, and they cycle on and off multiple times per day. On Monday, Wednesday, and Friday, they're on for a total of 15.5 hours, to allow time for all OLED TVs to run their panel compensation cycles. We power cycle them because we want to also simulate repeatedly power-cycling the display to wear down those components and see how they age over time. We also want to give the TVs time to cool down between runs to simulate a heat cycle on the internal components.
During this time, the TVs are on standby but still receiving power. It's especially important for OLED TVs, which have an automatic compensation cycle that runs after several hours of usage. Our schedule is designed to ensure that those compensation cycles have enough time to run properly.
Tuesday, Thursday, Saturday, Sunday | ||
|---|---|---|
Time (24 h) |
TV power status |
Cycle length (h) |
| 00:00 | ON | 1.0 |
| 01:00 | OFF | 0.5 |
| 01:30 | ON | 1.5 |
| 03:00 | OFF | 0.5 |
| 03:30 | ON | 1.5 |
| 05:00 | OFF | 0.5 |
| 05:30 | ON | 1.5 |
| 07:00 | OFF | 0.5 |
| 07:30 | ON | 9.5 |
| 17:00 | OFF | 0.5 |
| 17:30 | ON | 1.5 |
| 19:00 | OFF | 0.5 |
| 19:30 | ON | 1.5 |
| 21:00 | OFF | 0.5 |
| 21:30 | ON | 1.5 |
| 23:00 | OFF | 0.5 |
| 23:30 | ON | 0.5 |
Monday, Wednesday, Friday | ||
|---|---|---|
Time (24 h) |
TV power status |
Cycle length (h) |
| 00:00 | ON | 1.0 |
| 01:00 | OFF | 0.5 |
| 01:30 | ON | 1.5 |
| 03:00 | OFF | 0.5 |
| 03:30 | ON | 1.5 |
| 05:00 | OFF | 0.5 |
| 05:30 | ON | 1.5 |
| 07:00 | OFF | 5 |
| 12:00 | ON | 5 |
| 17:00 | OFF | 0.5 |
| 17:30 | ON | 1.5 |
| 19:00 | OFF | 0.5 |
| 19:30 | ON | 1.5 |
| 21:00 | OFF | 0.5 |
| 21:30 | ON | 1.5 |
| 23:00 | OFF | 0.5 |
| 23:30 | ON | 0.5 |
Startup Phase
We started the test with a soft launch involving all 100 TVs on October 21st, 2022. The initial soft launch phase ran until November 4th, when we shut them down temporarily. The goal of the soft launch was to make sure that everything was working properly and that all of the TVs were running as planned with the programmed schedule. After the soft launch, a few changes were made to our test setup, so a new set of uniformity photos were taken for most of the TVs. The full test started on November 16th, 2022, and will run for approximately two full years until the end of 2024.
During the startup phase, the Sony A80J, A80K, A8H, A90J, A90K, and A95K, as well as the Vizio OLED 2020, developed severe image retention after only two weeks on the test. We ran the compensation cycles on affected TVs and tried different methods to remove the image retention, including running a few videos designed to remove it. We were eventually able to remove most of the image retention. The LG OLED TVs also showed signs of image retention when we stopped the test, but it cleared very quickly, and no additional action was required. A few users were quick to point out that this was due to a flaw with our original schedule; it didn't allow time for the Sony TVs to run their compensation cycles. We've adjusted our schedule to make sure this cycle has time to run.
Test Results
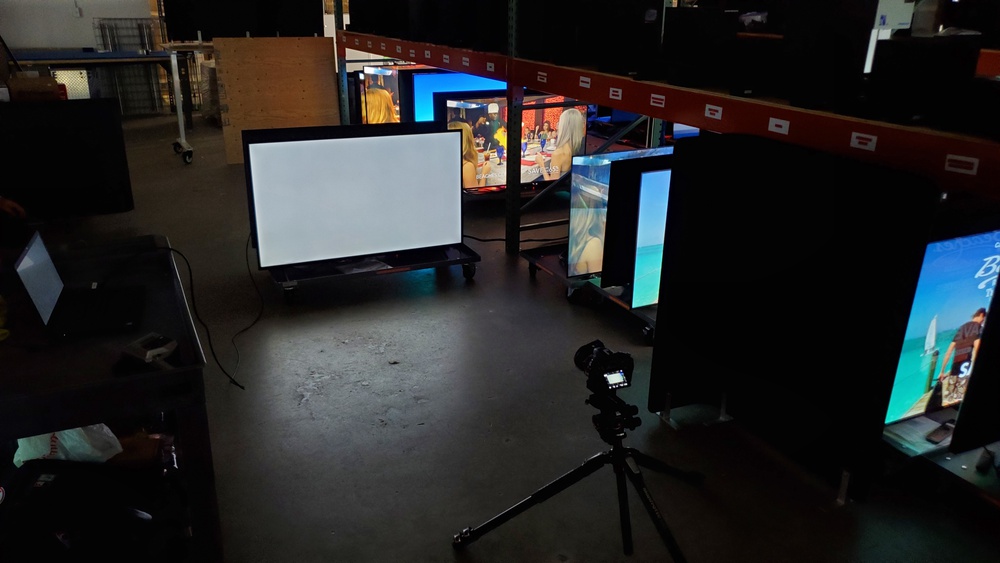
Every two months, we'll take uniformity and brightness measurements on each TV. We take a series of uniformity photos (50% gray, 100% red, green, blue, cyan, magenta, and yellow) and measure the peak brightness in SDR with a 10% slide and a 100% slide.
The uniformity pictures are then processed and added to the review, and a graph is updated showing the brightness at 10% and 100% over time. All 100 TVs are retested at the same time, ensuring that the results on the website are always comparable. Due to the occasional need for additional testing, the results won't necessarily always be updated at the same time.
To see the results of each TV over time, look at the Accelerated Longevity Test section of each review. From there, you can choose the month and color of the slide you want to see. The graph below shows the brightness of the TV with a 10% and 100% window over time, starting at the very beginning. This graph is always updated with the latest data.
We've created a new page to make it easier to see our latest results. The latest slides and brightness graphs over time will always be available in each individual review and on this new page. If you want to stay informed about the latest events in this test, consider signing up for our new mailing list as well.
TV Failures
If a TV fails completely during our testing, we'll remove it from the test, and a post-mortem will be done to attempt to determine the root cause of the failure. We'll dismantle the TV and look for failed components, from power supplies to board failures to blown capacitors; we want to know exactly what caused the TV to fail, although it won't always be possible to determine the exact cause.
TV List
This is the full list of TVs we'll be testing over the next two years. Note that this is a closed test; as we buy new TVs to review, we don't plan on adding them to the longevity test. The only exception to this is if something truly new and groundbreaking comes out. We might make an exception then and add it to the test, but the results for that TV wouldn't be comparable to the rest of the test.
Limitations
There are a few limitations of this test, and we need to be careful about which conclusions we're drawing. The goal of this test is to better understand the reliability of TVs in general and which components are the most likely to fail. With such a small sample size, we can't answer questions about the quality or reliability of a specific model. Even if a certain TV breaks in our tests, that doesn't mean that that'll be your experience with that TV. Conversely, even if a TV doesn't break in our test, it doesn't mean that yours won't. It's also important to remember that this test is meant to be an accelerated torture test; it doesn't represent normal daily usage, so even if a certain type of TV breaks after a year, that represents many years of normal usage. Depending on the outcome of this test, we might be able to have a better understanding of the reliability of specific brands, but it's unlikely, and this isn't one of our goals.
This test is also unlikely to catch early failures. Since all of the TVs on this test have gone through our review process, at the very least, they already have dozens, if not hundreds of hours of use. It means we don't have any data on which brands are more likely to produce "lemons", or TVs that fail during the initial return period, as we would have already returned or exchanged those units. Since our TVs also have to travel a much longer distance than most TV buyers before they reach us, early failures due to shipping damage are more common for us, so our internal data on that isn't relevant to most buyers.
Conclusion
TVs are among the most reliable consumer electronics on the market. Whereas most people change their phones or tablets every two to three years, it's common for people to hold on to their TVs for 5-10 years or more. But how reliable are TVs in general? What about burn-in; is it still an issue? We're hoping to be able to answer these questions and more over the next few years as we run these 100 TVs through our accelerated longevity test.