See the previous 1.4 changelog.
What's Changed?
With this update, we're introducing new tests to evaluate a mouse's Main Button. These tests provide in-depth actuation data and information about a mouse's main switches. We've also adjusted how we evaluate the Work usage score.
| Test Group | Description |
| Main Button |
|
| Scoring Changes |
|
On this page, we'll look at these new changes and how they can help you find the right mouse for your needs. If you want to know more about our research and development process with this update—including investigations into actuation abnormalities, mouse construction, debounce, and more. Check out our R&D article.
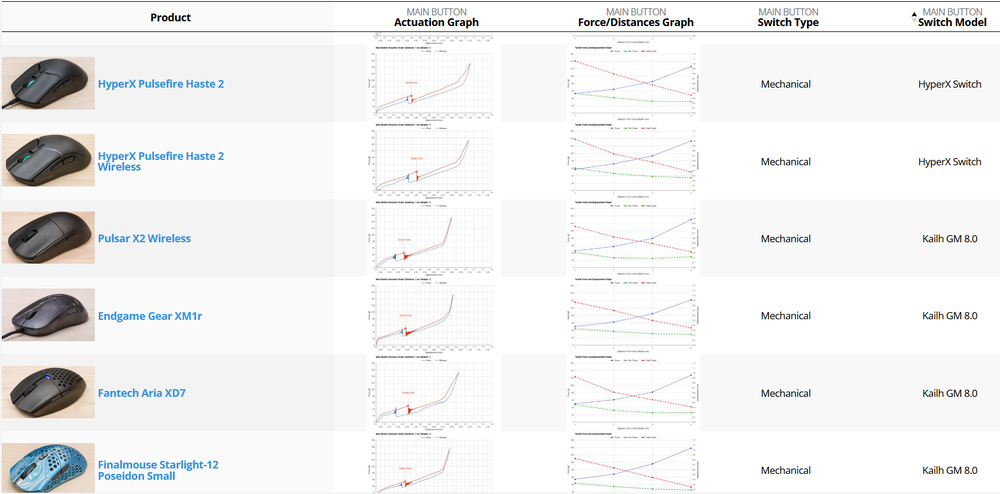
Main Button
This is what the new Main Button test group looks like in one of our reviews.

This new box comprises four individual elements:
- Main Button Actuation Graph
- Tactile Force and Displacement Graph
- Switch Type
- Switch Model
We'll examine each element individually below.
Main Button Actuation Graph
Put simply, this graph shows you how a mouse's main button feels. It shows how much force is required to activate the main mouse button. The tactile point (which is the point just before a button actuates) is indicated on the graph. This graph is generated by pressing the main mouse button 1 cm from the front. We'll touch on this idea more with our next test, the Tactile Force Displacement Graph.

Tactile Force Displacement Graph
This second graph shows tactile force and button displacement information tested at different distances from the front of the main button. While the Actuation Graph above shows actuation data when pressing the mouse button 1 cm from the front of the button, the Tactile Force Displacement Graph below shows data when the button is pressed at four separate locations: 1 cm, 2 cm, 3 cm, and 4 cm from the front of the button. This information is important because, depending on the size of your hand and your preferred grip type, you'll click a mouse button at different places on different mice—which impacts how the button feels.

Switch Type
This test identifies the switch technology used to activate the main button. Generally, most mice use either Mechanical or Optical switches. Some people prefer the satisfying tactile feeling of more traditional mechanical switches, while optical switches typically offer better long-term durability and some potential performance benefits since they don't require traditional debouncing. Ultimately, the best switch type depends on your preferences and what you need from your mouse.
Switch Model
This test identifies the switch model used for a mouse's main buttons. This information can be useful if there's a particular brand, switch model family, or even individual switch model you like or would like to learn more about. Like with switch types, finding the best switch model depends on your individual preferences. Also, it's important to note that even though two different mice may use the same switch, many other factors can make the click experience feel quite different. Once more, we investigate this idea more deeply in the full R&D article that you can check out here.
Note that you can include all of the new tests introduced with this update when creating a custom table using our custom table tool. We've created a sample table with our new tests below, But you can experiment with this tool and add the most important tests to you.
Scoring Changes - Work Usage
With this update, we've adjusted how the Work usage score is calculated. We've added Wireless Versatility to the list of elements we consider when calculating our scores because it's an important feature many people look for when choosing a mouse for work.
We've also slightly reduced the overall weight assigned to Build Quality, Scroll Wheel, and Thumb Wheel scores. Note that the "Scroll Wheel" and "Thumb Wheel" components are now named "Scroll Wheel Type" and "Thumb Wheel Type," respectively. We've changed the names of these components to hopefully clarify what they're evaluating.
Here's what the old scoring looked like:

In contrast, here's what the new scoring looks like:

Let Us Know What You Think!
Your feedback is instrumental in making improvements to our testing. If you have comments, questions, or suggestions about this or any future updates, reach out to us in the forums.
96 Mice Updated
We have retested popular models. The test results for the following models have been converted to the new testing methodology. However, the text might be inconsistent with the new results.
- Apple Magic Mouse 2
- ASUS ROG Harpe Ace Aim Lab Edition
- BenQ ZOWIE EC2-CW
- Cooler Master MM720
- Corsair DARK CORE RGB PRO
- Corsair DARKSTAR WIRELESS
- Corsair M65 RGB ULTRA WIRELESS
- Corsair NIGHTSABRE WIRELESS
- Corsair SABRE RGB PRO WIRELESS
- Corsair SCIMITAR ELITE WIRELESS
- Corsair SCIMITAR RGB ELITE
- Endgame Gear XM1r
- Endgame Gear XM2we
- Fantech Aria XD7
- Finalmouse Starlight Pro - TenZ Medium
- Finalmouse Starlight-12 Poseidon Small
- Finalmouse Starlight-12 Small
- GLORIOUS Model D Wireless
- GLORIOUS Model I
- GLORIOUS Model I 2 Wireless
- GLORIOUS Model O
- GLORIOUS Model O 2
- GLORIOUS Model O 2 Wireless
- GLORIOUS Model O PRO
- GLORIOUS Model O Wireless
- GLORIOUS Series One PRO
- HyperX Pulsefire Haste
- HyperX Pulsefire Haste 2
- HyperX Pulsefire Haste 2 Wireless
- HyperX Pulsefire Haste Wireless
- Keychron M1 Wireless
- Keychron M3
- Keychron M3 Mini
- LAMZU Atlantis
- Logitech ERGO M575
- Logitech G Pro Wireless
- Logitech G PRO X SUPERLIGHT
- Logitech G PRO X SUPERLIGHT 2
- Logitech G203 LIGHTSYNC
- Logitech G303 Shroud Edition
- Logitech G305 LIGHTSPEED
- Logitech G502 HERO
- Logitech G502 LIGHTSPEED
- Logitech G502 X
- Logitech G502 X PLUS
- Logitech G600 MMO Gaming
- Logitech G604 LIGHTSPEED
- Logitech G703 LIGHTSPEED with HERO Sensor
- Logitech G705
- Logitech G903 LIGHTSPEED
- Logitech Lift
- Logitech M240
- Logitech M510
- Logitech M720 Triathlon
- Logitech MX Anywhere 3
- Logitech MX Anywhere 3S
- Logitech MX ERGO
- Logitech MX Master
- Logitech MX Master 2S
- Logitech MX Master 3
- Logitech MX Master 3S
- Logitech MX Vertical
- Logitech Pebble M350
- Logitech Signature M650
- Microsoft Arc Mouse
- Ninjutso Sora
- Pulsar X2
- Pulsar Xlite V2
- Pwnage StormBreaker
- Razer Basilisk Ultimate
- Razer Basilisk V3
- Razer Basilisk V3 Pro
- Razer Basilisk V3 X HyperSpeed
- Razer Basilisk X Hyperspeed
- Razer Cobra
- Razer Cobra Pro
- Razer DeathAdder V2
- Razer DeathAdder V2 Pro
- Razer DeathAdder V3
- Razer DeathAdder V3 Pro
- Razer Naga Pro
- Razer Naga Trinity
- Razer Naga V2 HyperSpeed
- Razer Naga V2 Pro
- Razer Orochi V2
- Razer Pro Click Mini
- Razer Viper 8KHz
- Razer Viper Mini
- Razer Viper Mini Signature Edition
- Razer Viper Ultimate
- Razer Viper V2 Pro
- ROCCAT Kone Pro
- SteelSeries Aerox 5 Wireless
- SteelSeries Aerox 9 Wireless
- Vaxee XE
- Zaunkoenig M2K