See the previous 1.4 changelog.
Our 1.5.1 test bench update streamlines our testing methodology by removing less relevant or redundant elements. We've simplified several test groups, with Sensor Latency being the most notable, to improve clarity and consistency. We've also removed supporting video elements that either caused confusion or didn't add meaningful value.
What's Changed?
| Test Group | Changes |
|---|---|
| Sensor Latency |
Removed CPI Setting graph New measurements exclusively at 3200 CPI Removed the video element |
| Click Latency | Removed the video element |
| CPI | Removed the video element |
| Cable |
Removed the test group's score Removed the video element |
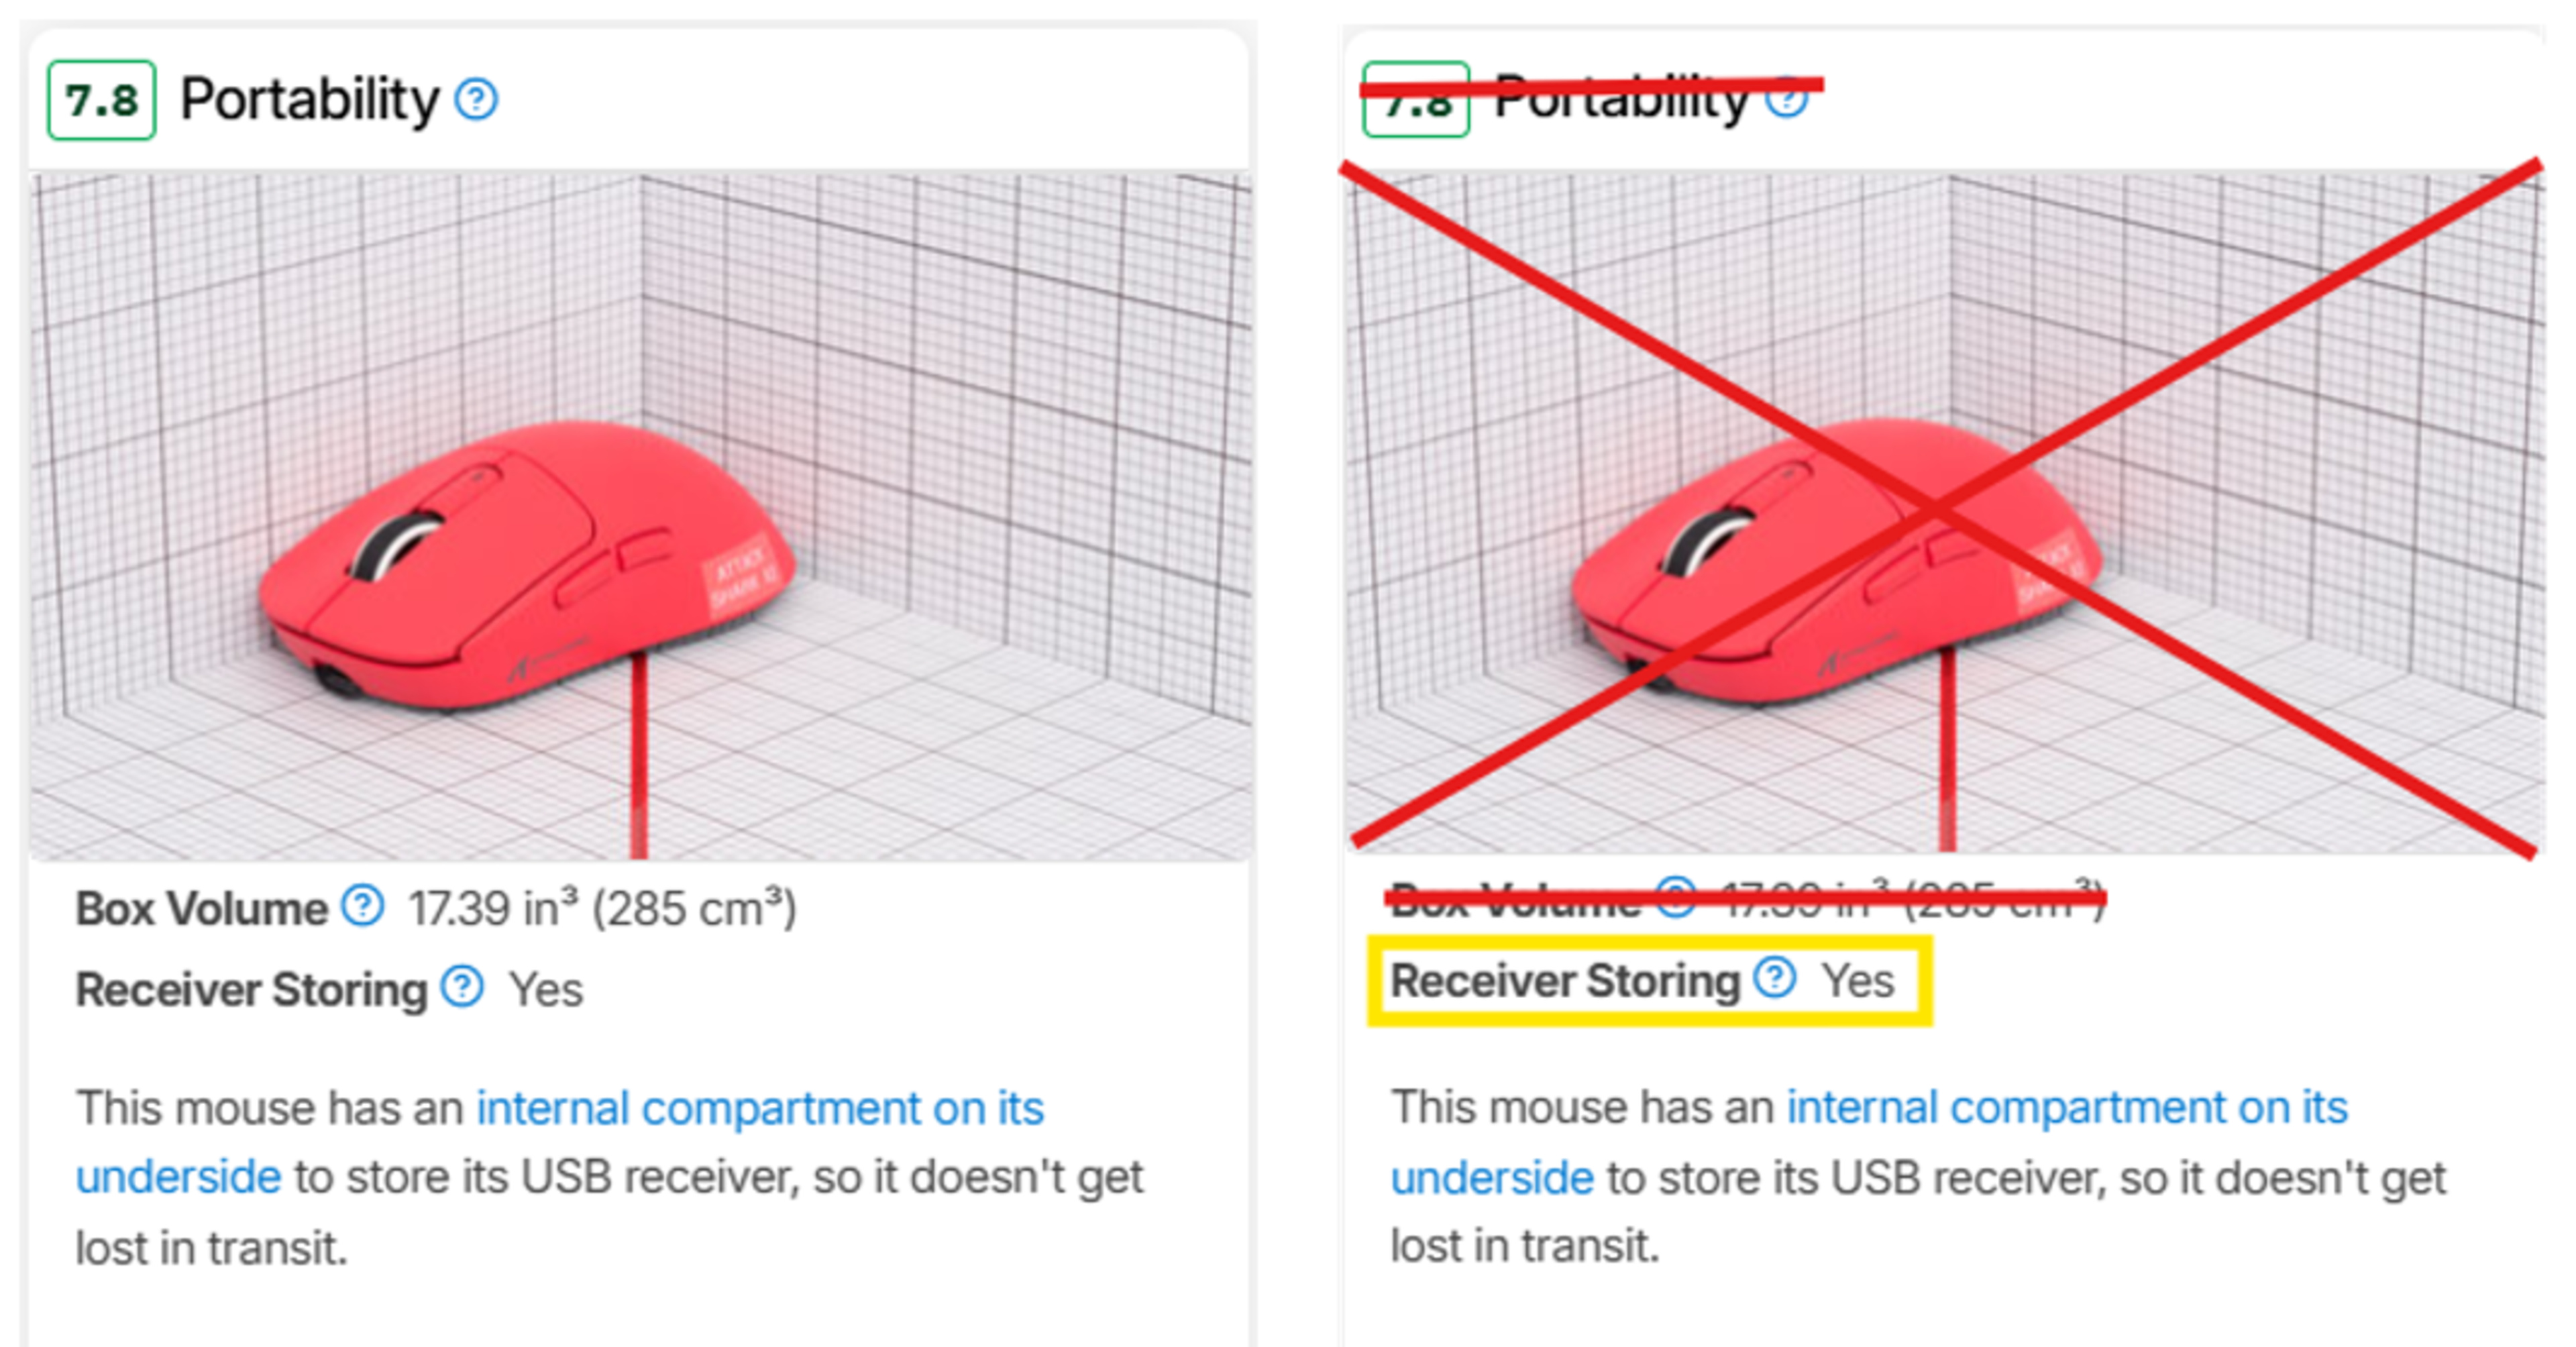
| Portability |
Removed the test group Moved Receiver Storing test to the Wireless Versatility test group |
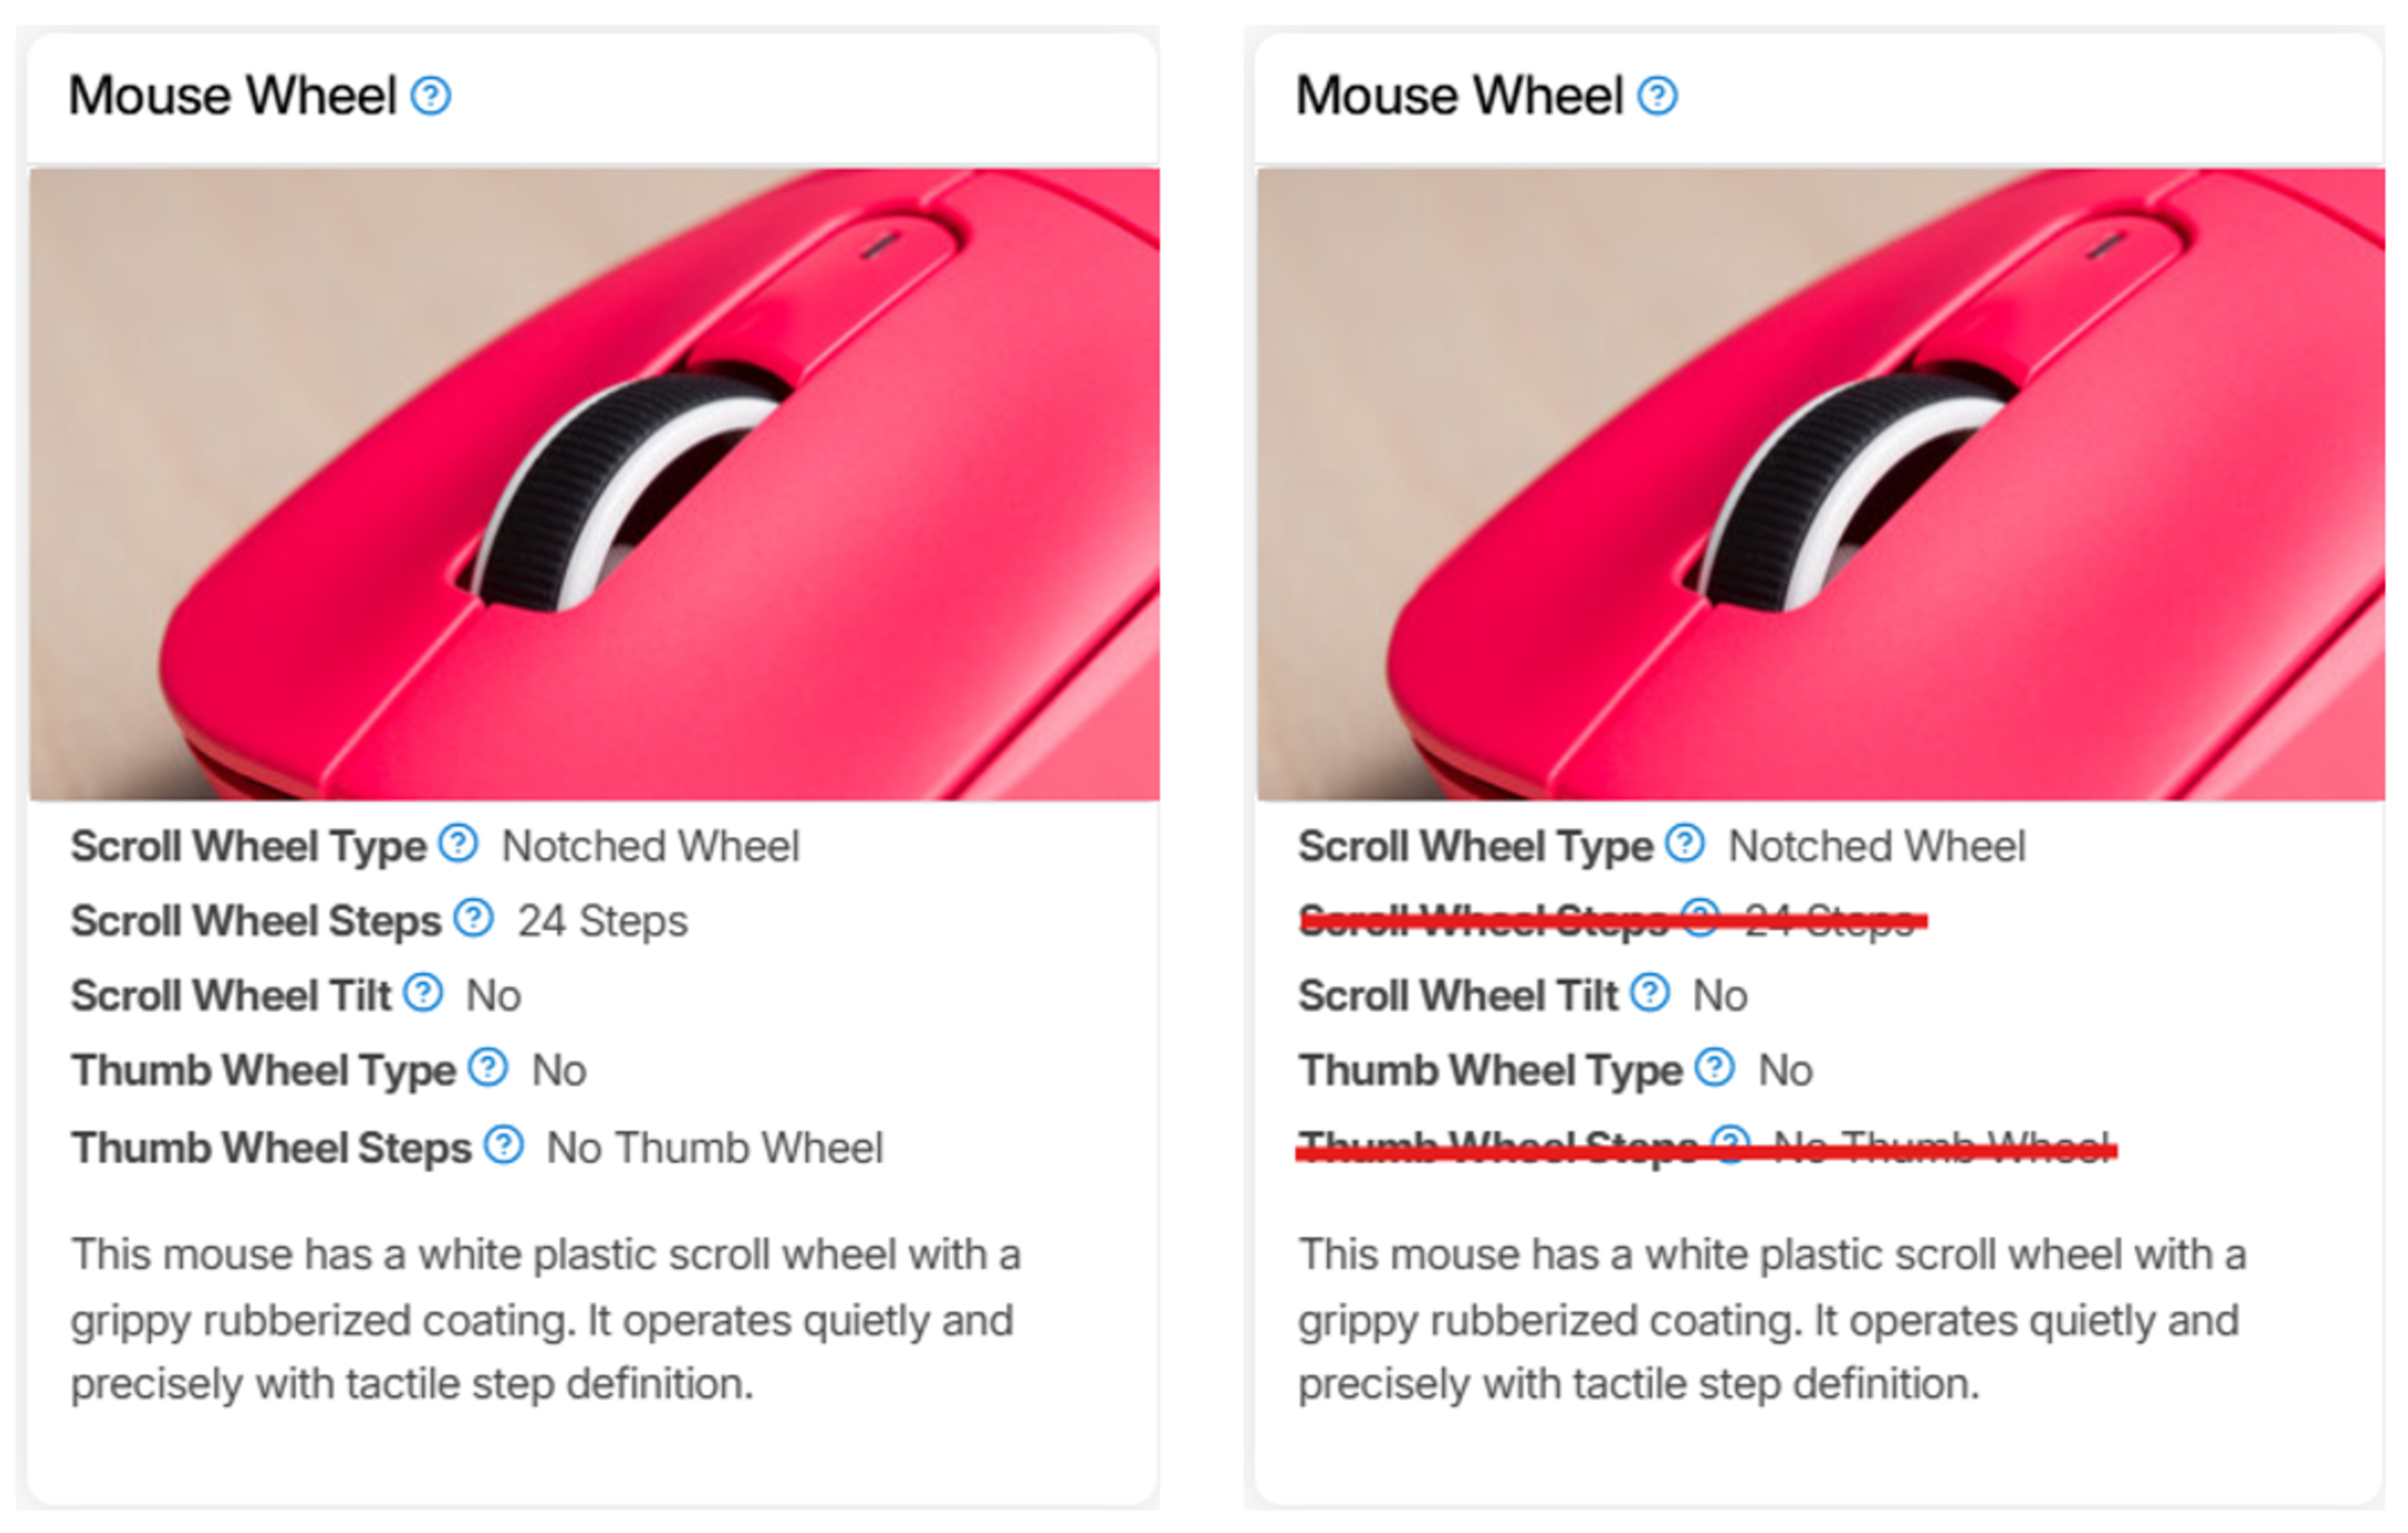
| Scroll Wheel | Removed Scroll Wheel Steps and Thumb Wheel Steps tests |
Sensor Latency
Our initial sensor latency test was highly granular, evaluating behavior at multiple CPI settings. This made sense when sensor quality varied more significantly between products. Over time, however, we began to observe inconsistencies. As pointed out by the community, some mice with identical hardware and reportedly identical firmware produced different results at different CPI settings. These results occasionally contradicted expected behavior based on how these sensors are understood to function.
This raised a broader concern: our test results might suggest meaningful differences in performance or design where none actually exist. While measurable variation still occurs, we're no longer confident these differences reflect anything substantial about sensor implementation or tuning. In some cases, the test risked misleading users by assigning weight to minor fluctuations that aren't noticeable in real-world use or meaningful during gameplay.
As a first step to address this, we've simplified the test by standardizing on a single CPI setting (3200). We chose this value because it's high enough to saturate higher polling rates at our testing speed and avoids the smoothing or interpolation some mice may introduce at much higher CPI levels. Although many users play at 800 or 1600 CPI, we're confident that 3200 provides representative insight into overall sensor behavior.
|
BEFORE  |
AFTER  |
It's also worth clarifying that higher CPI doesn't reduce true sensor latency. While our testing has confirmed that using higher CPI settings can marginally improve the delay to first detectable movement, due to more granular position data, it doesn't make the sensor inherently faster or more responsive in any meaningful way for gameplay.
We're not entirely closed to revisiting our sensor latency testing in the future if we believe it could provide more useful information to the community, but we'll need to assess whether the investment of resources is justified. The current trend we've observed is that highlighting small differences in sensor performance isn't something we want to encourage. Virtually all modern gaming sensors perform extremely well at a casual or competitive level, and other key elements such as shape, build quality, and wireless versatility are examples of parameters that are worth focusing more time on considering when making a buying decision.
Minor Sensor Latency Scoring Changes
With our new testing methodology, the sensor latency score for most mice has either stayed the same or improved slightly. The table below demonstrates these changes.
Sensor latency performance is strong across nearly all modern gaming mice. While our test can still detect small differences, these differences are typically imperceptible in real-world use. A mouse that scores 8.7 and one that scores 9.7 may appear meaningfully different on paper, but in practice, that gap has no tangible impact on performance.
Removal of video elements for Click Latency, Sensor Latency, and CPI Test Groups
We previously included video elements for our Click Latency, Sensor Latency, and CPI tests to illustrate our process and improve transparency. These videos were intended to help users understand how we run tests and to solidify trust that they were performed correctly and consistently.
Based on community feedback and how some users were interpreting the footage, we found that these videos were causing confusion. Many assumed we were measuring full end-to-end (E2E) latency, including system-level delay, and that the visuals were part of our measurement process.
That's not the case. We use a USB protocol analyzer for the Click Latency and Sensor Latency tests, which allows us to isolate device-level latency and exclude system delay. The CPI test doesn't use this tool, but its video was also prone to misinterpretation and didn't add meaningful value, so we've removed it as well, along with the others, to reduce confusion and streamline our review process.
For more information, please refer to our methodology articles for Click Latency, Sensor Latency, and CPI.
Removal of Scoring and video elements for The Cable Test Group
The rationale for removing the cable test video is different. While the video was originally meant to support our text and scoring and visually communicate cable flexibility, it didn't do a good enough job of conveying meaningful differences to justify the added time and complexity during testing. Many modern paracord-like cables now perform similarly in practice, and the visual demonstration often failed to add helpful information. Furthermore, given that many cables now perform very similarly, we've decided to remove the scores from this test group.
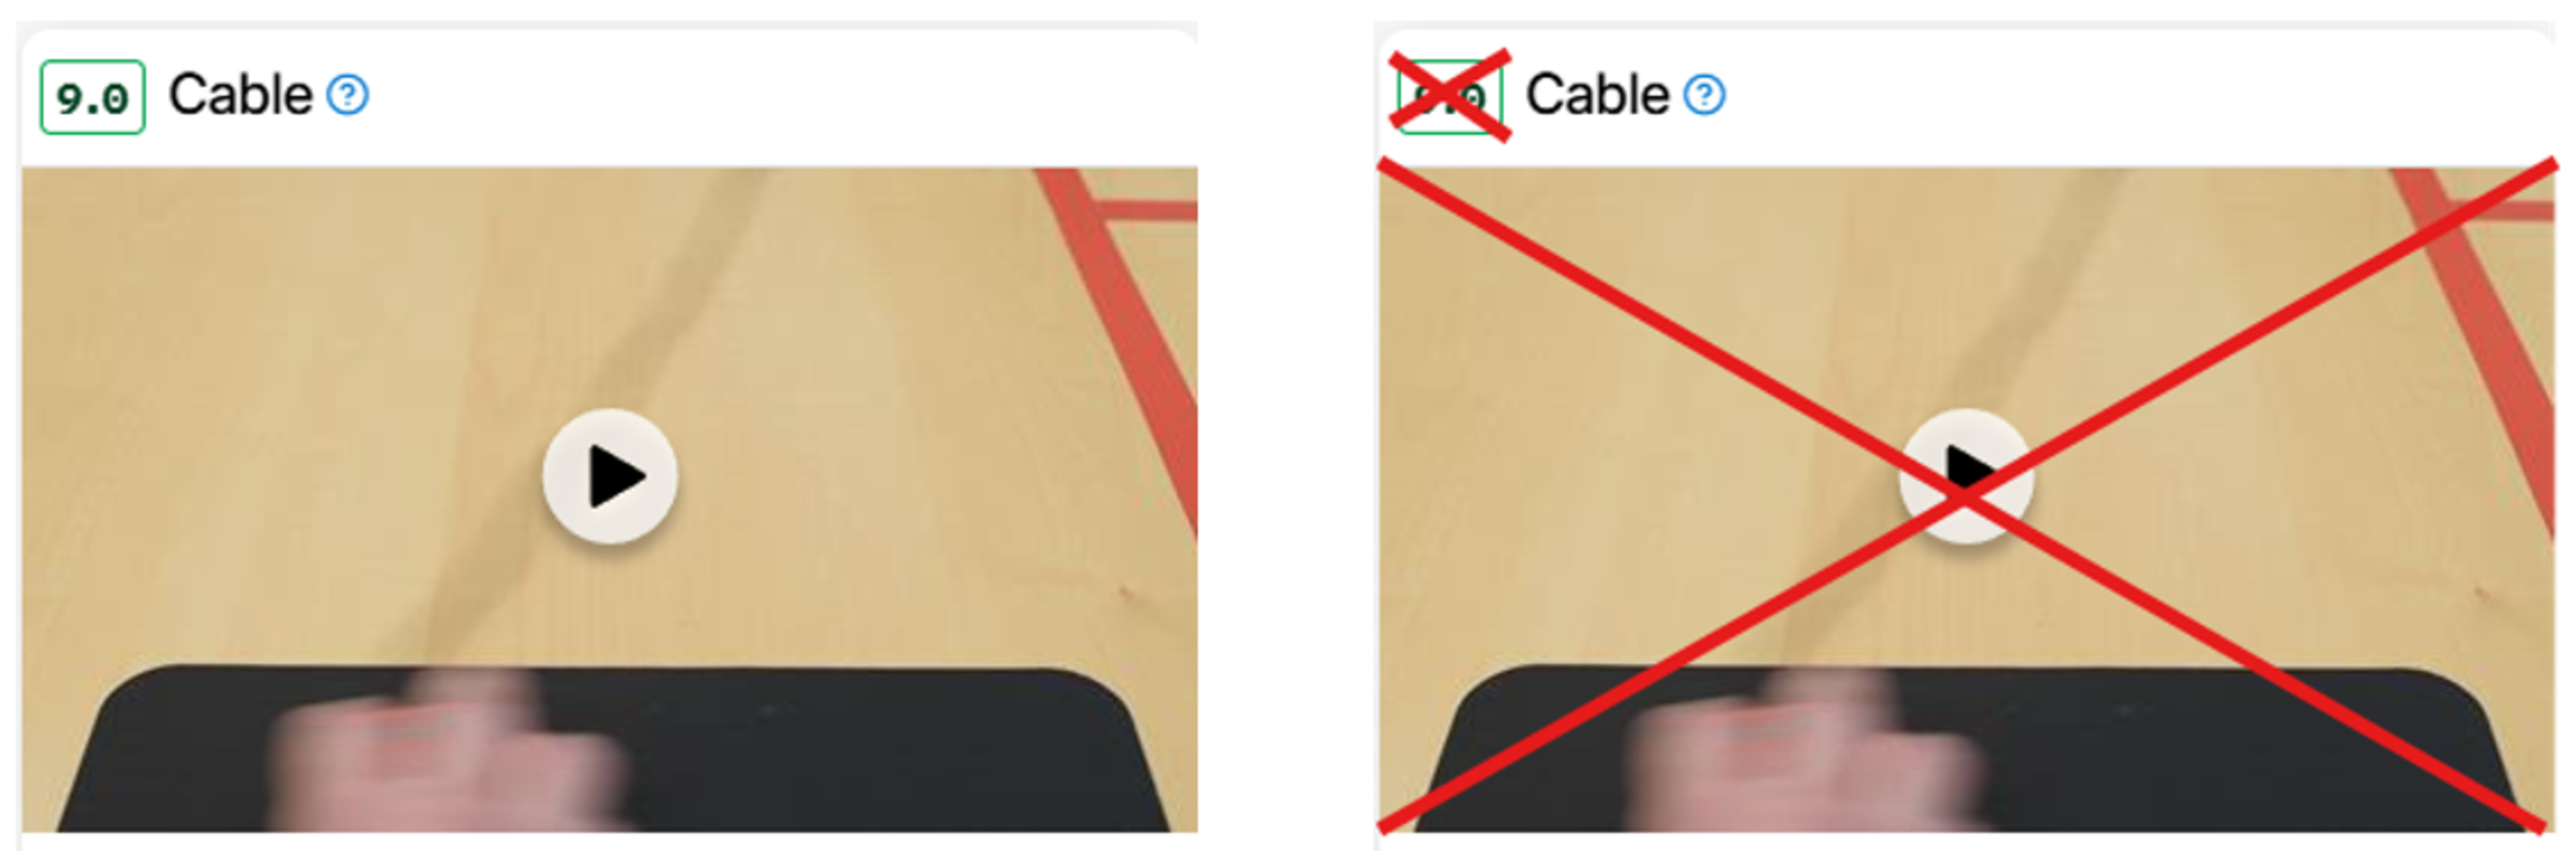
More importantly, the mouse market has increasingly shifted toward wireless models. For most mice, cables now serve primarily for charging, making their flexibility and handling characteristics less relevant for real-world use. We'll continue to comment on cable flexibility, weight, and overall quality in our reviews when they stand out, but we no longer see value in showing them on video or assigning a score.
Removal of THE Portability Test Group
This test group primarily measured box volume, which isn't particularly helpful alongside our existing measurements in the Dimensions test group. This test was scored, but the score was deprecated and no longer contributed to usage score calculations in the Verdict section. We've retained the Receiver Storing test and moved it to the Wireless Versatility section.
Removal of Scroll Wheel Steps and Thumb Wheel Steps from the Mouse Wheel Test Group
Scroll wheel design has standardized in the last several years, so virtually all scroll wheel encoders have 24 steps. It's no longer necessary to include this information.
Let Us Know What You Think
Your feedback is instrumental in improving our testing. If you have comments, questions, or suggestions about this or any future updates, reach out to us below in the comments, on our Discord server, or email us at feedback@rtings.com.
153 Mice Updated
We have retested popular models. The test results for the following models have been converted to the new testing methodology. However, the text might be inconsistent with the new results.
- 3Dconnexion CadMouse Pro Wireless
- Apple Magic Mouse 2
- ASUS ROG Harpe Ace Aim Lab Edition
- ASUS ROG Keris II Ace
- ATTACK SHARK X3
- BenQ ZOWIE EC2-CW
- BenQ ZOWIE EC2-DW
- BenQ ZOWIE U2
- Cooler Master MM720
- Corsair DARK CORE RGB PRO
- Corsair DARKSTAR WIRELESS
- Corsair M65 RGB ULTRA WIRELESS
- Corsair M75 AIR
- Corsair NIGHTSABRE WIRELESS
- Corsair SABRE RGB PRO WIRELESS
- Corsair SCIMITAR ELITE WIRELESS
- Corsair SCIMITAR RGB ELITE
- Endgame Gear OP1 8k
- Endgame Gear OP1we
- Endgame Gear XM1r
- Endgame Gear XM2 8k
- Endgame Gear XM2w 4k
- Endgame Gear XM2we
- Fantech Aria XD7
- Finalmouse Starlight Pro - TenZ Medium
- Finalmouse Starlight-12 Poseidon Small
- Finalmouse Starlight-12 Small
- Finalmouse UltralightX
- Finalmouse UltralightX Competition
- Finalmouse ULX Pro Series
- Fnatic x LAMZU MAYA 8K
- G-Wolves HSK Pro 4K
- GLORIOUS Model D 2
- GLORIOUS Model D 2 Wireless
- GLORIOUS Model D Wireless
- GLORIOUS Model I
- GLORIOUS Model I 2 Wireless
- GLORIOUS Model O
- GLORIOUS Model O 2
- GLORIOUS Model O 2 Wireless
- GLORIOUS Model O PRO
- GLORIOUS Model O Wireless
- GLORIOUS Series One PRO
- Hitscan Hyperlight
- HyperX Pulsefire Haste
- HyperX Pulsefire Haste 2
- HyperX Pulsefire Haste 2 Wireless
- HyperX Pulsefire Haste Wireless
- Kensington SlimBlade Pro Trackball
- Keychron M1 Wireless
- Keychron M3
- Keychron M3 Mini
- Keychron M4
- Keychron M5
- Keychron M6
- Keychron M6 8K
- Keychron M7
- LAMZU Atlantis
- LAMZU Atlantis Mini 4K
- LAMZU Inca
- LAMZU MAYA
- LAMZU MAYA X
- LAMZU THORN
- Logitech ERGO M575
- Logitech G PRO 2 LIGHTSPEED
- Logitech G Pro Wireless
- Logitech G PRO X SUPERLIGHT
- Logitech G PRO X SUPERLIGHT 2
- Logitech G PRO X SUPERLIGHT 2 DEX
- Logitech G203 LIGHTSYNC
- Logitech G303 Shroud Edition
- Logitech G305 LIGHTSPEED
- Logitech G309 LIGHTSPEED
- Logitech G502 HERO
- Logitech G502 LIGHTSPEED
- Logitech G502 X
- Logitech G502 X PLUS
- Logitech G600 MMO Gaming
- Logitech G604 LIGHTSPEED
- Logitech G703 LIGHTSPEED with HERO Sensor
- Logitech G705
- Logitech G903 LIGHTSPEED
- Logitech Lift
- Logitech M340
- Logitech M510
- Logitech M720 Triathlon
- Logitech MX Anywhere 3
- Logitech MX Anywhere 3S
- Logitech MX ERGO
- Logitech MX Master
- Logitech MX Master 2S
- Logitech MX Master 3
- Logitech MX Master 3S
- Logitech MX Vertical
- Logitech Pebble M350
- Logitech Pebble Mouse 2 M350s
- Logitech Signature M650
- MCHOSE L7 Pro
- MCHOSE L7 Ultra
- Microsoft Arc Mouse
- Ninjutso Sora
- Ninjutso Sora V2
- Ploopy Adept Trackball
- Pulsar X2
- Pulsar X2H v3
- Pulsar X2V2
- Pulsar X3
- Pulsar Xlite V2
- Pulsar Xlite V3
- Pwnage StormBreaker
- Pwnage Trinity CF
- Razer Basilisk Ultimate
- Razer Basilisk V3
- Razer Basilisk V3 Pro
- Razer Basilisk V3 Pro 35K
- Razer Basilisk V3 X HyperSpeed
- Razer Basilisk X Hyperspeed
- Razer Cobra
- Razer Cobra Pro
- Razer DeathAdder V2
- Razer DeathAdder V2 Pro
- Razer DeathAdder V3
- Razer DeathAdder V3 HyperSpeed
- Razer DeathAdder V3 Pro
- Razer Naga Pro
- Razer Naga Trinity
- Razer Naga V2 HyperSpeed
- Razer Naga V2 Pro
- Razer Orochi V2
- Razer Pro Click Mini
- Razer Pro Click V2 Vertical
- Razer Viper 8KHz
- Razer Viper Mini
- Razer Viper Mini Signature Edition
- Razer Viper Ultimate
- Razer Viper V2 Pro
- Razer Viper V3 HyperSpeed
- Razer Viper V3 Pro
- ROCCAT Kone Pro
- Scyrox V6
- Scyrox V8
- SteelSeries Aerox 5 Wireless
- SteelSeries Aerox 9 Wireless
- Vaxee XE
- Vaxee XE Wireless
- Vaxee XE-S Wireless (4K)
- Vaxee ZYGEN NP-01S Wireless (4K)
- VGN Dragonfly F1 Pro Max
- VXE R1 Pro
- WLmouse Beast X
- WLmouse Beast X Max
- WLmouse Strider
- Zaunkoenig M2K